Exhibit 99.2

Exhibit 99.2
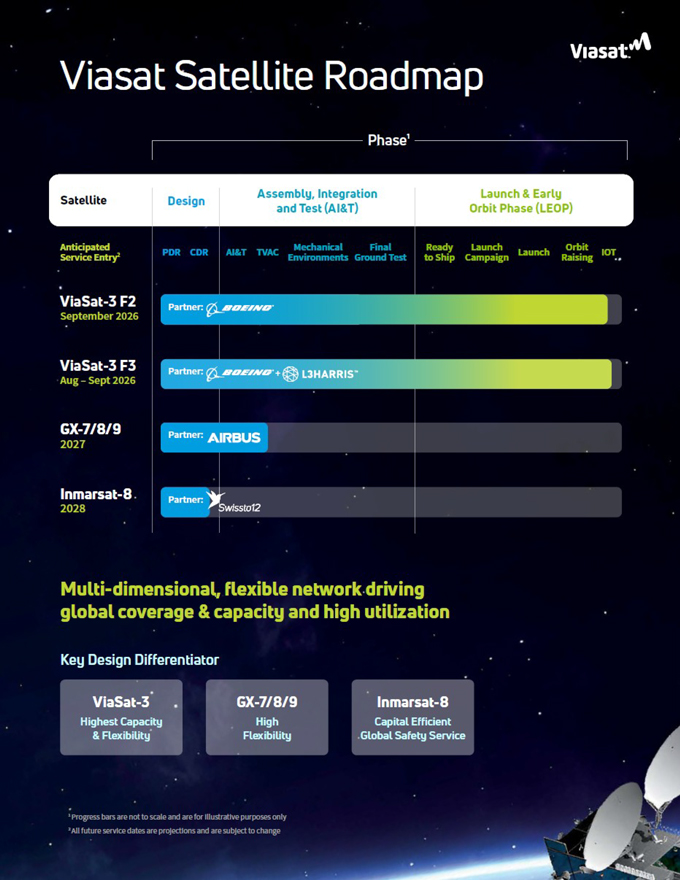
Fellow Shareholders,The first quarter of fiscal year 2027 was marked by disciplined execution, operational progress – including on the ViaSat-3 (VS-3) satellites – and strong awards in growing business areas that reinforce our confidence in targeting new markets, our competitive positions, and our ongoing growth prospects. For Q1 FY2027, we reported a net loss1 of $52 million, which is an improvement from a net loss of $56 million in Q1 FY2026. Improvement was primarily due to reduced interest expense reflecting continued progress in reducing debt and deleveraging, partially offset by an increased provision for income taxes. Q1 FY2027 revenue declined 1% year-over- year (YoY) reflecting a 4% decrease in the Defense and Advanced Technology (DAT) segment, while the Communications Services segment remained flat YoY. Adjusted EBITDA2 in Q1 FY2027 decreased by 7% YoY net of attractive growth in aviation, government satcom, and tactical networking, which was offset by an expected decline in our fixed broadband business, an expected decline in certain IP licensing and royalty-based revenue, increased research and development expenses, and the effect of the sale of our equity investment in Navarino in a prior period. We generated $72 million in Free Cash Flow3 excluding non-recurring items, and achieved record backlog and awards in the Defense and Advanced Technology segment with 32% and 22% YoY growth, respectively. Company-wide, new contract awards in Q1 FY2027 increased 10% YoY, which contributed to an increase in backlog of 19% compared to prior year. Most notably, we secured the next phase of the Protected Tactical SATCOM-Global (PTS-G) program which we believe is indicative of the importance of innovation in the geosynchronous orbit component of a resilient, multi-orbit, multi-band national security space posture. Overall, we believe our Q1 FY2027 results are consistent with our fiscal year 2027 outlook including a stronger second-half supported by substantial backlog, very attractive new awards in key portions of our DAT and government satcom portfolios, our largest ever government new business pipeline, and our ongoing deployment of new broadband satellite resources and technologies. We aim to accelerate momentum in our DAT portfolio, take actions that further improve our competitive position in the existing and emerging L-band Mobile Satellite Services (MSS) markets, and refine and reinforce our competitive position in broadband satellite services – especially regarding resilience, reliability, and performance in the most challenging commercial and government mobility environments. We entered the fiscal year focused on three priorities: drive growth by identifying and capturing new contract awards in attractive applications and market segments within our dual-use technology and services portfolios and new business pipeline; leveraging technology that simultaneously improves reliability, resilience, and airtime costs in broadband and MSS bands; and driving operational and business model improvements that continue to reduce capital intensity – including via ongoing AI/ML (Artificial Intelligence/Machine Learning) network optimizations. We are seeing both near-term and longer-term benefits from those initiatives. An over-arching theme is the growing convergence of our DAT technology base in communications, cybersecurity, networking, and data analytics, with proliferated, resilient dual-use space infrastructure to improve mission specific outcomes. National security initiatives are focused on rapid adoption of new approaches to enhance integrated mission outcomes beyond just standalone products. We believe Viasat is uniquely positioned to compete in a number of important application areas.There is a lot of attention on the MSS bands because of their potential for consumer D2D (Direct-to-Device) enabled by the integration of 3GPP standards for satellite NTN (Non-Terrestrial Network) capability into terrestrial mobile infrastructure and end user devices. As a leading competitor in the existing MSS markets such as mobile voice, aeronautical and maritime safety, and converged space/terrestrial IoT applications, we also see opportunities to capture growth in those enterprise and national security applications, beyond just the consumer markets. We anticipate that the introduction of AI-driven autonomy in land, sea and air platforms will be a growth catalyst. We continue to believe that our leading role in serving the critical safety services, combined with our ability to reliably and quickly evolve that user base to next generation space network resources and capabilities, our globally coordinated spectrum and market access licenses that support our critical enterprise and national security missions, our approaches to highly efficient spectrum utilization, and the application of proven shared infrastructure technology and business models, will help us compete effectively in a broad range of MSS applications as well as capture our share of the D2D market. As governments, enterprises, and consumers increasingly seek integrated and resilient solutions, we believe our differentiated capabilities position us well to address some of the world’s most complex connectivity and mission challenges Executing with Discipline Our teams also delivered solid operational performance during the first quarter, maintaining financial discipline while achieving our Adjusted EBITDA objectives despite ongoing headwinds in portions of our portfolio. We maintained a strong focus on cost discipline, operational productivity, and cash flow generation while continuing to invest selectively in strategic growth initiatives. We understand that some segments of the market are clearly going to be more competitive than in the past. We believe we can be a healthy competitor, leveraging new VS-3 technologies and the learning curves they enable, along with multi-band, multi-orbit integration. Rapid evolutions in payload, system, and mission technology are creating very substantial additional new technology and services market opportunities, especially for companies that can integrate across commercial and national security applications, and can invent and scale new technologies. We are beginning to see evidence of the opportunities for Viasat in those areas, and see growth in DAT awards, in particular, as leading indicators building further confidence in that approach. Building the Next Generation of Connectivity We successfully completed all deployments and the satellite bus In-Orbit Test (IOT) phase on VS-3 F2 and anticipate its service entry by September 2026. Subsequent to quarter end, we successfully completed reflector assembly deployments on VS-3 F3 and entered the IOT phase ahead of expected service entry over the Asia-Pacific (APAC) region in late August or early September 2026. Successful deployments for VS-3 F2 and F3 are important for ongoing communications services businesses, but also for the unique technology and functional capabilities they bring especially in geographic coverage flexibility and resilience. We believe validation of the underlying technologies will contribute to near-term growth in DAT, including in new multi-orbit space systems that leverage those technologies. The continued integration of multi-orbit capabilities and development of next-generation terminals and network architectures are all designed to reduce airtime bandwidth costs, increase network flexibility and resilience, while further decreasing the proportion of those costs associated with launch. These capabilities allow us to place capacity where and when it is needed, improve capacity utilization, improve customer experience, and support attractive returns on invested capital while remaining highly competitive in our target markets. In maritime, NexusWave continues to demonstrate customer interest and acceptance of effective multi-orbit solutions. In aviation, we remain focused on using our latest satellites to enhance customer experience and improve service reliability, and advancing our next-generation connectivity roadmap. We Shareholder Letter | Q1 Fiscal Year 2027 1
continue to work closely with airline partners as the market more closely integrates and personalizes the entire onboard experience across connectivity and passenger entertainment and engagement Expanding Strategic Opportunities From a longer term perspective, we see increasing convergence in dual-use commercial and national security uses of space. Some key indicators include: Increased targeting of civil and commercial infrastructure of all types – telecom, navigation and timing, energy, and compute – even in the earliest stages of geo-political conflict. That requires increased resilience and adaptability – for all forms of satellite communication. Rapidly increasing physical occupancy of space (that is the rapidly growing number, mass, and size of LEO satellites) driving new resilience needs for critical national security missions. The rapid pace of new technology introduction in geo-political conflict – putting a premium not just on new technology, but also on the ability to integrate those new technologies into operations and mission success. We believe Viasat is exceptionally well positioned to capture certain of these opportunities through our unique combination of space and ground network technologies, resilient terrestrial radio and multi-media networking, link and network security and cyber defense, and mission and operational expertise. The value of our new business pipeline, especially in DAT and government satcom, is larger than ever. While DAT will often be the first place where growth in those areas will be manifested, we see good potential for ongoing conversions to both government and commercial satellite services. Our DAT contracts and pipeline include operational demonstration phases indicative of those recurring services revenues, and this quarter also highlights good growth in recurring government satcom services revenue. More of our solutions combine multi-orbit orchestration, close integration with specific mission systems, data analytics, and dual-use infrastructure to augment and enhance MILSATCOM systems. The mission systems aspect leverages our extensive experience with our diversified customer base, and helps drive both technology and recurring service revenue. Leveraging dual use both significantly benefits our customers and is expected to benefit our focus on improving return on invested capital. We continue to invest prudently in emerging opportunities including direct-to-device communications, next-generation mobility services, network orchestration, cyber solutions, and advanced space architectures. These investments reflect our commitment to innovation and customer mission success. Positioned for the Future Throughout our 40+ year history, we have successfully navigated industry transitions by investing early in the right technologies that address evolving customer needs. Today is no different. The convergence of communications, networking, cybersecurity, data, and space infrastructure is reshaping global markets, creating opportunities for companies with the scale, expertise, and vision to deliver integrated solutions. We believe Viasat is uniquely positioned to help customers navigate this transformation. We are anticipating and seeing evolution in our portfolio of government and commercial technologies and recurring services businesses. While we see the effects of greater competition in our “legacy” commercial services – we are also seeing growth in emerging segments of dual use, multi-orbit, and multi-band driven by underlying new technologies. We believe the net effect indicates overall good growth opportunities. DAT awards and government communications services serve as leading indicators, and we expect these trends to become increasingly clear throughout the remainder of this fiscal year. We believe we can evolve while continuing to manage our business to generate cash and strengthening the balance sheet, as well as reducing capital intensity and investing prudently in underlying new technologies. Looking Ahead The combination of growth in the space market, and our business and technical progress is creating more opportunity for us than ever – as reflected in our new business pipeline. The VS-3 deployments along with a number of other important space and ground technology accomplishments and competitive wins is building momentum in new markets and critical applications. Demand for resilient communications, secure networks, mission-critical connectivity, and space-enabled capabilities is clearly growing in both commercial and defense markets worldwide.Viasat has never been defined by a single technology cycle, satellite launch, or market trend. Our history has been built on continued innovation, reinvention, resilience, and the ability to adapt to changing customer needs. While the path forward will not be without challenges, we believe the foundation we have built and the opportunities ahead will deliver sustained success. We enter the remainder of fiscal year 2027 with confidence in our strategy, momentum across key growth initiatives, and a clear focus on creating long-term shareholder value. Sincerely, Mark Dankberg Shareholder Letter | Q1 Fiscal Year 2027 2
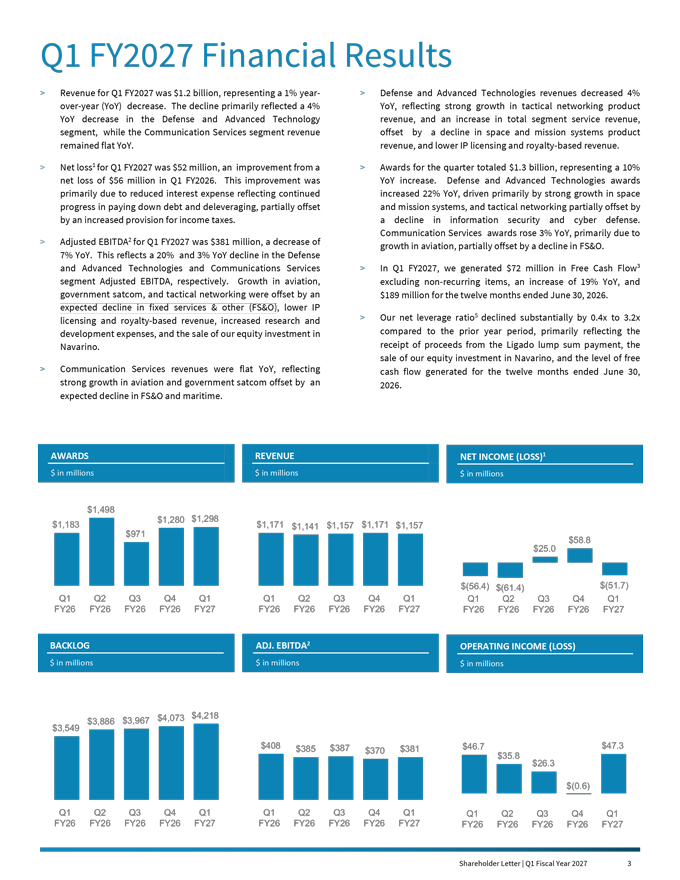
Shareholder Letter | Q1 Fiscal Year 2027 2 Q1 FY2027 Financial Results • Revenue for Q1 FY2027 was $1.2 billion, representing a 1% year- over-year (YoY) decrease. The decline primarily reflected a 4% YoY decrease in the Defense and Advanced Technology segment, while the Communication Services segment revenue remained flat YoY. • Net loss1 for Q1 FY2027 was $52 million, an improvement from a net loss of $56 million in Q1 FY2026. This improvement was primarily due to reduced interest expense reflecting continued progress in paying down debt and deleveraging, partially offset by an increased provision for income taxes. • Adjusted EBITDA2 for Q1 FY2027 was $381 million, a decrease of 7% YoY. This reflects a 20% and 3% YoY decline in the Defense and Advanced Technologies and Communications Services segment Adjusted EBITDA, respectively. Growth in aviation, government satcom, and tactical networking were offset by an expected decline in fixed services & other (FS&O), lower IP licensing and royalty-based revenue, increased research and development expenses, and the sale of our equity investment in Navarino. • Communication Services revenues were flat YoY, reflecting strong growth in aviation and government satcom offset by an expected decline in FS&O and maritime. • Defense and Advanced Technologies revenues decreased 4% YoY, reflecting strong growth in tactical networking product revenue, and an increase in total segment service revenue, offset by a decline in space and mission systems product revenue, and lower IP licensing and royalty-based revenue. • Awards for the quarter totaled $1.3 billion, representing a 10% YoY increase. Defense and Advanced Technologies awards increased 22% YoY, driven primarily by strong growth in space and mission systems, and tactical networking partially offset by a decline in information security and cyber defense. Communication Services awards rose 3% YoY, primarily due to growth in aviation, partially offset by a decline in FS&O. • In Q1 FY2027, we generated $72 million in Free Cash Flow3 excluding non-recurring items, an increase of 19% YoY, and $189 million for the twelve months ended June 30, 2026. • Our net leverage ratio5 declined substantially by 0.4x to 3.2x compared to the prior year period, primarily reflecting the receipt of proceeds from the Ligado lump sum payment, the sale of our equity investment in Navarino, and the level of free cash flow generated for the twelve months ended June 30, 2026. AWARDS REVENUE NETINCOME(LOSS)1 $inmillions $inmillions $inmillions $1,498 $1,280 $1,298 $1,183 $1,171 $1,141 $1,157 $1,171 $1,157 $971 $25.0 $58.8 $(56.4) $(61.4) $(51.7) Q1 Q2 Q3 Q4 Q1 Q1 Q2 Q3 Q4 Q1 Q1 Q2 Q3 Q4 Q1 FY26 FY26 FY26 FY26 FY27 FY26 FY26 FY26 FY26 FY27 FY26 FY26 FY26 FY26 FY27 BACKLOG ADJ.EBITDA2 OPERATINGINCOME(LOSS) $inmillions $inmillions $inmillions $4,073 $4,218 $3,549 $3,886 $3,967 $408 $385 $387 $381 $46.7 $47.3 $370 $35.8 $26.3 $(0.6) Q1 Q2 Q3 Q4 Q1 Q1 Q2 Q3 Q4 Q1 Q1 Q2 Q3 Q4 Q1 FY26 FY26 FY26 FY26 FY27 FY26 FY26 FY26 FY26 FY27 FY26 FY26 FY26 FY26 FY27
$754
$774
$827
$825
$322
$311
Communication Services
segment
provides a wide range of broadband and narrowband communications solutions across government and commercial mobility, maritime, fixed broadband (residential), energy and enterprise customers
Communication Services
Segment Highlights
> Successfully completed all deployments on VS-3 F2 as well as the Bus IOT phase.
> Selected by Lockheed Martin to support the National Oceanic and Atmospheric Administration’s (NOAA) next-generation aircraft with a hybrid satellite communications platform. The line-fit integration of the Viasat Hybrid SATCOM Approach for the C-130J presents opportunity to expand high-capacity, resilient connectivity across multi-mission airlift
operations. Under the agreement, Viasat’s government satcom team will support Lockheed Martin’s delivery of two specially modified C-130J aircraft, with prime contract options for additional
aircraft.
> Subsequent to quarter end, announced an agreement with Hapag-Lloyd to deploy NexusWave across its global fleet, following successful onboard trials of the
fully managed, bonded connectivity service. Hapag-Lloyd sought a future-proof connectivity platform capable of supporting increasingly data-driven operations, enhanced crew welfare, and the seamless integration of business-critical applications
across its fleet. NexusWave will provide Hapag-Lloyd with high-speed fully managed, secure-by-design connectivity that intelligently bonds
Ka-band, LEO, LTE and L-band
Awards Revenue Adj. EBITDA
Q1 FY26 Q1 FY27
$293 $324
networks
supporting real-time collaboration, remote IT management, data-intensive applications, and enhanced vessel performance monitoring across the fleet. The agreement also includes Inmarsat’s Premium Care Programme, providing round-the-clock technical assistance and access to maintenance and warranty services across more than 80 ports worldwide.
> Subsequent to quarter end, successfully completed reflector and boom deployment on VS-3 F3, our ultra-high-capacity satellite which has entered
the IOT phase ahead of expected service entry over the APAC region.
Awards
Q1 FY2027
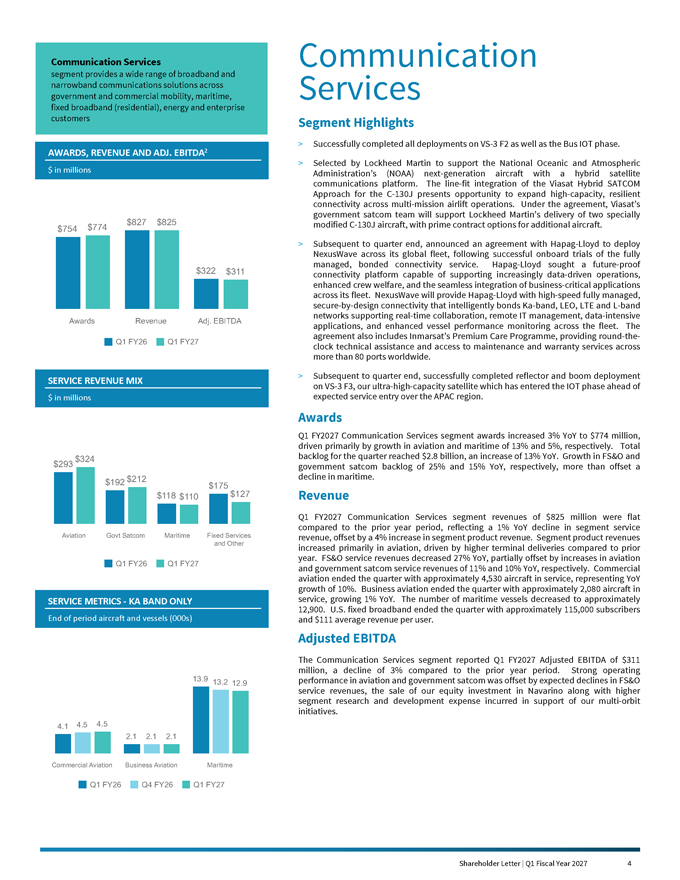
Communication Services segment awards increased 3% YoY to $774 million, driven primarily by growth in aviation and maritime of 13% and 5%, respectively. Total backlog for the quarter reached $2.8 billion, an increase of 13% YoY. Growth in
FS&O and government satcom backlog of 25% and 15% YoY, respectively, more than offset a
$192 $212
$175
$118 $110 $127
decline in
maritime.
Revenue
Q1 FY2027 Communication Services segment revenues of $825 million were
flat compared to the prior year period, reflecting a 1% YoY decline in segment service
Aviation Govt Satcom Maritime Fixed Services
and Other
Q1 FY26 Q1 FY27
13.9 13.2
12.9
revenue, offset by a 4% increase in segment product revenue. Segment product revenues increased primarily in aviation, driven by higher terminal deliveries compared to
prior year. FS&O service revenues decreased 27% YoY, partially offset by increases in aviation and government satcom service revenues of 11% and 10% YoY, respectively. Commercial aviation ended the quarter with approximately 4,530 aircraft in
service, representing YoY growth of 10%. Business aviation ended the quarter with approximately 2,080 aircraft in service, growing 1% YoY. The number of maritime vessels decreased to approximately 12,900. U.S. fixed broadband ended the quarter with
approximately 115,000 subscribers and $111 average revenue per user.
Adjusted EBITDA
The
Communication Services segment reported Q1 FY2027 Adjusted EBITDA of $311 million, a decline of 3% compared to the prior year period. Strong operating performance in aviation and government satcom was offset by expected declines in FS&O
service revenues, the sale of our equity investment in Navarino along with higher segment research and development expense incurred in support of our multi-orbit initiatives.
4.1
4.5
4.5
2.1
2.1
2.1
Commercial Aviation Business Aviation Maritime
Q1 FY26 Q4 FY26 Q1 FY27
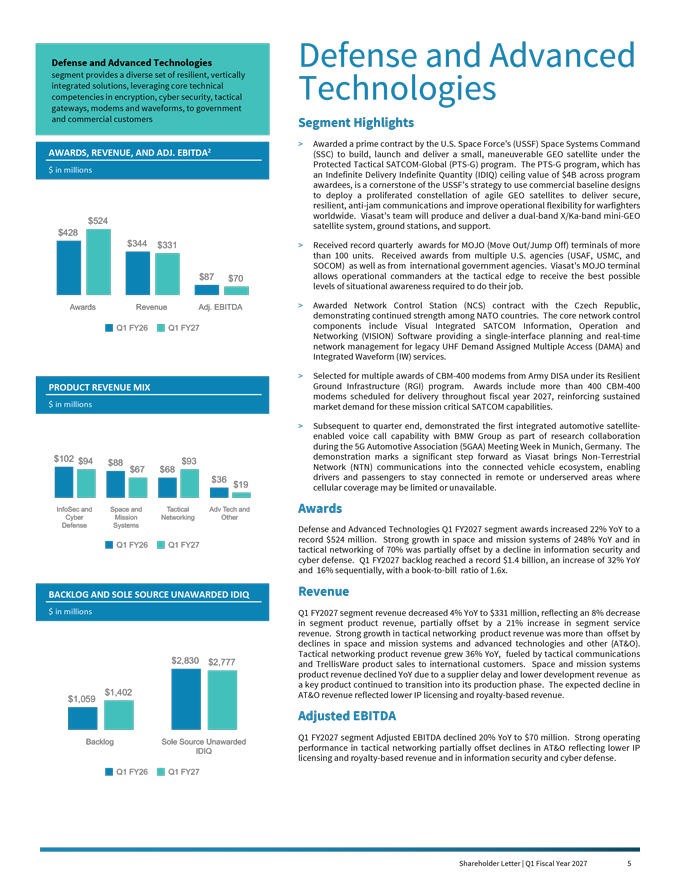
Shareholder Letter | Q1 Fiscal Year 2027 4 Defense and Advanced Technologies segment provides a diverse set of resilient, vertically integrated solutions, leveraging core technical competencies in encryption, cyber security, tactical gateways, modems and waveforms, to government and commercial customers AWARDS,REVENUE,ANDADJ.EBITDA2 $inmillions $524 $428 $344 $331 $87 $70 Awards Revenue Adj. EBITDA Q1 FY26 Q1 FY27 PRODUCTREVENUEMIX $inmillions $102 $94 $93 $88 $67 $68 $36 $19 InfoSec and Space and Tactical Adv Tech and Cyber Mission Networking Other Defense Systems Q1 FY26 Q1 FY27 BACKLOGANDSOLESOURCEUNAWARDEDIDIQ Defense and Advanced Technologies Segment Highlights • Awarded a prime contract by the U.S. Space Force’s (USSF) Space Systems Command (SSC) to build, launch and deliver a small, maneuverable GEO satellite under the Protected Tactical SATCOM-Global (PTS-G) program. The PTS-G program, which has an Indefinite Delivery Indefinite Quantity (IDIQ) ceiling value of $4B across program awardees, is a cornerstone of the USSF’s strategy to use commercial baseline designs to deploy a proliferated constellation of agile GEO satellites to deliver secure, resilient, anti-jam communications and improve operational flexibility for warfighters worldwide. Viasat’s team will produce and deliver a dual-band X/Ka-band mini-GEO satellite system, ground stations, and support. • Received record quarterly awards for MOJO (Move Out/Jump Off) terminals of more than 100 units. Received awards from multiple U.S. agencies (USAF, USMC, and SOCOM) as well as from international government agencies. Viasat’s MOJO terminal allows operational commanders at the tactical edge to receive the best possible levels of situational awareness required to do their job. • Awarded Network Control Station (NCS) contract with the Czech Republic, demonstrating continued strength among NATO countries. The core network control components include Visual Integrated SATCOM Information, Operation and Networking (VISION) Software providing a single-interface planning and real-time network management for legacy UHF Demand Assigned Multiple Access (DAMA) and Integrated Waveform (IW) services. • Selected for multiple awards of CBM-400 modems from Army DISA under its Resilient Ground Infrastructure (RGI) program. Awards include more than 400 CBM-400 modems scheduled for delivery throughout fiscal year 2027, reinforcing sustained market demand for these mission critical SATCOM capabilities. • Subsequent to quarter end, demonstrated the first integrated automotive satellite- enabled voice call capability with BMW Group as part of research collaboration during the 5G Automotive Association (5GAA) Meeting Week in Munich, Germany. The demonstration marks a significant step forward as Viasat brings Non-Terrestrial Network (NTN) communications into the connected vehicle ecosystem, enabling drivers and passengers to stay connected in remote or underserved areas where cellular coverage may be limited or unavailable. Awards Defense and Advanced Technologies Q1 FY2027 segment awards increased 22% YoY to a record $524 million. Strong growth in space and mission systems of 248% YoY and in tactical networking of 70% was partially offset by a decline in information security and cyber defense. Q1 FY2027 backlog reached a record $1.4 billion, an increase of 32% YoY and 16% sequentially, with a book-to-bill ratio of 1.6x. Revenue $inmillions Q1 FY2027 segment revenue decreased 4% YoY to $331 million, reflecting an 8% decrease in segment product revenue, partially offset by a 21% increase in segment service revenue. Strong growth in tactical networking product revenue was more than offset by declines in space and mission systems and advanced technologies and other (AT&O). Tactical networking product revenue grew 36% YoY, fueled by tactical communications $2,830 $2,777 and TrellisWare product sales to international customers. Space and mission systems product revenue declined YoY due to a supplier delay and lower development revenue as $1,402 a key product continued to transition into its production phase. The expected decline in AT&O revenue reflected lower IP licensing and royalty-based revenue. $1,059 Adjusted EBITDA Q1 FY2027 segment Adjusted EBITDA declined 20% YoY to $70 million. Strong operating Backlog Sole Source Unawarded IDIQ performance in tactical networking partially offset declines in AT&O reflecting lower IP licensing and royalty-based revenue and in information security and cyber defense. Q1 FY26 Q1 FY27
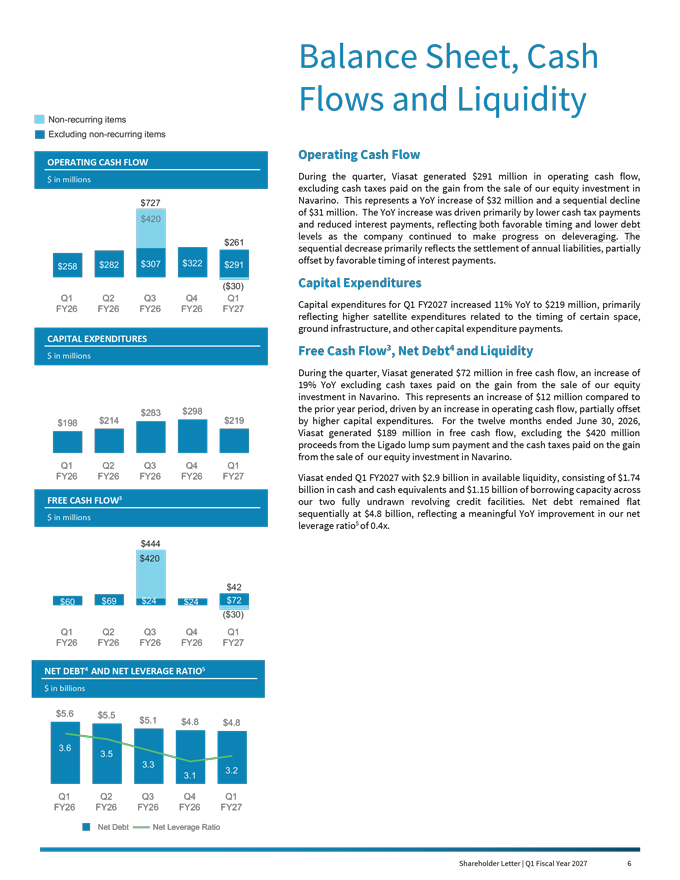
Shareholder Letter | Q1 Fiscal Year 2027 5 Balance Sheet, Cash Flows and Liquidity Non-recurring items Excluding non-recurring items Operating Cash Flow OPERATINGCASHFLOW $inmillions During the quarter, Viasat generated $291 million in operating cash flow, excluding cash taxes paid on the gain from the sale of our equity investment in $727 Navarino. This represents a YoY increase of $32 million and a sequential decline of $31 million. The YoY increase was driven primarily by lower cash tax payments $420 and reduced interest payments, reflecting both favorable timing and lower debt levels as the company continued to make progress on deleveraging. The $261 sequential decrease primarily reflects the settlement of annual liabilities, partially $307 $322 offset by favorable timing of interest payments. $258 $282 $291 ($30) Capital Expenditures Q1 Q2 Q3 Q4 Q1 Capital expenditures for Q1 FY2027 increased 11% YoY to $219 million, primarily FY26 FY26 FY26 FY26 FY27 reflecting higher satellite expenditures related to the timing of certain space, ground infrastructure, and other capital expenditure payments. CAPITALEXPENDITURES Free Cash Flow3, Net Debt4 and Liquidity $inmillions During the quarter, Viasat generated $72 million in free cash flow, an increase of 19% YoY excluding cash taxes paid on the gain from the sale of our equity investment in Navarino. This represents an increase of $12 million compared to $283 $298 the prior year period, driven by an increase in operating cash flow, partially offset $198 $214 $219 by higher capital expenditures. For the twelve months ended June 30, 2026, Viasat generated $189 million in free cash flow, excluding the $420 million proceeds from the Ligado lump sum payment and the cash taxes paid on the gain from the sale of our equity investment in Navarino. Q1 Q2 Q3 Q4 Q1 FY26 FY26 FY26 FY26 FY27 Viasat ended Q1 FY2027 with $2.9 billion in available liquidity, consisting of $1.74 billion in cash and cash equivalents and $1.15 billion of borrowing capacity across FREECASHFLOW3 our two fully undrawn revolving credit facilities. Net debt remained flat $inmillions sequentially at $4.8 billion, reflecting a meaningful YoY improvement in our net leverage ratio5 of 0.4x. $444 $420 $42 $60 $69 $24 $24 $72 ($30) Q1 Q2 Q3 Q4 Q1 FY26 FY26 FY26 FY26 FY27 NETDEBT4ANDNETLEVERAGERATIO5 $inbillions $5.6 $5.5 $5.1 $4.8 $4.8 3.6 3.5 3.3 3.2 3.1 Q1 Q2 Q3 Q4 Q1 FY26 FY26 FY26 FY26 FY27 Net Debt Net Leverage Ratio Shareholder Letter | Q1 Fiscal Year 2027 6

Outlook The opportunities before us have never been greater – as reflected in the value of our new business pipeline and our recent success in targeting technology and service opportunities. Around the world, governments and enterprises are investing in resilient communications, secure networks, cyber capabilities, and space infrastructure that will define the next generation of connectivity and mission success. We believe Viasat is uniquely positioned to help shape that future through a combination of technological innovation, trusted customer relationships, and a growing portfolio of differentiated capabilities. Our growing backlog, strong awards performance, expanding opportunities in space and cybersecurity, and continued focus on operational excellence provide a solid foundation for sustainable long-term growth. We recognize that a portion of the growth in certain areas will likely be offset, to some extent, by increased competitive dynamics in other parts of our portfolio. Nevertheless, we believe fiscal year 2027 will demonstrate, and in fact is already demonstrating, that we have good opportunities to leverage our technology strengths, our MSS spectrum position and business portfolio, and our decades of enduring customer relationships to clearly establish our overall growth momentum. Revenue and Adjusted EBITDA: We continue to expect mid-single-digit YoY revenue growth in FY2027 and Adjusted EBITDA to be flat to up slightly YoY, with stronger growth in second half of the fiscal year supported by our backlog, new orders, and ongoing pipeline. Communication Services Segment: We expect FY2027 segment revenue growth in the low single-digits YoY, driven by continued growth in aviation services, offset by a lower rate of decline in FS&O. Defense and Advanced Technologies Segment: We expect FY2027 segment revenue growth in the mid-teens YoY, driven primarily by strong growth in information security and cyber defense, as well as space and mission systems and tactical networking. Net Debt: We expect net leverage ratio to decrease slightly by the end of FY2027. Capital Expenditures: We expect FY2027 capital expenditures of between $950 million and $1.0 billion, including approximately $250 to $300 million for Inmarsat related capital expenditures. Operating and Free Cash Flow: For FY2027, we continue to expect operating cash flow to be flat YoY with free cash flow generated to be approximately $180 million. Our free cash flow guidance excludes the benefit of the Ligado lump sum payments in both periods, as they are non-recurring. We invite you, our shareholders, to continue this journey with us. Your confidence and long-term support enable us to invest, innovate, and pursue the opportunities that we believe will create meaningful value for customers, employees, communities, and shareholders alike. Together, we are building a stronger Viasat, one positioned not only to participate in the future, but to help define it. Thank you for your trust, your partnership, and your investment. Shareholder Letter | Q1 Fiscal Year 2027 7

Endnotes 1. Net income (loss) as used herein is defined as net income (loss) attributable to Viasat, Inc. common stockholders. 2. Adjusted EBITDA is defined as earnings before interest, income taxes, depreciation and amortization, as further adjusted to exclude certain non-cash items and non-recurring expenses such as stock-based compensation expense, acquisition and transaction related expenses, loss or gain on disposition of certain assets and/or related businesses, product lines or other similar investments, loss or gain on debt extinguishment, non-recurring impairment of satellites and networking assets, and unrealized foreign currency loss or gain. A reconciliation of Adjusted EBITDA to its closest GAAP equivalent is provided at the end of this letter under “Non-GAAP Financial Reconciliation.” See “Use of Non-GAAP Financial Information” for additional information. 3. Free cash flow is defined as net cash provided by (used in) operating activities less capital expenditures (purchase of property, equipment and satellites, and other assets). A reconciliation of free cash flow to its closest GAAP equivalent is provided at the end of this letter under “Non-GAAP Financial Reconciliation.” See “Use of Non-GAAP Financial Information” for additional financial information. 4. Net debt is defined as total debt less cash and cash equivalents and short-term investments. A reconciliation of net debt to its closest GAAP equivalent is provided at the end of this letter under “Non-GAAP Financial Reconciliation.” See “Use of Non-GAAP Financial Information” for additional financial information. 5. Net Leverage ratio is defined as the ratio of net debt to LTM Adjusted EBITDA. A reconciliation of net leverage ratio to its closest GAAP equivalent is provided at the end of this letter under “Non-GAAP Financial Reconciliation.” See “Use of Non-GAAP Financial Information” for additional financial information.

Shareholder Letter | Q1 Fiscal Year 2027 9 Forward-Looking Statements This shareholder letter contains forward-looking statements regarding future events and our future results that are subject to the safe harbors created under the Securities Act of 1933 and the Securities Exchange Act of 1934. Forward-looking statements include, among others, statements regarding projections of earnings, revenue, backlog, Adjusted EBITDA, net leverage, net debt, operating cash flow, free cash flow, capital expenditures, investments, costs, return on capital or other financial items, including financial guidance and outlook and expectations for performance and results of operations in FY2027 and beyond; anticipated trends in our business or key markets; growth opportunities and the acceleration and durability of growth in our businesses, including for multi-network and multi-orbit solutions and sovereign space infrastructure; ability to successfully compete in our target markets, and durability or strengthening of competitive advantages; building shareholder value and strategic initiatives; the construction, completion, testing, launch, commencement of service, expected performance and benefits of satellites and satellite payloads (including satellites planned or under construction) and the timing thereof; the expected capacity, coverage, service speeds and other features of our satellites, and the cost, economics and benefits associated therewith; anticipated subscriber growth; development, introduction and integration of multi-orbit capabilities and terminals; the ability to capitalize on backlog and awards received and unawarded IDIQ contract vehicles; future economic conditions; the development, customer acceptance and anticipated performance of our technologies, products or services; our plans, objectives and strategies for future operations; our ability to drive capital efficiency and improve resource utilization; the number of additional aircraft or vessels anticipated to be put into service with our connectivity systems; and other characterizations of future events or circumstances, are forward-looking statements. Readers are cautioned that these forward-looking statements are only predictions and are subject to risks, uncertainties and assumptions that are difficult to predict. Factors that could cause actual results to differ materially include: our ability to realize the anticipated benefits of any existing or future satellite; unexpected expenses related to our satellite projects; risks associated with the construction, launch and operation of satellites, including the effect of any anomaly, launch, operational or deployment failure or degradation in satellite performance; capacity constraints in our business in the lead-up to the launch of services on new satellites; increasing levels of competition in our target markets; our ability to successfully implement our business plan on our anticipated timeline or at all; our ability to successfully develop, introduce and sell new technologies, products and services; audits by the U.S. Government; changes in the global business environment and economic conditions (including U.S. Government shutdowns); delays in approving U.S. Government budgets and cuts in government defense expenditures; our reliance on U.S. Government contracts, and on a small number of contracts which account for a significant percentage of our revenues; reduced demand for products and services as a result of continued constraints on capital spending by customers; changes in relationships with, or the financial condition of, key customers or suppliers; our reliance on a limited number of third parties to manufacture and supply our products; introduction of new technologies and other factors affecting the communications and defense industries generally; the effect of adverse regulatory changes (including changes affecting spectrum availability or permitted uses) on our ability to sell or deploy our products and services; changes in the way others use spectrum; our inability to access additional spectrum, use spectrum for additional purposes, and/or operate satellites at additional orbital locations; competing uses of the same spectrum or orbital locations that we utilize or seek to utilize; the effect of changes to global tax laws; our level of indebtedness and ability to comply with applicable debt covenants; our involvement in litigation, including intellectual property claims and litigation to protect our proprietary technology; any dispute with Ligado regarding the terms of the Ligado settlement; and our dependence on a limited number of key employees. In addition, please refer to the risk factors contained in our SEC filings available at www.sec.gov, including our most recent Annual Report on Form 10-K and Quarterly Reports on Form 10-Q. Readers are cautioned not to place undue reliance on any forward-looking statements, which speak only as of the date on which they are made. We undertake no obligation to revise or update any forward-looking statements for any reason. Shareholder Letter | Q1 Fiscal Year 2027 10
Use of Non-GAAP Financial Information
To supplement Viasat’s consolidated financial statements presented in accordance with generally accepted accounting principles (GAAP), Viasat uses
non-GAAP net income (loss) attributable to Viasat, Inc., Adjusted EBITDA, net debt, net leverage ratio, and free cash flow, measures Viasat believes are appropriate to enhance an overall understanding of
Viasat’s past financial performance and prospects for the future. We believe non-GAAP net income (loss) attributable to Viasat, Inc. and Adjusted EBITDA provide useful information to both management and
investors by excluding specific expenses that we believe are not indicative of our core operating results. We believe net debt and net leverage ratio provide useful information to both management and investors in order to monitor our leverage
(including our ability to service our debt and make capital expenditures) and evaluate our consolidated balance sheet. A limitation associated with using net debt is that it subtracts cash and therefore may imply there is less debt than the most
comparable GAAP measure. We believe free cash flow is an important liquidity metric because it measures, during a given period, the amount of cash generated that is available to repay debt obligations, make investments, fund acquisitions and for
certain other activities. Free cash flow can vary significantly from period to period depending upon, among other things, operating asset and liability balances, service and product revenues, operating efficiencies, increases or decreases in
purchases of property and equipment, subscriber additions (losses), subscriber churn, and other factors. In addition, since we have historically reported non-GAAP results to the investment community, we
believe the inclusion of non-GAAP numbers provides consistency in our financial reporting and facilitates comparisons to Viasat’s historical operating results. Further, these non-GAAP results are among the primary indicators that management uses as a basis for evaluating the operating performance of our segments, allocating resources to such segments, planning and forecasting in future
periods. The presentation of this additional information is not meant to be considered in isolation or as a substitute for measures of financial performance prepared in accordance with GAAP. A reconciliation of specific adjustments to GAAP results
is provided in the tables below under “Non-GAAP Financial Reconciliation.”
Copyright © 2026 Viasat, Inc. All rights
reserved. Viasat, the Viasat logo and the Viasat signal are registered trademarks of Viasat, Inc. All other product or company names mentioned are used for identification purposes only and may be trademarks of their respective owners.
First Quarter Fiscal Year 2027 Results
Financial Results
| (In millions, except per share data) | Q1FY27 | Q1FY26 | Year-over-Year
Change |
|||||||||
| Revenues |
$1,156.5 | $1,171.1 | (1)% | |||||||||
| Net income (loss) (1) |
($51.7) | ($56.4) | (8)% | |||||||||
| Non-GAAP net income (loss) (1), (6) |
$24.5 | $23.1 | 6% | |||||||||
| Adjusted EBITDA (7) |
$381.1 | $408.5 | (7)% | |||||||||
| Diluted per share net income (loss) (1) |
($0.38) | ($0.43) | (12)% | |||||||||
| Non-GAAP diluted per share net income (loss) (1), (2) |
$0.17 | $0.17 | 0% | |||||||||
| Fully diluted weighted average shares (2) |
137.1 | 131.6 | 4% | |||||||||
| New contract awards (3) |
$1,298.0 | $1,182.7 | 10% | |||||||||
| Backlog (4) |
$4,217.7 | $3,548.7 | 19% | |||||||||
|
Segment Results |
| |||||||||||
| (In millions) |
Q1FY27 | Q1FY26 | |
Year-over-Year Change |
| |||||||
| Communication Services |
||||||||||||
| New contract awards (3) |
$774.1 | $754.4 | 3% | |||||||||
| Revenues |
$825.1 | $827.4 | 0% | |||||||||
| Operating profit (loss) (5) |
$62.4 | $40.9 | 53% | |||||||||
| Adjusted EBITDA (8) |
$311.3 | $321.5 | (3)% | |||||||||
| Defense and Advanced Technologies |
||||||||||||
| New contract awards (3) |
$523.9 | $428.3 | 22% | |||||||||
| Revenues |
$331.5 | $343.7 | (4)% | |||||||||
| Operating profit (loss) (5) |
$49.9 | $71.5 | (30)% | |||||||||
|
Adjusted EBITDA (8) |
$69.9 | $86.9 | (20)% | |||||||||
| (1) | Attributable to Viasat, Inc. common stockholders. |
| (2) | As the three months ended June 30, 2026 and June 30, 2025 financial information resulted in a net loss, the weighted average number of shares used to calculate basic and diluted net loss per share is the same, as diluted shares would be anti-dilutive. However, as the non-GAAP financial information for the three months ended June 30, 2026 and June 30, 2025 resulted in non-GAAP net income, 145.5 million and 134.1 million, respectively, diluted weighted average number of shares were used instead to calculate non-GAAP diluted net income per share. |
| (3) | Awards exclude future revenue under recurring consumer commitment arrangements. |
| (4) | Amounts include certain backlog adjustments due to contract changes and amendments. Our backlog includes contracts with subscribers for fixed broadband services in our Communication Services segment. Backlog does not include anticipated purchase orders and requests for the installation of in-flight connectivity systems or future recurring in-flight internet service revenues under our commercial in-flight internet agreements in our Communication Services segment. |
| (5) | Before corporate. |
| (6) | Beginning in the first quarter of fiscal year 2027, the Company revised its calculation of Non-GAAP net income (loss) to exclude unrealized foreign currency loss (gain), net, which is included within “Other, net” in the reconciliation of net income (loss) attributable to Viasat, Inc. to Non-GAAP net income (loss) attributable to Viasat, Inc. This amount reflects non-cash period-end remeasurement of foreign currency-denominated monetary assets and liabilities and is not considered by management to be indicative of core operating performance. For the three months ended June 30, 2026 and June 30, 2025, unrealized foreign currency loss (gain), net was a loss of $0.9 million and $9.7 million, respectively. Prior period amounts have not been revised to conform to the current presentation because the overall effect for the fiscal year was not material. As a result, Non-GAAP net income (loss) for the three months ended June 30, 2025 did not reflect this adjustment, and had it been included, Non-GAAP net income (loss) attributable to Viasat, Inc., including the income tax effect, would have been $30.2 million. |
| (7) | Beginning in the first quarter of fiscal year 2027, the Company revised its calculation of Adjusted EBITDA to exclude unrealized foreign currency loss (gain), net, which is included within “Other, net” in the reconciliation of net income (loss) attributable to Viasat, Inc. to Adjusted EBITDA. This amount reflects non-cash period-end remeasurement of foreign currency-denominated monetary assets and liabilities and is not considered by management to be indicative of core operating performance. For the three months ended June 30, 2026 and June 30, 2025, unrealized foreign currency loss (gain), net was a loss of $0.9 million and $9.7 million, respectively. Prior period amounts have not been revised to conform to the current presentation because the overall effect for the fiscal year was not material. As a result, Adjusted EBITDA for the three months ended June 30, 2025 did not reflect this adjustment, and had it been included, Adjusted EBITDA would have been $418.1 million. |
| (8) | Beginning in the first quarter of fiscal year 2027, the Company excludes unrealized foreign currency loss (gain), net from Adjusted EBITDA for the Communication Services and Defense and Advanced Technologies segments. For the three months ended June 30, 2026, unrealized foreign currency loss (gain), net for the Communication Services and Defense and Advanced Technologies segments was a loss of $0.9 million and $0.0 million, respectively. For the three months ended June 30, 2025, unrealized foreign currency loss (gain), net for the Communication Services and Defense and Advanced Technologies segments was a loss of $9.7 million and $0.0 million, respectively. Prior period amounts have not been revised to conform to the current presentation because the overall effect for the fiscal year was not material. Accordingly, Adjusted EBITDA for the Communication Services and Defense and Advanced Technologies segments for the three months ended June 30, 2025 did not reflect this adjustment, and had it been included, Adjusted EBITDA would have been $331.2 million and $86.9 million, respectively. |
Note: Some totals may not foot due to rounding.

Shareholder Letter | Q1 Fiscal Year 2027 12
First Quarter Fiscal Year 2027 Results (cont.)
Condensed Consolidated Statements of Operations
(Unaudited)
(In thousands, except per share data)
| Three months ended | ||||||||
| June 30, 2026 | June 30, 2025 | |||||||
| Revenues: |
||||||||
| Service revenues |
$ | 832,438 | $ | 826,370 | ||||
| Product revenues |
324,105 | 344,684 | ||||||
|
|
|
|
|
|||||
| Total revenues |
1,156,543 | 1,171,054 | ||||||
| Operating expenses: |
||||||||
| Cost of service revenues |
513,134 | 528,234 | ||||||
| Cost of product revenues |
230,568 | 233,382 | ||||||
| Selling, general and administrative |
255,024 | 262,832 | ||||||
| Independent research and development |
45,491 | 34,193 | ||||||
| Amortization of acquired intangible assets |
65,018 | 65,741 | ||||||
|
|
|
|
|
|||||
| Income (loss) from operations |
47,308 | 46,672 | ||||||
| Interest (expense) income, net |
(66,913 | ) | (86,067 | ) | ||||
| (Loss) gain on extinguishment of debt, net |
— | (288 | ) | |||||
| Other income (expense), net |
(306 | ) | (5,164 | ) | ||||
|
|
|
|
|
|||||
| Income (loss) before income taxes |
(19,911 | ) | (44,847 | ) | ||||
| (Provision for) benefit from income taxes |
(23,111 | ) | (6,610 | ) | ||||
| Equity in income (loss) of unconsolidated affiliates, net |
228 | 3,733 | ||||||
|
|
|
|
|
|||||
| Net income (loss) |
(42,794 | ) | (47,724 | ) | ||||
| Less: net income (loss) attributable to noncontrolling interest, net of tax |
8,947 | 8,710 | ||||||
|
|
|
|
|
|||||
| Net income (loss) attributable to Viasat, Inc. |
$ | (51,741) | $ | (56,434 | ) | |||
|
|
|
|
|
|||||
| Diluted net income (loss) per share attributable to Viasat, Inc. common stockholders |
$ | (0.38) | $ | (0.43) | ||||
|
|
|
|
|
|||||
| Diluted common equivalent shares (1) |
137,121 | 131,578 | ||||||
|
AN ITEMIZED RECONCILIATION BETWEEN NET INCOME (LOSS) ATTRIBUTABLE TO VIASAT, INC. ON A GAAP BASIS AND NON-GAAP BASIS IS AS FOLLOWS: |
| |||||||
| (In thousands, except per share data) | Three months ended | |||||||
| June 30, 2026 | June 30, 2025 | |||||||
| GAAP net income (loss) attributable to Viasat, Inc. |
$ | (51,741 | ) | $ | (56,434 | ) | ||
| Amortization of acquired intangible assets |
65,018 | 65,741 | ||||||
| Stock-based compensation expense |
24,191 | 14,707 | ||||||
| Acquisition and transaction related expenses (2) |
4,056 | 9,725 | ||||||
| Loss (gain) on extinguishment of debt, net |
— | 288 | ||||||
| Other, net (5) |
(625 | ) | 5,164 | |||||
| Income tax effect (3) |
(16,389 | ) | (16,097 | ) | ||||
|
|
|
|
|
|||||
| Non-GAAP net income (loss) attributable to Viasat, Inc. (6) |
$ | 24,510 | $ | 23,094 | ||||
|
|
|
|
|
|||||
| Non-GAAP diluted net income (loss) per share attributable to Viasat, Inc. common stockholders |
$ | 0.17 | $ | 0.17 | ||||
|
|
|
|
|
|||||
| Diluted common equivalent shares (1) |
145,522 | 134,149 | ||||||
|
AN ITEMIZED RECONCILIATION BETWEEN NET INCOME (LOSS) ATTRIBUTABLE TO VIASAT, INC. AND ADJUSTED EBITDA IS AS FOLLOWS: |
| |||||||
| (In thousands) | Three months ended | |||||||
| June 30, 2026 | June 30, 2025 | |||||||
| GAAP net income (loss) attributable to Viasat, Inc. |
$ | (51,741 | ) | $ | (56,434 | ) | ||
| Provision for (benefit from) income taxes |
23,111 | 6,610 | ||||||
| Interest expense (income), net |
66,913 | 86,067 | ||||||
| Depreciation and amortization (4) |
315,241 | 342,344 | ||||||
| Stock-based compensation expense |
24,191 | 14,707 | ||||||
| Acquisition and transaction related expenses (2) |
4,056 | 9,725 | ||||||
| Loss (gain) on extinguishment of debt, net |
— | 288 | ||||||
| Other, net (5) |
(625 | ) | 5,164 | |||||
|
|
|
|
|
|||||
| Adjusted EBITDA (7) |
$ | 381,146 | $ | 408,471 | ||||
|
|
|
|
|
|||||
| (1) | As the three months ended June 30, 2026 and June 30, 2025 financial information resulted in a net loss, the weighted average number of shares used to calculate basic and diluted net loss per share is the same, as diluted shares would be anti-dilutive. However, as the non-GAAP financial information for the three months ended June 30, 2026 and June 30, 2025 resulted in non-GAAP net income, diluted weighted average number of shares were used instead to calculate non-GAAP diluted net income per share. |
| (2) | Costs typically consist of acquisition, integration, and disposition related costs. |
| (3) | The income tax effect is calculated using the tax rate applicable for the non-GAAP adjustments. |
| (4) | Including amortization of capitalized cloud computing implementation costs. |
| (5) | For the three months ended June 30, 2026, “Other, net” primarily consists of unrealized foreign currency loss (gain), net. Beginning in the first quarter of fiscal year 2027, the Company excludes unrealized foreign currency loss (gain), net from non-GAAP net income (loss) attributable to Viasat, Inc. and Adjusted EBITDA because this item reflects non-cash period-end remeasurement of foreign currency-denominated monetary assets and liabilities and is not considered by management to be indicative of core operating performance. Prior period amounts have not been revised to conform to the current presentation because the overall effect for the fiscal year was not material. For the three months ended June 30, 2026 and June 30, 2025, unrealized foreign currency loss (gain), net, was a loss of $0.9 million and $9.7 million, respectively. |
| (6) | Non-GAAP net income (loss) for the three months ended June 30, 2025 includes unrealized foreign currency loss (gain), net, and had it been excluded, Non-GAAP net income (loss) attributable to Viasat, Inc., including the income tax effect, would have been $30.2 million. |
| (7) | Adjusted EBITDA for the three months ended June 30, 2025 includes unrealized foreign currency loss (gain), net, and had it been excluded, Adjusted EBITDA would have been $418.1 million. |
Shareholder Letter | Q1 Fiscal Year 2027 13
First Quarter Fiscal Year 2027 Results (cont.)
AN ITEMIZED RECONCILIATION BETWEEN SEGMENT OPERATING PROFIT (LOSS) BEFORE CORPORATE
AND ADJUSTED EBITDA IS AS FOLLOWS:
(In thousands)
| Three months ended June 30, 2026 | Three months ended June 30, 2025 | |||||||||||||||||||||||
| Communication Services Segment |
Defense and Advanced Technologies Segment |
Total | Communication Services Segment |
Defense and Advanced Technologies Segment |
Total | |||||||||||||||||||
| Segment operating profit (loss) before corporate |
$ | 62,429 | $ | 49,897 | $ | 112,326 | $ | 40,876 | $ | 71,537 | $ | 112,413 | ||||||||||||
| Depreciation (8) |
221,193 | 12,515 | 233,708 | 246,749 | 10,952 | 257,701 | ||||||||||||||||||
| Stock-based compensation expense |
14,153 | 10,038 | 24,191 | 8,312 | 6,395 | 14,707 | ||||||||||||||||||
| Other than acquired intangible assets amortization (4) |
11,234 | 5,281 | 16,515 | 14,009 | 4,893 | 18,902 | ||||||||||||||||||
| Acquisition and transaction related expenses (2) |
2,890 | 1,166 | 4,056 | 7,874 | 1,851 | 9,725 | ||||||||||||||||||
| Equity in income (loss) of unconsolidated affiliates, net |
228 | — | 228 | 3,733 | — | 3,733 | ||||||||||||||||||
| Noncontrolling interest and other (9) |
(835 | ) | (9,043 | ) | (9,878 | ) | (30 | ) | (8,680 | ) | (8,710 | ) | ||||||||||||
|
|
|
|
|
|
|
|
|
|
|
|
|
|
|
|
|
|
| |||||||
| Adjusted EBITDA (10) |
$ | 311,292 | $ | 69,854 | $ | 381,146 | $ | 321,523 | $ | 86,948 | $ | 408,471 | ||||||||||||
|
|
|
|
|
|
|
|
|
|
|
|
|
|
|
|
|
|
| |||||||
| (8) | Depreciation expenses not specifically recorded in a particular segment have been allocated based on other indirect allocable costs, which management believes is a reasonable method. |
| (9) | Beginning in the first quarter of fiscal year 2027, the Company excludes unrealized foreign currency loss (gain), net from Adjusted EBITDA, which is included within “Noncontrolling interest and other” in the reconciliation of segment operating profit (loss) before corporate to Adjusted EBITDA. Prior period amounts have not been revised to conform to the current presentation because the overall effect for the fiscal year was not material. For the three months ended June, 30, 2026 and June 30, 2025, unrealized foreign currency loss (gain), net for the Communication Services segment was a loss of $0.9 million and $9.7 million, respectively, and nil for the Defense and Advanced Technologies segment. |
| (10) | Adjusted EBITDA for the Communication Services and Defense and Advanced Technologies segments for the three months ended June 30, 2025 does not exclude unrealized foreign currency loss (gain), net, and had it been excluded, Adjusted EBITDA would have been $331.2 million and $86.9 million, respectively. |
Shareholder Letter | Q1 Fiscal Year 2027 14
First Quarter Fiscal Year 2027 Results (cont.)
Condensed Consolidated Balance Sheets
(Unaudited)
(In thousands)
| As of | As of | |||||||
| Assets | June 30, 2026 | March 31, 2026 | ||||||
| Current assets: |
||||||||
| Cash and cash equivalents |
$ | 1,735,819 | $ | 1,746,835 | ||||
| Accounts receivable, net |
744,423 | 753,430 | ||||||
| Inventories |
293,788 | 281,220 | ||||||
| Prepaid expenses and other current assets |
330,739 | 342,522 | ||||||
|
|
|
|
|
|
| |||
| Total current assets |
3,104,769 | 3,124,007 | ||||||
| Property, equipment and satellites, net |
7,248,899 | 7,272,637 | ||||||
| Operating lease right-of-use assets |
420,810 | 427,994 | ||||||
| Acquired intangible assets, net |
1,931,864 | 1,997,436 | ||||||
| Goodwill |
1,624,700 | 1,625,013 | ||||||
| Other assets |
780,560 | 779,509 | ||||||
|
|
|
|
|
|
| |||
| Total assets |
$ | 15,111,602 | $ | 15,226,596 | ||||
|
|
|
|
|
|
| |||
| As of | As of | |||||||
| Liabilities and Equity | June 30, 2026 | March 31, 2026 | ||||||
| Current liabilities: |
||||||||
| Accounts payable |
$ | 288,629 | $ | 288,154 | ||||
| Accrued and other liabilities |
902,530 | 951,192 | ||||||
| Current portion of long-term debt |
661,939 | 57,753 | ||||||
|
|
|
|
|
|
| |||
| Total current liabilities | 1,853,098 | 1,297,099 | ||||||
| Senior notes |
3,068,721 | 3,664,848 | ||||||
| Other long-term debt |
2,711,739 | 2,726,004 | ||||||
| Non-current operating lease liabilities |
420,685 | 430,082 | ||||||
| Other liabilities |
2,339,668 | 2,379,301 | ||||||
|
|
|
|
|
|
| |||
| Total liabilities | 10,393,911 | 10,497,334 | ||||||
|
|
|
|
|
|
| |||
| Total Viasat Inc. stockholders’ equity |
4,639,852 | 4,660,301 | ||||||
| Noncontrolling interest in subsidiary |
77,839 | 68,961 | ||||||
|
|
|
|
|
|
| |||
| Total equity |
4,717,691 | 4,729,262 | ||||||
|
|
|
|
|
|
| |||
| Total liabilities and equity |
$ | 15,111,602 | $ | 15,226,596 | ||||
|
|
|
|
|
|
| |||
Shareholder Letter | Q1 Fiscal Year 2027 15
Non-GAAP Financial Reconciliation
AN ITEMIZED RECONCILIATION BETWEEN NET INCOME (LOSS) ATTRIBUTABLE TO VIASAT, INC.
AND ADJUSTED EBITDA, AND TOTAL DEBT TO NET DEBT IS AS FOLLOWS:
(In thousands)
| Three months ended | ||||||||||||||||||||
| June 30, 2026 | March 31, 2026 | December 31, 2025 | September 30, 2025 | June 30, 2025 | ||||||||||||||||
| GAAP net income (loss) attributable to Viasat, Inc. |
$ | (51,741 | ) | $ | 58,824 | $ | 24,968 | $ | (61,444 | ) | $ | (56,434 | ) | |||||||
| Provision for (benefit from) income taxes |
23,111 | 40,081 | 58,670 | 10,862 | 6,610 | |||||||||||||||
| Interest expense (income), net |
66,913 | 65,484 | (78,112 | ) | 80,962 | 86,067 | ||||||||||||||
| Depreciation and amortization (4) |
315,241 | 347,327 | 340,360 | 329,128 | 342,344 | |||||||||||||||
| Stock-based compensation expense |
24,191 | 22,142 | 24,099 | 20,122 | 14,707 | |||||||||||||||
| Acquisition and transaction related expenses (2) |
4,056 | 4,062 | 5,525 | 5,080 | 9,725 | |||||||||||||||
| Loss (gain) on extinguishment of debt, net |
— | — | 11,647 | — | 288 | |||||||||||||||
| Other, net (11) |
(625 | ) | (168,062 | ) | (114 | ) | — | 5,164 | ||||||||||||
|
|
|
|
|
|
|
|
|
|
|
|
|
|
|
| ||||||
| Adjusted EBITDA (12) |
$ | 381,146 | $ | 369,858 | $ | 387,043 | $ | 384,710 | $ | 408,471 | ||||||||||
|
|
|
|
|
|
|
|
|
|
|
|
|
|
|
| ||||||
| NET DEBT | As of | |||||||||||||||||||
| (In thousands) | June 30, 2026 | March 31, 2026 | December 31, 2025 | September 30, 2025 | June 30, 2025 | |||||||||||||||
| Total debt |
$ | 6,570,503 | $ | 6,585,115 | $ | 6,406,911 | $ | 6,731,043 | $ | 6,741,529 | ||||||||||
| Less: cash and cash equivalents |
1,735,819 | 1,746,835 | 1,346,136 | 1,230,074 | 1,177,492 | |||||||||||||||
|
|
|
|
|
|
|
|
|
|
|
|
|
|
|
| ||||||
| Net debt |
$ | 4,834,684 | $ | 4,838,280 | $ | 5,060,775 | $ | 5,500,969 | $ | 5,564,037 | ||||||||||
|
|
|
|
|
|
|
|
|
|
|
|
|
|
|
| ||||||
| NET LEVERAGE RATIO (NON-GAAP) (13) | ||||||||||||||||||||
| (In thousands) | June 30, 2026 | March 31, 2026 | December 31, 2025 | September 30, 2025 | June 30, 2025 | |||||||||||||||
| Net debt |
$ | 4,834,684 | $ | 4,838,280 | $ | 5,060,775 | $ | 5,500,969 | $ | 5,564,037 | ||||||||||
| LTM Adjusted EBITDA |
1,522,757 | 1,550,082 | 1,555,017 | 1,561,234 | 1,551,398 | |||||||||||||||
|
|
|
|
|
|
|
|
|
|
|
|
|
|
|
| ||||||
| Net leverage ratio |
3.2 | 3.1 | 3.3 | 3.5 | 3.6 | |||||||||||||||
|
AN ITEMIZED RECONCILIATION BETWEEN NET CASH PROVIDED BY (USED IN) OPERATING ACTIVITIES AND FREE CASH FLOW IS AS FOLLOWS: (In thousands) The following table reconciles free cash flow to Net cash provided by (used in) operating activities. |
| |||||||||||||||||||
| Three months ended | ||||||||||||||||||||
| June 30, 2026 | March 31, 2026 | December 31, 2025 | September 30, 2025 | June 30, 2025 | ||||||||||||||||
| Net cash provided by (used in) operating activities |
$ | 260,550 | $ | 322,295 | $ | 726,888 | $ | 282,242 | $ | 258,460 | ||||||||||
| Purchase of property, equipment and satellites, and other assets (capital expenditures) |
(218,928 | ) | (298,341 | ) | (282,721 | ) | (213,699 | ) | (198,013 | ) | ||||||||||
|
|
|
|
|
|
|
|
|
|
|
|
|
|
|
| ||||||
| Free cash flow |
$ | 41,622 | $ | 23,954 | $ | 444,167 | $ | 68,543 | $ | 60,447 | ||||||||||
|
|
|
|
|
|
|
|
|
|
|
|
|
|
|
| ||||||
| (11) | Beginning in the first quarter of fiscal year 2027, the Company revised its calculation of Adjusted EBITDA to exclude unrealized foreign currency loss (gain), net, which is included within “Other, net.” For the three months ended June 30, 2026, unrealized foreign currency loss (gain), net was a loss of $0.9 million. Prior period amounts have not been revised to conform to the current presentation because the overall effect for the fiscal year was not material. For the three months ended March 31, 2026, December 31, 2025, September 30, 2025 and June 30, 2025, unrealized foreign currency loss (gain), net was a gain of $4.9 million, gain of $1.1 million, gain of $0.9 million and loss of $9.7 million, respectively, and not included herein. For the three months ending March 31, 2026, “Other, net” consisted of a gain on the disposition of an equity method investment. |
| (12) | Adjusted EBITDA for the three months ended March 31, 2026, December 31, 2025, September 30, 2025 and June 30, 2025, would have been $364.9 million, $385.9 million, $383.8 million and $418.1 million, respectively, had unrealized foreign currency loss (gain), net been excluded. |
| (13) | The most comparable GAAP measure to net debt to LTM Adjusted EBITDA (net leverage ratio) is total debt to LTM net income (loss) attributable to Viasat, Inc. For June 30, 2026, March 31, 2026, December 31, 2025, September 30, 2025, and June 30, 2025, the total debt to LTM net income (loss) ratio was (223.5)x, (193.2)x, (18.9)x, (12.9)x, and (11.3)x, respectively, based on total debt of approximately $6.6 billion, $6.6 billion, $6.4 billion, $6.7 billion, and $6.7 billion, respectively, divided by LTM net loss attributable to Viasat, Inc. of approximately $29.4 million, $34.1 million, $339.0 million, $522.3 million, and $598.5 million, respectively. |
Shareholder Letter | Q1 Fiscal Year 2027 16
Selected Segment Financial Information
(Unaudited)
(In thousands)
| Three months ended | ||||||||
| June 30, 2026 | June 30, 2025 | |||||||
| Revenues: |
||||||||
| Communication services |
||||||||
| Aviation services |
$ | 324,381 | $ | 292,892 | ||||
| Government satcom services |
211,734 | 191,768 | ||||||
| Maritime services |
109,502 | 117,801 | ||||||
| Fixed services and other services |
127,425 | 174,737 | ||||||
|
|
|
|
|
|||||
| Total services |
773,042 | 777,198 | ||||||
| Total products |
52,041 | 50,173 | ||||||
|
|
|
|
|
|||||
| Total communication services revenues |
825,083 | 827,371 | ||||||
| Defense and advanced technologies |
||||||||
| Total services |
59,396 | 49,172 | ||||||
| Information security and cyber defense products |
93,991 | 102,148 | ||||||
| Space and mission systems products |
66,860 | 87,973 | ||||||
| Tactical networking products |
92,570 | 68,279 | ||||||
| Advanced technologies and other products |
18,643 | 36,111 | ||||||
|
|
|
|
|
|||||
| Total products |
272,064 | 294,511 | ||||||
|
|
|
|
|
|||||
| Total defense and advanced technologies revenues |
331,460 | 343,683 | ||||||
| Elimination of intersegment revenues |
— | — | ||||||
|
|
|
|
|
|||||
| Total revenues |
$ | 1,156,543 | $ | 1,171,054 | ||||
|
|
|
|
|
|||||
Shareholder Letter | Q1 Fiscal Year 2027 17