Shareholder Report
May 31, 2026
USD ($)
holding
This annual shareholder report contains important information about the Argent Focused Small Cap ETF (the “Fund”) for the period of June 1, 2025 to May 31, 2026 (the “Period”). You can find additional information about the Fund at https://argentetfs.com/alil/. You can also request this information by contacting us at (215) 330-4476. For information regarding your Fund shares or account, including account balances, transactions, or distributions, please contact your financial intermediary. | |||||||||||
Availability of Additional Information
For additional information about the Fund, including its prospectus, financial information, holdings, and proxy information, visit https://argentetfs.com/alil/. You can also request information by calling (215) 330-4476.
Householding
Householding is an option available to certain investors of the Fund. Householding is a method of delivery, based on the preference of the individual investor, in which a single copy of certain shareholder documents can be delivered to investors who share the same address, even if their accounts are registered under different names. Householding for the Fund is available through certain broker-dealers. If you are interested in enrolling in householding and receiving a single copy of prospectuses and other shareholder documents or you are currently enrolled in householding and wish to change your householding status, please contact your broker-dealer.
| WHAT WERE THE FUND COSTS FOR THE PERIOD? (based on a hypothetical $10,000 investment) | |||||||||||
| COST OF $10,000 INVESTMENT | COST PAID AS A PERCENTAGE OF $10,000 INVESTMENT | ||||||||||
| $78 | 0.74% | ||||||||||
| WHAT FACTORS INFLUENCED PERFORMANCE FOR THE PERIOD? | |||||||||||
PERFORMANCE SUMMARY
For the 12-month period ended May 31, 2026, the Fund returned 10.54% versus 43.08% for the Russell 2000 Total Return Index, underperforming by 3254 basis points net of fees. The Fund invests in high-quality small cap companies that meet the Sub-Adviser’s strict criteria of an enduring business driven by deep dive fundamental research. In addition to portfolio specific headwinds outlined below, the stock market’s preference for lower quality stocks starting at the Liberation Day lows in April 2025 was an additional headwind for the Fund.
TOP PERFORMANCE CONTRIBUTORS
The Fund’s allocation to specific sectors was driven by stock selection. Allocation effects were positive in the Technology and Industrials sectors that outperformed, and due to the underweight in traditionally defensive sectors that underperformed, including Consumer Staples and Utilities. From a stock selection perspective, Madison Square Garden in the Communication Services sector was a top contributor, supported by a combination of record concert bookings, margin expansion from better venue utilization, the Christmas
Spectacular's pricing headroom, sports-driven ancillary revenues, and real estate/asset monetization optionality — all underpinned by secular tailwinds in live entertainment demand.
TOP PERFORMANCE DETRACTORS
Underperformance was driven by negative stock selection effects in the Technology, Industrials, and Financials sectors.
Technology - Negative sentiment and AI displacement fears pressured the software industry and our positions in Descartes Systems felt the effects despite robust financial performance. In addition, our lack of exposure to the semiconductor capital equipment industry that benefited from AI related demand was a headwind.
Industrials – U.S. Department of Government Efficiency (“DOGE”) initiatives pressured the consulting industry, and the Fund’s position in CBIZ was a detriment. In addition, the Fund did not hold a position in the AI-momentum exposed Bloom Energy Corporation, which was the top contributor to Russell 2000 performance.
Financials – Hamilton Lane, Houlihan Lokey, and other alternative managers faced several headwinds, including concerns on private credit exposure.
| HOW DID THE FUND PERFORM FOR THE PERIOD? | |||||||||||
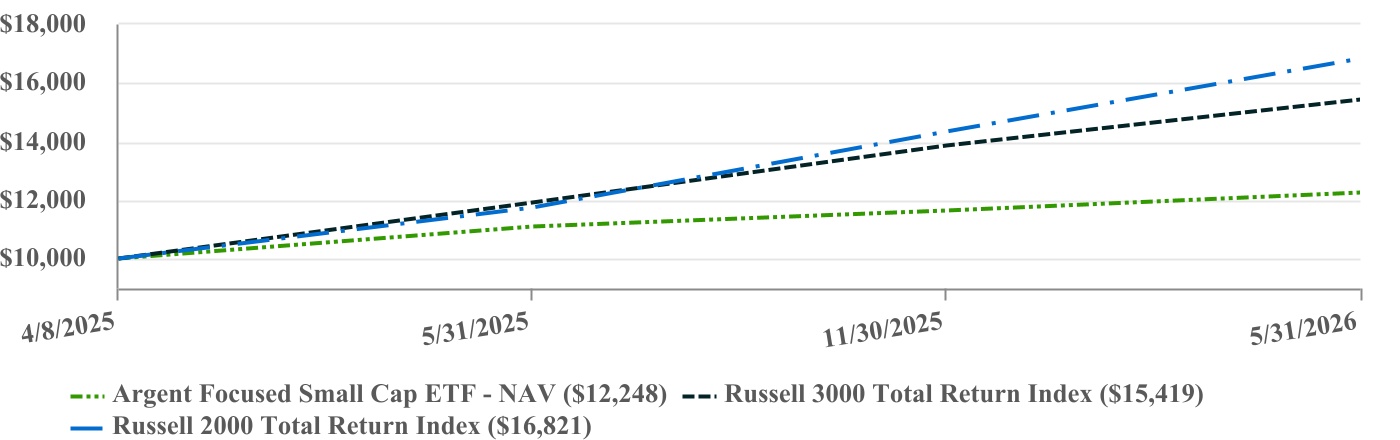
| PERFORMANCE | |||||||||||
One Year | Since Inception (4/8/2025) | ||||||||||
| Argent Focused Small Cap ETF - NAV | 10.54% | 19.37% | |||||||||
| Russell 3000 Total Return Index | 29.45% | 45.96% | |||||||||
| Russell 2000 Total Return Index | 43.08% | 57.48% | |||||||||
| The Russell 3000 Total Return Index is provided as a broad measure of market performance. The Russell 2000 Total Return Index is provided as a measure of the Fund's investment strategy and universe. | |||||||||||
The Fund’s past performance is not a good predictor of how the Fund will perform in the future. The graph and table do not reflect the deduction of taxes that a shareholder would pay on Fund distributions or redemption of fund shares. | |||||||||||
Visit https://argentetfs.com/alil/ for more recent performance information. | |||||||||||
| KEY FUND STATISTICS (as of Period End) | ||||||||||||||||||||
| Net Assets | $25,609,190 | Portfolio Turnover Rate* | 55% | |||||||||||||||||
| # of Portfolio Holdings | 43 | Fund Advisory Fees | $147,410 | |||||||||||||||||
*Portfolio turnover is not annualized and is calculated without regard to short-term securities having a maturity of less than one year. Excludes impact of in-kind transactions. | ||||||||||||||||||||
| SECTOR WEIGHTING (as a % of Net Assets) | |||||
| Industrials | 27.2% | ||||
| Information Technology | 23.7% | ||||
| Financials | 16.5% | ||||
| Health Care | 7.4% | ||||
| Materials | 6.8% | ||||
| Consumer Discretionary | 5.5% | ||||
| Energy | 4.2% | ||||
| Communication Services | 2.5% | ||||
| Consumer Staples | 2.3% | ||||
| Real Estate | 1.9% | ||||
| Utilities | 1.7% | ||||
| Cash and Cash Equivalents | 0.3% | ||||
| TOP 10 HOLDINGS (as a % of Net Assets) | |||||
| Victory Capital Holdings, Inc. - Class A | 4.7% | ||||
| Enpro, Inc. | 4.4% | ||||
| IES Holdings, Inc. | 4.0% | ||||
| RBC Bearings, Inc. | 3.7% | ||||
| Modine Manufacturing Co. | 3.7% | ||||
| ePlus, Inc. | 3.6% | ||||
| Fabrinet | 3.3% | ||||
| Green Brick Partners, Inc. | 3.3% | ||||
| Glacier Bancorp, Inc. | 3.0% | ||||
| Houlihan Lokey, Inc. | 2.9% | ||||
This annual shareholder report contains important information about the Argent Large Cap ETF (the “Fund”) for the period of June 1, 2025 to May 31, 2026 (the “Period”). You can find additional information about the Fund at https://argentetfs.com/abig/. You can also request this information by contacting us at (215) 330-4476. For information regarding your Fund shares or account, including account balances, transactions, or distributions, please contact your financial intermediary. | |||||||||||
Availability of Additional Information
For additional information about the Fund, including its prospectus, financial information, holdings, and proxy information, visit https://argentetfs.com/abig/. You can also request information by calling (215) 330-4476.
Householding
Householding is an option available to certain investors of the Fund. Householding is a method of delivery, based on the preference of the individual investor, in which a single copy of certain shareholder documents can be delivered to investors who share the same address, even if their accounts are registered under different names. Householding for the Fund is available through certain broker-dealers. If you are interested in enrolling in householding and receiving a single copy of prospectuses and other shareholder documents or you are currently enrolled in householding and wish to change your householding status, please contact your broker-dealer.
| WHAT WERE THE FUND COSTS FOR THE PERIOD? (based on a hypothetical $10,000 investment) | |||||||||||
| COST OF $10,000 INVESTMENT | COST PAID AS A PERCENTAGE OF $10,000 INVESTMENT | ||||||||||
| $54 | 0.49% | ||||||||||
| WHAT FACTORS INFLUENCED PERFORMANCE FOR THE PERIOD? | |||||||||||
Performance Summary
For the 12-month period ended May 31, 2026, the Fund returned 19.74% versus 29.45% for the Russell 3000 Total Return Index, underperforming by 971 basis points net of fees. The Fund invests in high-quality large cap companies that meet the Sub-Adviser’s strict criteria of an enduring business driven by alignment between a positive quantitative score generated by the Argent Alpha Model and deep dive fundamental research. In addition to portfolio specific headwinds outlined below, the stock market’s preference for lower quality stocks starting at the Liberation Day lows in April 2025 was an additional headwind for the Fund.
Top Performance Contributors
Positive attribution was led by stock selection in the Communication Services sector. Over the period, Alphabet Inc. (parent company to Google) transitioned from a perceived AI loser to a winner as fundamental performance affirmed its position in the demand cycle.
Allocation effects contributed positively from underweighting traditionally defensive sectors that underperformed, including Consumer Staples, Real Estate, and Utilities.
Top Performance Detractors
Nearly all the underperformance in the period was due to stock selection effects in three sectors:
Industrials – Aerospace and defense holding, TransDigm Group, faced concerns about its aftermarket growth deceleration, margin cadence, and valuation relative to its engine-exposed peers.
Technology – Software fell victim to AI obsolescence fears, and the Fund’s positions in ServiceNow and Tyler Technologies were pressured despite stable fundamental performance.
Financials – Mastercard and Visa faced AI-displacement fears that pressured shares, Blackstone and other alternative managers fell on concerns over private credit exposure, and insurer Progressive faced a softening pricing environment and increased competition.
| HOW DID THE FUND PERFORM FOR THE PERIOD? | |||||||||||
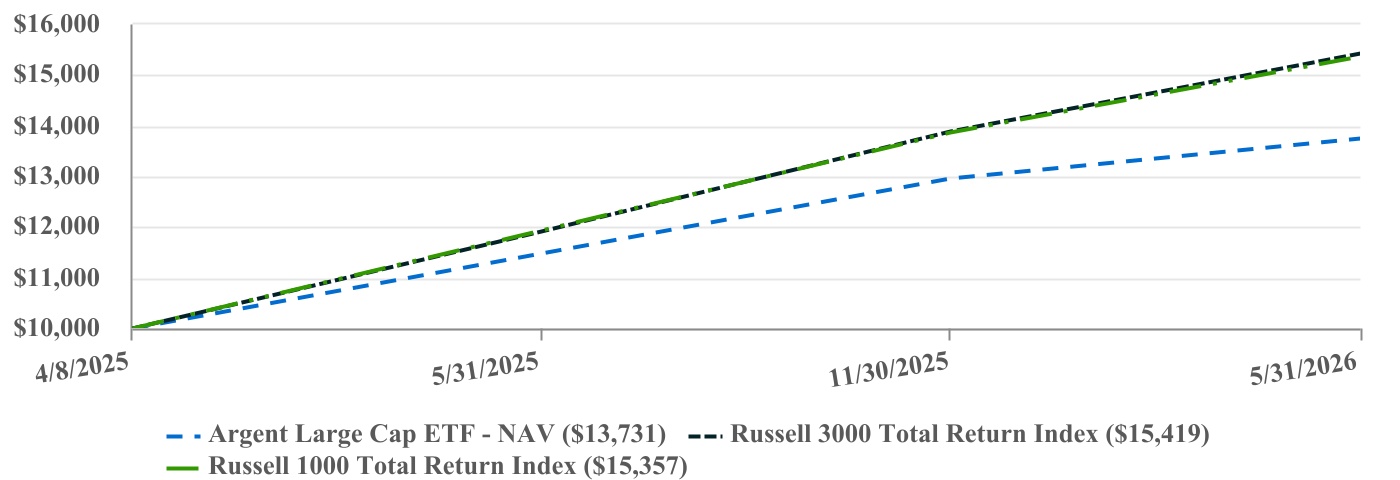
| PERFORMANCE | |||||||||||
One Year | Since Inception (4/8/2025) | ||||||||||
| Argent Large Cap ETF - NAV | 19.74% | 31.90% | |||||||||
| Russell 3000 Total Return Index | 29.45% | 45.96% | |||||||||
| Russell 1000 Total Return Index | 28.85% | 45.44% | |||||||||
| The Russell 3000 Total Return Index is provided as a broad measure of market performance. The Russell 1000 Total Return Index is provided as a measure of the Fund's investment strategy and universe. | |||||||||||
The Fund’s past performance is not a good predictor of how the Fund will perform in the future. The graph and table do not reflect the deduction of taxes that a shareholder would pay on Fund distributions or redemption of Fund shares. | |||||||||||
Visit https://argentetfs.com/abig/ for more recent performance information. | |||||||||||
| KEY FUND STATISTICS (as of Period End) | ||||||||||||||||||||
| Net Assets | $55,676,367 | Portfolio Turnover Rate* | 25% | |||||||||||||||||
| # of Portfolio Holdings | 30 | Fund Advisory Fees | $192,566 | |||||||||||||||||
*Portfolio turnover is not annualized and is calculated without regard to short-term securities having a maturity of less than one year. Excludes impact of in-kind transactions. | ||||||||||||||||||||
| SECTOR WEIGHTING (as a % of Net Assets) | |||||
| Information Technology | 35.5% | ||||
| Consumer Discretionary | 14.7% | ||||
| Industrials | 13.0% | ||||
| Communication Services | 12.0% | ||||
| Financials | 10.0% | ||||
| Health Care | 7.3% | ||||
| Energy | 2.3% | ||||
| Utilities | 1.3% | ||||
| Consumer Staples | 1.2% | ||||
| Cash and Cash Equivalents | 2.7% | ||||
| TOP 10 HOLDINGS (as a % of Net Assets) | |||||
| Amazon.com, Inc. | 9.9% | ||||
| Alphabet, Inc. - Class A | 9.6% | ||||
| NVIDIA Corp. | 9.5% | ||||
| Microsoft Corp. | 6.7% | ||||
| Broadcom, Inc. | 4.7% | ||||
| TransDigm Group, Inc. | 4.3% | ||||
| Applied Materials, Inc. | 4.1% | ||||
| Apple, Inc. | 3.9% | ||||
| United Rentals, Inc. | 3.8% | ||||
| Dell Technologies, Inc. | 3.8% | ||||
This annual shareholder report contains important information about the Argent Mid Cap ETF (the “Fund”) for the period of June 1, 2025 to May 31, 2026 (the “Period”). You can find additional information about the Fund at https://argentetfs.com/amid/. You can also request this information by contacting us at (215) 330-4476. For information regarding your Fund shares or account, including account balances, transactions, or distributions, please contact your financial intermediary. | |||||||||||
Availability of Additional Information
For additional information about the Fund, including its prospectus, financial information, holdings, and proxy information, visit https://argentetfs.com/amid/. You can also request information by calling (215) 330-4476.
Householding
Householding is an option available to certain investors of the Fund. Householding is a method of delivery, based on the preference of the individual investor, in which a single copy of certain shareholder documents can be delivered to investors who share the same address, even if their accounts are registered under different names. Householding for the Fund is available through certain broker-dealers. If you are interested in enrolling in householding and receiving a single copy of prospectuses and other shareholder documents or you are currently enrolled in householding and wish to change your householding status, please contact your broker-dealer.
| WHAT WERE THE FUND COSTS FOR THE PERIOD? (based on a hypothetical $10,000 investment) | |||||||||||
| COST OF $10,000 INVESTMENT | COST PAID AS A PERCENTAGE OF $10,000 INVESTMENT | ||||||||||
| $54 | 0.52% | ||||||||||
| WHAT FACTORS INFLUENCED PERFORMANCE FOR THE PERIOD? | |||||||||||
Performance Summary
For the 12-month period ended May 31, 2026, the Fund returned 7.51% versus 22.37% for the Russell Midcap Total Return Index, underperforming by 1,486 basis points net of fees. The Fund invests in mid cap companies that meet the Sub-Adviser’s strict criteria of an enduring business with alignment between a positive quantitative score generated by the Argent Alpha Model and deep dive fundamental research. In addition to portfolio specific headwinds outlined below, the stock market’s preference for lower quality stocks starting at the Liberation Day lows in April 2025 was an additional headwind for the Fund.
Top Performance Contributors
Our allocation to specific sectors is driven by stock selection. Allocation effects were positive for the period primarily due to the overweight in the Technology sector and underweight in traditionally defensive sectors that underperformed, including Consumer Staples, Real Estate, and Utilities. From a stock selection perspective, Comfort Systems USA in the Consumer Discretionary sector was a top contributor, supported by surging demand for equipment needed to support the artificial intelligence buildout.
Top Performance Detractors
Our allocation to specific sectors is driven by stock selection. Underperformance was driven by negative stock selection effects in the Technology sector and to a lesser extent, the Financials sector.
Technology – Negative sentiment and AI displacement fears pressured the software industry and our positions in Tyler Technologies, Manhattan Associates, and Descartes Systems Group felt the effects despite robust financial performance.
Financials – LPL Financial and other brokerage platforms faced AI-displacement fears, while Houlihan Lokey and other alternative managers faced several headwinds, including concerns on private credit exposure.
| HOW DID THE FUND PERFORM FOR THE PERIOD? | |||||||||||
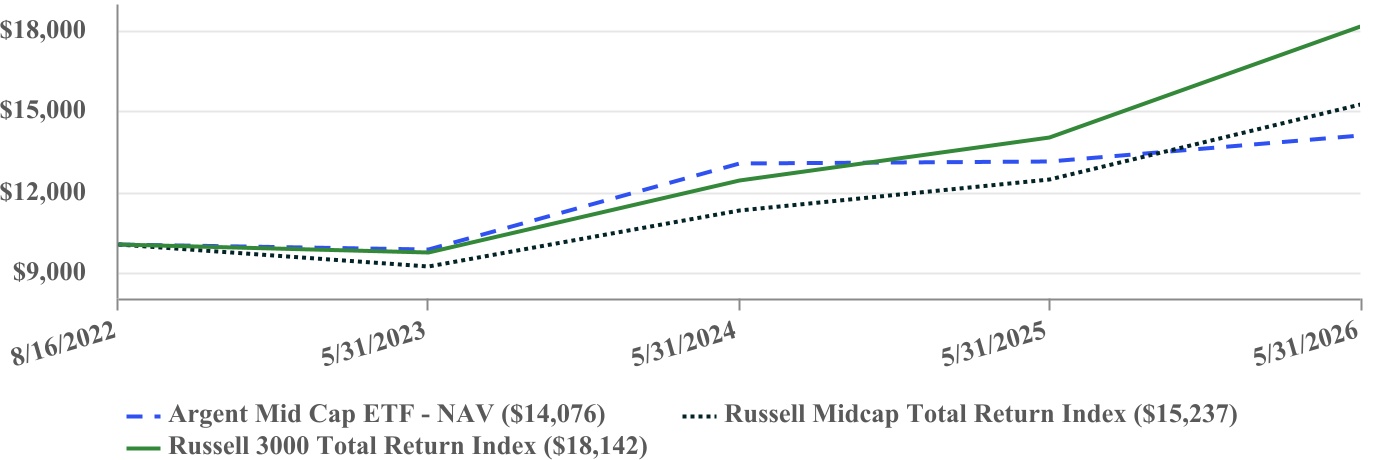
| PERFORMANCE | ||||||||||||||
| One Year | Since Inception (8/16/2022) | |||||||||||||
| Argent Mid Cap ETF - NAV | 7.51% | 9.44% | ||||||||||||
| Russell 3000 Total Return Index | 29.45% | 17.02% | ||||||||||||
| Russell Midcap Total Return Index | 22.37% | 11.76% | ||||||||||||
| The Russell 3000 Total Return Index is provided as a broad measure of market performance. The Russell Midcap Total Return Index is provided as a measure of the Fund's investment strategy and universe. | ||||||||||||||
The Fund’s past performance is not a good predictor of how the Fund will perform in the future. The graph and table do not reflect the deduction of taxes that a shareholder would pay on Fund distributions or redemption of Fund shares. | ||||||||||||||
Visit https://argentetfs.com/amid/ for more recent performance information. | ||||||||||||||
| KEY FUND STATISTICS (as of Period End) | ||||||||||||||||||||
| Net Assets | $105,000,592 | Portfolio Turnover Rate* | 58% | |||||||||||||||||
| # of Portfolio Holdings | 44 | Fund Advisory Fees | $547,107 | |||||||||||||||||
*Portfolio turnover is not annualized and is calculated without regard to short-term securities having a maturity of less than one year. Excludes impact of in-kind transactions. | ||||||||||||||||||||
| SECTOR WEIGHTING (as a % of Net Assets) | |||||
| Industrials | 34.0% | ||||
| Information Technology | 22.1% | ||||
| Financials | 15.2% | ||||
| Consumer Discretionary | 6.8% | ||||
| Health Care | 6.5% | ||||
| Energy | 3.9% | ||||
| Materials | 3.6% | ||||
| Utilities | 2.5% | ||||
| Consumer Staples | 2.3% | ||||
| Cash and Cash Equivalents | 3.1% | ||||
| TOP 10 HOLDINGS (as a % of Net Assets) | |||||
| Comfort Systems USA, Inc. | 4.4% | ||||
| Victory Capital Holdings, Inc. - Class A | 4.0% | ||||
| Fortinet, Inc. | 3.8% | ||||
| Monolithic Power Systems, Inc. | 3.5% | ||||
| United Rentals, Inc. | 2.9% | ||||
| Vertiv Holdings Co. - Class A | 2.7% | ||||
| Medpace Holdings, Inc. | 2.7% | ||||
| Fabrinet | 2.6% | ||||
| LPL Financial Holdings, Inc. | 2.6% | ||||
| UL Solutions, Inc. | 2.6% | ||||