Shareholder Report
Nov. 30, 2025
May 31, 2026
USD ($)
holding
This annual shareholder report contains important information about the Draco Evolution AI ETF (the “Fund”) for the period of June 1, 2025 to May 31, 2026 (the “Period”). You can find additional information about the Fund at https://draietf.com/etf/. You can also request this information by contacting us at (215) 330-4476. For information regarding your Fund shares or account, including account balances, transactions, or distributions, please contact your financial intermediary. | |||||||||||
Availability of Additional Information
For additional information about the Fund, including its prospectus, financial information, holdings, and proxy information, visit https://draietf.com/etf/. You can also request information by calling (215) 330-4476.
Householding
Householding is an option available to certain investors of the Fund. Householding is a method of delivery, based on the preference of the individual investor, in which a single copy of certain shareholder documents can be delivered to investors who share the same address, even if their accounts are registered under different names. Householding for the Fund is available through certain broker-dealers. If you are interested in enrolling in householding and receiving a single copy of prospectuses and other shareholder documents or you are currently enrolled in householding and wish to change your householding status, please contact your broker-dealer.
| WHAT WERE THE FUND COSTS FOR THE PERIOD? (based on a hypothetical $10,000 investment) | |||||||||||
| COST OF $10,000 INVESTMENT | COST PAID AS A PERCENTAGE OF $10,000 INVESTMENT | ||||||||||
| $104 | 0.85% | ||||||||||
| WHAT FACTORS INFLUENCED PERFORMANCE FOR THE PERIOD? | |||||||||||
Management’s Discussion of Fund Performance
The DRAI ETF (the “Fund”) returned 44.57% for the Period. In comparison, the Solactive GBS United States 1000 Total Return Index gained 29.45%, respectively, over the same period. During the Period, the Fund used its AI-powered, multi-asset allocation process that seeks attractive risk-adjusted opportunities and rotated actively between risk-on and risk-off positions in response to changing market conditions, consistent with the Fund’s stated investment strategy and mandate.
•Monetary policy – The Federal Reserve entered the fiscal year having cut rates three times in late 2025. Tariff-driven inflation and a firm labor market led the Fed to pause further easing from January 2026 onward. The Fund kept a cash or its equivalent buffer in place through the first half of the 2026, which proved useful as rate-cut expectations were walked back by the market.
•AI-sector correction – Investor concern over the pace and return profile of AI infrastructure spending drove a sharp selloff in technology stocks beginning in Q4 2025. AI-infrastructure companies faced particular pressure as their capital commitments outpaced near-term revenue visibility. The Fund reduced its leveraged-equity exposure and shifted into Treasuries, gold, and cash before the worst of the selling, which limited its drawdown relative to the benchmark and preserved capital for redeployment as the market stabilized.
•Middle East conflict and energy markets – U.S.- Iran conflict in late February 2026 created a sharp and sustained period of market stress. Iran’s closure of the Strait of Hormuz pushed energy prices sharply higher and weighed on equities broadly for the following six weeks. The Fund reduced equity exposure and added positions in Treasuries, gold, and the U.S. dollar. The resulting energy shock also pushed inflation higher and shifted market expectations from further rate cuts to possible hikes. When a provisional ceasefire was reached in early April 2026 and markets recovered, the Fund rotated back into growth and broad-market equities. The Fund outperformed the benchmark both during the drawdown and in the subsequent recovery.
•Year-end positioning – After the ceasefire and a gradual reopening of Strait of Hormuz shipping, broader risk appetite returned. The Fund rotated back into growth and higher-beta equity themes. The Fund ended the fiscal year with a predominantly equity-oriented allocation, in line with the model’s signal.
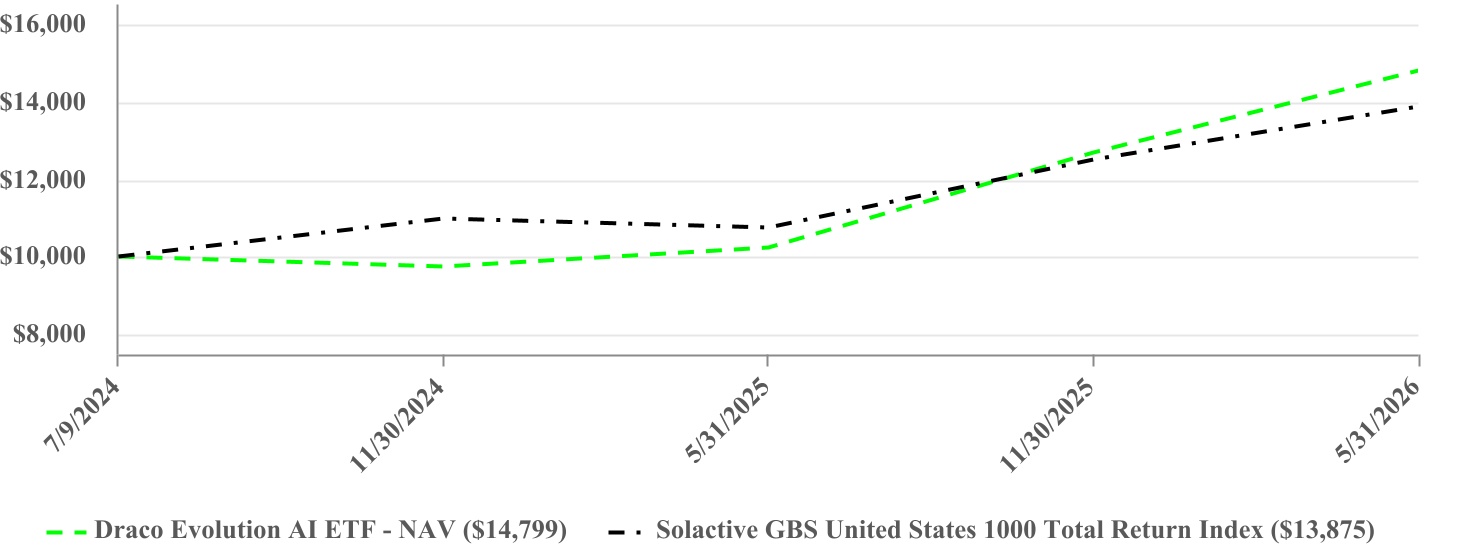
| PERFORMANCE | |||||||||||
| One Year | Since Inception (7/9/2024) | ||||||||||
| Draco Evolution AI ETF - NAV | 44.57% | 23.00% | |||||||||
| Solactive GBS United States 1000 Total Return Index | 29.45% | 19.33% | |||||||||
The Fund’s past performance is not a good predictor of how the Fund will perform in the future. The graph and table do not reflect the deduction of taxes that a shareholder would pay on fund distributions or redemption of fund shares. Visit https://draietf.com/etf/ for more recent performance information. | |||||||||||
| KEY FUND STATISTICS (as of Period End) | ||||||||||||||||||||
| Net Assets | $23,523,032 | Fund Advisory Fees | $164,752 | |||||||||||||||||
| # of Portfolio Holdings | 9 | Portfolio Turnover Rate* | 1,741% | |||||||||||||||||
| *Portfolio turnover is not annualized and is calculated without regard to short-term securities having a maturity of less than one year. Excludes impact of in-kind transactions. | ||||||||||||||||||||
| INVESTMENT WEIGHTING (as a % of Net Assets) | |||||
| Fixed Income ETFs | 41.1% | ||||
| Leveraged Equity ETFs | 39.2% | ||||
| Cash and Cash Equivalents | 19.7% | ||||
| TOP HOLDINGS (as a % of Net Assets) | |||||
| ProShares UltraPro QQQ | 17.0% | ||||
| Direxion Daily S&P 500 Bull 3X ETF | 16.8% | ||||
| iShares 7-10 Year Treasury Bond ETF | 13.7% | ||||
| Vanguard Total Bond Market ETF | 13.7% | ||||
| iShares iBoxx USD High Yield Corporate Bond ETF | 13.7% | ||||
| ProShares UltraPro Dow30 | 1.9% | ||||
| Direxion Daily Small Cap Bull 3X ETF | 1.8% | ||||
| Direxion Daily Semiconductor Bull 3X ETF | 1.8% | ||||