Shareholder Report
May 31, 2026
USD ($)
holding
This annual shareholder report contains important information about the EA Astoria Beacon Dynamic Core US Fixed Income ETF (the “Fund”) for the period of June 1, 2025 to May 31, 2026 (the “Period”). You can find additional information about the Fund at https://astoriaadvisorsetfs.com/agga/. You can also request this information by contacting us at (215) 330-4476. For information regarding your Fund shares or account, including account balances, transactions, or distributions, please contact your financial intermediary. This report describes changes to the Fund that occurred during the reporting period. | |||||||||||
For additional information about the Fund, including its prospectus, financial information, holdings, and proxy information, visit https://astoriaadvisorsetfs.com/agga/. You can also request information by calling (215) 330-4476.
Householding
Householding is an option available to certain investors of the Fund. Householding is a method of delivery, based on the preference of the individual investor, in which a single copy of certain shareholder documents can be delivered to investors who share the same address, even if their accounts are registered under different names. Householding for the Fund is available through certain broker-dealers. If you are interested in enrolling in householding and receiving a single copy of prospectuses and other shareholder documents or you are currently enrolled in householding and wish to change your householding status, please contact your broker-dealer.
| WHAT WERE THE FUND COSTS FOR THE PERIOD? (based on a hypothetical $10,000 investment) | |||||||||||
| COST OF $10,000 INVESTMENT | COST PAID AS A PERCENTAGE OF $10,000 INVESTMENT | ||||||||||
| $49 | 0.48% | ||||||||||
| WHAT FACTORS INFLUENCED PERFORMANCE FOR THE PERIOD? | |||||||||||
The Fund returned 4.93% during the Period. The Fund operates as a “fund of funds” and allocates its assets among other U.S. fixed income funds that invest in a variety of fixed income sectors. Corporate credit contributed the largest positive impact to performance, driven by investment grade and high yield corporate bond holdings supported by coupon income, stable credit fundamentals, and tight credit spreads. Treasury holdings across the curve also contributed to performance, supported by declining interest rates following Federal Reserve policy rate reductions in late 2025. Securitized credit, collateralized loan obligation (CLO), and floating-rate allocations contributed modestly to performance. All fixed-income categories within the Fund contributed positively to performance during the Period. The Fund had no meaningful detractors during the period. The strategy carries risk and past results may not repeat.
Below were the largest contributors to Fund performance. The SPDR Portfolio Intermediate Term Corporate Bond ETF (SPIB) gained substantially during the period overall and accounted for a meaningful portion of the Fund’s performance.
| Largest Contributors | Sector | ||||
| SPDR Portfolio Intermediate Term Corporate Bond ETF (SPIB) | Investment Grade Corporates | ||||
| iShares 5-10 Year Investment Grade Corporate Bond ETF (IGIB) | Investment Grade Corporates | ||||
| Schwab High Yield Bond ETF (SCYB) | High Yield Corporates | ||||
| JPMorgan BetaBuilders USD High Yield Corporate Bond ETF (BBHY) | High Yield Corporates | ||||
| BondBloxx Bloomberg One Year Target Duration US Treasury ETF (XONE) | Short Term Treasuries | ||||
| HOW DID THE FUND PERFORM FOR THE PERIOD? | |||||||||||
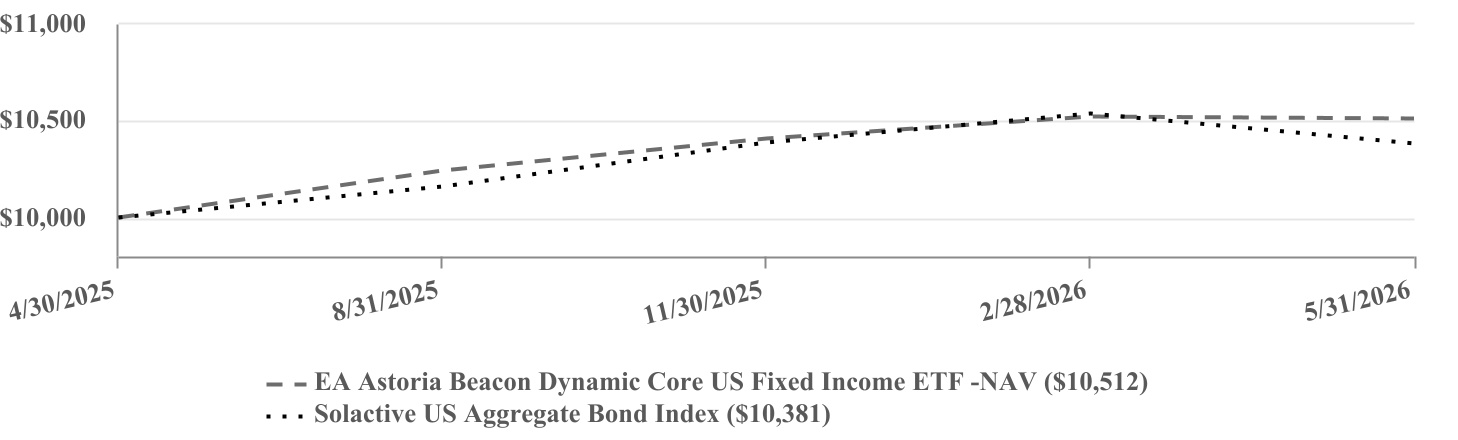
| PERFORMANCE | ||||||||||||||
| One Year | Since Inception (4/30/2025) | |||||||||||||
| EA Astoria Beacon Dynamic Core US Fixed Income ETF - NAV | 4.93% | 4.71% | ||||||||||||
| Solactive US Aggregate Bond Index | 4.64% | 3.50% | ||||||||||||
The Fund’s past performance is not a good predictor of how the Fund will perform in the future. The graph and table do not reflect the deduction of taxes that a shareholder would pay on fund distributions or redemption of fund shares. | ||||||||||||||
Visit https://astoriaadvisorsetfs.com/agga/ for more recent performance information. | ||||||||||||||
| KEY FUND STATISTICS (as of Period End) | ||||||||||||||||||||
| Net Assets | $83,563,465 | Portfolio Turnover Rate* | 25% | |||||||||||||||||
| # of Portfolio Holdings | 16 | Fund Advisory Fees | $297,295 | |||||||||||||||||
*Portfolio turnover is not annualized and is calculated without regard to short-term securities having a maturity of less than one year. Excludes impact of in-kind transactions. | ||||||||||||||||||||
INVESTMENT WEIGHTING (as a % of Net Assets) | TOP 10 HOLDINGS (as a % of Net Assets) | |||||||||||||||||||
Corporate Bond and Other Fixed Income ETFs | 59.6% | State Street SPDR Portfolio Intermediate Term Corporate Bond ETF | 15.0% | |||||||||||||||||
U.S. Treasury ETFs | 40.2% | iShares 5-10 Year Investment Grade Corporate Bond ETF | 12.1% | |||||||||||||||||
| Money Market Funds | 0.2% | BondBloxx Bloomberg One Year Target Duration US Treasury ETF | 11.8% | |||||||||||||||||
| State Street SPDR Portfolio Short Term Treasury ETF | 9.8% | |||||||||||||||||||
| BondBloxx Bloomberg Seven Year Target Duration US Treasury ETF | 7.5% | |||||||||||||||||||
| JPMorgan BetaBuilders USD High Yield Corporate Bond ETF | 7.0% | |||||||||||||||||||
| Janus Henderson AAA CLO ETF | 6.9% | |||||||||||||||||||
| BondBloxx Bloomberg Ten Year Target Duration US Treasury ETF | 5.9% | |||||||||||||||||||
| State Street SPDR Portfolio High Yield Bond ETF | 5.0% | |||||||||||||||||||
| State Street SPDR Bloomberg Investment Grade Floating Rate ETF | 5.0% | |||||||||||||||||||
This annual shareholder report contains important information about the Astoria US Equal Weight Quality Kings ETF (the “Fund”) for the period of June 1, 2025 to May 31, 2026 (the “Period”). You can find additional information about the Fund at https://astoriaadvisorsetfs.com/roe/. You can also request this information by contacting us at (215) 330-4476. For information regarding your Fund shares or account, including account balances, transactions, or distributions, please contact your financial intermediary. | |||||||||||
Availability of Additional Information
For additional information about the Fund, including its prospectus, financial information, holdings, and proxy information, visit https://astoriaadvisorsetfs.com/roe/. You can also request information by calling (215) 330-4476.
Householding
Householding is an option available to certain investors of the Fund. Householding is a method of delivery, based on the preference of the individual investor, in which a single copy of certain shareholder documents can be delivered to investors who share the same address, even if their accounts are registered under different names. Householding for the Fund is available through certain broker-dealers. If you are interested in enrolling in householding and receiving a single copy of prospectuses and other shareholder documents or you are currently enrolled in householding and wish to change your householding status, please contact your broker-dealer.
| WHAT WERE THE FUND COSTS FOR THE PERIOD? (based on a hypothetical $10,000 investment) | |||||||||||
| COST OF $10,000 INVESTMENT | COST PAID AS A PERCENTAGE OF $10,000 INVESTMENT | ||||||||||
| $58 | 0.49% | ||||||||||
| WHAT FACTORS INFLUENCED PERFORMANCE FOR THE PERIOD? | |||||||||||
The Fund returned 37.71% during the Period. The Fund primarily invests in common stock principally traded in the U.S. of companies that the Sub-Adviser believes exhibit robust quality characteristics with attractive valuations and dividend paying potential. Information Technology contributed the largest positive impact to performance, driven by holdings in memory, data storage, and semiconductor equipment companies benefiting from artificial intelligence-related demand and datacenter capital investment. Industrials also contributed positively, led by holdings tied to datacenter construction as well as electrical and cooling infrastructure. Software and Information Technology services holdings, including Accenture, Adobe, and Cognizant, detracted from performance due to share price declines associated with concerns regarding the impact of artificial intelligence adoption on demand for certain services. Financials detracted from performance, as losses in insurance and payment network holdings outweighed gains in bank and consumer finance holdings. Period returns also reflected interest rate movements, including evolving expectations around the Federal Reserve’s policy path, and episodic geopolitical volatility associated with conflicts in the Middle East, though corporate earnings remained supportive of risk assets.
Below are the largest contributors and detractors to fund performance. Western Digital Corporation gained the most for the period overall and accounted for a significant portion of the Fund’s overall performance.
| Largest Contributors | Sector | ||||
| Western Digital Corporation | Information Technology | ||||
| Micron Technology, Inc. | Information Technology | ||||
| Seagate Technology Holdings PLC | Information Technology | ||||
| Comfort Systems USA, Inc. | Industrials | ||||
| Lam Research Corporation | Information Technology | ||||
The largest detractor was Charter Communications, Inc., which fell substantially for the period overall and detracted from the Fund’s overall performance.
| Largest Detractors | Sector | ||||
| Charter Communications, Inc. Class A | Communication Services | ||||
| Kyndryl Holdings Inc. | Information Technology | ||||
| Accenture Plc Class A | Information Technology | ||||
| Adobe Inc. | Information Technology | ||||
| Domino’s Pizza, Inc. | Consumer Discretionary | ||||
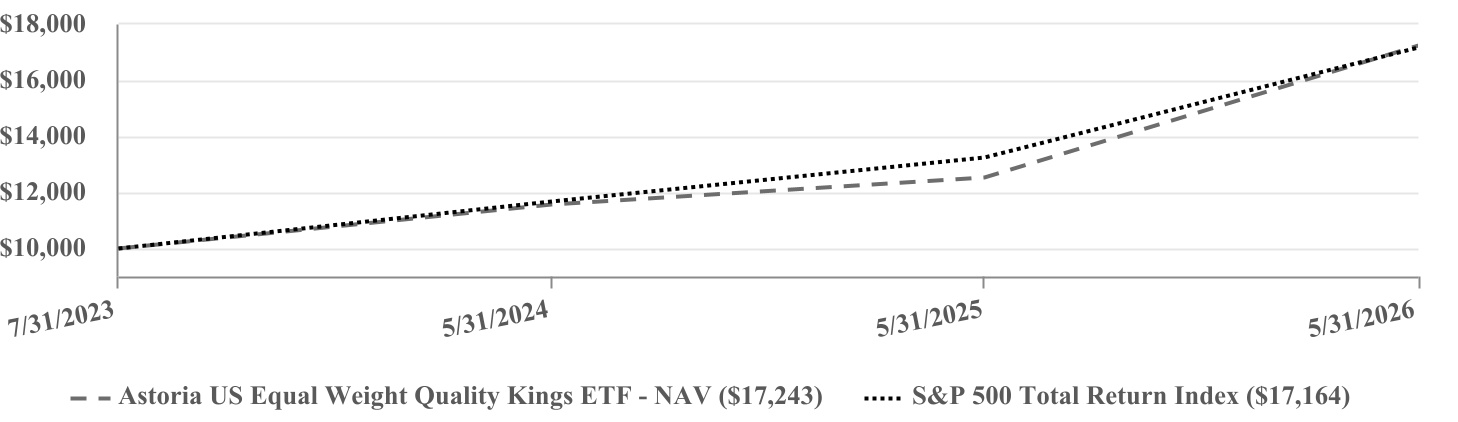
| PERFORMANCE | |||||||||||
| One Year | Since Inception (7/31/2023) | ||||||||||
| Astoria US Equal Weight Quality Kings ETF - NAV | 37.71% | 21.18% | |||||||||
| S&P 500 Total Return Index | 29.78% | 20.99% | |||||||||
The Fund’s past performance is not a good predictor of how the Fund will perform in the future. The graph and table do not reflect the deduction of taxes that a shareholder would pay on fund distributions or redemption of fund shares. | |||||||||||
Visit https://astoriaadvisorsetfs.com/roe/ for more recent performance information. | |||||||||||
| KEY FUND STATISTICS (as of Period End) | ||||||||||||||||||||
| Net Assets | $260,326,229 | Portfolio Turnover Rate* | 58% | |||||||||||||||||
| # of Portfolio Holdings | 101 | Fund Advisory Fees | $929,297 | |||||||||||||||||
*Portfolio turnover is not annualized and is calculated without regard to short-term securities having a maturity of less than one year. Excludes impact of in-kind transactions. | ||||||||||||||||||||
| SECTOR WEIGHTING (as a % of Net Assets) | |||||
| Information Technology | 41.6% | ||||
| Financials | 10.6% | ||||
| Communication Services | 9.1% | ||||
| Consumer Discretionary | 8.9% | ||||
| Industrials | 8.7% | ||||
| Health Care | 8.1% | ||||
| Consumer Staples | 4.2% | ||||
| Energy | 3.2% | ||||
| Utilities | 2.0% | ||||
| Real Estate | 1.8% | ||||
| Materials | 1.7% | ||||
| Cash and Cash Equivalents | 0.1% | ||||
| TOP 10 HOLDINGS (as a % of Net Assets) | |||||
| Dell Technologies, Inc. - Class C | 2.2% | ||||
| Credo Technology Group Holding Ltd. | 1.7% | ||||
| Micron Technology, Inc. | 1.6% | ||||
| QUALCOMM, Inc. | 1.6% | ||||
| Seagate Technology Holdings PLC | 1.5% | ||||
| Sanmina Corp. | 1.4% | ||||
| Western Digital Corp. | 1.4% | ||||
| NetApp, Inc. | 1.4% | ||||
| Fortinet, Inc. | 1.4% | ||||
| NXP Semiconductors NV | 1.4% | ||||
This annual shareholder report contains important information about the Astoria US Quality Growth Kings ETF (the “Fund”) for the period of June 1, 2025 to May 31, 2026 (the “Period”). You can find additional information about the Fund at https://astoriaadvisorsetfs.com/gqqq/. You can also request this information by contacting us at (215) 330-4476. For information regarding your Fund shares or account, including account balances, transactions, or distributions, please contact your financial intermediary. | |||||||||||
Availability of Additional Information
For additional information about the Fund, including its prospectus, financial information, holdings, and proxy information, visit https://astoriaadvisorsetfs.com/gqqq/. You can also request information by calling (215) 330-4476.
Householding
Householding is an option available to certain investors of the Fund. Householding is a method of delivery, based on the preference of the individual investor, in which a single copy of certain shareholder documents can be delivered to investors who share the same address, even if their accounts are registered under different names. Householding for the Fund is available through certain broker-dealers. If you are interested in enrolling in householding and receiving a single copy of prospectuses and other shareholder documents or you are currently enrolled in householding and wish to change your householding status, please contact your broker-dealer.
| WHAT WERE THE FUND COSTS FOR THE PERIOD? (based on a hypothetical $10,000 investment) | |||||||||||
| COST OF $10,000 INVESTMENT | COST PAID AS A PERCENTAGE OF $10,000 INVESTMENT | ||||||||||
| $42 | 0.35% | ||||||||||
| WHAT FACTORS INFLUENCED PERFORMANCE FOR THE PERIOD? | |||||||||||
The Fund returned 41.81% during the Period. The Fund primarily invests in common stock principally traded in the U.S. that the Sub-Adviser believes has the potential for growth. Information Technology contributed the largest positive impact to performance, driven by holdings in memory, semiconductor, and semiconductor equipment companies benefiting from artificial intelligence-related demand and datacenter capital investment. Communication Services and Industrials also contributed positively, supported by exposure to AI and cloud-related demand and to datacenter and electrical infrastructure investment. Software holdings, including Adobe, detracted from performance due to share price declines associated with concerns regarding the impact of artificial intelligence on demand for certain products and services. Media holdings, including Netflix and Charter Communications, also detracted due to weaker subscriber and operating trends. Financials detracted from performance, as losses in insurance and payment network holdings outweighed gains in other financial subsectors. Period returns also reflected interest rate movements, including evolving expectations around the Federal Reserve’s policy path, and episodic geopolitical volatility associated with conflicts in the Middle East, though corporate earnings remained supportive of risk assets.
Below are the largest contributors and detractors to fund performance. Micron Technology, Inc. gained substantially during the period overall and accounted for a significant portion of the Fund’s performance.
| Largest Contributors | Sector | ||||
| Micron Technology, Inc. | Information Technology | ||||
| Alphabet Inc. Class A | Communication Services | ||||
| NVIDIA Corporation | Information Technology | ||||
| Apple Inc. | Information Technology | ||||
| Broadcom Inc. | Information Technology | ||||
The largest detractor was Netflix, Inc., which marginally impacted the Fund’s overall performance.
| Largest Detractors | Sector | ||||
| Netflix, Inc. | Communication Services | ||||
| Adobe Inc. | Information Technology | ||||
| Charter Communications, Inc. Class A | Communication Services | ||||
| Automatic Data Processing, Inc. | Industrials | ||||
| Progressive Corporation | Financials | ||||
| HOW DID THE FUND PERFORM FOR THE PERIOD? | |||||||||||
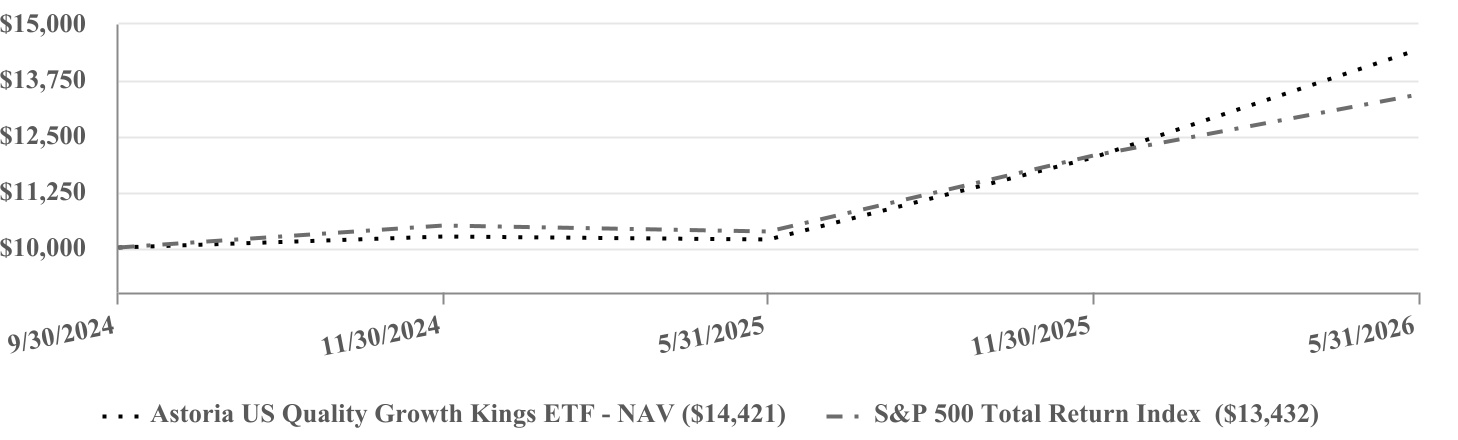
| PERFORMANCE | ||||||||||||||
| One Year | Since Inception (9/30/2024) | |||||||||||||
| Astoria US Quality Growth Kings ETF - NAV | 41.81% | 24.58% | ||||||||||||
| S&P 500 Total Return Index | 29.78% | 19.38% | ||||||||||||
The Fund’s past performance is not a good predictor of how the Fund will perform in the future. The graph and table do not reflect the deduction of taxes that a shareholder would pay on fund distributions or redemption of fund shares. | ||||||||||||||
Visit https://astoriaadvisorsetfs.com/gqqq/ for more recent performance information. | ||||||||||||||
| KEY FUND STATISTICS (as of Period End) | ||||||||||||||||||||
| Net Assets | $145,205,052 | Portfolio Turnover Rate* | 32% | |||||||||||||||||
| # of Portfolio Holdings | 102 | Fund Advisory Fees | $352,839 | |||||||||||||||||
*Portfolio turnover is not annualized and is calculated without regard to short-term securities having a maturity of less than one year. Excludes impact of in-kind transactions. | ||||||||||||||||||||
| SECTOR WEIGHTING (as a % of Net Assets) | |||||
| Information Technology | 50.1% | ||||
| Communication Services | 11.6% | ||||
| Consumer Discretionary | 9.7% | ||||
| Industrials | 7.0% | ||||
| Health Care | 5.7% | ||||
| Consumer Staples | 5.3% | ||||
| Financials | 5.1% | ||||
| Energy | 1.8% | ||||
| Materials | 1.5% | ||||
| Utilities | 1.5% | ||||
| Real Estate | 0.6% | ||||
| Cash and Cash Equivalents | 0.1% | ||||
| TOP 10 HOLDINGS (as a % of Net Assets) | |||||
| NVIDIA Corp. | 8.1% | ||||
| Apple, Inc. | 7.5% | ||||
| Microsoft Corp. | 5.1% | ||||
| Micron Technology, Inc. | 4.2% | ||||
| Amazon.com, Inc. | 4.0% | ||||
| Broadcom, Inc. | 3.9% | ||||
| Alphabet, Inc. - Class A | 3.9% | ||||
| Alphabet, Inc. - Class C | 2.9% | ||||
| Advanced Micro Devices, Inc. | 2.7% | ||||
| Meta Platforms, Inc. | 2.6% | ||||