Shareholder Report
Nov. 30, 2025
May 31, 2026
USD ($)
holding
This annual shareholder report contains important information about the AOT Growth and Innovation ETF (the “Fund”) for the period of June 1, 2025 to May 31, 2026 (the “Period”). You can find additional information about the Fund at https://aotetf.com/aotg/. You can also request this information by contacting us at (215) 330-4476. For information regarding your Fund shares or account, including account balances, transactions, or distributions, please contact your financial intermediary. This report describes changes to the Fund that occurred during the reporting period. | |||||||||||
Availability of Additional Information
For additional information about the Fund, including its prospectus, financial information, holdings, and proxy information, visit https://aotetf.com/aotg/. You can also request information by calling (215) 330-4476.
Householding
Householding is an option available to certain investors of the Fund. Householding is a method of delivery, based on the preference of the individual investor, in which a single copy of certain shareholder documents can be delivered to investors who share the same address, even if their accounts are registered under different names. Householding for the Fund is available through certain broker-dealers. If you are interested in enrolling in householding and receiving a single copy of prospectuses and other shareholder documents or you are currently enrolled in householding and wish to change your householding status, please contact your broker-dealer.
| WHAT WERE THE FUND COSTS FOR THE PERIOD? (based on a hypothetical $10,000 investment) | |||||||||||
| COST OF $10,000 INVESTMENT | COST PAID AS A PERCENTAGE OF $10,000 INVESTMENT | ||||||||||
| $91 | 0.75% | ||||||||||
| WHAT FACTORS INFLUENCED PERFORMANCE FOR THE PERIOD? | |||||||||||
The Fund significantly outperformed its benchmark indexes over the Period. The Fund’s strong performance was tied to the appreciation of its basket of low marginal cost, high growth companies across multiple sectors. The Fund invests in high growth, low marginal cost companies in sectors including Semiconductors and Software, as additional sales in these sectors often come at higher profit margins.
The Semiconductor sector was the Fund’s largest contributor during the Period, benefiting from robust demand for the graphics processing units (GPUs), central processing units (CPUs), and memory, required to power Agentic AI computing.
The Software sector was the Fund’s largest detractor, as fears of AI disruption lowering barriers to entry in the software market drove a broad selloff across the sector. The Fund’s outsized returns were driven primarily by growth-oriented tech names aligned with the Fund’s themes, including artificial intelligence and robust corporate earnings. Meanwhile, volatility increased at times due to the U.S. - Iran conflict and changing future Hyperscaler CAPEX projections.
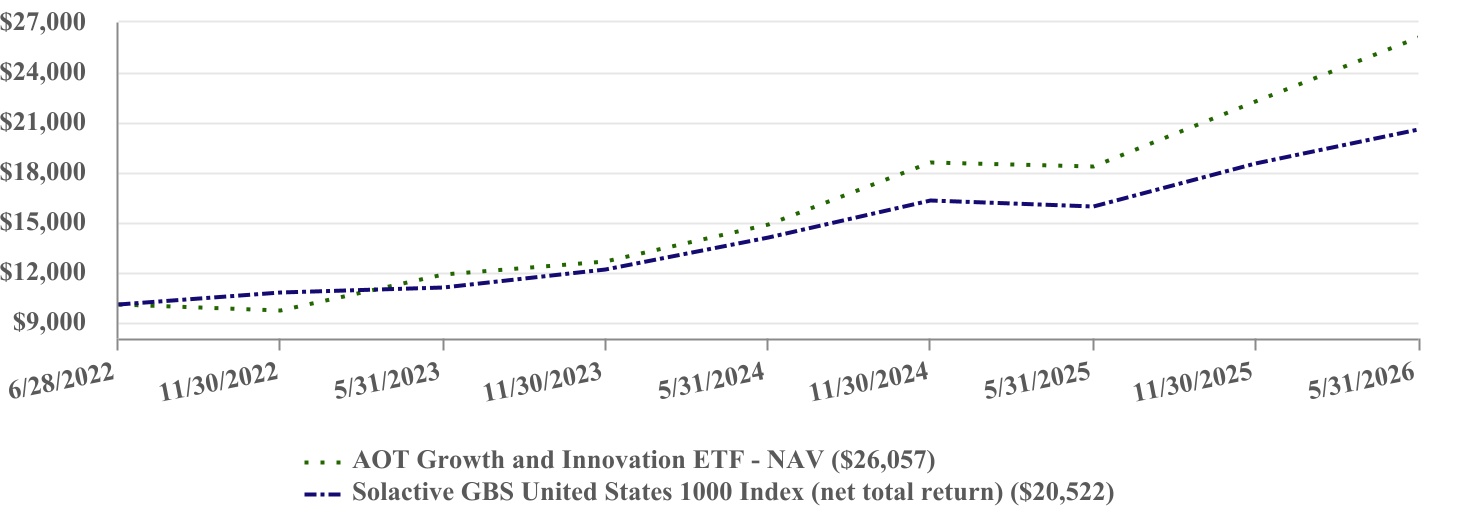
| PERFORMANCE | ||||||||||||||
| One Year | Since Inception (6/28/2022) | |||||||||||||
| AOT Growth and Innovation ETF - NAV | 42.39% | 27.65% | ||||||||||||
| Solactive GBS United States 1000 Index (net total return) | 28.99% | 20.11% | ||||||||||||
The Fund’s past performance is not a good predictor of how the Fund will perform in the future. The graph and table do not reflect the deduction of taxes that a shareholder would pay on fund distributions or redemption of fund shares. Net total return figures assume the reinvestment of dividends after deduction of withholding tax, applying the maximum rate to nonresident individual investors who do not benefit from double taxation treaties. | ||||||||||||||
Visit https://aotetf.com/aotg/ for more recent performance information. | ||||||||||||||
| KEY FUND STATISTICS (as of Period End) | ||||||||||||||||||||
| Net Assets | $104,877,956 | Fund Advisory Fees | $590,052 | |||||||||||||||||
| # of Portfolio Holdings | 42 | Fees Waived and/or Expenses Reimbursed | $(78) | |||||||||||||||||
| Portfolio Turnover Rate* | 31% | Net Fund Advisory Fees | $589,974 | |||||||||||||||||
| *Portfolio turnover is not annualized and is calculated without regard to short-term securities having a maturity of less than one year. Excludes impact of in-kind transactions. | ||||||||||||||||||||
| SECTOR WEIGHTING (as a % of Net Assets) | |||||
| Information Technology | 67.5% | ||||
| Financials | 14.8% | ||||
| Communication Services | 9.6% | ||||
| Consumer Discretionary | 7.0% | ||||
| Industrials | 0.6% | ||||
| Health Care | 0.2% | ||||
| Cash and Cash Equivalents | 0.3% | ||||
| TOP 10 HOLDINGS (as a % of Net Assets) | |||||
| Advanced Micro Devices, Inc. | 15.4% | ||||
| NVIDIA Corp. | 10.4% | ||||
| Micron Technology, Inc. | 9.5% | ||||
| Taiwan Semiconductor Manufacturing Co. Ltd. - ADR | 6.8% | ||||
| AppLovin Corp. - Class A | 5.3% | ||||
| Toast, Inc. - Class A | 4.6% | ||||
| Amazon.com, Inc. | 4.4% | ||||
| Alphabet, Inc. - Class A | 4.1% | ||||
| Microsoft Corp. | 4.0% | ||||
| Robinhood Markets, Inc. - Class A | 3.8% | ||||
This annual shareholder report contains important information about the AOT Software Platform ETF (the “Fund”) for the period of December 22, 2025 to May 31, 2026 (the “Period”). You can find additional information about the Fund at https://aotetf.com/aots. You can also request this information by contacting us at (215) 330-4476. For information regarding your Fund shares or account, including account balances, transactions, or distributions, please contact your financial intermediary. This report describes changes to the Fund that occurred during the reporting period. | |||||||||||
Availability of Additional Information
For additional information about the Fund, including its prospectus, financial information, holdings, and proxy information, visit https://aotetf.com/aots. You can also request information by calling (215) 330-4476.
Householding
Householding is an option available to certain investors of the Fund. Householding is a method of delivery, based on the preference of the individual investor, in which a single copy of certain shareholder documents can be delivered to investors who share the same address, even if their accounts are registered under different names. Householding for the Fund is available through certain broker-dealers. If you are interested in enrolling in householding and receiving a single copy of prospectuses and other shareholder documents or you are currently enrolled in householding and wish to change your householding status, please contact your broker-dealer.
| WHAT WERE THE FUND COSTS FOR THE PERIOD? (based on a hypothetical $10,000 investment) | |||||||||||
| COST OF $10,000 INVESTMENT | COST PAID AS A PERCENTAGE OF $10,000 INVESTMENT | ||||||||||
| $21 | 0.49% | ||||||||||
| WHAT FACTORS INFLUENCED PERFORMANCE FOR THE PERIOD? | |||||||||||
The Fund underperformed its benchmark index over the Period because, as a software platform-oriented fund, it had significantly higher Software sector exposure than its benchmark.
The Software sector was the Fund’s largest detractor, as fears of AI disruption lowering barriers to entry in the software market drove a broad selloff across the sector. Agentic AI, however, drove a partial software recovery toward the end of the Period, as some analysts expected AI Agents to complete workflows in existing software applications, potentially creating new demand for Software products and services. Volatility increased at times due to the U.S.-Iran conflict and changing future Hyperscaler CAPEX projections.
The Semiconductor sector was the Fund’s largest contributor during the Period, benefiting from robust demand for the graphics processing units (GPUs).
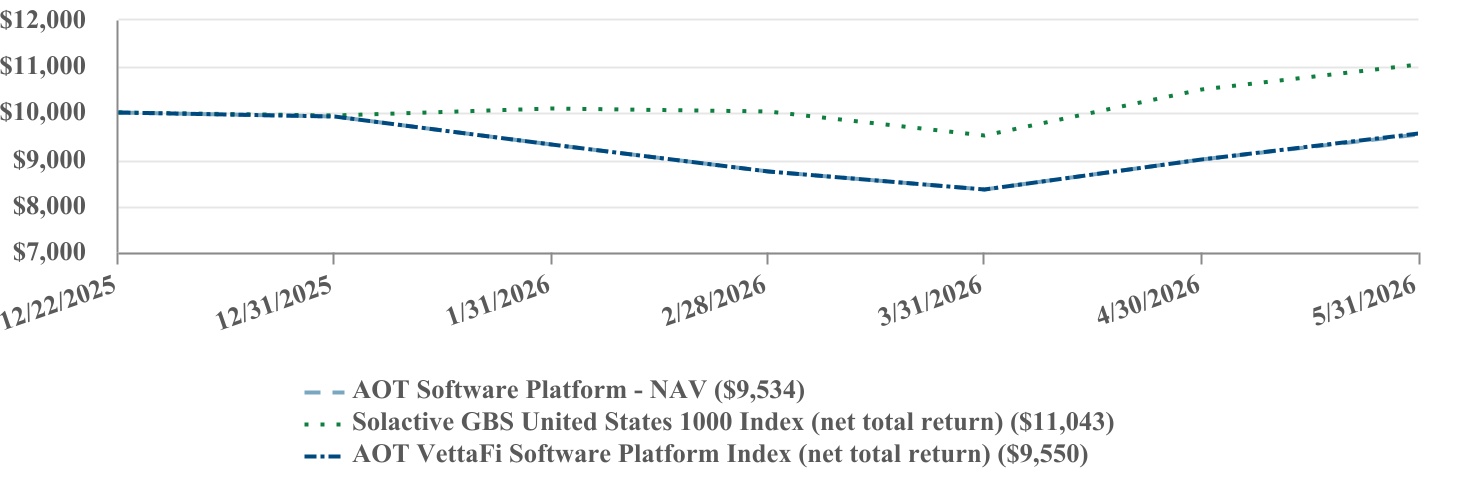
| PERFORMANCE | ||||||||
Since Inception (12/22/2025) | ||||||||
| AOT Software Platform ETF - NAV | -4.66% | |||||||
| AOT VettaFi Software Platform Index (net total return) | -4.50% | |||||||
| Solactive GBS United States 1000 Index (net total return) | 10.43% | |||||||
The Fund’s past performance is not a good predictor of how the Fund will perform in the future. The graph and table do not reflect the deduction of taxes that a shareholder would pay on fund distributions or redemption of fund shares. Net total return figures assume the reinvestment of dividends after deduction of withholding tax, applying the maximum rate to nonresident individual investors who do not benefit from double taxation treaties. | ||||||||
Visit https://aotetf.com/aots for more recent performance information. | ||||||||
| KEY FUND STATISTICS (as of Period End) | ||||||||||||||||||||
| Net Assets | $2,400,720 | Portfolio Turnover Rate* | 11% | |||||||||||||||||
| # of Portfolio Holdings | 51 | Fund Advisory Fees | $5,277 | |||||||||||||||||
| *Portfolio turnover is not annualized and is calculated without regard to short-term securities having a maturity of less than one year. Excludes impact of in-kind transactions. | ||||||||||||||||||||
| SECTOR WEIGHTING (as a % of Net Assets) | |||||
| Information Technology | 49.8% | ||||
| Financials | 19.3% | ||||
| Communication Services | 18.4% | ||||
| Consumer Discretionary | 9.8% | ||||
| Industrials | 1.9% | ||||
| Health Care | 0.5% | ||||
| Cash and Cash Equivalents | 0.3% | ||||
| TOP 10 HOLDINGS (as a % of Net Assets) | |||||
| Amazon.com, Inc. | 7.8% | ||||
| Alphabet, Inc. - Class A | 7.5% | ||||
| Apple, Inc. | 7.3% | ||||
| NVIDIA Corp. | 6.9% | ||||
| Microsoft Corp. | 6.7% | ||||
| Meta Platforms, Inc. | 6.0% | ||||
| Visa, Inc. | 5.1% | ||||
| Oracle Corp. | 4.6% | ||||
| Mastercard, Inc. | 4.2% | ||||
| Palantir Technologies, Inc. - Class A | 4.1% | ||||