Shareholder Report
May 31, 2026
USD ($)
holding
This annual shareholder report contains important information about the Castellan Targeted Equity ETF (the “Fund”) for the period of June 17, 2025 to May 31, 2026 (the “Period”). You can find additional information about the Fund at https://castellanetf.com/ctef/. You can also request this information by contacting us at (215) 330-4476. For information regarding your Fund shares or account, including account balances, transactions, or distributions, please contact your financial intermediary. | |||||||||||
Availability of Additional Information
For additional information about the Fund, including its prospectus, financial information, holdings, and proxy information, visit https://castellanetf.com/ctef/. You can also request information by calling (215) 330-4476.
Householding
Householding is an option available to certain investors of the Fund. Householding is a method of delivery, based on the preference of the individual investor, in which a single copy of certain shareholder documents can be delivered to investors who share the same address, even if their accounts are registered under different names. Householding for the Fund is available through certain broker-dealers. If you are interested in enrolling in householding and receiving a single copy of prospectuses and other shareholder documents or you are currently enrolled in householding and wish to change your householding status, please contact your broker-dealer.
| WHAT WERE THE FUND COSTS FOR THE PERIOD? (based on a hypothetical $10,000 investment) | |||||||||||
| COST OF $10,000 INVESTMENT | COST PAID AS A PERCENTAGE OF $10,000 INVESTMENT | ||||||||||
| $58 | 0.45% | ||||||||||
| WHAT FACTORS INFLUENCED PERFORMANCE FOR THE PERIOD? | |||||||||||
During the Period, the Fund primarily invested in U.S. equities across various sectors, with a focus on companies exhibiting value, price momentum, and earnings momentum characteristics.
TOP PERFORMANCE CONTRIBUTORS
The Fund’s performance was driven by a combination of positive sector exposure effects, positive style exposure effects, and positive individual stock selection effects.
The Fund’s positive sector exposure effects were driven by Information Technology and Consumer Discretionary. The Fund maintained a meaningful overweight allocation to Information Technology, where both allocation and stock selection contributed positively, supported by positions in Western Digital Corp., Micron Technology Inc., and Lam Research Corp. The Fund was also overweight in
Consumer Discretionary, where allocation and stock selection both provided positive contribution, supported by positions in companies like Tapestry Inc.
Additionally, style exposures provided net positive contributions from factors such as beta, momentum, and valuation. Other large positive stock selection effects were provided by Comfort Systems USA Inc., Modine Manufacturing Co., and Clear Secure Inc.
TOP PERFORMANCE DETRACTORS
While overall performance was strong, certain sectors detracted modestly from results. The Fund was overweight in the Health Care sector relative to the benchmark, providing a negative relative performance contribution. The Fund was also underweight in the Financials sector relative to the benchmark, providing a negative relative performance contribution.
The Fund’s tilt towards small- and mid-cap equities relative to the benchmark led to a detraction in performance.
From a stock selection perspective, the Fund experienced the largest performance detractions from Palomar Holdings Inc., Fortinet Inc., Booking Holdings Inc., Microsoft Corp., and Universal Health Services Inc.
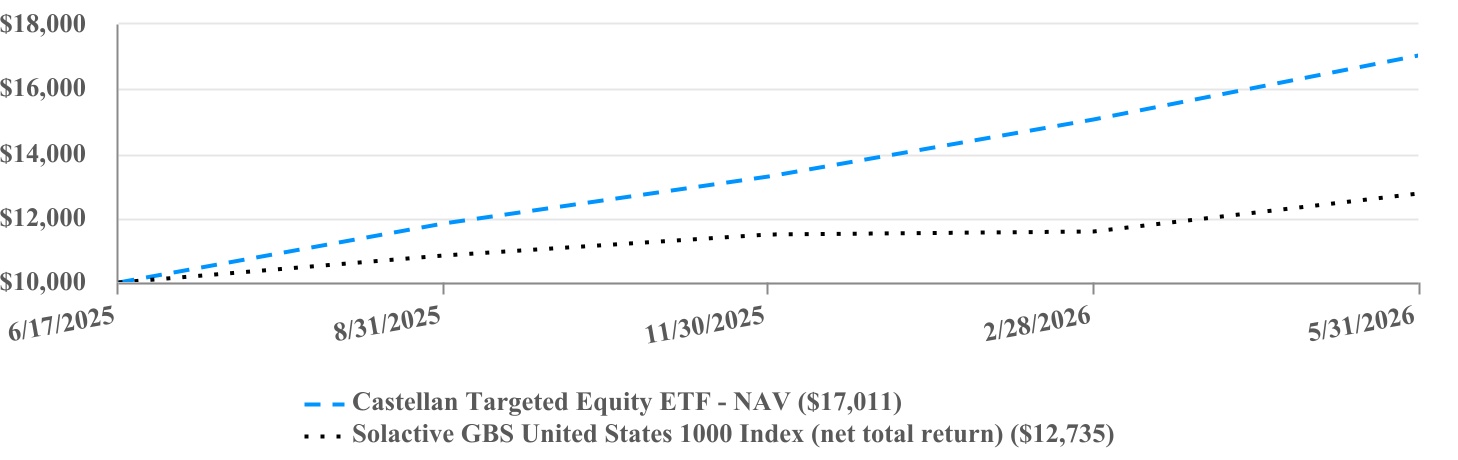
| PERFORMANCE | ||||||||
Since Inception (6/17/2025) | ||||||||
| Castellan Targeted Equity ETF - NAV | 70.11% | |||||||
| Solactive GBS United States 1000 Index (net total return) | 27.35% | |||||||
The Fund’s past performance is not a good predictor of how the Fund will perform in the future. The graph and table do not reflect the deduction of taxes that a shareholder would pay on fund distributions or redemption of fund shares. Net total return figures assume the reinvestment of dividends after deduction of withholding tax, applying the maximum rate to nonresident individual investors who do not benefit from double taxation treaties. | ||||||||
Visit https://castellanetf.com/ctef/ for more recent performance information. | ||||||||
| KEY FUND STATISTICS (as of Period End) | ||||||||||||||||||||
| Net Assets | $610,420,939 | Portfolio Turnover Rate* | 89% | |||||||||||||||||
| # of Portfolio Holdings | 48 | Fund Advisory Fees | $2,009,008 | |||||||||||||||||
| *Portfolio turnover is not annualized and is calculated without regard to short-term securities having a maturity of less than one year. Excludes impact of in-kind transactions. | ||||||||||||||||||||
| INVESTMENT WEIGHTING (as a % of Net Assets) | |||||
| Information Technology | 40.3% | ||||
| Financials | 20.2% | ||||
| Consumer Discretionary | 15.9% | ||||
| Industrials | 15.7% | ||||
| Health Care | 8.8% | ||||
| Purchased Options | 3.3% | ||||
| Written Options | (4.5)% | ||||
| Cash and Cash Equivalents | 0.3% | ||||
| TOP 10 HOLDINGS (as a % of Net Assets) | |||||
| Micron Technology, Inc. | 10.3% | ||||
| Western Digital Corp. | 7.2% | ||||
| Lam Research Corp. | 6.4% | ||||
| Jabil, Inc. | 6.3% | ||||
| Modine Manufacturing Co. | 5.9% | ||||
| Comfort Systems USA, Inc. | 5.8% | ||||
| Dave, Inc. | 4.9% | ||||
| Deckers Outdoor Corp. | 4.7% | ||||
| Tapestry, Inc. | 4.3% | ||||
| NVIDIA Corp. | 4.3% | ||||
This annual shareholder report contains important information about the Castellan Targeted Income ETF (the “Fund”) for the period of June 24, 2025 to May 31, 2026 (the “Period”). You can find additional information about the Fund at https://castellanetf.com/ctif/. You can also request this information by contacting us at (215) 330-4476.. For information regarding your Fund shares or account, including account balances, transactions, or distributions, please contact your financial intermediary. | |||||||||||
Availability of Additional Information
For additional information about the Fund, including its prospectus, financial information, holdings, and proxy information, visit https://castellanetf.com/ctif/. You can also request information by calling (215) 330-4476.
Householding
Householding is an option available to certain investors of the Fund. Householding is a method of delivery, based on the preference of the individual investor, in which a single copy of certain shareholder documents can be delivered to investors who share the same address, even if their accounts are registered under different names. Householding for the Fund is available through certain broker-dealers. If you are interested in enrolling in householding and receiving a single copy of prospectuses and other shareholder documents or you are currently enrolled in householding and wish to change your householding status, please contact your broker-dealer.
| WHAT WERE THE FUND COSTS FOR THE PERIOD? (based on a hypothetical $10,000 investment) | |||||||||||
| COST OF $10,000 INVESTMENT | COST PAID AS A PERCENTAGE OF $10,000 INVESTMENT | ||||||||||
| $44 | 0.45% | ||||||||||
| WHAT FACTORS INFLUENCED PERFORMANCE FOR THE PERIOD? | |||||||||||
During the Period, the Fund primarily invested in large- and mid-cap U.S. equities across various sectors, with a focus on companies exhibiting high-quality characteristics in addition to strong histories of dividend growth. Additionally, the Fund invested in covered call options overlayed over individual stock positions.
TOP PERFORMANCE CONTRIBUTORS
The Fund’s positive return was supported by several areas of the portfolio. Strong contributions came from holdings within the Industrials sector, including positions in Caterpillar Inc., Parker-Hannifin Corp., and Hubbell Inc. The portfolio also benefitted from style exposures to Valuation, Dividend Yield, and Profitability (Quality).
Additionally, option premiums generated from the Fund’s covered call strategy supplemented dividend income received from portfolio holdings and contributed positively to the Fund’s overall distribution profile during the Period.
TOP PERFORMANCE DETRACTORS
Performance was negatively affected by the Fund’s lower exposure to certain areas of the market that experienced particularly strong gains during the Period, most notably Information Technology. The Fund’s emphasis on higher-quality, dividend-growing companies also resulted in less exposure to Beta and Momentum styles that outperformed in portions of the market.
Individual holdings that detracted from performance included Oracle Corp., Automatic Data Processing Inc., and Abbott Laboratories. While the covered call strategy generated additional cash proceeds, periods of strong equity market appreciation reduced participation in some upside market moves when portfolio holdings advanced above the strike prices of written covered call options.
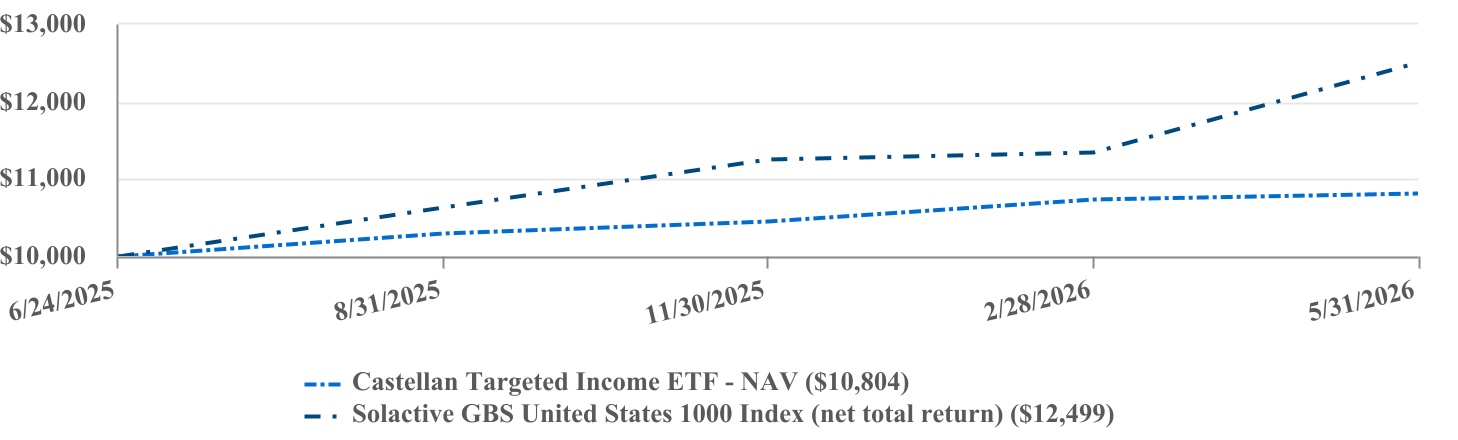
| PERFORMANCE | ||||||||
Since Inception (6/24/2025) | ||||||||
| Castellan Targeted Income ETF - NAV | 8.04% | |||||||
| Solactive GBS United States 1000 Index (net total return) | 24.99% | |||||||
The Fund’s past performance is not a good predictor of how the Fund will perform in the future. The graph and table do not reflect the deduction of taxes that a shareholder would pay on fund distributions or redemption of fund shares. Net total return figures assume the reinvestment of dividends after deduction of withholding tax, applying the maximum rate to nonresident individual investors who do not benefit from double taxation treaties. | ||||||||
Visit https://castellanetf.com/ctif/ for more recent performance information. | ||||||||
| KEY FUND STATISTICS (as of Period End) | ||||||||||||||||||||
| Net Assets | $179,974,212 | Portfolio Turnover Rate* | 26% | |||||||||||||||||
| # of Portfolio Holdings | 44 | Fund Advisory Fees | $643,407 | |||||||||||||||||
| *Portfolio turnover is not annualized and is calculated without regard to short-term securities having a maturity of less than one year. Excludes impact of in-kind transactions. | ||||||||||||||||||||
| INVESTMENT WEIGHTING (as a % of Net Assets) | |||||
| Industrials | 48.2% | ||||
| Information Technology | 21.0% | ||||
| Financials | 13.4% | ||||
| Consumer Staples | 8.7% | ||||
| Materials | 4.0% | ||||
| Health Care | 3.4% | ||||
| Fixed Income ETF | 0.2% | ||||
| Written Options | (0.2)% | ||||
| Cash and Cash Equivalents | 1.3% | ||||
| TOP 10 HOLDINGS (as a % of Net Assets) | |||||
| Broadcom, Inc. | 6.3% | ||||
| Analog Devices, Inc. | 6.3% | ||||
| Caterpillar, Inc. | 5.9% | ||||
| Eaton Corp. PLC | 5.9% | ||||
| Snap-on, Inc. | 5.4% | ||||
| Parker-Hannifin Corp. | 5.3% | ||||
| Goldman Sachs Group, Inc. | 5.3% | ||||
| WW Grainger, Inc. | 5.2% | ||||
| Hubbell, Inc. | 4.9% | ||||
| Microsoft Corp. | 4.8% | ||||