Shareholder Report
Sep. 30, 2025
May 31, 2026
USD ($)
holding
This annual shareholder report contains important information about the Bastion Energy ETF (the “Fund”) for the period of June 3, 2025 to May 31, 2026 (the “Period”). You can find additional information about the Fund at https://bastionetfs.com/. You can also request this information by contacting us at (215) 330-4476. For information regarding your Fund shares or account, including account balances, transactions, or distributions, please contact your financial intermediary. | |||||||||||
Availability of Additional Information
For additional information about the Fund, including its prospectus, financial information, holdings, and proxy information, visit https://bastionetfs.com/. You can also request information by calling (215) 330-4476.
Householding
Householding is an option available to certain investors of the Fund. Householding is a method of delivery, based on the preference of the individual investor, in which a single copy of certain shareholder documents can be delivered to investors who share the same address, even if their accounts are registered under different names. Householding for the Fund is available through certain broker-dealers. If you are interested in enrolling in householding and receiving a single copy of prospectuses and other shareholder documents or you are currently enrolled in householding and wish to change your householding status, please contact your broker-dealer.
| WHAT WERE THE FUND COSTS FOR THE PERIOD? (based on a hypothetical $10,000 investment) | |||||||||||
| COST OF $10,000 INVESTMENT | COST PAID AS A PERCENTAGE OF $10,000 INVESTMENT | ||||||||||
| $104 | 0.80% | ||||||||||
| WHAT FACTORS INFLUENCED PERFORMANCE FOR THE PERIOD? | |||||||||||
For the Period from the Fund’s inception on June 3, 2025, through the fiscal year ended May 31, 2026, the Fund produced a positive total return and outperformed its broad-based benchmark. The Fund is an actively managed, concentrated portfolio of U.S. energy and energy-related securities. Performance was driven principally by security selection and by active repositioning of the portfolio over the Period rather than by broad market exposure.
The Fund pursues its investment objective through a fundamental, value-oriented process that seeks undervalued U.S. energy and energy-related companies with resilient business models and durable competitive advantages, weighting the portfolio most heavily toward the securities trading at the largest discounts to the Sub-Adviser’s assessment of value. Consistent with that process, the Fund reallocated over the Period, reducing a number of positions established near inception as they appreciated toward the Sub-Adviser’s estimates of value and increasing its holdings in the natural gas value chain - natural gas exploration and production, liquefied natural
gas (LNG), and midstream infrastructure. At times the Fund held elevated cash, consistent with its practice of holding cash until suitable investments are identified.
TOP PERFORMANCE CONTRIBUTORS
Holdings tied to solar power and energy storage were the Fund’s leading contributors. These positions appreciated substantially while held and were reduced or sold as the portfolio was repositioned. Gains were concentrated in a small number of holdings, which together accounted for the majority of the Fund’s positive return for the Period.
TOP PERFORMANCE DETRACTORS
LNG and natural gas exploration and production positions added later in the period were the principal detractors, declining while held, along with a power-generation holding. An elevated cash position during portions of the Period also modestly tempered absolute returns.
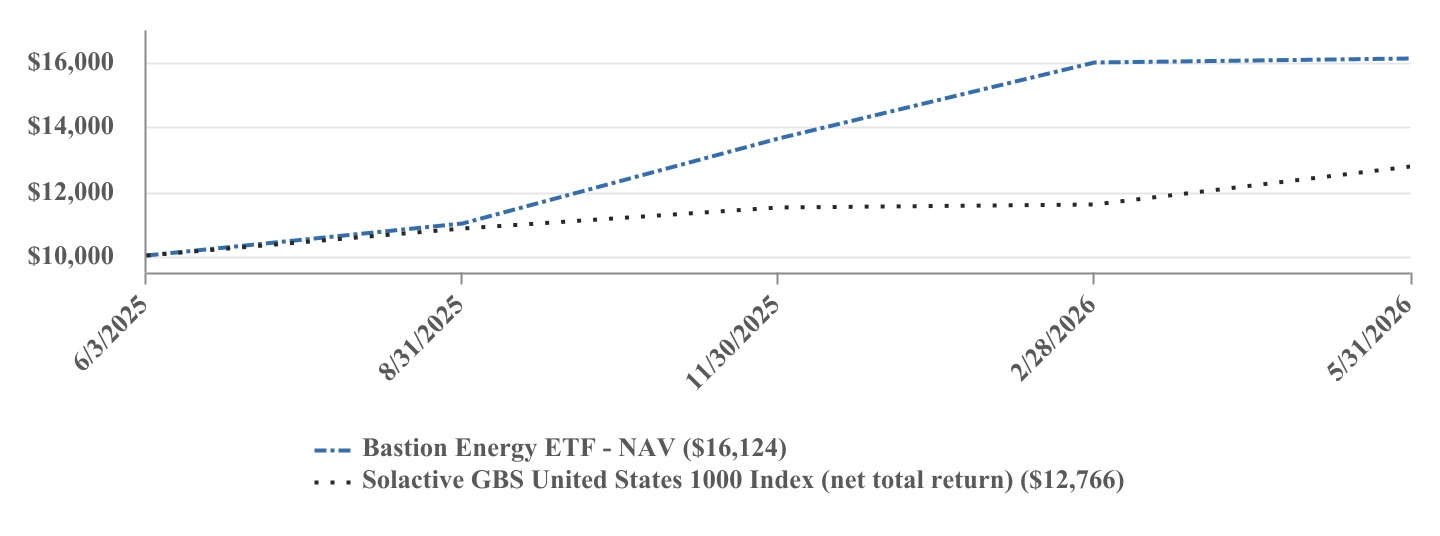
| PERFORMANCE | |||||
Since Inception (6/3/2025) | |||||
| Bastion Energy ETF - NAV | 61.24% | ||||
| Solactive GBS United States 1000 Index (net total return) | 27.66% | ||||
The Fund’s past performance is not a good predictor of how the Fund will perform in the future. The graph and table do not reflect the deduction of taxes that a shareholder would pay on Fund distributions or redemption of Fund shares. Net total return figures assume the reinvestment of dividends after deduction of withholding tax, applying the maximum rate to nonresident individual investors who do not benefit from double taxation treaties. Visit https://bastionetfs.com/ for more recent performance information. | |||||
| KEY FUND STATISTICS (as of Period End) | ||||||||||||||||||||
| Net Assets | $32,893,172 | Portfolio Turnover Rate* | 160% | |||||||||||||||||
| # of Portfolio Holdings | 21 | Fund Advisory Fees | $198,156 | |||||||||||||||||
| *Portfolio turnover is not annualized and is calculated without regard to short-term securities having a maturity of less than one year. Excludes impact of in-kind transactions. | ||||||||||||||||||||
| SECTOR WEIGHTING (as a % of Net Assets) | |||||
| Energy | 82.1% | ||||
| Utilities | 4.6% | ||||
| Cash and Cash Equivalents | 13.3% | ||||
| TOP 10 HOLDINGS (as a % of Net Assets) | |||||
| NextDecade Corp. | 9.0% | ||||
| Cheniere Energy, Inc. | 5.2% | ||||
| Williams Cos., Inc. | 5.2% | ||||
| Enterprise Products Partners LP | 5.1% | ||||
| ONEOK, Inc. | 4.9% | ||||
| Sempra | 4.5% | ||||
| EOG Resources, Inc. | 4.4% | ||||
| ProPetro Holding Corp. | 4.3% | ||||
| Antero Resources Corp. | 4.3% | ||||
| EQT Corp. | 4.2% | ||||