Shareholder Report
Nov. 30, 2025
USD ($)
May 31, 2026
USD ($)
holding
This annual shareholder report contains important information about the ARS Core Equity Portfolio ETF (the “Fund”) for the period of November 20, 2025 to May 31, 2026 (the “Period”). You can find additional information about the Fund at https://arsinvestetfs.com/acep/. You can also request this information by contacting us at (215) 330-4476. For information regarding your Fund shares or account, including account balances, transactions, or distributions, please contact your financial intermediary. | |||||||||||
Availability of Additional Information
For additional information about the Fund, including its prospectus, financial information, holdings, and proxy information, visit https://arsinvestetfs.com/acep/ You can also request information by calling (215) 330-4476.
Householding
Householding is an option available to certain investors of the Fund. Householding is a method of delivery, based on the preference of the individual investor, in which a single copy of certain shareholder documents can be delivered to investors who share the same address, even if their accounts are registered under different names. Householding for the Fund is available through certain broker-dealers. If you are interested in enrolling in householding and receiving a single copy of prospectuses and other shareholder documents or you are currently enrolled in householding and wish to change your householding status, please contact your broker-dealer.
| WHAT WERE THE FUND COSTS FOR THE PERIOD? (based on a hypothetical $10,000 investment) | |||||||||||
| COST OF $10,000 INVESTMENT | COST PAID AS A PERCENTAGE OF $10,000 INVESTMENT | ||||||||||
| $28 | 0.45% | ||||||||||
| WHAT FACTORS INFLUENCED PERFORMANCE FOR THE PERIOD? | |||||||||||
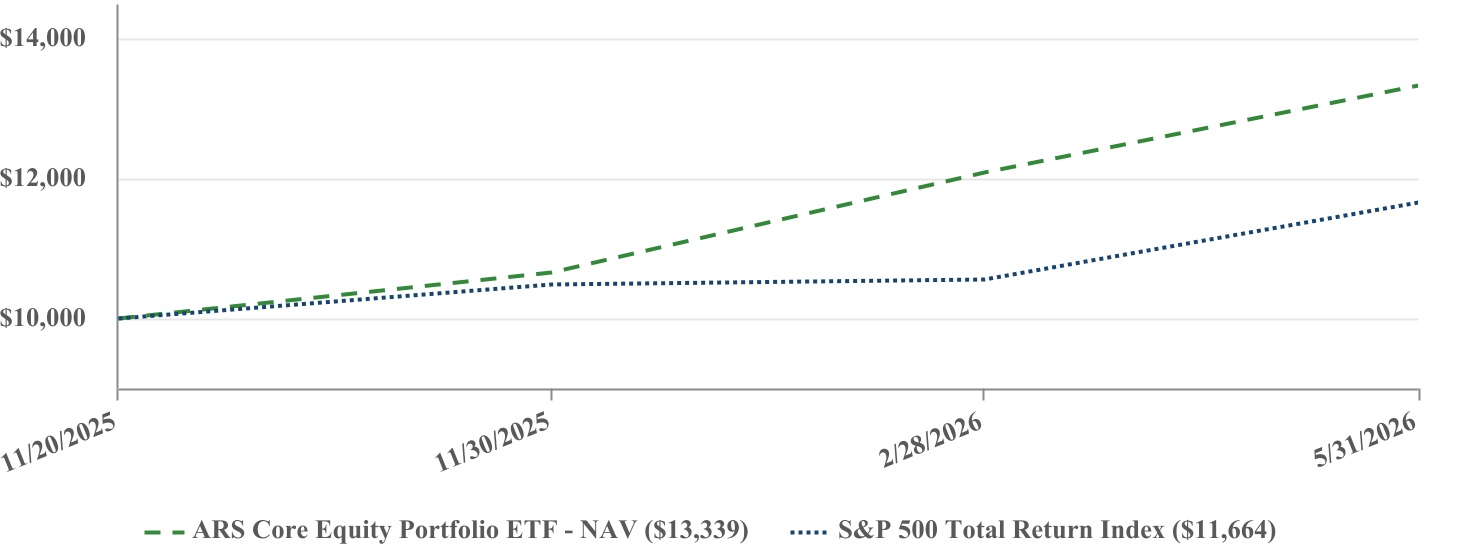
Since the Fund’s launch on November 20, 2025, through the period ended May 31, 2026, the Fund returned +33.39%, outperforming its benchmark, the S&P 500 Total Return Index, which returned +16.64%. The Fund primarily invested in U.S. equities across various sectors, with a focus on companies that are the beneficiaries of long-term secular trends currently unfolding in the global economy, including digitalization, electrification, reindustrialization and national security. This led to the Fund holding overweight positions relative to the benchmark in the Materials, Industrials and Energy sectors.
TOP PERFORMANCE CONTRIBUTORS
The Fund’s performance benefited from exposure to companies within the Materials, Energy, and Technology sectors. Within Materials, the Fund’s exposure to Newmont Corporation and Freeport-McMoRan reflected an investment thesis centered on gold as a store of value in an inflationary environment and on copper demand tied to data center and electrical infrastructure buildout; both companies contributed as gold and copper prices rose accordingly. The Fund’s Energy holdings, led by Golar LNG and Targa Resources, were
positioned to benefit from global energy supply constraints, and delivered strong operating results during the Period. Within Technology, the Fund’s focus on the semiconductor industry reflected the view that artificial intelligence infrastructure buildout would drive demand for data storage and manufacturing capacity; Seagate Technology and Lam Research, direct beneficiaries of this demand, saw their share prices increase significantly
TOP PERFORMANCE DETRACTORS
The factors weighing on performance were primarily driven by select stocks within the Financial and Industrial sectors. Arthur J. Gallagher & Co. sold off on fears that artificial intelligence could disrupt the insurance brokerage industry, though the Fund’s position reflected the company’s consistent revenue growth and high client retention. Blackstone Inc., one of the leading providers of private/alternative investments, came under pressure on concerns that private credit was facing an uptick in defaults; the Fund’s exposure, however, reflected Blackstone’s diversified alternative investment business lines. Parker Hannifin, a large industrial company, saw its stock consolidate after a period of relatively strong performance. The Fund’s position reflected the company’s specialization in motion and control systems used in reindustrialization-related markets.
| PERFORMANCE | ||||||||
Since Inception (11/20/2025) | ||||||||
| ARS Core Equity Portfolio ETF - NAV | 33.39% | |||||||
| S&P 500 Total Return Index | 16.64% | |||||||
The Fund’s past performance is not a good predictor of how the Fund will perform in the future. The graph and table do not reflect the deduction of taxes that a shareholder would pay on fund distributions or redemption of fund shares. | ||||||||
Visit https://arsinvestetfs.com/acep/ for more recent performance information. | ||||||||
| KEY FUND STATISTICS (as of Period End) | ||||||||||||||||||||
| Net Assets | $100,160,250 | Portfolio Turnover Rate* | 49% | |||||||||||||||||
| # of Portfolio Holdings | 34 | Fund Advisory Fees | $207,464 | |||||||||||||||||
| *Portfolio turnover is not annualized and is calculated without regard to short-term securities having a maturity of less than one year. Excludes impact of in-kind transactions. | ||||||||||||||||||||
| SECTOR WEIGHTING (as a % of Net Assets) | |||||
| Information Technology | 33.1% | ||||
| Financials | 13.3% | ||||
| Materials | 11.7% | ||||
| Energy | 11.4% | ||||
| Industrials | 10.0% | ||||
| Health Care | 6.7% | ||||
| Consumer Discretionary | 2.7% | ||||
| Consumer Staples | 2.0% | ||||
| Real Estate | 1.9% | ||||
| Communication Services | 1.1% | ||||
| Cash and Cash Equivalents | 6.1% | ||||
| TOP 10 HOLDINGS (as a % of Net Assets) | |||||
| Seagate Technology Holdings PLC | 6.4% | ||||
| Lam Research Corp. | 6.1% | ||||
| Broadcom, Inc. | 5.0% | ||||
| Barrick Mining Corp. | 4.0% | ||||
| QUALCOMM, Inc. | 3.4% | ||||
| Parker-Hannifin Corp. | 3.4% | ||||
| Southern Copper Corp. | 3.4% | ||||
| International Business Machines Corp. | 3.3% | ||||
| JPMorgan Chase & Co. | 3.2% | ||||
| Targa Resources Corp. | 3.2% | ||||
This annual shareholder report contains important information about the ARS Focused Opportunities Strategy ETF (the “Fund”) for the period of June 25, 2025 to May 31, 2026 (the “Period”). You can find additional information about the Fund at https://arsinvestetfs.com/afos/. You can also request this information by contacting us at (215) 330-4476. For information regarding your Fund shares or account, including account balances, transactions, or distributions, please contact your financial intermediary. | |||||||||||
Availability of Additional Information
For additional information about the Fund, including its prospectus, financial information, holdings, and proxy information, visit https://arsinvestetfs.com/afos/. You can also request information by calling (215) 330-4476.
Householding
Householding is an option available to certain investors of the Fund. Householding is a method of delivery, based on the preference of the individual investor, in which a single copy of certain shareholder documents can be delivered to investors who share the same address, even if their accounts are registered under different names. Householding for the Fund is available through certain broker-dealers. If you are interested in enrolling in householding and receiving a single copy of prospectuses and other shareholder documents or you are currently enrolled in householding and wish to change your householding status, please contact your broker-dealer.
| WHAT WERE THE FUND COSTS FOR THE PERIOD? (based on a hypothetical $10,000 investment) | |||||||||||
| COST OF $10,000 INVESTMENT | COST PAID AS A PERCENTAGE OF $10,000 INVESTMENT | ||||||||||
| $59 | 0.45% | ||||||||||
| WHAT FACTORS INFLUENCED PERFORMANCE FOR THE PERIOD? | |||||||||||
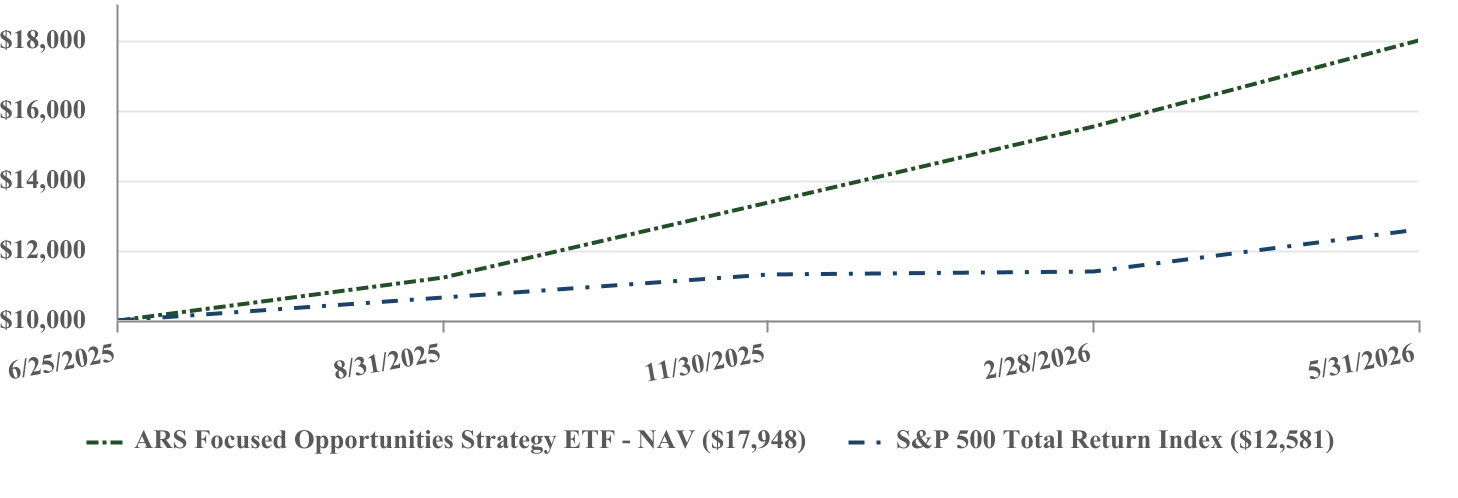
Since the Fund’s launch on June 25, 2025, through the period ended May 31, 2026, the Fund returned +79.48%, outperforming its benchmark, the S&P 500 Total Return Index, which returned +25.81%. The Fund primarily invested in U.S. equities across various sectors, with a focus on companies that are the beneficiaries of long term- secular trends currently unfolding in the global economy. The Fund seeks to identify well-positioned and undervalued companies across small, mid, and large market capitalization ranges.
TOP PERFORMANCE CONTRIBUTORS
The Fund’s performance benefited from exposure to companies within the Materials, Technology and Industrial sectors. Within Materials, the Fund’s exposure to Newmont Corporation and Freeport-McMoRan reflected an investment thesis centered on gold as a store of value in an inflationary environment and on copper demand tied to data center and electrical infrastructure buildout; both companies contributed as gold and copper prices rose accordingly. The Fund's Industrial holdings, led by GE Vernova and Quanta Services, reflected a focus on infrastructure tied to power generation and grid capacity; GE Vernova benefited as a leading provider of gas turbines, while Quanta Services benefited from its role as a leading specialty infrastructure contractor supporting electricity, natural
gas, and communications networks. Kratos Defense and Security Solutions was a large contributor as well, benefiting from its position as a drone manufacturer. Within Technology, the Fund's focus on the semiconductor industry reflected the view that artificial intelligence infrastructure buildout would drive demand for data storage and manufacturing capacity; Micron Technology, Western Digital, and Lam Research were beneficiaries of this demand.
TOP PERFORMANCE DETRACTORS
The factors weighing on performance were primarily driven by select stocks within the Energy, Financial and Healthcare sectors. The Fund's sale of Cheniere Energy, based on the view that shares were fully valued, preceded a rise in energy prices tied to escalating conflict in the Middle East, resulting in relative underperformance versus the sector. Blackstone Inc., one of the leading providers of private/alternative investments, came under pressure on concerns that private credit was facing an uptick in defaults; the Fund’s exposure, however, reflected Blackstone’s diversified alternative investment business lines. Regeneron Pharmaceuticals, a fully integrated biotechnology company, posted positive performance during the Period but lagged the index on a relative basis.
| PERFORMANCE | ||||||||
Since Inception (6/25/2025) | ||||||||
| ARS Focused Opportunities Strategy ETF - NAV | 79.48% | |||||||
| S&P 500 Total Return Index | 25.81% | |||||||
The Fund’s past performance is not a good predictor of how the Fund will perform in the future. The graph and table do not reflect the deduction of taxes that a shareholder would pay on fund distributions or redemption of fund shares. | ||||||||
Visit https://arsinvestetfs.com/afos/ for more recent performance information. | ||||||||
| KEY FUND STATISTICS (as of Period End) | ||||||||||||||||||||
| Net Assets | $288,938,992 | Portfolio Turnover Rate* | 32% | |||||||||||||||||
| # of Portfolio Holdings | 31 | Fund Advisory Fees | $876,089 | |||||||||||||||||
| *Portfolio turnover is not annualized and is calculated without regard to short-term securities having a maturity of less than one year. Excludes impact of in-kind transactions. | ||||||||||||||||||||
| INVESTMENT WEIGHTING (as a % of Net Assets) | |||||
| Information Technology | 30.0% | ||||
| Industrials | 23.4% | ||||
| Materials | 11.8% | ||||
| Health Care | 8.2% | ||||
| Energy | 6.6% | ||||
| Financials | 5.3% | ||||
| Communication Services | 5.0% | ||||
| Consumer Discretionary | 2.6% | ||||
| Utilities | 2.3% | ||||
| Cash and Cash Equivalents | 4.8% | ||||
| TOP 10 HOLDINGS (as a % of Net Assets) | |||||
| Micron Technology, Inc. | 8.6% | ||||
| Western Digital Corp. | 6.0% | ||||
| Lam Research Corp. | 5.6% | ||||
| Alphabet, Inc. - Class A | 5.0% | ||||
| NVIDIA Corp. | 4.3% | ||||
| Newmont Corp. | 4.1% | ||||
| Marathon Petroleum Corp. | 4.0% | ||||
| Freeport-McMoRan, Inc. | 3.7% | ||||
| GE Vernova, Inc. | 3.6% | ||||
| Quanta Services, Inc. | 3.5% | ||||