
Q2 2026 EARNINGS CALL Date August 4, 2026 Time 10:00 AM EST Presenters Austin C. Willis Scott B. Flaherty
2 DISCLAIMER Forward Looking Statements This presentation contains certain forward-looking statements within the meaning of the federal securities laws. Some of the forward-looking statements can be identified by the use of forward-looking words. Statements that are not historical in nature, including ‘‘anticipate,’’ ‘‘may,’’ ‘‘estimate,’’ ‘‘should,’’ ‘‘expect,’’ ‘‘plan,’’ ‘‘believe,’’ ‘‘intend,’’ and similar words, or the negatives of those words, are intended to identify forward-looking statements. They also include statements containing a projection of revenues, earnings (loss), capital expenditures, dividends, capital structure or other financial terms. Certain statements regarding the following particularly are forward- looking in nature: ▪ Willis Lease Financial Corporation (the "Company" or "WLFC")’s business strategy; ▪ WEST’s business strategy and assumptions used to develop the cash flow models; ▪ future performance, developments, market forecasts or projections; and ▪ WLFC’s projected capital expenditures. All forward-looking statements are based on our beliefs, assumptions and expectations of future economic performance, taking into account the information currently available. These statements are not statements of historical fact. Forward-looking statements are subject to a number of factors, risks and uncertainties, some of which are not currently known and many of which are beyond WLFC’s and WEST’s control, which may cause actual results, performance or financial condition to be materially different from the stated expectations of future results, performance or financial position, as well as those included in the cash flow models. Our actual results may differ materially from the results discussed in forward-looking statements. Factors that might cause such a difference include, but are not limited to: ▪ the effects on the airline industry and the global economy of events such as terrorist activity; ▪ changes in fuel prices and other disruptions to the world markets and the global economy of geopolitical, weather, cybersecurity, humanitarian and other events, including but not limited to war and terrorist activity; ▪ trends in the airline industry, including growth rates of markets and other economic factors; ▪ risks associated with owning and leasing commercial engines and aircraft; ▪ changes in interest rates and availability of capital to us and to our customers; ▪ our ability to continue to meet our customers’ changing demands; ▪ the market value of engines and other assets in our portfolio; ▪ regulatory changes affecting commercial aircraft operators, aircraft maintenance, engine standards, accounting standards and taxes; and ▪ WLFC’s, in its capacity as Servicer, ability to successfully negotiate engine purchases, sales and leases, to collect outstanding amounts due, and to repossess engines under defaulted leases, and to control costs and expenses. ▪ further information regarding these and other risks is included in WLFC's most recent U.S. Securities and Exchange Commission ("SEC") filings, including its Annual and Quarterly Reports on Forms 10-K and 10-Q, respectively, filed with the SEC under the heading “Risk Factors.” Considering these risks, uncertainties and assumptions, you are cautioned not to place undue reliance on forward-looking statements, which speak only as of the date of presentation or as of the date of any document incorporated by reference, as applicable. Such forward-looking statements are inherently uncertain, and actual results may differ from expectations. We are not under any obligation, and we expressly disclaim any obligation, to update or alter any forward-looking statements, whether as a result of new information, future events or otherwise. Non-GAAP Financial Measures In this presentation, WLFC presents certain non-GAAP measures, including EBITDA, EBITDA Margin, Free Cash Flow and similar measures, which are not required by, or presented in accordance with, GAAP. While WLFC believes these are useful metrics, companies use these metrics for differing purposes and they are often calculated in ways that reflect the particular circumstances of those companies. You should exercise caution in comparing the non-GAAP metrics reported by us to such metrics or other similar metrics as reported by other companies. Our non-GAAP metrics have limitations as analytical tools, and you should not consider them in isolation. The non-GAAP financial information presented herein is provided in addition to, not as a substitute for, or superior to, financial measures calculated in accordance with GAAP and should not be considered as alternatives to any performance measures derived in accordance with GAAP. A reconciliation of EBITDA, a non-GAAP financial measure, to its most directly comparable GAAP measure, can be found on slide 17 of this presentation. The distribution of this presentation in certain jurisdictions may be restricted by law. Those persons into whose possession this presentation comes are required to inform themselves about and to observe any such restrictions. This presentation does not constitute an offer to any person or to the public generally to subscribe for or otherwise acquire any securities. This presentation has been prepared solely for informational purposes and is not intended to serve as the basis for any investment decision. Under no circumstances is this presentation or the information contained herein to be construed as a prospectus, offering memorandum or advertisement and neither any part of this written or oral presentation nor any information or statement contained herein or therein shall form the basis of or be relied upon in connection with any contract or commitment whatsoever. This presentation does not constitute an offer to sell, or a solicitation of an offer to buy, any securities in any jurisdiction where such an offer or solicitation would be unlawful.
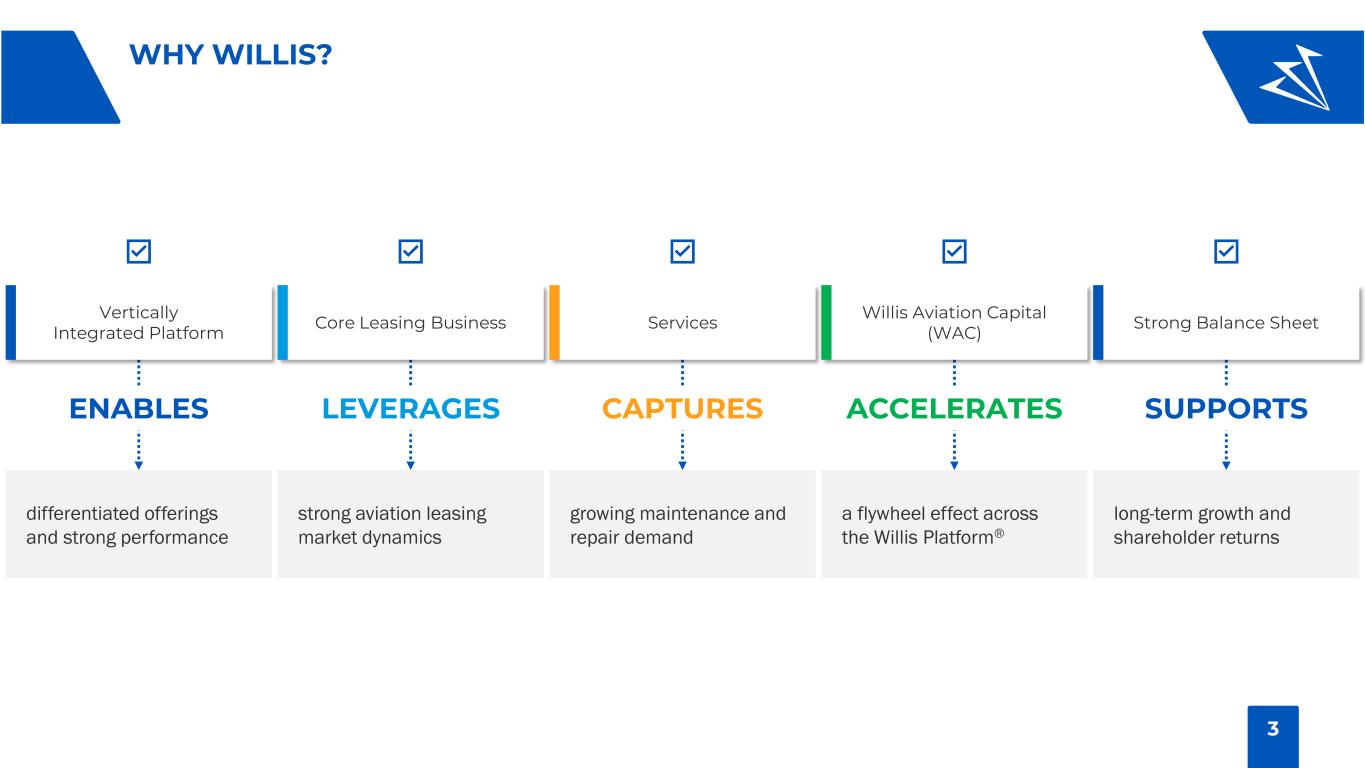
3 WHY WILLIS? differentiated offerings and strong performance strong aviation leasing market dynamics growing maintenance and repair demand a flywheel effect across the Willis Platform® long-term growth and shareholder returns ENABLES LEVERAGES CAPTURES ACCELERATES SUPPORTS Vertically Integrated Platform Core Leasing Business Services Willis Aviation Capital (WAC) Strong Balance Sheet
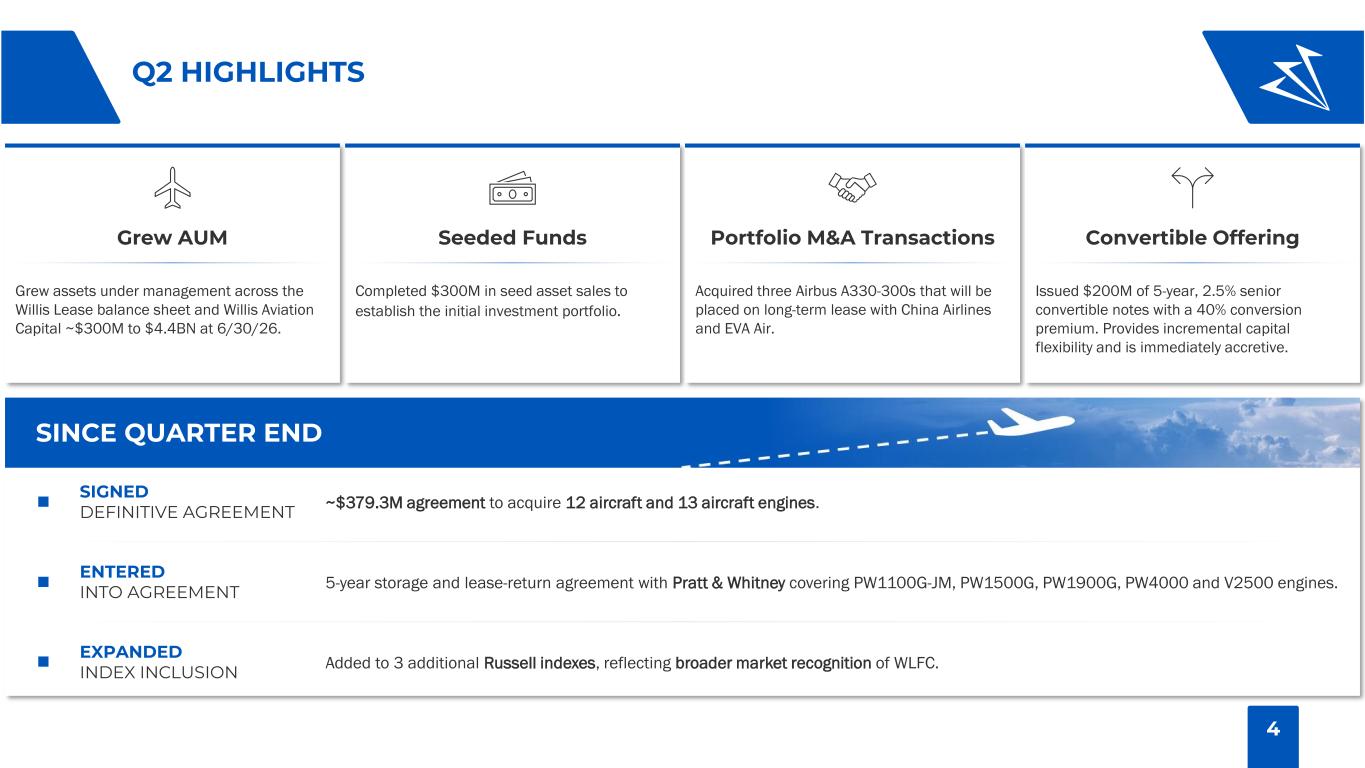
4 Q2 HIGHLIGHTS Seeded Funds Completed $300M in seed asset sales to establish the initial investment portfolio. Portfolio M&A Transactions Acquired three Airbus A330-300s that will be placed on long-term lease with China Airlines and EVA Air. Convertible Offering Issued $200M of 5-year, 2.5% senior convertible notes with a 40% conversion premium. Provides incremental capital flexibility and is immediately accretive. Grew AUM Grew assets under management across the Willis Lease balance sheet and Willis Aviation Capital ~$300M to $4.4BN at 6/30/26. SINCE QUARTER END ~$379.3M agreement to acquire 12 aircraft and 13 aircraft engines. SIGNED DEFINITIVE AGREEMENT 5-year storage and lease-return agreement with Pratt & Whitney covering PW1100G-JM, PW1500G, PW1900G, PW4000 and V2500 engines. ENTERED INTO AGREEMENT Added to 3 additional Russell indexes, reflecting broader market recognition of WLFC. EXPANDED INDEX INCLUSION
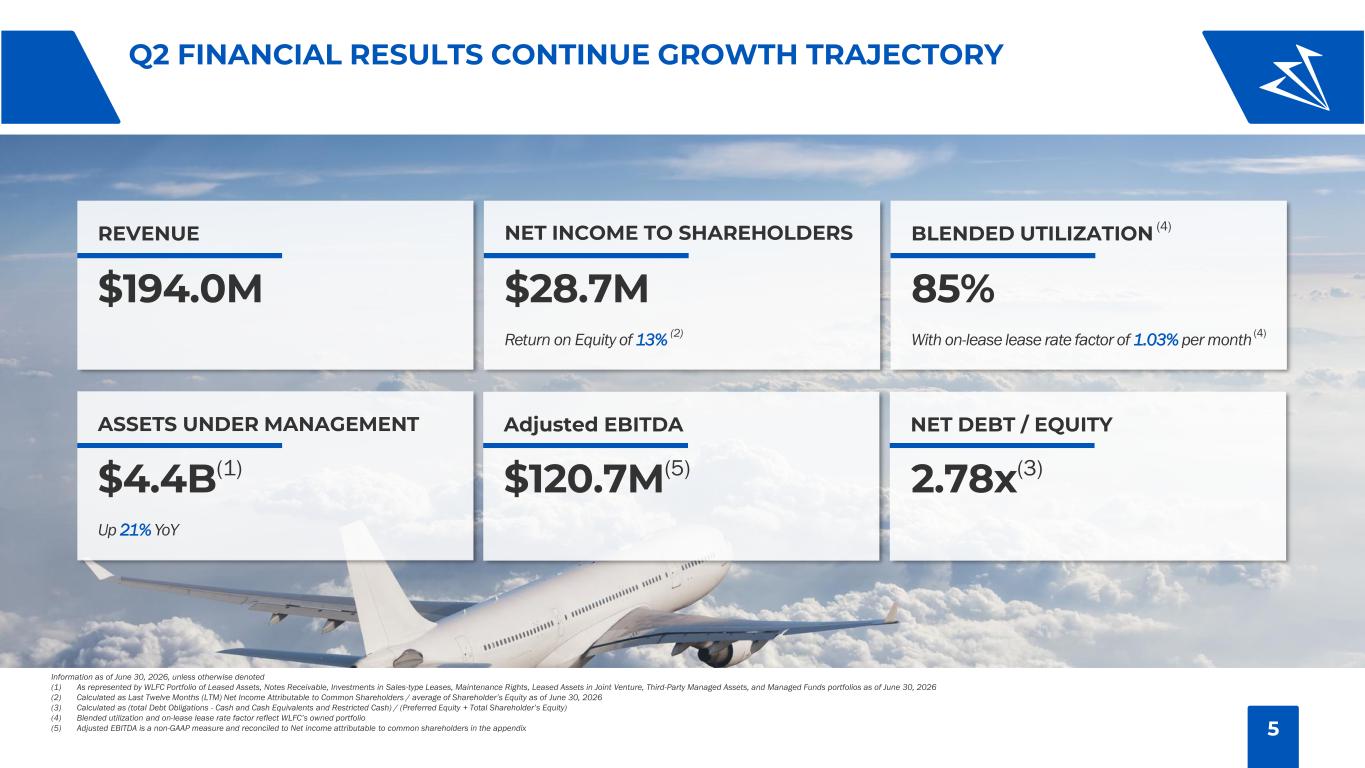
5 Q2 FINANCIAL RESULTS CONTINUE GROWTH TRAJECTORY Information as of June 30, 2026, unless otherwise denoted (1) As represented by WLFC Portfolio of Leased Assets, Notes Receivable, Investments in Sales-type Leases, Maintenance Rights, Leased Assets in Joint Venture, Third-Party Managed Assets, and Managed Funds portfolios as of June 30, 2026 (2) Calculated as Last Twelve Months (LTM) Net Income Attributable to Common Shareholders / average of Shareholder’s Equity as of June 30, 2026 (3) Calculated as (total Debt Obligations - Cash and Cash Equivalents and Restricted Cash) / (Preferred Equity + Total Shareholder’s Equity) (4) Blended utilization and on-lease lease rate factor reflect WLFC’s owned portfolio (5) Adjusted EBITDA is a non-GAAP measure and reconciled to Net income attributable to common shareholders in the appendix $194.0M $28.7M 85% $4.4B(1) $120.7M(5) 2.78x(3) With on-lease lease rate factor of 1.03% per month (4) REVENUE NET INCOME TO SHAREHOLDERS BLENDED UTILIZATION (4) ASSETS UNDER MANAGEMENT Adjusted EBITDA NET DEBT / EQUITY Return on Equity of 13% (2) Up 21% YoY
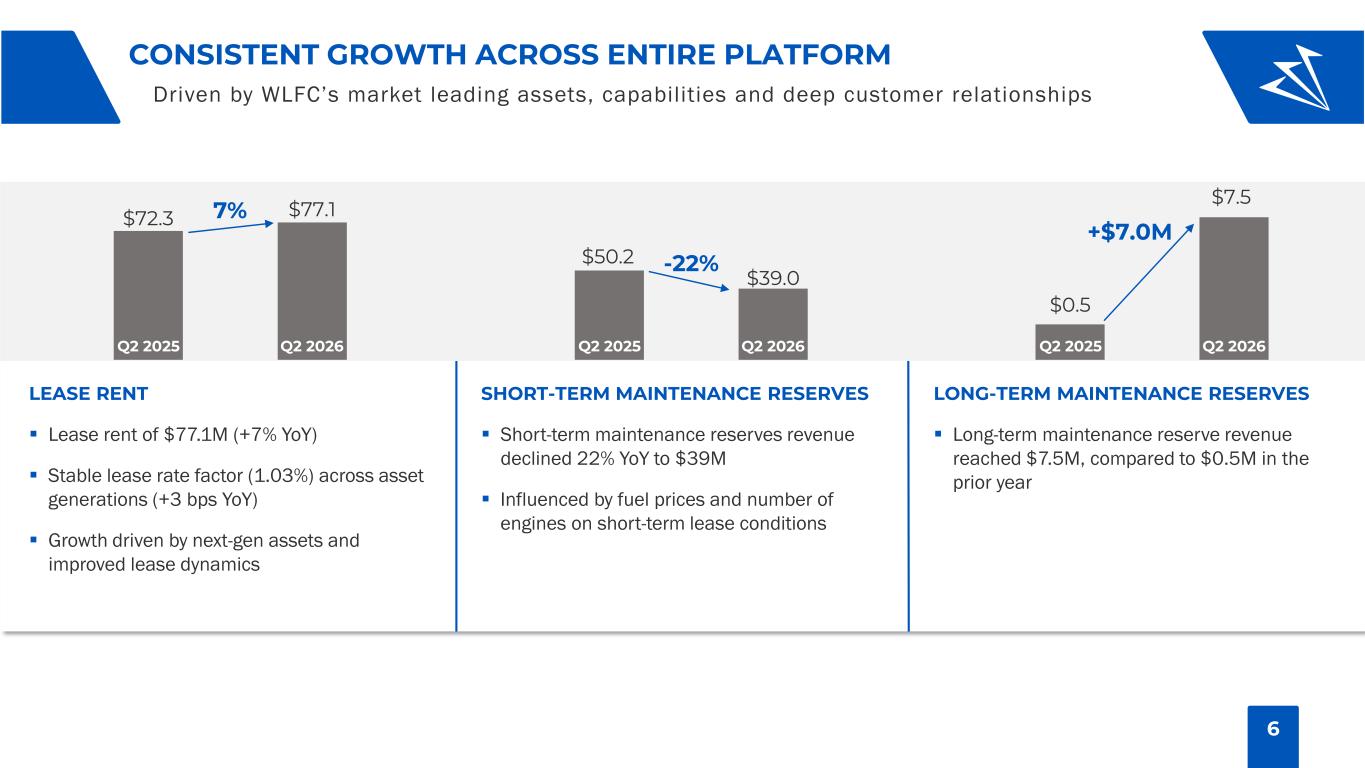
6 LONG-TERM MAINTENANCE RESERVES ▪ Long-term maintenance reserve revenue reached $7.5M, compared to $0.5M in the prior year SHORT-TERM MAINTENANCE RESERVES ▪ Short-term maintenance reserves revenue declined 22% YoY to $39M ▪ Influenced by fuel prices and number of engines on short-term lease conditions LEASE RENT ▪ Lease rent of $77.1M (+7% YoY) ▪ Stable lease rate factor (1.03%) across asset generations (+3 bps YoY) ▪ Growth driven by next-gen assets and improved lease dynamics $72.3 $77.1 7% Q2 2025 Q2 2026 Driven by WLFC’s market leading assets, capabilities and deep customer relationships CONSISTENT GROWTH ACROSS ENTIRE PLATFORM $50.2 $39.0 -22% Q2 2025 Q2 2026 $0.5 $7.5 +$7.0M Q2 2025 Q2 2026
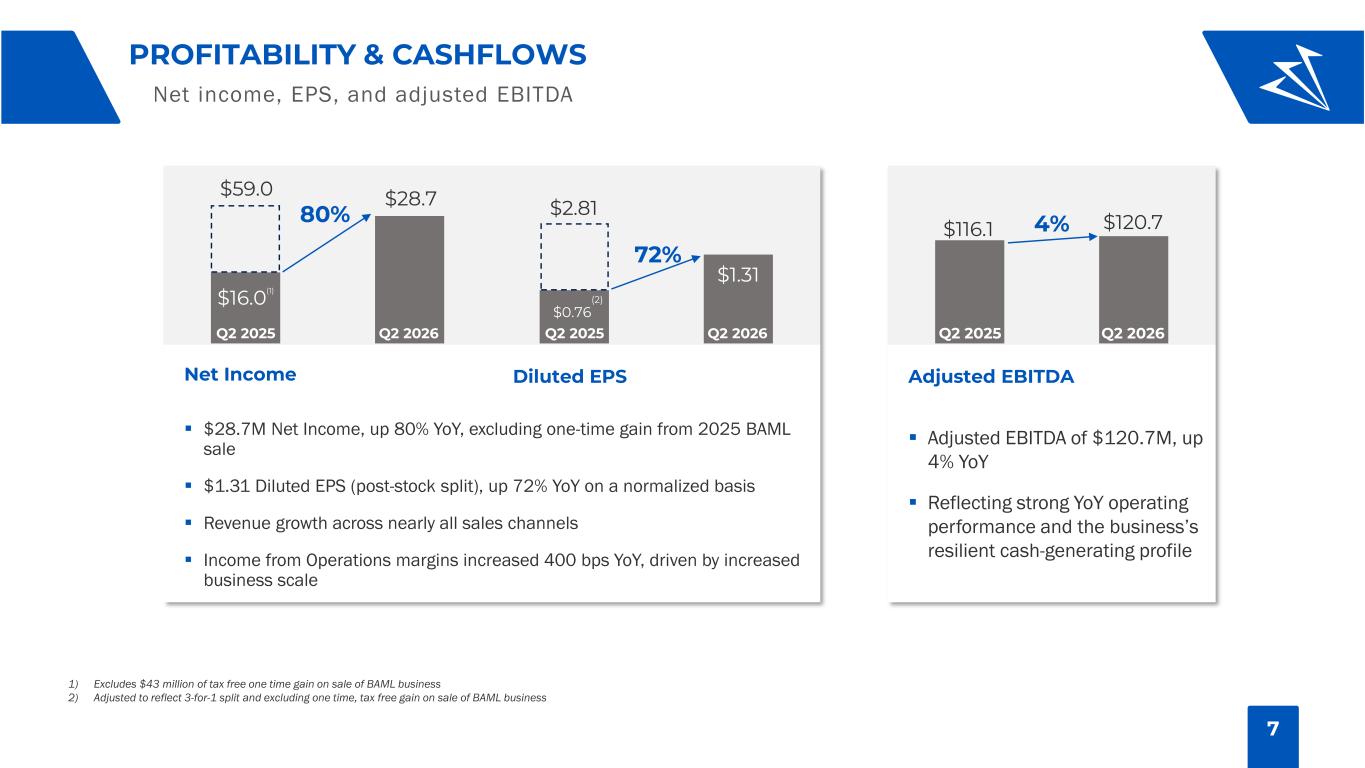
7 PROFITABILITY & CASHFLOWS Net income, EPS, and adjusted EBITDA Net Income ▪ $28.7M Net Income, up 80% YoY, excluding one-time gain from 2025 BAML sale ▪ $1.31 Diluted EPS (post-stock split), up 72% YoY on a normalized basis ▪ Revenue growth across nearly all sales channels ▪ Income from Operations margins increased 400 bps YoY, driven by increased business scale $16.0(1) $28.7 80% Q2 2025 Q2 2026 Diluted EPS $0.76 (2) $1.31 $2.81 72% Q2 2025 Q2 2026 Adjusted EBITDA ▪ Adjusted EBITDA of $120.7M, up 4% YoY ▪ Reflecting strong YoY operating performance and the business’s resilient cash-generating profile $116.1 $120.7 4% Q2 2025 Q2 2026 $59.0 1) Excludes $43 million of tax free one time gain on sale of BAML business 2) Adjusted to reflect 3-for-1 split and excluding one time, tax free gain on sale of BAML business
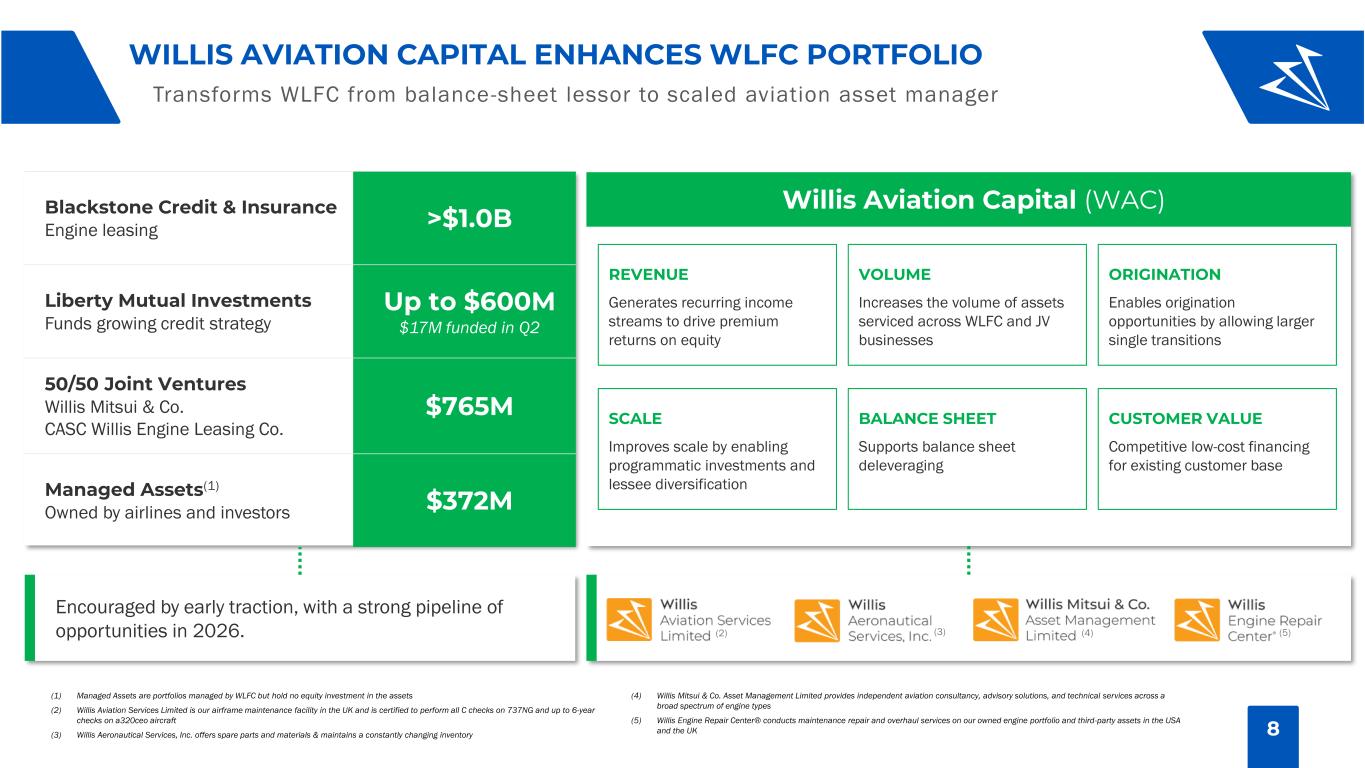
8 Encouraged by early traction, with a strong pipeline of opportunities in 2026. WILLIS AVIATION CAPITAL ENHANCES WLFC PORTFOLIO Transforms WLFC from balance-sheet lessor to scaled aviation asset manager Blackstone Credit & Insurance Engine leasing >$1.0B Liberty Mutual Investments Funds growing credit strategy Up to $600M $17M funded in Q2 50/50 Joint Ventures Willis Mitsui & Co. CASC Willis Engine Leasing Co. $765M Managed Assets(1) Owned by airlines and investors $372M REVENUE Generates recurring income streams to drive premium returns on equity (2) (3) (4) (5) (1) Managed Assets are portfolios managed by WLFC but hold no equity investment in the assets (2) Willis Aviation Services Limited is our airframe maintenance facility in the UK and is certified to perform all C checks on 737NG and up to 6-year checks on a320ceo aircraft (3) Willis Aeronautical Services, Inc. offers spare parts and materials & maintains a constantly changing inventory (4) Willis Mitsui & Co. Asset Management Limited provides independent aviation consultancy, advisory solutions, and technical services across a broad spectrum of engine types (5) Willis Engine Repair Center® conducts maintenance repair and overhaul services on our owned engine portfolio and third-party assets in the USA and the UK VOLUME Increases the volume of assets serviced across WLFC and JV businesses ORIGINATION Enables origination opportunities by allowing larger single transitions SCALE Improves scale by enabling programmatic investments and lessee diversification BALANCE SHEET Supports balance sheet deleveraging CUSTOMER VALUE Competitive low-cost financing for existing customer base Willis Aviation Capital (WAC)
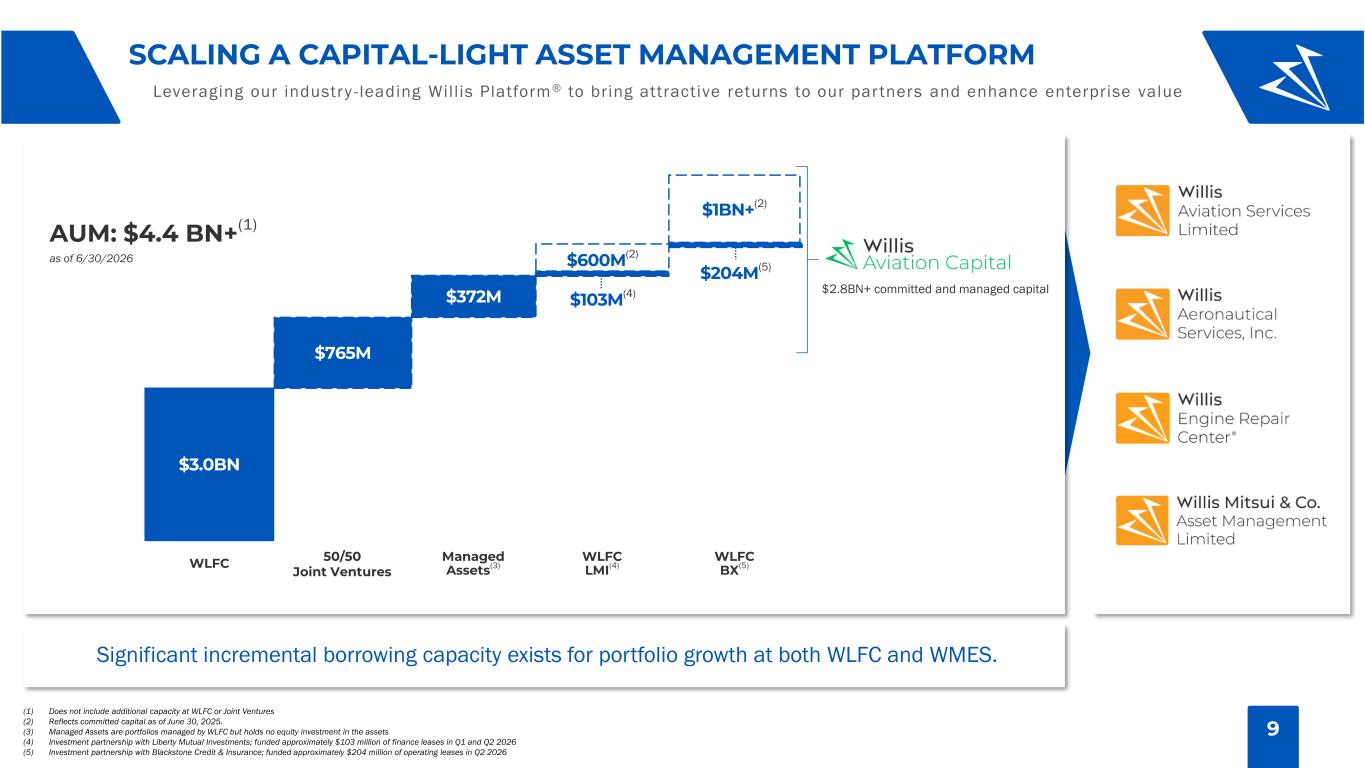
9 SCALING A CAPITAL-LIGHT ASSET MANAGEMENT PLATFORM Leveraging our industry -leading Will is Platform® to bring attractive returns to our par tners and enhance enterprise value (1) Does not include additional capacity at WLFC or Joint Ventures (2) Reflects committed capital as of June 30, 2025. (3) Managed Assets are portfolios managed by WLFC but holds no equity investment in the assets (4) Investment partnership with Liberty Mutual Investments; funded approximately $103 million of finance leases in Q1 and Q2 2026 (5) Investment partnership with Blackstone Credit & Insurance; funded approximately $204 million of operating leases in Q2 2026 WLFC 50/50 Joint Ventures $1B+ (2) Managed Assets(3) AUM: $4.4 BN+(1) as of 6/30/2026 WLFC LMI(4) WLFC BX(5) $2.8BN+ committed and managed capital $600M(2) $103M(4) $3.0BN $765M $372M 1 N+(2) Significant incremental borrowing capacity exists for portfolio growth at both WLFC and WMES. $204M(5)
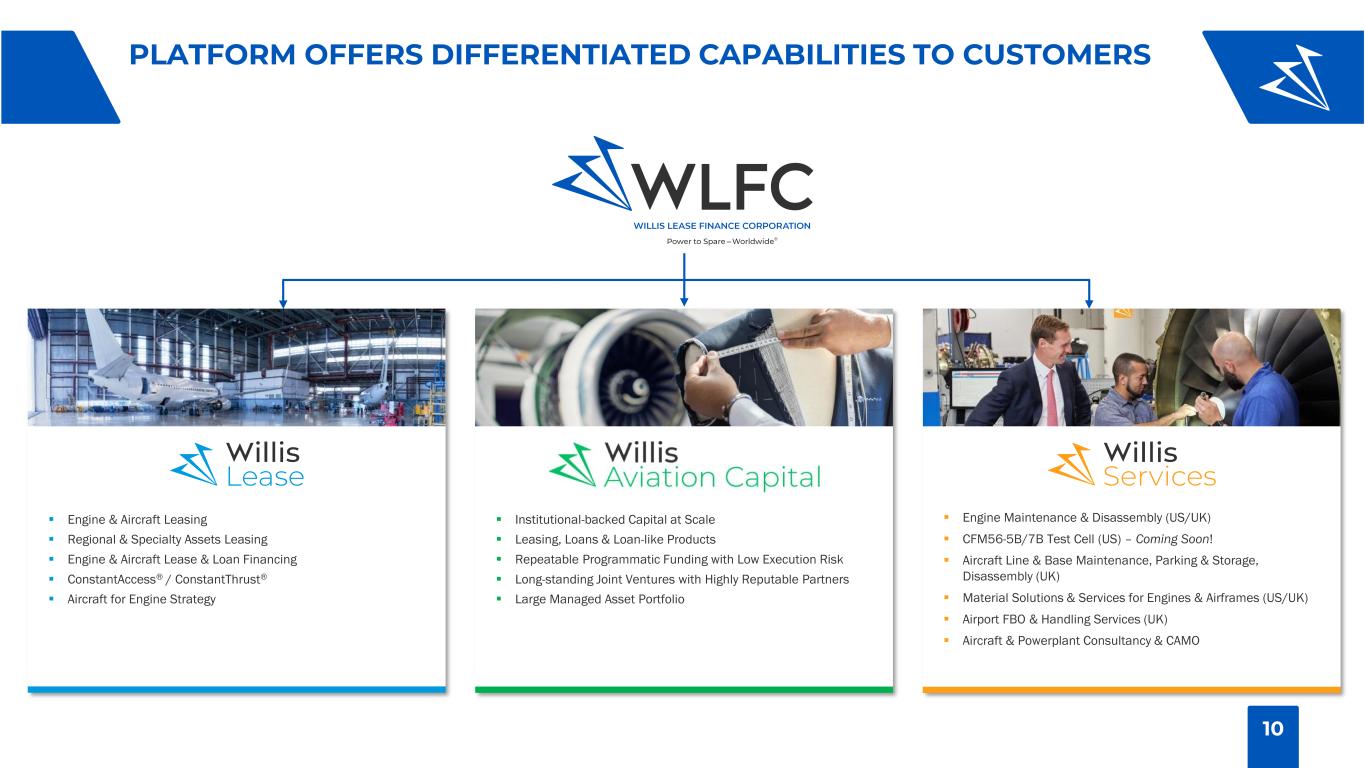
10 ▪ Engine & Aircraft Leasing ▪ Regional & Specialty Assets Leasing ▪ Engine & Aircraft Lease & Loan Financing ▪ ConstantAccess® / ConstantThrust® ▪ Aircraft for Engine Strategy ▪ Engine Maintenance & Disassembly (US/UK) ▪ CFM56-5B/7B Test Cell (US) – Coming Soon! ▪ Aircraft Line & Base Maintenance, Parking & Storage, Disassembly (UK) ▪ Material Solutions & Services for Engines & Airframes (US/UK) ▪ Airport FBO & Handling Services (UK) ▪ Aircraft & Powerplant Consultancy & CAMO ▪ Institutional-backed Capital at Scale ▪ Leasing, Loans & Loan-like Products ▪ Repeatable Programmatic Funding with Low Execution Risk ▪ Long-standing Joint Ventures with Highly Reputable Partners ▪ Large Managed Asset Portfolio PLATFORM OFFERS DIFFERENTIATED CAPABILITIES TO CUSTOMERS
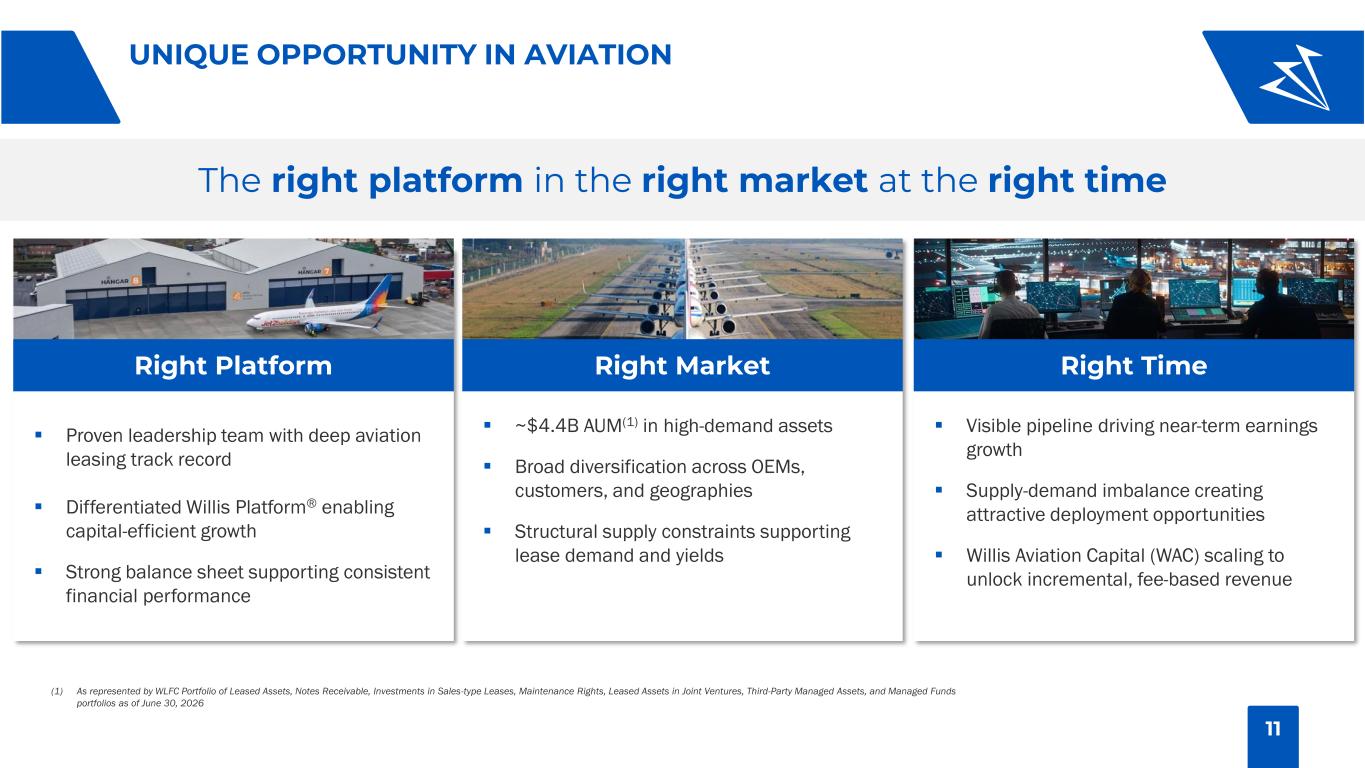
11 ▪ Visible pipeline driving near-term earnings growth ▪ Supply-demand imbalance creating attractive deployment opportunities ▪ Willis Aviation Capital (WAC) scaling to unlock incremental, fee-based revenue ▪ ~$4.4B AUM(1) in high-demand assets ▪ Broad diversification across OEMs, customers, and geographies ▪ Structural supply constraints supporting lease demand and yields UNIQUE OPPORTUNITY IN AVIATION (1) As represented by WLFC Portfolio of Leased Assets, Notes Receivable, Investments in Sales-type Leases, Maintenance Rights, Leased Assets in Joint Ventures, Third-Party Managed Assets, and Managed Funds portfolios as of June 30, 2026 ▪ Proven leadership team with deep aviation leasing track record ▪ Differentiated Willis Platform® enabling capital-efficient growth ▪ Strong balance sheet supporting consistent financial performance Right Platform Right Market Right Time The right platform in the right market at the right time

APPENDIX

Consolidated Quarterly Statements of Income 1
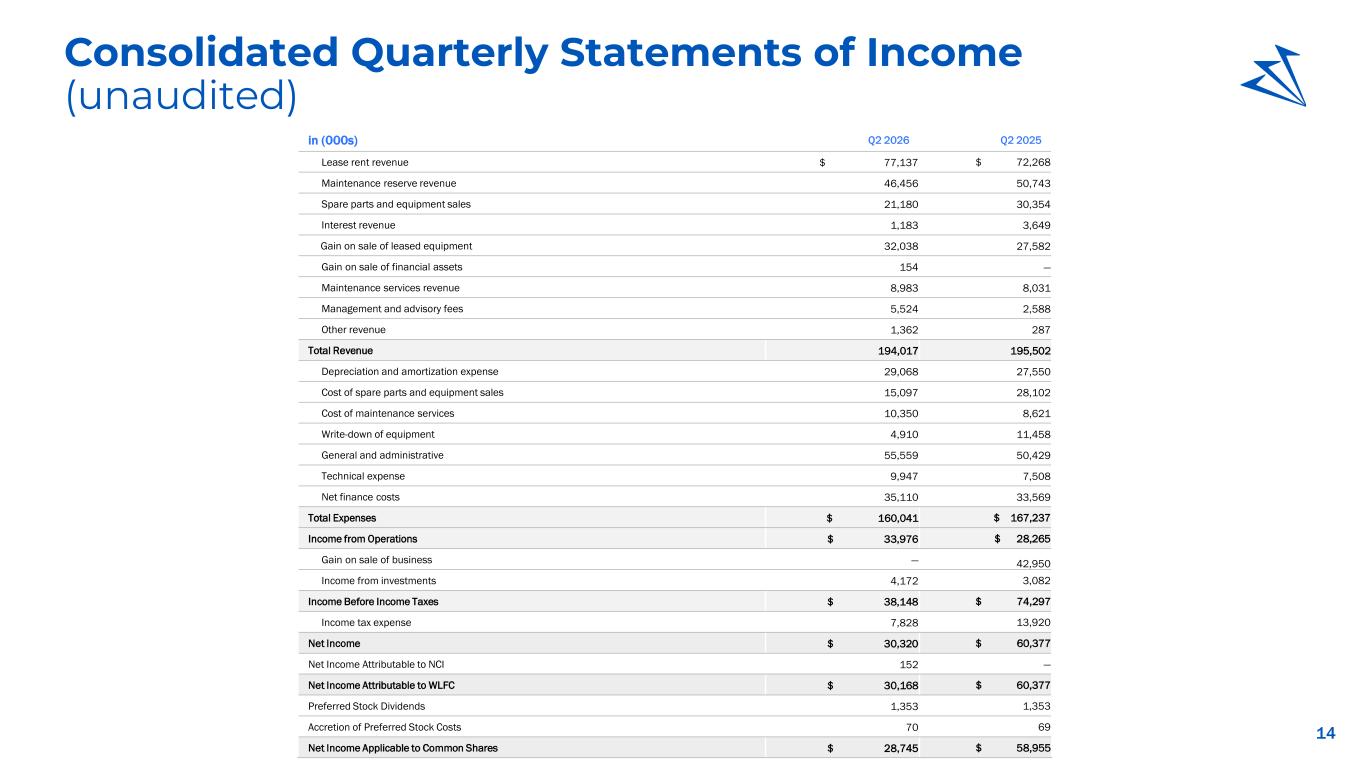
14 Consolidated Quarterly Statements of Income (unaudited) in (000s) Q2 2026 Q2 2025 Lease rent revenue $ 77,137 $ 72,268 Maintenance reserve revenue 46,456 50,743 Spare parts and equipment sales 21,180 30,354 Interest revenue 1,183 3,649 Gain on sale of leased equipment 32,038 27,582 Gain on sale of financial assets 154 — Maintenance services revenue 8,983 8,031 Management and advisory fees 5,524 2,588 Other revenue 1,362 287 Total Revenue 194,017 195,502 Depreciation and amortization expense 29,068 27,550 Cost of spare parts and equipment sales 15,097 28,102 Cost of maintenance services 10,350 8,621 Write-down of equipment 4,910 11,458 General and administrative 55,559 50,429 Technical expense 9,947 7,508 Net finance costs 35,110 33,569 Total Expenses $ 160,041 $ 167,237 Income from Operations $ 33,976 $ 28,265 Gain on sale of business — 42,950 Income from investments 4,172 3,082 Income Before Income Taxes $ 38,148 $ 74,297 Income tax expense 7,828 13,920 Net Income $ 30,320 $ 60,377 Net Income Attributable to NCI 152 — Net Income Attributable to WLFC $ 30,168 $ 60,377 Preferred Stock Dividends 1,353 1,353 Accretion of Preferred Stock Costs 70 69 Net Income Applicable to Common Shares $ 28,745 $ 58,955

Consolidated Balance Sheets 2
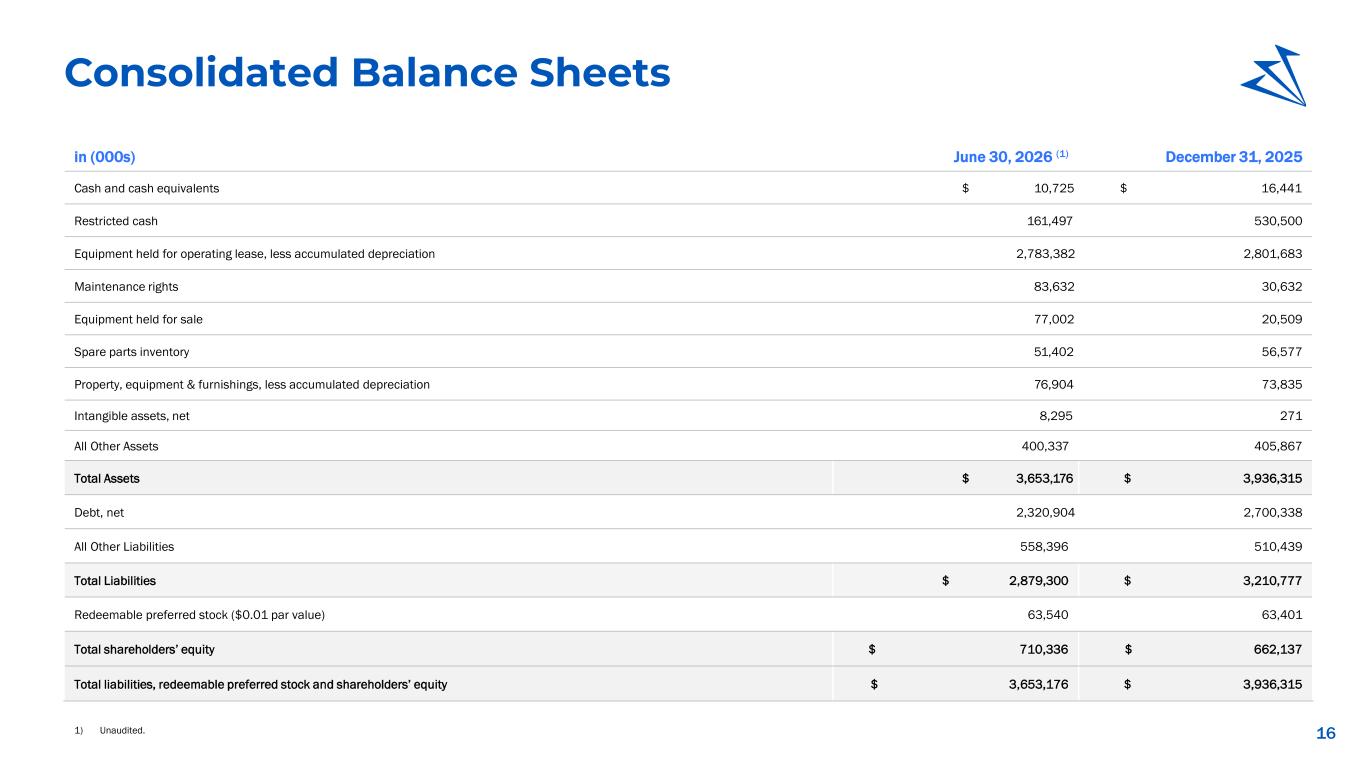
16 Consolidated Balance Sheets in (000s) June 30, 2026 (1) December 31, 2025 Cash and cash equivalents $ 10,725 $ 16,441 Restricted cash 161,497 530,500 Equipment held for operating lease, less accumulated depreciation 2,783,382 2,801,683 Maintenance rights 83,632 30,632 Equipment held for sale 77,002 20,509 Spare parts inventory 51,402 56,577 Property, equipment & furnishings, less accumulated depreciation 76,904 73,835 Intangible assets, net 8,295 271 All Other Assets 400,337 405,867 Total Assets $ 3,653,176 $ 3,936,315 Debt, net 2,320,904 2,700,338 All Other Liabilities 558,396 510,439 Total Liabilities $ 2,879,300 $ 3,210,777 Redeemable preferred stock ($0.01 par value) 63,540 63,401 Total shareholders’ equity $ 710,336 $ 662,137 Total liabilities, redeemable preferred stock and shareholders’ equity $ 3,653,176 $ 3,936,315 1) Unaudited.
Reconciliation of Non-GAAP Measures 3
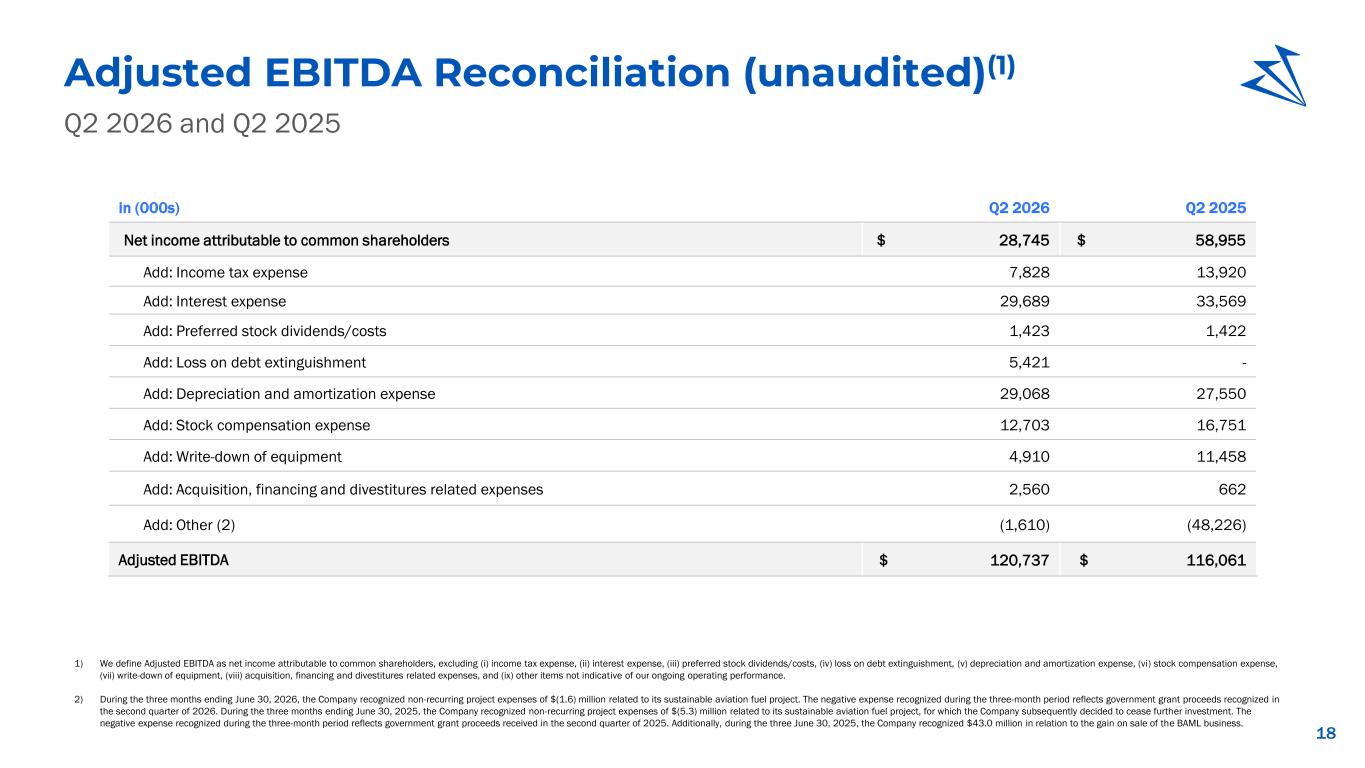
18 Adjusted EBITDA Reconciliation (unaudited)(1) Q2 2026 and Q2 2025 in (000s) Q2 2026 Q2 2025 Net income attributable to common shareholders $ 28,745 $ 58,955 Add: Income tax expense 7,828 13,920 Add: Interest expense 29,689 33,569 Add: Preferred stock dividends/costs 1,423 1,422 Add: Loss on debt extinguishment 5,421 - Add: Depreciation and amortization expense 29,068 27,550 Add: Stock compensation expense 12,703 16,751 Add: Write-down of equipment 4,910 11,458 Add: Acquisition, financing and divestitures related expenses 2,560 662 Add: Other (2) (1,610) (48,226) Adjusted EBITDA $ 120,737 $ 116,061 1) We define Adjusted EBITDA as net income attributable to common shareholders, excluding (i) income tax expense, (ii) interest expense, (iii) preferred stock dividends/costs, (iv) loss on debt extinguishment, (v) depreciation and amortization expense, (vi) stock compensation expense, (vii) write-down of equipment, (viii) acquisition, financing and divestitures related expenses, and (ix) other items not indicative of our ongoing operating performance. 2) During the three months ending June 30, 2026, the Company recognized non-recurring project expenses of $(1.6) million related to its sustainable aviation fuel project. The negative expense recognized during the three-month period reflects government grant proceeds recognized in the second quarter of 2026. During the three months ending June 30, 2025, the Company recognized non-recurring project expenses of $(5.3) million related to its sustainable aviation fuel project, for which the Company subsequently decided to cease further investment. The negative expense recognized during the three-month period reflects government grant proceeds received in the second quarter of 2025. Additionally, during the three June 30, 2025, the Company recognized $43.0 million in relation to the gain on sale of the BAML business.