Pay vs Performance Disclosure
May 31, 2026
USD ($)
$ / shares
May 31, 2025
USD ($)
$ / shares
May 31, 2024
USD ($)
$ / shares
May 31, 2023
USD ($)
$ / shares
May 31, 2022
USD ($)
$ / shares
Pay versus performance
The following table sets forth additional compensation information of our Principal Executive Officer (PEO) and our non-PEO NEOs along with total shareholder return, net income, and adjusted diluted earnings per share from continuing operations performance results for our fiscal years ended May 31, 2026, May 31, 2025, 2024, 2023 and 2022:
Year1 | Summary Compensation Table Total for PEO ($) | Compensation Actually Paid to PEO2, 3 ($) | Average Summary Compensation Table Total for Non-PEO NEOs ($) | Average Compensation Actually Paid to Non-PEO NEOs2, 3 ($) | Value of Initial Fixed $100 Investment Based On:5 | Net Income ($) | Adjusted Diluted Earnings per Share from Continuing Operations ($)6 | |||||||||||||||||||
Company Total Shareholder Return ($) | Peer Group Total Shareholder Return ($) | |||||||||||||||||||||||||
20264 | 9,867,963 | 27,555,674 | 2,111,410 | 3,588,901 | 311.83 | 305.35 | 187,700,000 | 5.05 | ||||||||||||||||||
2025 | 8,146,124 | 7,451,224 | 2,133,675 | 1,943,607 | 147.09 | 204.66 | 12,500,000 | 3.91 | ||||||||||||||||||
2024 | 7,865,450 | 16,870,229 | 2,167,868 | 3,457,905 | 170.04 | 155.65 | 46,300,000 | 3.33 | ||||||||||||||||||
2023 | 6,709,139 | 10,703,256 | 1,808,687 | 2,732,276 | 120.02 | 104.33 | 90,200,000 | 2.86 | ||||||||||||||||||
2022 | 12,327,343 | 13,416,164 | 1,793,579 | 2,238,871 | 115.50 | 93.31 | 78,700,000 | 2.38 | ||||||||||||||||||
1 | For each year presented above except for 2024 and 2026, the NEOs included in the compensation columns reflect John M. Holmes as our PEO and Sean M. Gillen, Jessica A. Garascia, Christopher A. Jessup, and Eric Pachapa as our non-PEOs. For 2024, Tracey Patterson was included in place of Eric Pachapa. For 2026, Dylan Z. Wolin and Sarah L. Flanagan were also included. |
2 | Fair value or change in fair value, as applicable, of equity awards in the “Actually Paid” columns was determined by reference to (1) for time-based restricted stock awards, closing price on applicable year-end date(s) or, in the case of vesting dates, the actual vesting price, (2) for performance-based restricted stock awards, the estimated payout used to recognize our expense in accordance with FASB ASC Topic 718 except using the closing price on applicable year-end date(s) or, in the case of vesting dates, the actual vesting price, and (3) for stock options, a Black-Scholes fair value as of the applicable year-end or vesting date(s), determined based on the same methodology as used to determine grant date fair value but using the closing stock price on the applicable revaluation date as the current market price and with an expected life equal to the original ratio of expected life relative to the ten year contractual life multiplied times the remaining life as of the applicable revaluation date, and in all cases based on updated volatility, risk free rates, and expected dividend rates determined as of the revaluation dates. |
3 | For the portion of “Actually Paid” compensation that is based on year-end stock prices, the following prices were used: 2026 – $112.62 (83.4% increase from prior year); 2025 – $61.41 (13.5% decrease from prior year), 2024 – $70.99 (41.7% increase from prior year), 2023 – $50.11 (3.9% increase from prior year), and 2022 – $48.22 (15.5% increase from prior year). |
4 | 2026 compensation “Actually Paid” to PEO and the average Actually Paid to non-PEOs reflects the following adjustments from Total compensation reported in the Summary Compensation Table: |
PEO ($) | Average Non-PEO ($) | |||||||
Total Reported in 2026 Summary Compensation Table (SCT) | 9,867,963 | 2,111,410 | ||||||
Less, value of stock awards and option awards reported in SCT | (5,797,204) | (1,051,849) | ||||||
Plus, year-end value of awards granted in fiscal year that are unvested and outstanding | 8,846,375 | 1,098,910 | ||||||
Plus, change in fair value of prior year awards that are outstanding and unvested | 12,622,505 | 1,165,343 | ||||||
Plus, change in fair value (from prior year-end) of prior year awards that vested this year | 2,016,035 | 265,087 | ||||||
Total adjustments | 17,687,711 | 1,477,491 | ||||||
Actual compensation paid for Fiscal Year 2026 | 27,555,674 | 3,588,901 | ||||||
5 | Each year reflects what the cumulative value of $100 would be, including reinvestment of dividends, if such amount were invested on June 1, 2021. Peer group TSR reflects the Company’s “2026 peer group” as reflected in our 2026 Annual Report on Form 10-K pursuant to Item 201(e) of Regulation S-K and “Fiscal Year 2026 peer group” in this proxy statement. The Fiscal Year 2026 peer group is the same as the Fiscal Year 2025 peer group except that it reflects the removal of Barnes Group and Spirit Aerosystems. The new peer group displayed is therefore different from our prior year proxy statement. The old peer group TSR amounts for the years ended May 31, 2026, 2025, 2024, 2023 and 2022 were $297.31, $198.21, $149.73, $101.07, and $90.49, respectively. |
6 | Adjusted diluted earnings per share from continuing operations, a non-GAAP financial measure, is our GAAP diluted earnings per share from continuing operations adjusted to exclude items of an unusual nature including but not limited to acquisition costs including integration and amortization expenses from recent acquisitions, business divestitures, workforce actions, subsidies and costs, impairment and exit charges, facility consolidation and repositioning costs, FCPA settlement and investigation costs, purchase accounting and legal settlements, strategic project costs, equity investments gains and losses, pension settlements, and significant customer events such as early terminations, contract restructurings, forward loss provisions and bankruptcies. We use this non-GAAP financial measure in our compensation structure as it illustrates our core operating performance unaffected by the impact of certain items that management does not believe are indicative of our ongoing and core operating activities. |
1 | For each year presented above except for 2024 and 2026, the NEOs included in the compensation columns reflect John M. Holmes as our PEO and Sean M. Gillen, Jessica A. Garascia, Christopher A. Jessup, and Eric Pachapa as our non-PEOs. For 2024, Tracey Patterson was included in place of Eric Pachapa. For 2026, Dylan Z. Wolin and Sarah L. Flanagan were also included. |
5 | Each year reflects what the cumulative value of $100 would be, including reinvestment of dividends, if such amount were invested on June 1, 2021. Peer group TSR reflects the Company’s “2026 peer group” as reflected in our 2026 Annual Report on Form 10-K pursuant to Item 201(e) of Regulation S-K and “Fiscal Year 2026 peer group” in this proxy statement. The Fiscal Year 2026 peer group is the same as the Fiscal Year 2025 peer group except that it reflects the removal of Barnes Group and Spirit Aerosystems. The new peer group displayed is therefore different from our prior year proxy statement. The old peer group TSR amounts for the years ended May 31, 2026, 2025, 2024, 2023 and 2022 were $297.31, $198.21, $149.73, $101.07, and $90.49, respectively. |
5 | Each year reflects what the cumulative value of $100 would be, including reinvestment of dividends, if such amount were invested on June 1, 2021. Peer group TSR reflects the Company’s “2026 peer group” as reflected in our 2026 Annual Report on Form 10-K pursuant to Item 201(e) of Regulation S-K and “Fiscal Year 2026 peer group” in this proxy statement. The Fiscal Year 2026 peer group is the same as the Fiscal Year 2025 peer group except that it reflects the removal of Barnes Group and Spirit Aerosystems. The new peer group displayed is therefore different from our prior year proxy statement. The old peer group TSR amounts for the years ended May 31, 2026, 2025, 2024, 2023 and 2022 were $297.31, $198.21, $149.73, $101.07, and $90.49, respectively. |
4 | 2026 compensation “Actually Paid” to PEO and the average Actually Paid to non-PEOs reflects the following adjustments from Total compensation reported in the Summary Compensation Table: |
PEO ($) | Average Non-PEO ($) | |||||||
Total Reported in 2026 Summary Compensation Table (SCT) | 9,867,963 | 2,111,410 | ||||||
Less, value of stock awards and option awards reported in SCT | (5,797,204) | (1,051,849) | ||||||
Plus, year-end value of awards granted in fiscal year that are unvested and outstanding | 8,846,375 | 1,098,910 | ||||||
Plus, change in fair value of prior year awards that are outstanding and unvested | 12,622,505 | 1,165,343 | ||||||
Plus, change in fair value (from prior year-end) of prior year awards that vested this year | 2,016,035 | 265,087 | ||||||
Total adjustments | 17,687,711 | 1,477,491 | ||||||
Actual compensation paid for Fiscal Year 2026 | 27,555,674 | 3,588,901 | ||||||
4 | 2026 compensation “Actually Paid” to PEO and the average Actually Paid to non-PEOs reflects the following adjustments from Total compensation reported in the Summary Compensation Table: |
PEO ($) | Average Non-PEO ($) | |||||||
Total Reported in 2026 Summary Compensation Table (SCT) | 9,867,963 | 2,111,410 | ||||||
Less, value of stock awards and option awards reported in SCT | (5,797,204) | (1,051,849) | ||||||
Plus, year-end value of awards granted in fiscal year that are unvested and outstanding | 8,846,375 | 1,098,910 | ||||||
Plus, change in fair value of prior year awards that are outstanding and unvested | 12,622,505 | 1,165,343 | ||||||
Plus, change in fair value (from prior year-end) of prior year awards that vested this year | 2,016,035 | 265,087 | ||||||
Total adjustments | 17,687,711 | 1,477,491 | ||||||
Actual compensation paid for Fiscal Year 2026 | 27,555,674 | 3,588,901 | ||||||
Compensation actually paid (CAP) and Company total shareholder return (TSR)
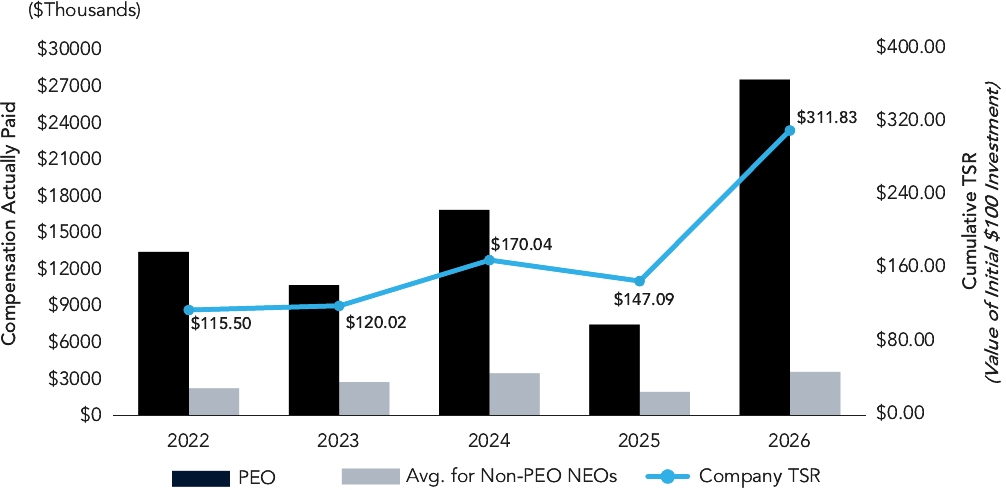
The graph below illustrates the relationship between the CAP to our CEO and the other NEOs and the Company’s TSR during the period covered under the “Pay versus performance disclosure” above. The CAP figures shown below are calculated as required by SEC requirements, which include unvested and unpaid amounts. Each year of Company TSR reflects what the cumulative value of $100 would be, including reinvestment of dividends, if such amount were invested on June 1, 2021. As shown in the “Pay versus performance
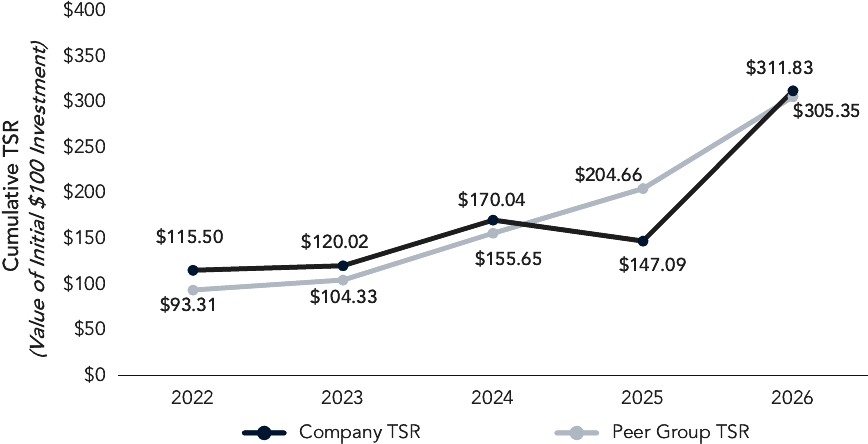
disclosure” above and below in the Company TSR vs. Peer Group TSR graph, the value of $100 invested in the Peer Group on June 1, 2021 would be $93.31 at the end of Fiscal Year 2022, $104.33 at the end of Fiscal Year 2023, $155.65 at the end of Fiscal Year 2024, $204.66 at the end of Fiscal Year 2025, and $305.35 at the end of Fiscal Year 2026.
Compensation Actually Paid vs. Company TSR
Compensation actually paid (CAP) and net income
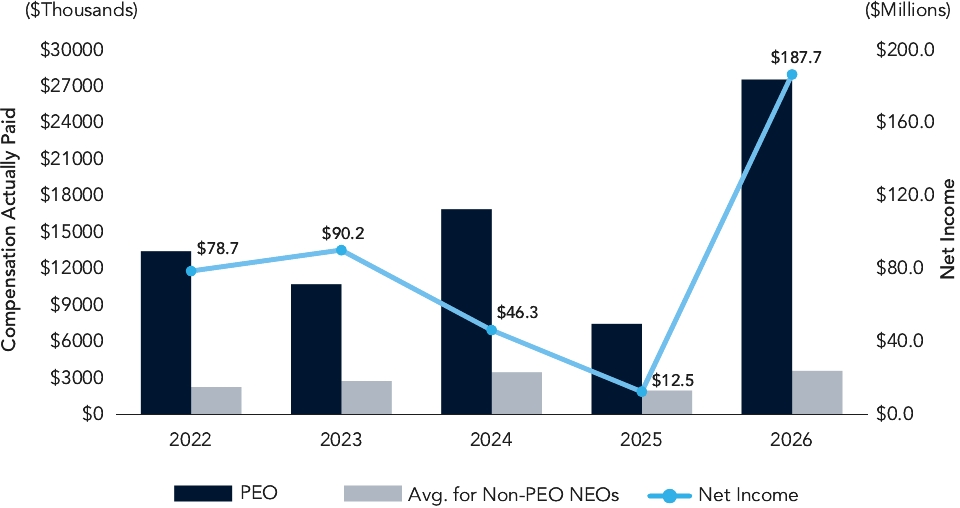
The graph below illustrates the relationship between the CAP to our CEO and the other NEOs and the Company’s net income during the period covered under the “Pay versus performance disclosure” above. The CAP figures shown below are calculated as required by SEC requirements, which include unvested and unpaid amounts.
Compensation Actually Paid vs. Net Income
Compensation actually paid (CAP) and adjusted diluted earnings per share from continuing operations
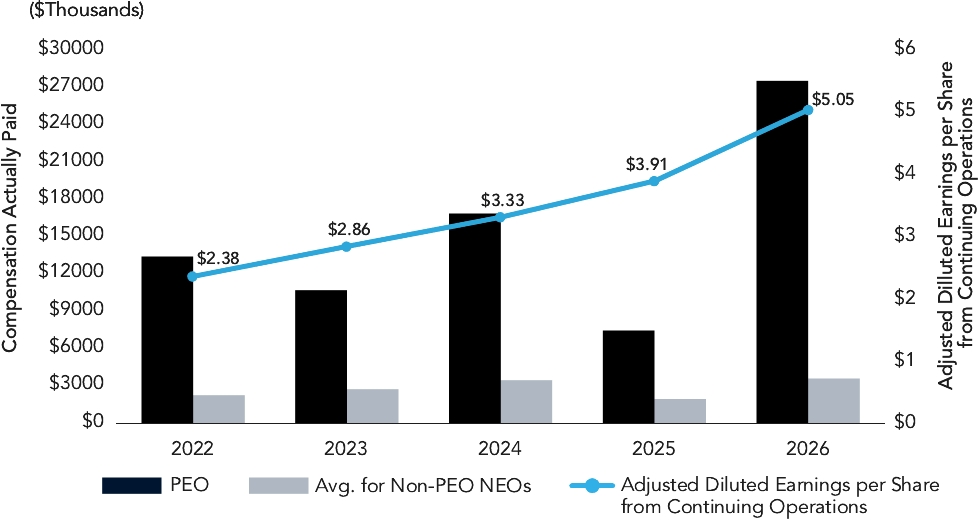
The graph below illustrates the relationship between the CAP to our CEO and the other NEOs and the Company’s adjusted diluted earnings per share from continuing operations during the period covered under the “Pay versus performance disclosure” above. The CAP figures shown below are calculated as required by SEC requirements, which include unvested and unpaid amounts.
Compensation Actually Paid vs. Adjusted Diluted Earnings per Share from Continuing Operations
Company TSR and peer group TSR
The graph below illustrates the relationship between the Company’s TSR and peer group TSR during the period covered under the “Pay versus performance disclosure” above. The peer group used is the Company’s “2026 peer group” as reflected in our 2026 Annual Report on Form 10-K pursuant to Item 201(e) of Regulation S-K and “Fiscal Year 2026 peer group” in this proxy statement. Each year reflects what the cumulative value of $100 would be, including reinvestment of dividends, if such amount were invested on June 1, 2021.
Company TSR vs. Peer Group TSR
Tabular list
The following performance measures reflect the Company’s most important performance measures used to link compensation actually paid to our NEOs for Fiscal Year 2026 to Company performance, as further described and defined in the CD&A:
Adjusted diluted earnings per share from continuing operations | ||
Net working capital turns | ||
Return on invested capital | ||
6 | Adjusted diluted earnings per share from continuing operations, a non-GAAP financial measure, is our GAAP diluted earnings per share from continuing operations adjusted to exclude items of an unusual nature including but not limited to acquisition costs including integration and amortization expenses from recent acquisitions, business divestitures, workforce actions, subsidies and costs, impairment and exit charges, facility consolidation and repositioning costs, FCPA settlement and investigation costs, purchase accounting and legal settlements, strategic project costs, equity investments gains and losses, pension settlements, and significant customer events such as early terminations, contract restructurings, forward loss provisions and bankruptcies. We use this non-GAAP financial measure in our compensation structure as it illustrates our core operating performance unaffected by the impact of certain items that management does not believe are indicative of our ongoing and core operating activities. |