
Q2 2026 Earnings Presentation August 5, 2026
Forward-Looking Statements Certain statements set forth in this presentation constitute forward-looking statements (within the meaning of Section 27A of the Securities Act of 1933 and Section 21E of the Securities Exchange Act of 1934) regarding Flotek Industries, Inc.’s business, financial condition, results of operations and prospects. These statements include, without limitation, statements regarding expected revenues under the Company’s long-term contracts, the total term of such contracts, the timing of the scaling and deployment of equipment, the total power capacity and operating performance of equipment once deployed, and the Company’s ability to perform under and satisfy the terms and conditions of its contracts. Words such as will, continue, expects, anticipates, intends, plans, believes, seeks, estimates and similar expressions or variations of such words are intended to identify forward-looking statements, but are not the exclusive means of identifying forward-looking statements in this presentation. Although forward-looking statements in this presentation reflect the good faith judgment of management, such statements can only be based on facts and factors currently known to management. Consequently, forward-looking statements are inherently subject to risks and uncertainties, and actual results and outcomes may differ materially from the results and outcomes discussed in the forward-looking statements. These statements include, without limitation, statements regarding expected revenues under the Company’s long-term contracts, the total term of such contracts, the timing of the scaling and deployment of equipment, the total power capacity and operating performance of equipment once deployed, and the Company’s ability to perform under and satisfy the terms and conditions of its contracts. Factors that could cause actual results to differ materially from anticipated results include risks related to the Company’s projects that are outside the Company's control, including, without limitation, securing fuel supply, international logistics, obtaining permits and governmental approvals, satisfying financial requirements, third-party equipment delivery, construction execution and scheduling, meeting execution deadlines, integrating systems, political and regulatory developments, geopolitical instability or armed conflicts, and severe weather events. Further information about the risks and uncertainties that may impact the Company are set forth in the Company’s most recent filing with the Securities and Exchange Commission on Form 10-K and Form 10-Q (including, without limitation, in the "Risk Factors" section thereof), and in the Company’s other SEC filings and publicly available documents. Readers are urged not to place undue reliance on these forward-looking statements, which speak only as of the date of this presentation. The Company undertakes no obligation to revise or update any forward-looking statements in order to reflect any event or circumstance that may arise after the date of this presentation. This presentation includes certain non-GAAP measures. Please refer to the reconciliations provided in the earnings press release and the appendix in this presentation for the most comparable GAAP measure. // 2
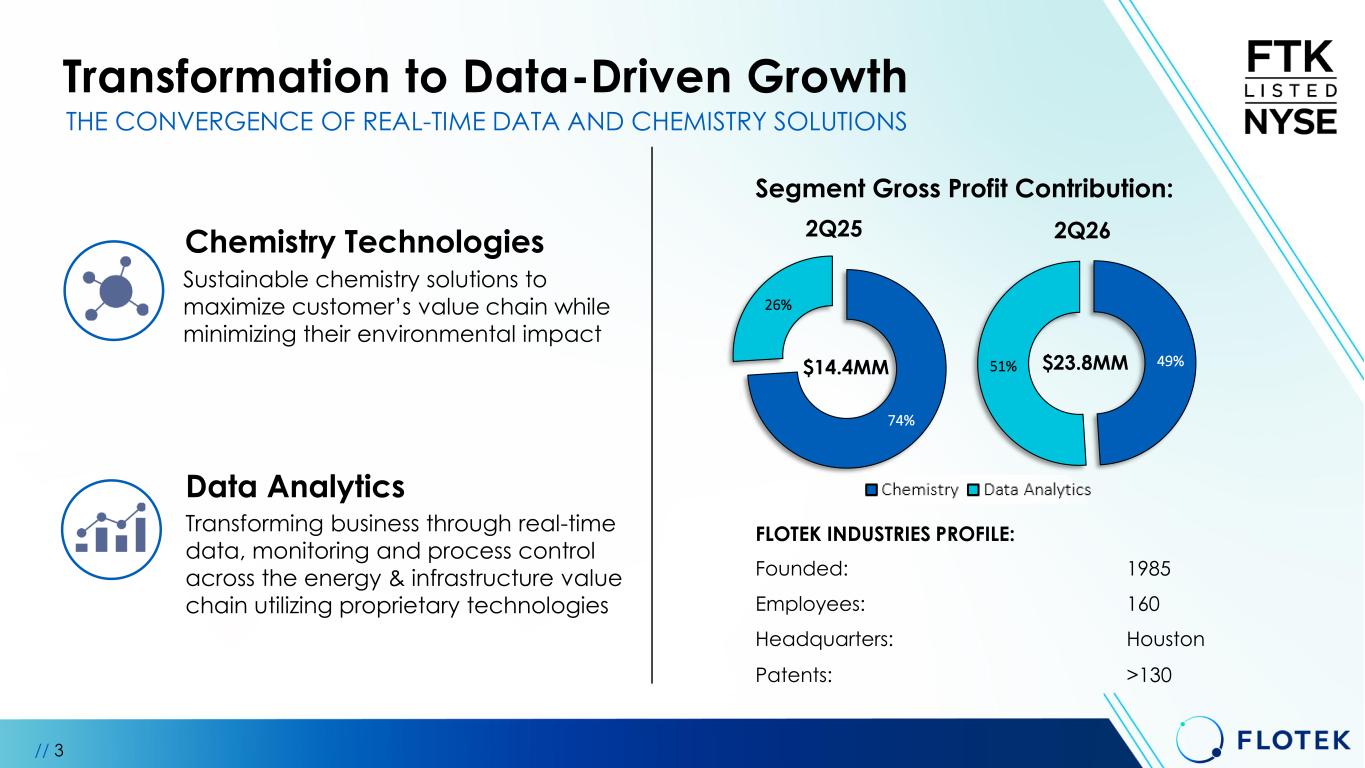
74% 26% 2Q25 49%51% 2Q26 Transformation to Data-Driven Growth // 3 THE CONVERGENCE OF REAL-TIME DATA AND CHEMISTRY SOLUTIONS Transforming business through real-time data, monitoring and process control across the energy & infrastructure value chain utilizing proprietary technologies Data Analytics Sustainable chemistry solutions to maximize customer’s value chain while minimizing their environmental impact Chemistry Technologies FLOTEK INDUSTRIES PROFILE: Founded: 1985 Employees: 160 Headquarters: Houston Patents: >130 Segment Gross Profit Contribution: $23.8MM$14.4MM
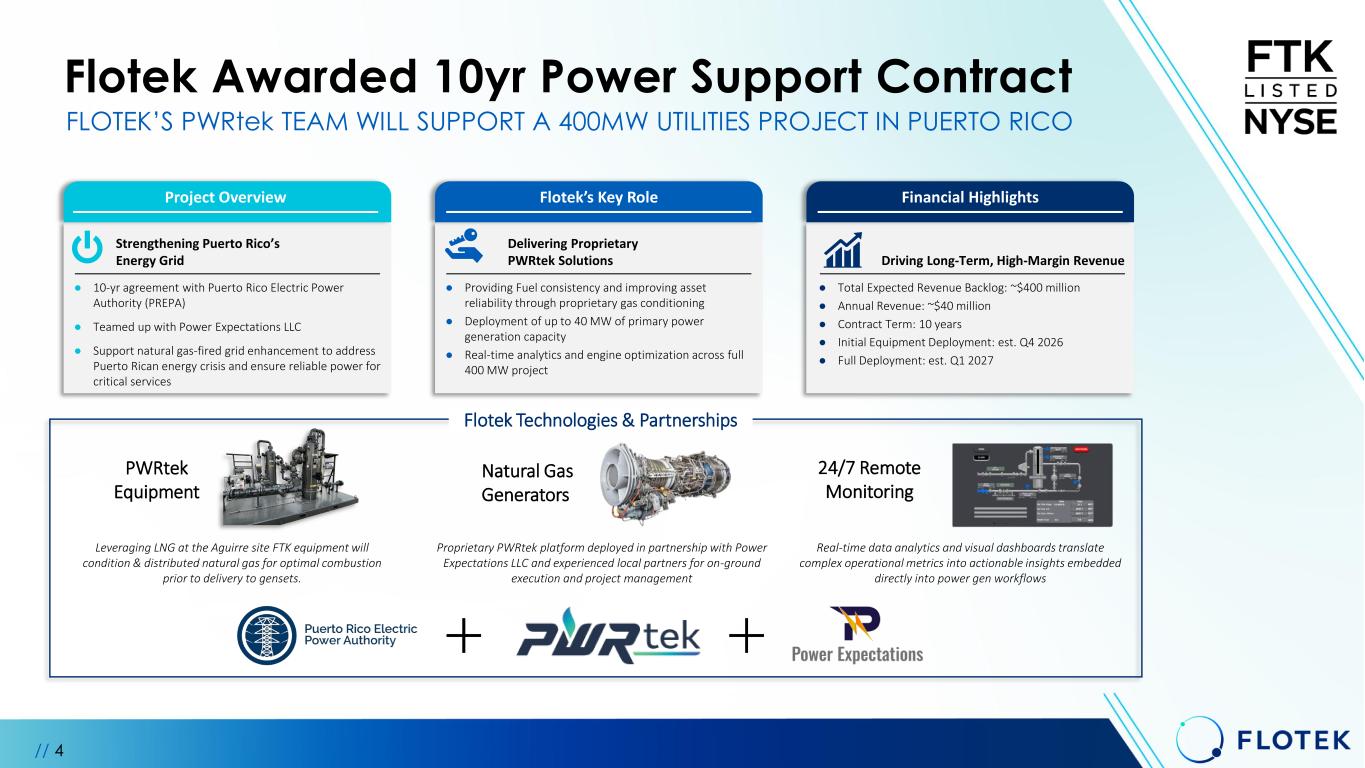
Flotek Awarded 10yr Power Support Contract // 4 FLOTEK’S PWRtek TEAM WILL SUPPORT A 400MW UTILITIES PROJECT IN PUERTO RICO Project Overview Flotek’s Key Role Financial Highlights Strengthening Puerto Rico’s Energy Grid Delivering Proprietary PWRtek Solutions Driving Long-Term, High-Margin Revenue ● 10-yr agreement with Puerto Rico Electric Power Authority (PREPA) ● Teamed up with Power Expectations LLC ● Support natural gas-fired grid enhancement to address Puerto Rican energy crisis and ensure reliable power for critical services ● Total Expected Revenue Backlog: ~$400 million ● Annual Revenue: ~$40 million ● Contract Term: 10 years ● Initial Equipment Deployment: est. Q4 2026 ● Full Deployment: est. Q1 2027 ● Providing Fuel consistency and improving asset reliability through proprietary gas conditioning ● Deployment of up to 40 MW of primary power generation capacity ● Real-time analytics and engine optimization across full 400 MW project Real-time data analytics and visual dashboards translate complex operational metrics into actionable insights embedded directly into power gen workflows Flotek Technologies & Partnerships Leveraging LNG at the Aguirre site FTK equipment will condition & distributed natural gas for optimal combustion prior to delivery to gensets. Proprietary PWRtek platform deployed in partnership with Power Expectations LLC and experienced local partners for on-ground execution and project management PWRtek Equipment Natural Gas Generators 24/7 Remote Monitoring
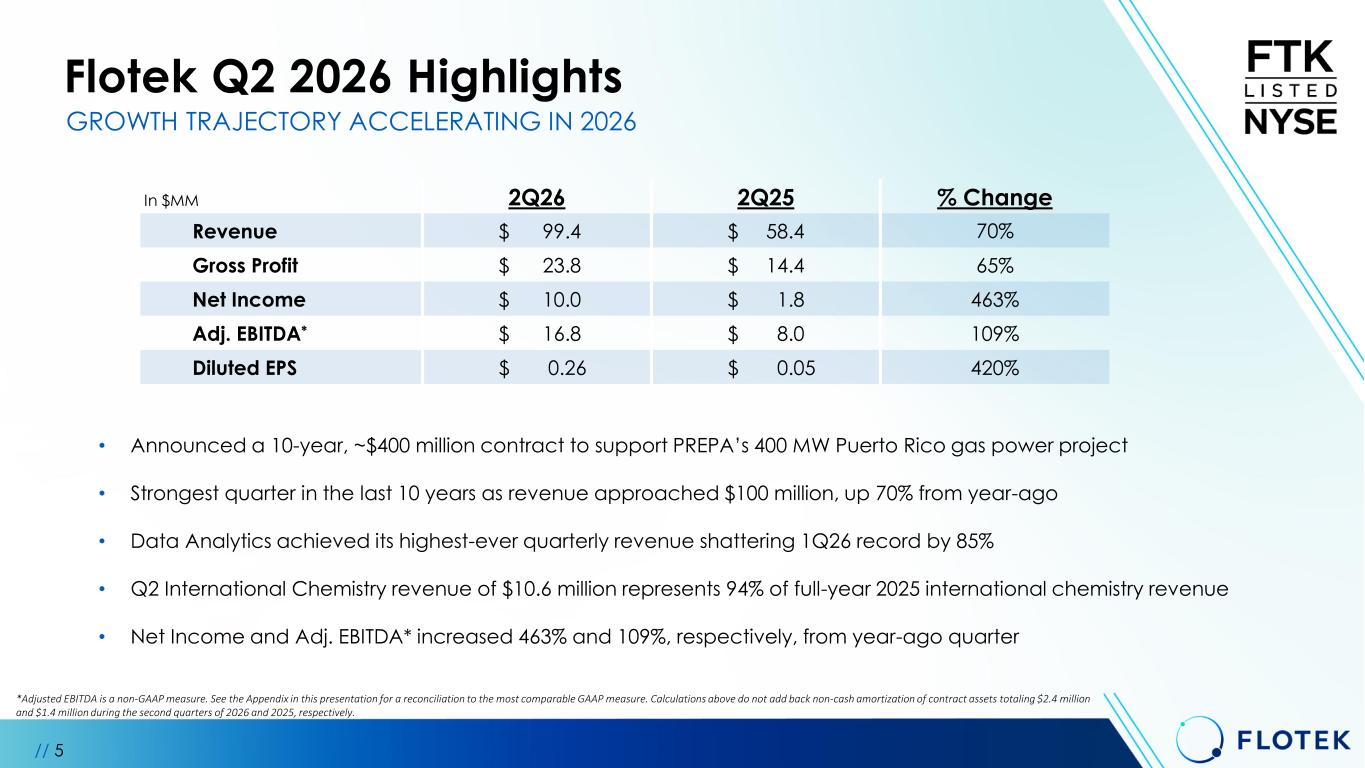
2Q26 2Q25 % Change Revenue $ 99.4 $ 58.4 70% Gross Profit $ 23.8 $ 14.4 65% Net Income $ 10.0 $ 1.8 463% Adj. EBITDA* $ 16.8 $ 8.0 109% Diluted EPS $ 0.26 $ 0.05 420% • Announced a 10-year, ~$400 million contract to support PREPA’s 400 MW Puerto Rico gas power project • Strongest quarter in the last 10 years as revenue approached $100 million, up 70% from year-ago • Data Analytics achieved its highest-ever quarterly revenue shattering 1Q26 record by 85% • Q2 International Chemistry revenue of $10.6 million represents 94% of full-year 2025 international chemistry revenue • Net Income and Adj. EBITDA* increased 463% and 109%, respectively, from year-ago quarter Flotek Q2 2026 Highlights // 5 *Adjusted EBITDA is a non-GAAP measure. See the Appendix in this presentation for a reconciliation to the most comparable GAAP measure. Calculations above do not add back non-cash amortization of contract assets totaling $2.4 million and $1.4 million during the second quarters of 2026 and 2025, respectively. In $MM GROWTH TRAJECTORY ACCELERATING IN 2026
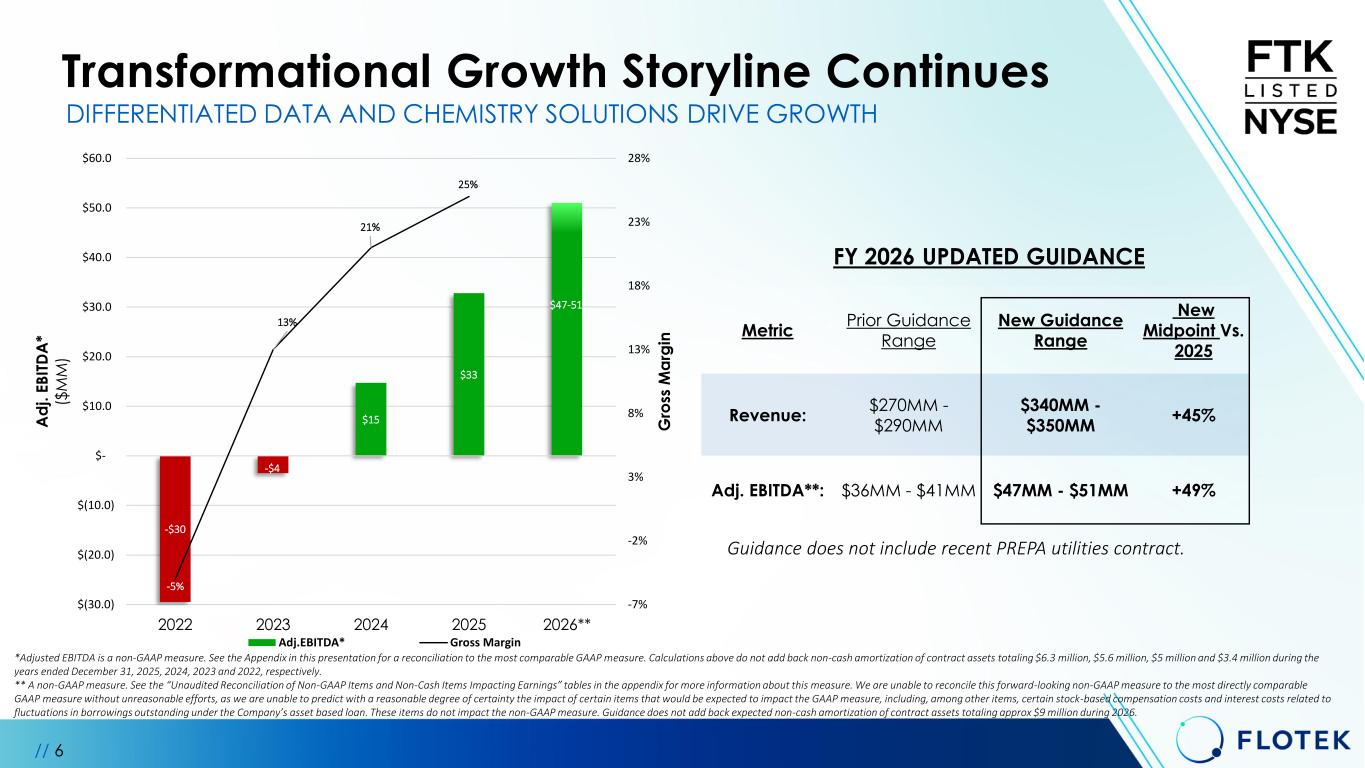
-$30 -$4 $15 $33 -5% 13% 21% 25% -7% -2% 3% 8% 13% 18% 23% 28% $(30.0) $(20.0) $(10.0) $- $10.0 $20.0 $30.0 $40.0 $50.0 $60.0 2022 2023 2024 2025 2026** G ro ss M a rg in A d j. E B IT D A * ($ M M ) Adj.EBITDA* Gross Margin // 6 Transformational Growth Storyline Continues DIFFERENTIATED DATA AND CHEMISTRY SOLUTIONS DRIVE GROWTH *Adjusted EBITDA is a non-GAAP measure. See the Appendix in this presentation for a reconciliation to the most comparable GAAP measure. Calculations above do not add back non-cash amortization of contract assets totaling $6.3 million, $5.6 million, $5 million and $3.4 million during the years ended December 31, 2025, 2024, 2023 and 2022, respectively. ** A non-GAAP measure. See the “Unaudited Reconciliation of Non-GAAP Items and Non-Cash Items Impacting Earnings” tables in the appendix for more information about this measure. We are unable to reconcile this forward-looking non-GAAP measure to the most directly comparable GAAP measure without unreasonable efforts, as we are unable to predict with a reasonable degree of certainty the impact of certain items that would be expected to impact the GAAP measure, including, among other items, certain stock-based compensation costs and interest costs related to fluctuations in borrowings outstanding under the Company’s asset based loan. These items do not impact the non-GAAP measure. Guidance does not add back expected non-cash amortization of contract assets totaling approx $9 million during 2026. $47-51 Metric Prior Guidance Range New Guidance Range New Midpoint Vs. 2025 Revenue: $270MM - $290MM $340MM - $350MM +45% Adj. EBITDA**: $36MM - $41MM $47MM - $51MM +49% FY 2026 UPDATED GUIDANCE Guidance does not include recent PREPA utilities contract.
Data Analytics (DA) // 7
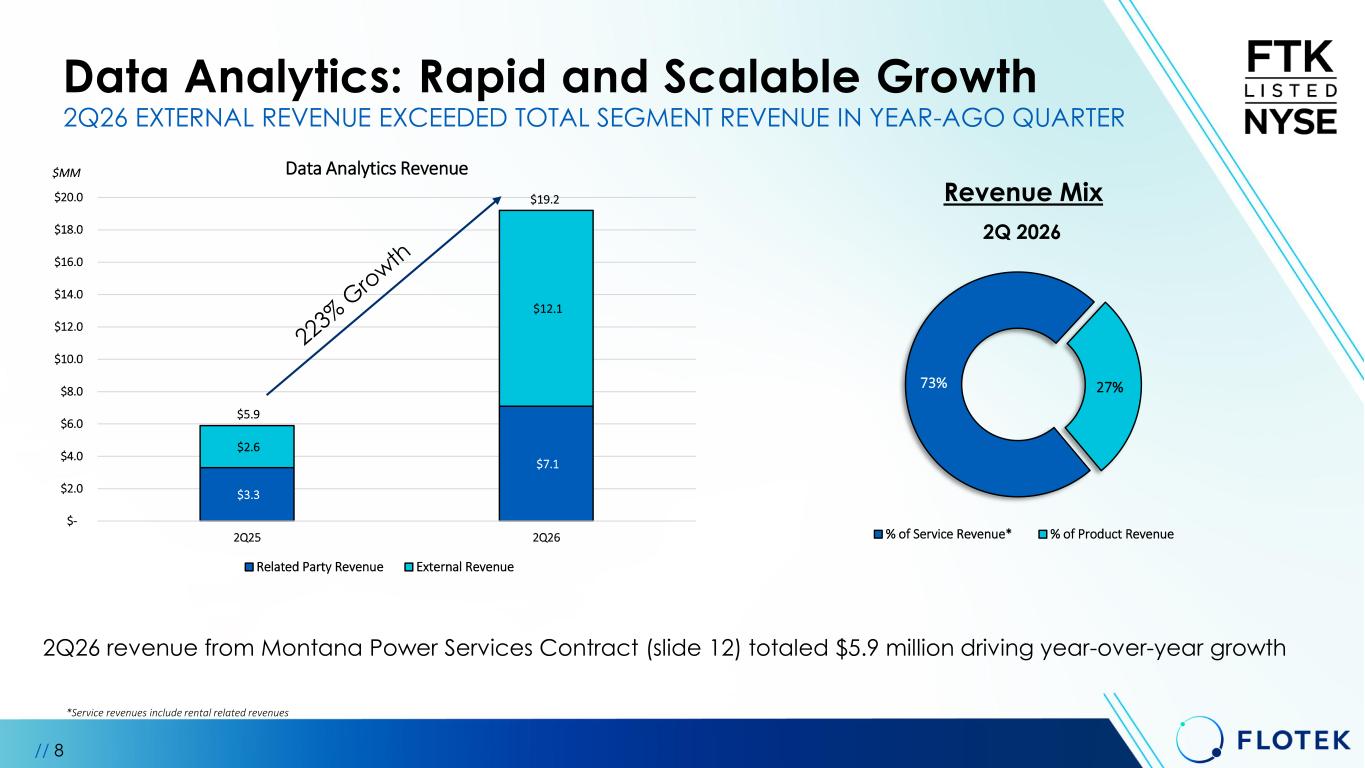
73% 27% 2Q 2026 % of Service Revenue* % of Product Revenue 2Q26 EXTERNAL REVENUE EXCEEDED TOTAL SEGMENT REVENUE IN YEAR-AGO QUARTER 2Q26 revenue from Montana Power Services Contract (slide 12) totaled $5.9 million driving year-over-year growth // 8 *Service revenues include rental related revenues Revenue Mix Data Analytics: Rapid and Scalable Growth $3.3 $7.1 $2.6 $12.1 $- $2.0 $4.0 $6.0 $8.0 $10.0 $12.0 $14.0 $16.0 $18.0 $20.0 2Q25 2Q26 Data Analytics Revenue Related Party Revenue External Revenue $19.2 $5.9 $MM
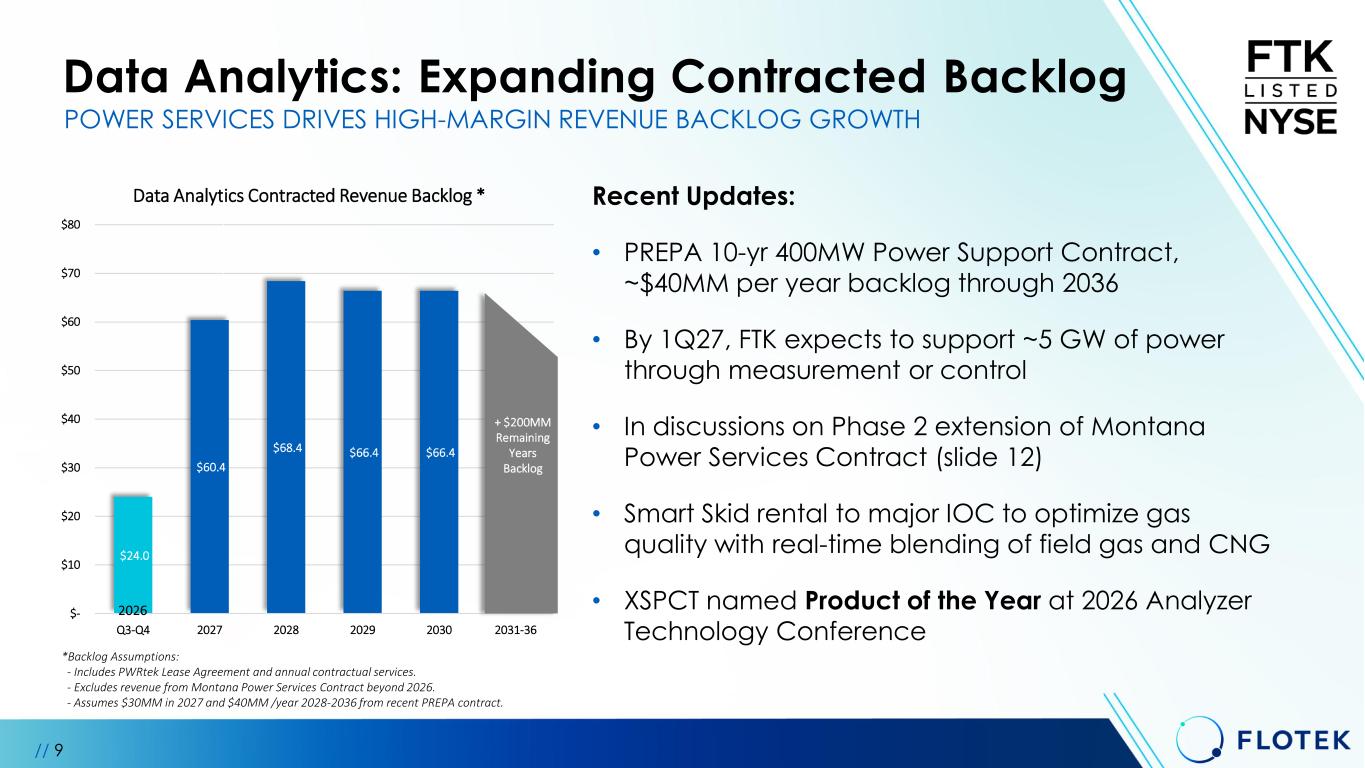
$24.0 $60.4 $68.4 $66.4 $66.4 $- $10 $20 $30 $40 $50 $60 $70 $80 Q3-Q4 2027 2028 2029 2030 2031-36 Data Analytics Contracted Revenue Backlog * Data Analytics: Expanding Contracted Backlog // 9 Recent Updates: • PREPA 10-yr 400MW Power Support Contract, ~$40MM per year backlog through 2036 • By 1Q27, FTK expects to support ~5 GW of power through measurement or control • In discussions on Phase 2 extension of Montana Power Services Contract (slide 12) • Smart Skid rental to major IOC to optimize gas quality with real-time blending of field gas and CNG • XSPCT named Product of the Year at 2026 Analyzer Technology Conference POWER SERVICES DRIVES HIGH-MARGIN REVENUE BACKLOG GROWTH *Backlog Assumptions: - Includes PWRtek Lease Agreement and annual contractual services. - Excludes revenue from Montana Power Services Contract beyond 2026. - Assumes $30MM in 2027 and $40MM /year 2028-2036 from recent PREPA contract. 2026 + $200MM Remaining Years Backlog
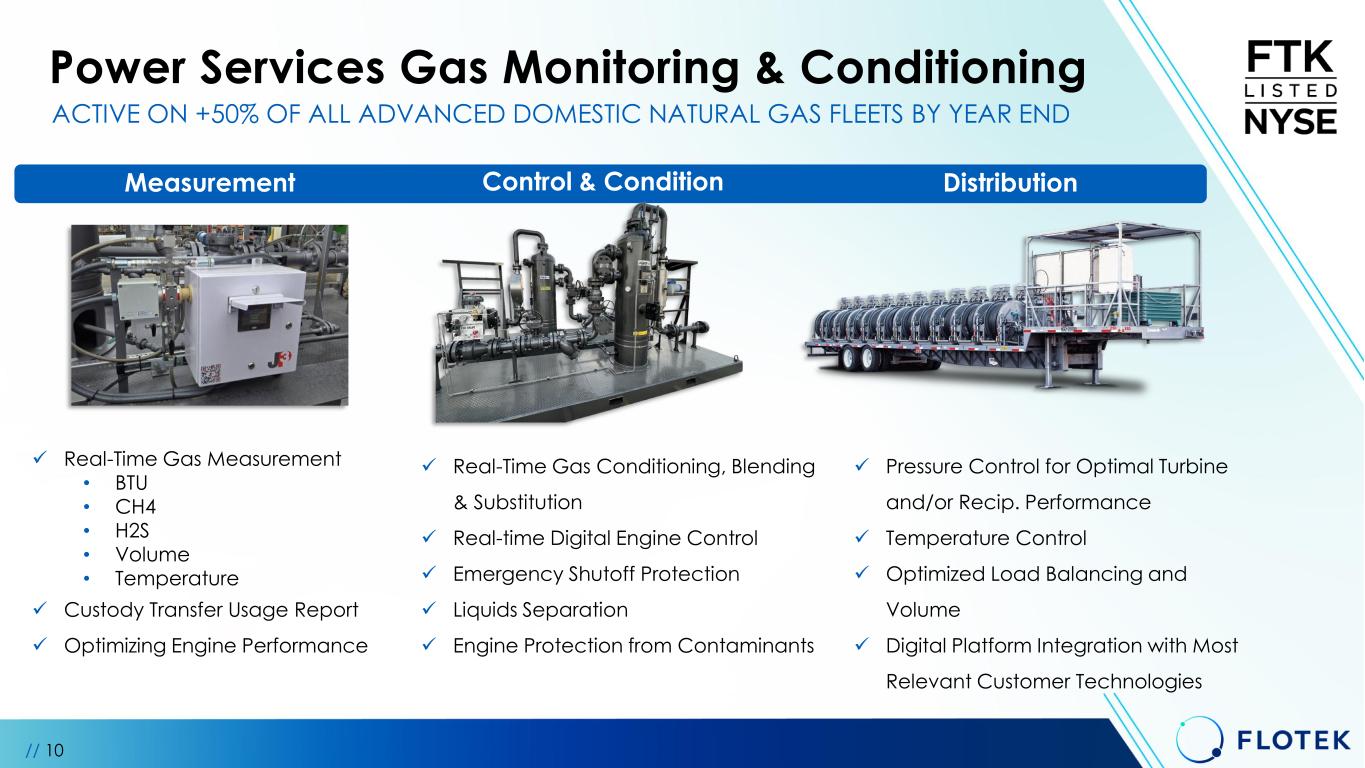
Power Services Gas Monitoring & Conditioning Measurement Control & Condition Distribution ✓ Real-Time Gas Measurement • BTU • CH4 • H2S • Volume • Temperature ✓ Custody Transfer Usage Report ✓ Optimizing Engine Performance ✓ Real-Time Gas Conditioning, Blending & Substitution ✓ Real-time Digital Engine Control ✓ Emergency Shutoff Protection ✓ Liquids Separation ✓ Engine Protection from Contaminants ✓ Pressure Control for Optimal Turbine and/or Recip. Performance ✓ Temperature Control ✓ Optimized Load Balancing and Volume ✓ Digital Platform Integration with Most Relevant Customer Technologies ACTIVE ON +50% OF ALL ADVANCED DOMESTIC NATURAL GAS FLEETS BY YEAR END // 10
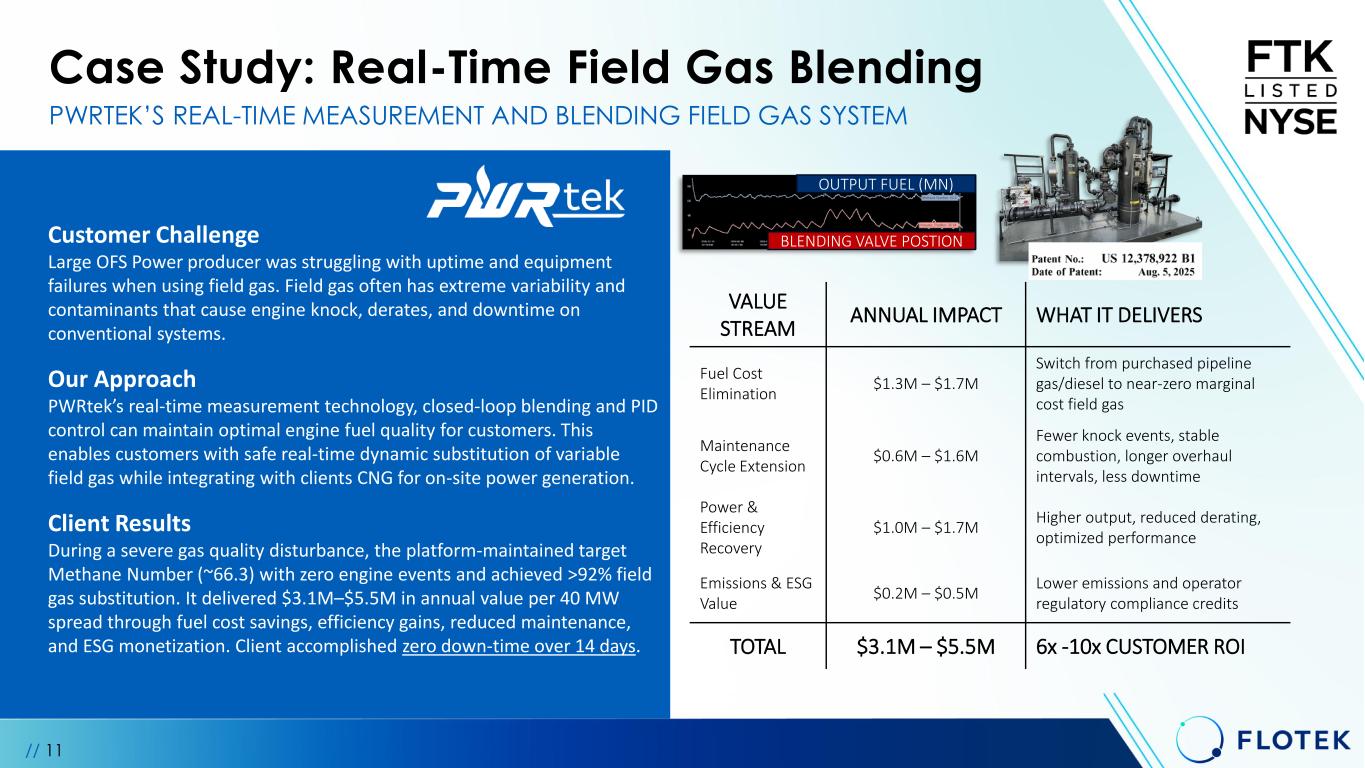
Case Study: Real-Time Field Gas Blending PWRTEK’S REAL-TIME MEASUREMENT AND BLENDING FIELD GAS SYSTEM VALUE STREAM ANNUAL IMPACT WHAT IT DELIVERS Fuel Cost Elimination $1.3M – $1.7M Switch from purchased pipeline gas/diesel to near-zero marginal cost field gas Maintenance Cycle Extension $0.6M – $1.6M Fewer knock events, stable combustion, longer overhaul intervals, less downtime Power & Efficiency Recovery $1.0M – $1.7M Higher output, reduced derating, optimized performance Emissions & ESG Value $0.2M – $0.5M Lower emissions and operator regulatory compliance credits TOTAL $3.1M – $5.5M 6x -10x CUSTOMER ROI Customer Challenge Large OFS Power producer was struggling with uptime and equipment failures when using field gas. Field gas often has extreme variability and contaminants that cause engine knock, derates, and downtime on conventional systems. Our Approach PWRtek’s real-time measurement technology, closed-loop blending and PID control can maintain optimal engine fuel quality for customers. This enables customers with safe real-time dynamic substitution of variable field gas while integrating with clients CNG for on-site power generation. Client Results During a severe gas quality disturbance, the platform-maintained target Methane Number (~66.3) with zero engine events and achieved >92% field gas substitution. It delivered $3.1M–$5.5M in annual value per 40 MW spread through fuel cost savings, efficiency gains, reduced maintenance, and ESG monetization. Client accomplished zero down-time over 14 days. // 11 OUTPUT FUEL (MN) BLENDING VALVE POSTION
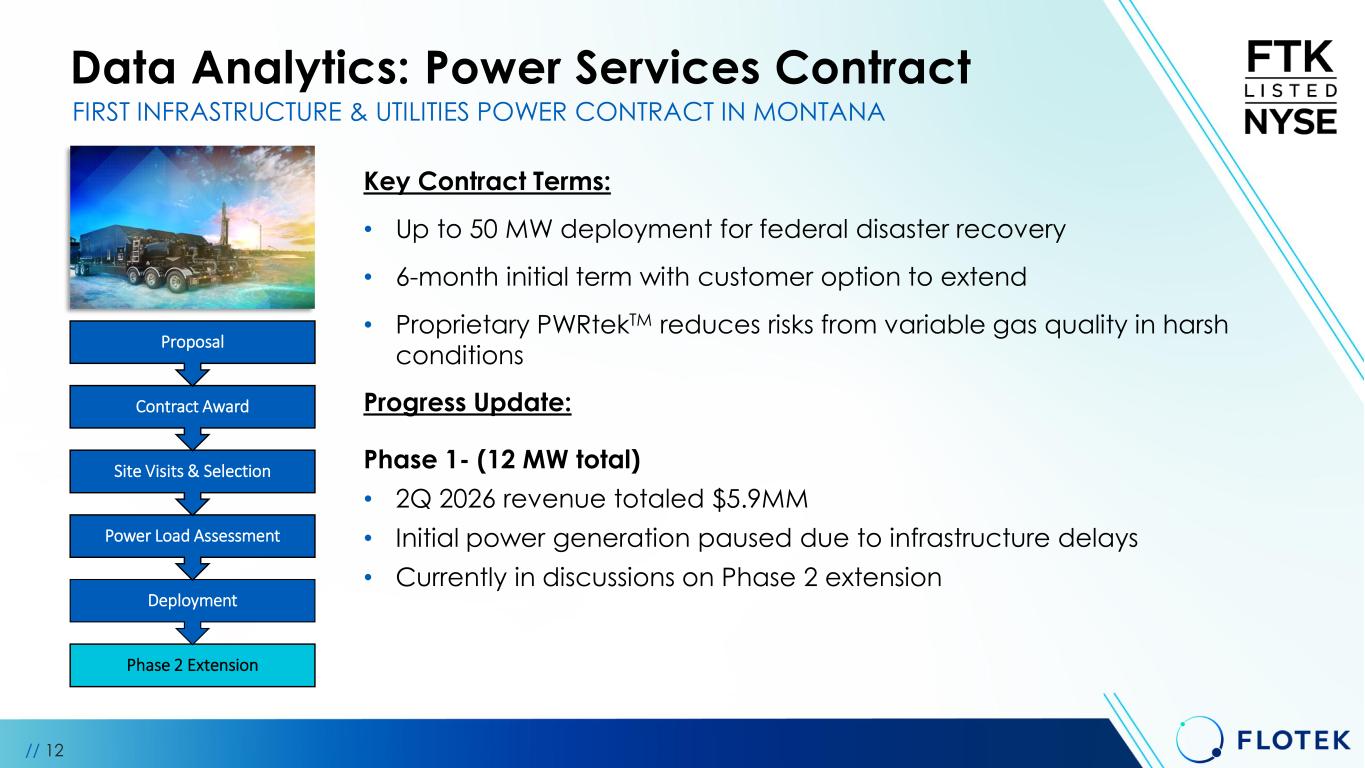
Data Analytics: Power Services Contract // 12 FIRST INFRASTRUCTURE & UTILITIES POWER CONTRACT IN MONTANA Key Contract Terms: • Up to 50 MW deployment for federal disaster recovery • 6-month initial term with customer option to extend • Proprietary PWRtekTM reduces risks from variable gas quality in harsh conditions Progress Update: Phase 1- (12 MW total) • 2Q 2026 revenue totaled $5.9MM • Initial power generation paused due to infrastructure delays • Currently in discussions on Phase 2 extension Phase 2 Extension Deployment Power Load Assessment Site Visits & Selection Contract Award Proposal
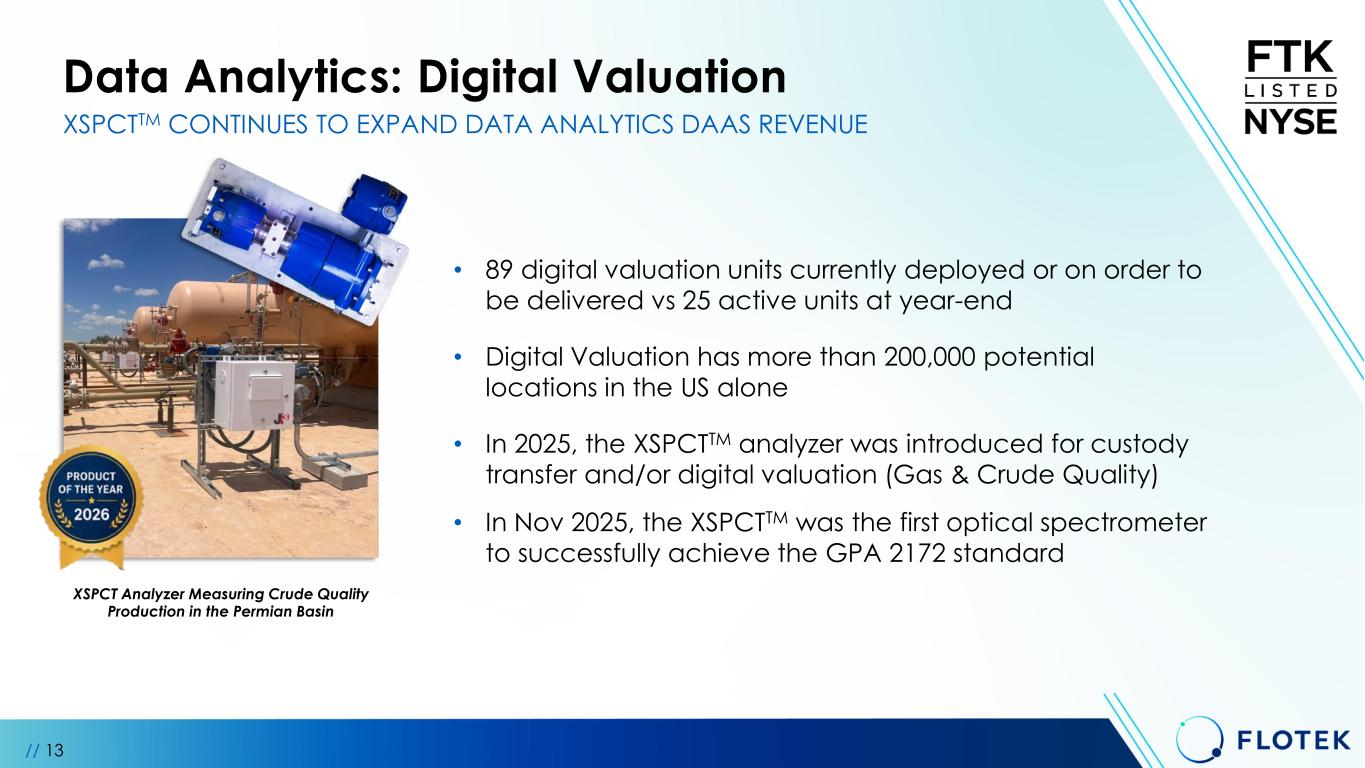
Data Analytics: Digital Valuation // 13 • 89 digital valuation units currently deployed or on order to be delivered vs 25 active units at year-end • Digital Valuation has more than 200,000 potential locations in the US alone • In 2025, the XSPCTTM analyzer was introduced for custody transfer and/or digital valuation (Gas & Crude Quality) • In Nov 2025, the XSPCTTM was the first optical spectrometer to successfully achieve the GPA 2172 standard XSPCTTM CONTINUES TO EXPAND DATA ANALYTICS DAAS REVENUE XSPCT Analyzer Measuring Crude Quality Production in the Permian Basin
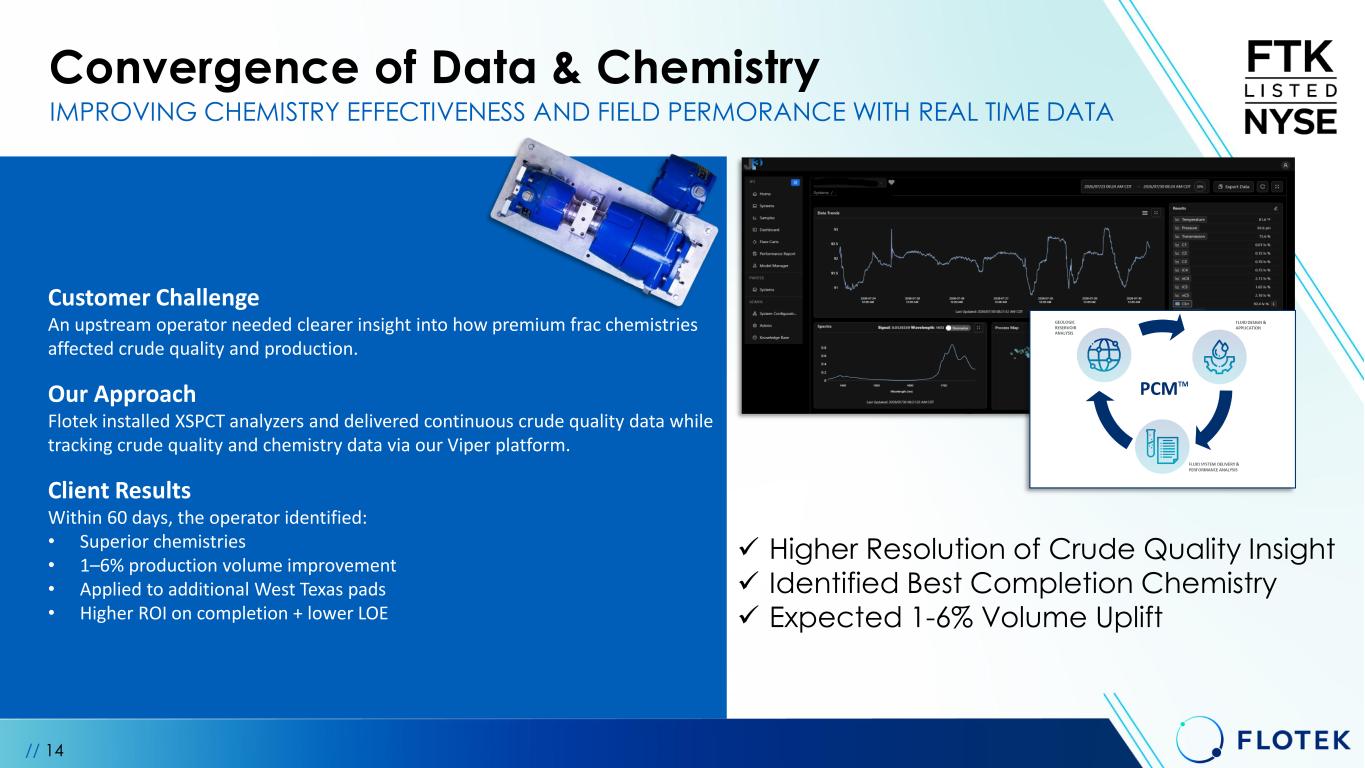
Customer Challenge An upstream operator needed clearer insight into how premium frac chemistries affected crude quality and production. Our Approach Flotek installed XSPCT analyzers and delivered continuous crude quality data while tracking crude quality and chemistry data via our Viper platform. Client Results Within 60 days, the operator identified: • Superior chemistries • 1–6% production volume improvement • Applied to additional West Texas pads • Higher ROI on completion + lower LOE Convergence of Data & Chemistry IMPROVING CHEMISTRY EFFECTIVENESS AND FIELD PERMORANCE WITH REAL TIME DATA // 14 ✓ Higher Resolution of Crude Quality Insight ✓ Identified Best Completion Chemistry ✓ Expected 1-6% Volume Uplift

Chemistry Technologies (ECT) // 15
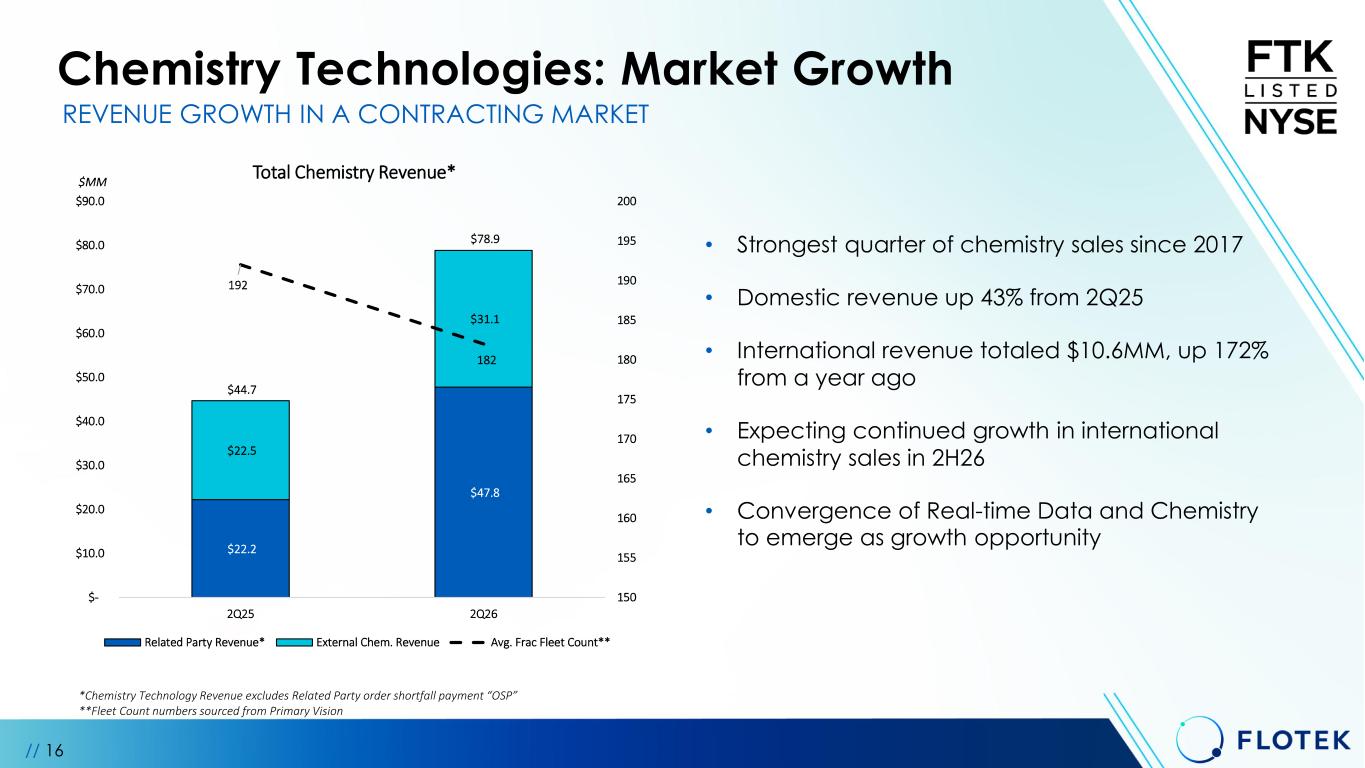
Chemistry Technologies: Market Growth // 16 • Strongest quarter of chemistry sales since 2017 • Domestic revenue up 43% from 2Q25 • International revenue totaled $10.6MM, up 172% from a year ago • Expecting continued growth in international chemistry sales in 2H26 • Convergence of Real-time Data and Chemistry to emerge as growth opportunity REVENUE GROWTH IN A CONTRACTING MARKET *Chemistry Technology Revenue excludes Related Party order shortfall payment “OSP” **Fleet Count numbers sourced from Primary Vision $22.2 $47.8 $22.5 $31.1 192 182 150 155 160 165 170 175 180 185 190 195 200 $- $10.0 $20.0 $30.0 $40.0 $50.0 $60.0 $70.0 $80.0 $90.0 2Q25 2Q26 Total Chemistry Revenue* Related Party Revenue* External Chem. Revenue Avg. Frac Fleet Count** $MM $78.9 $44.7
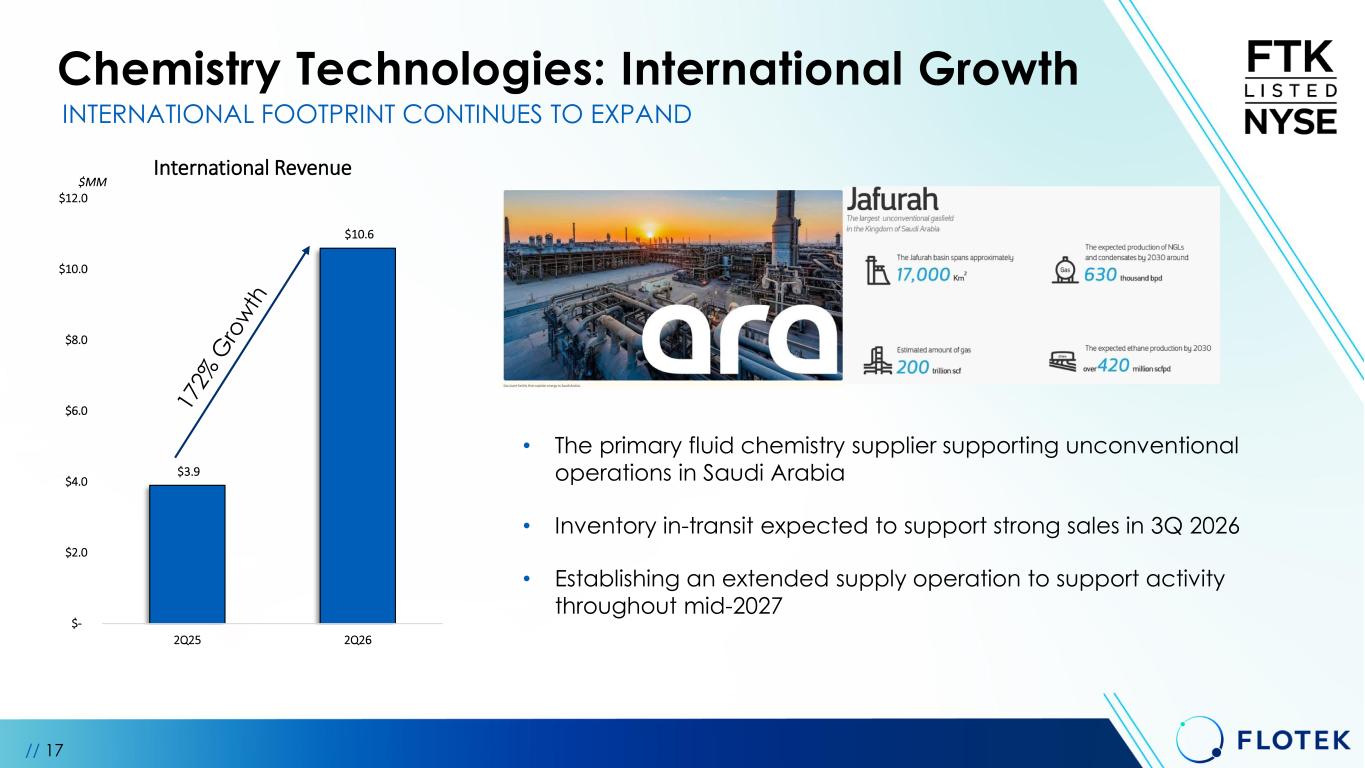
Chemistry Technologies: International Growth // 17 • The primary fluid chemistry supplier supporting unconventional operations in Saudi Arabia • Inventory in-transit expected to support strong sales in 3Q 2026 • Establishing an extended supply operation to support activity throughout mid-2027 INTERNATIONAL FOOTPRINT CONTINUES TO EXPAND $3.9 $10.6 $- $2.0 $4.0 $6.0 $8.0 $10.0 $12.0 2Q25 2Q26 International Revenue $MM
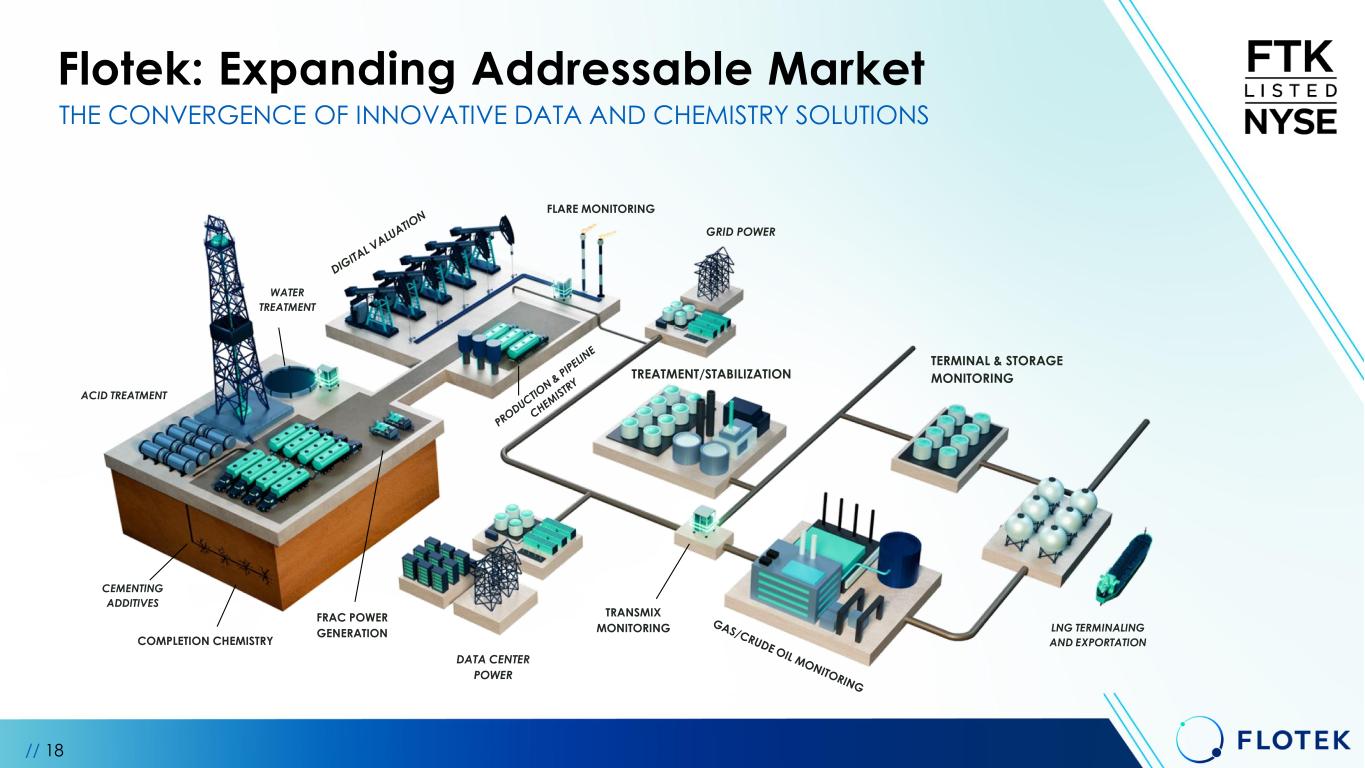
COMPLETION CHEMISTRY FRAC POWER GENERATION TRANSMIX MONITORING TREATMENT/STABILIZATION FLARE MONITORING DATA CENTER POWER GRID POWER TERMINAL & STORAGE MONITORING LNG TERMINALING AND EXPORTATION WATER TREATMENT ACID TREATMENT CEMENTING ADDITIVES // 18 THE CONVERGENCE OF INNOVATIVE DATA AND CHEMISTRY SOLUTIONS Flotek: Expanding Addressable Market
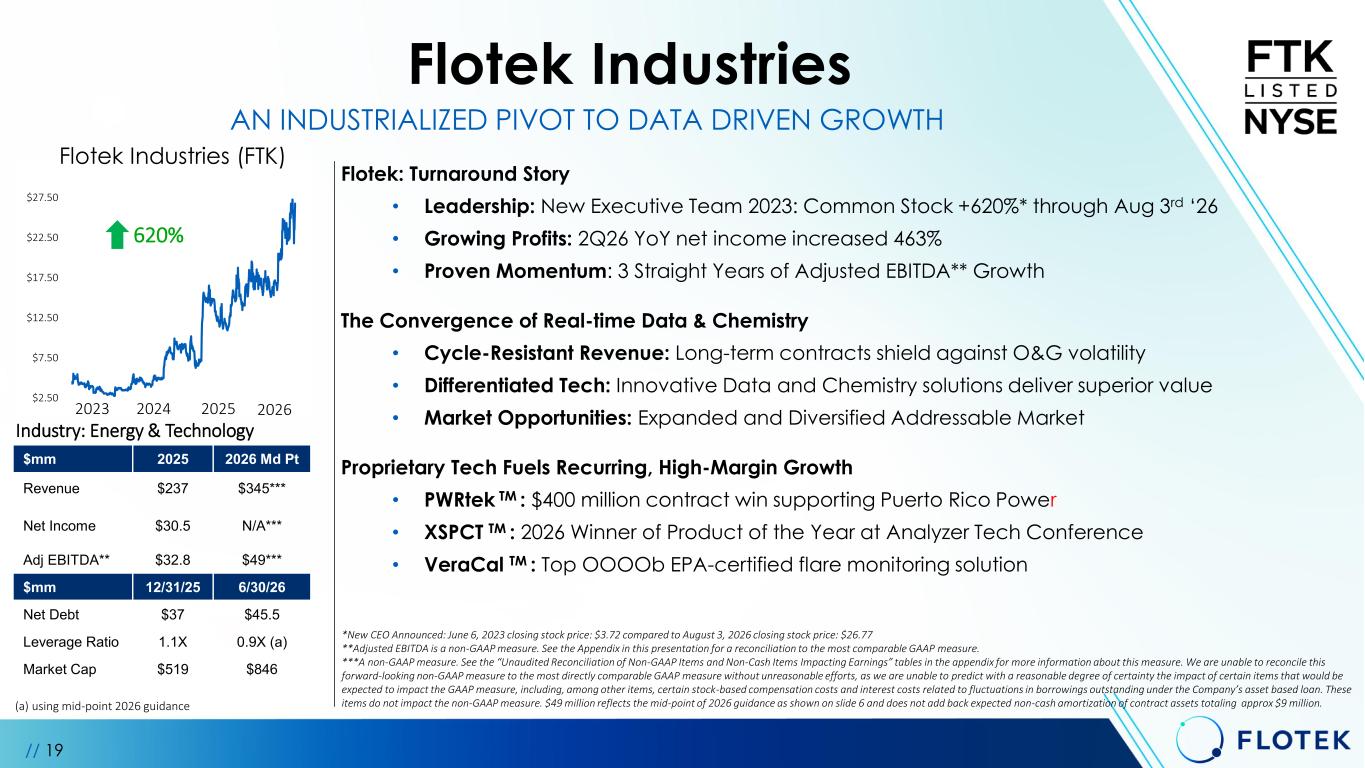
$2.50 $7.50 $12.50 $17.50 $22.50 $27.50 // 19 Flotek Industries AN INDUSTRIALIZED PIVOT TO DATA DRIVEN GROWTH Flotek: Turnaround Story • Leadership: New Executive Team 2023: Common Stock +620%* through Aug 3rd ‘26 • Growing Profits: 2Q26 YoY net income increased 463% • Proven Momentum: 3 Straight Years of Adjusted EBITDA** Growth The Convergence of Real-time Data & Chemistry • Cycle-Resistant Revenue: Long-term contracts shield against O&G volatility • Differentiated Tech: Innovative Data and Chemistry solutions deliver superior value • Market Opportunities: Expanded and Diversified Addressable Market Proprietary Tech Fuels Recurring, High-Margin Growth • PWRtek TM : $400 million contract win supporting Puerto Rico Power • XSPCT TM : 2026 Winner of Product of the Year at Analyzer Tech Conference • VeraCal TM : Top OOOOb EPA-certified flare monitoring solution *New CEO Announced: June 6, 2023 closing stock price: $3.72 compared to August 3, 2026 closing stock price: $26.77 **Adjusted EBITDA is a non-GAAP measure. See the Appendix in this presentation for a reconciliation to the most comparable GAAP measure. ***A non-GAAP measure. See the “Unaudited Reconciliation of Non-GAAP Items and Non-Cash Items Impacting Earnings” tables in the appendix for more information about this measure. We are unable to reconcile this forward-looking non-GAAP measure to the most directly comparable GAAP measure without unreasonable efforts, as we are unable to predict with a reasonable degree of certainty the impact of certain items that would be expected to impact the GAAP measure, including, among other items, certain stock-based compensation costs and interest costs related to fluctuations in borrowings outstanding under the Company’s asset based loan. These items do not impact the non-GAAP measure. $49 million reflects the mid-point of 2026 guidance as shown on slide 6 and does not add back expected non-cash amortization of contract assets totaling approx $9 million. 2023 2024 2025 620% 2026 $mm 2025 2026 Md Pt Revenue $237 $345*** Net Income Adj EBITDA** $30.5 $32.8 N/A*** $49*** $mm 12/31/25 6/30/26 Net Debt $37 $45.5 Leverage Ratio 1.1X 0.9X (a) Market Cap $519 $846 (a) using mid-point 2026 guidance Flotek Industries (FTK) Industry: Energy & Technology
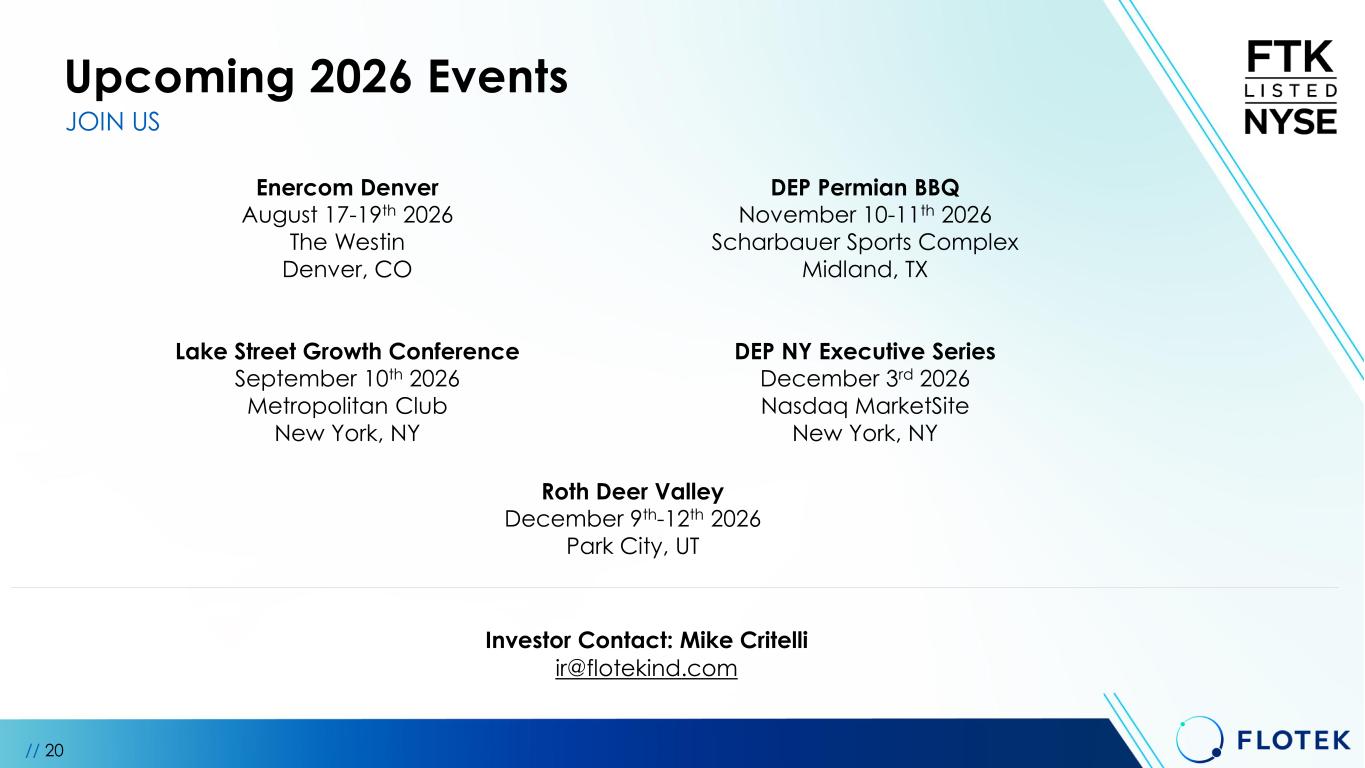
// 20 Enercom Denver August 17-19th 2026 The Westin Denver, CO Lake Street Growth Conference September 10th 2026 Metropolitan Club New York, NY DEP Permian BBQ November 10-11th 2026 Scharbauer Sports Complex Midland, TX DEP NY Executive Series December 3rd 2026 Nasdaq MarketSite New York, NY Investor Contact: Mike Critelli ir@flotekind.com Upcoming 2026 Events JOIN US Roth Deer Valley December 9th-12th 2026 Park City, UT

Appendix
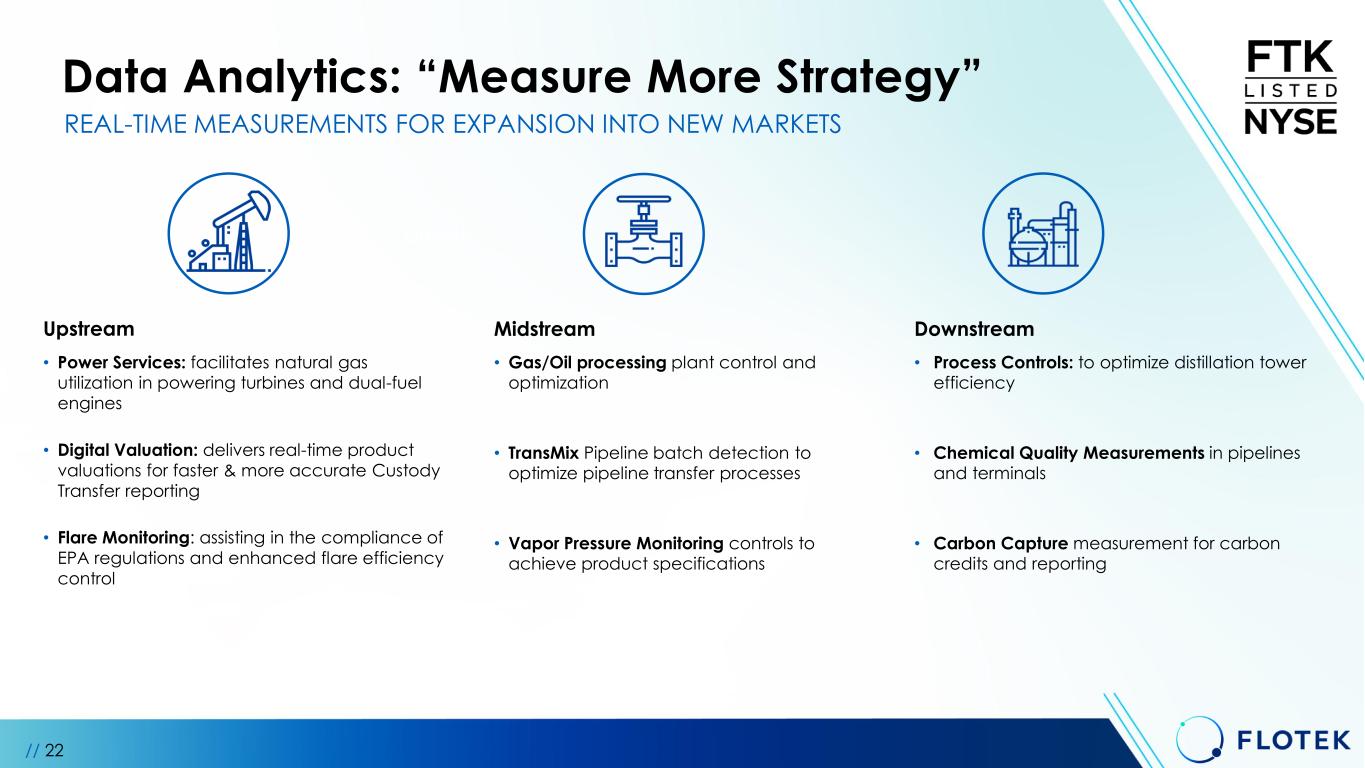
Data Analytics: “Measure More Strategy” Upstream • Power Services: facilitates natural gas utilization in powering turbines and dual-fuel engines • Digital Valuation: delivers real-time product valuations for faster & more accurate Custody Transfer reporting • Flare Monitoring: assisting in the compliance of EPA regulations and enhanced flare efficiency control Midstream • Gas/Oil processing plant control and optimization • TransMix Pipeline batch detection to optimize pipeline transfer processes • Vapor Pressure Monitoring controls to achieve product specifications Downstream • Process Controls: to optimize distillation tower efficiency • Chemical Quality Measurements in pipelines and terminals • Carbon Capture measurement for carbon credits and reporting REAL-TIME MEASUREMENTS FOR EXPANSION INTO NEW MARKETS // 22 Growth
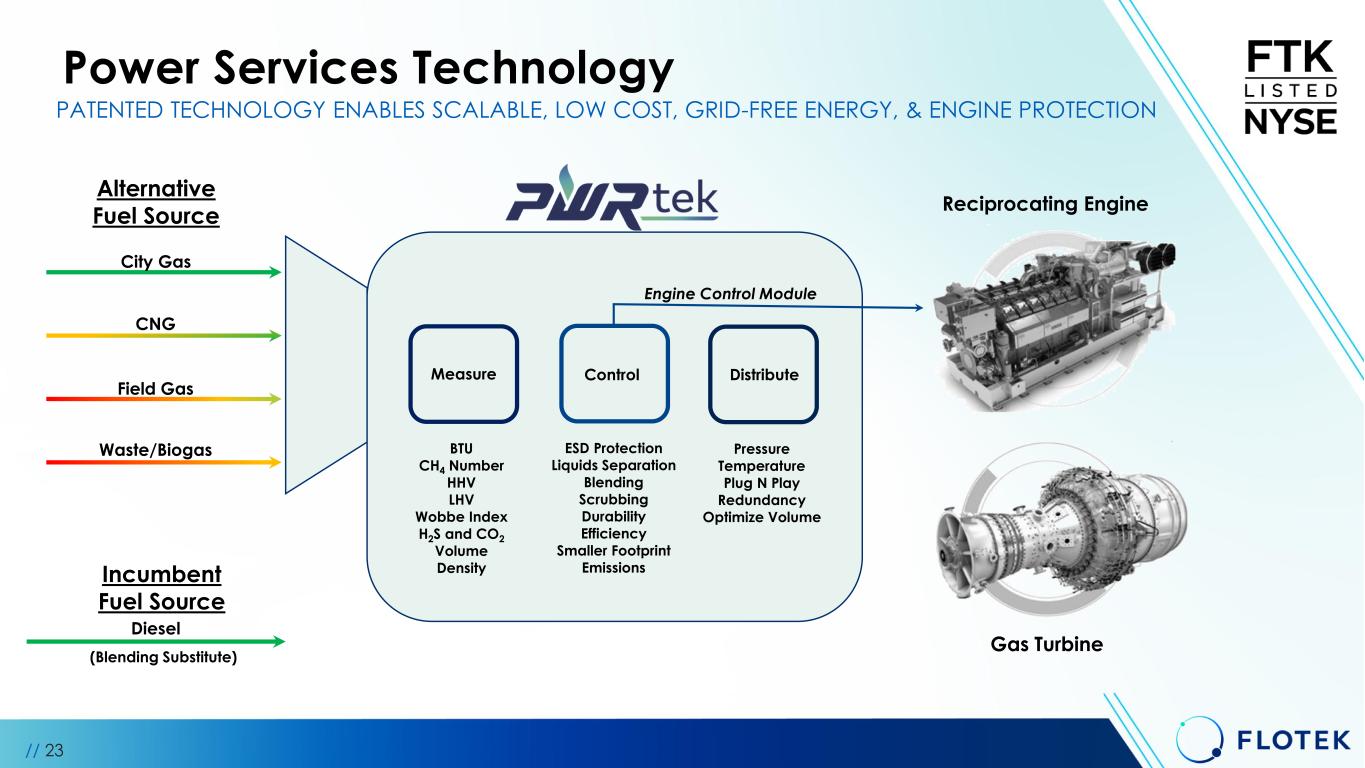
Power Services Technology // 23 PATENTED TECHNOLOGY ENABLES SCALABLE, LOW COST, GRID-FREE ENERGY, & ENGINE PROTECTION City Gas CNG Field Gas Waste/Biogas Measure Control Distribute Reciprocating Engine Gas Turbine Engine Control Module BTU CH4 Number HHV LHV Wobbe Index H2S and CO2 Volume Density ESD Protection Liquids Separation Blending Scrubbing Durability Efficiency Smaller Footprint Emissions Pressure Temperature Plug N Play Redundancy Optimize Volume Diesel (Blending Substitute) Alternative Fuel Source Incumbent Fuel Source
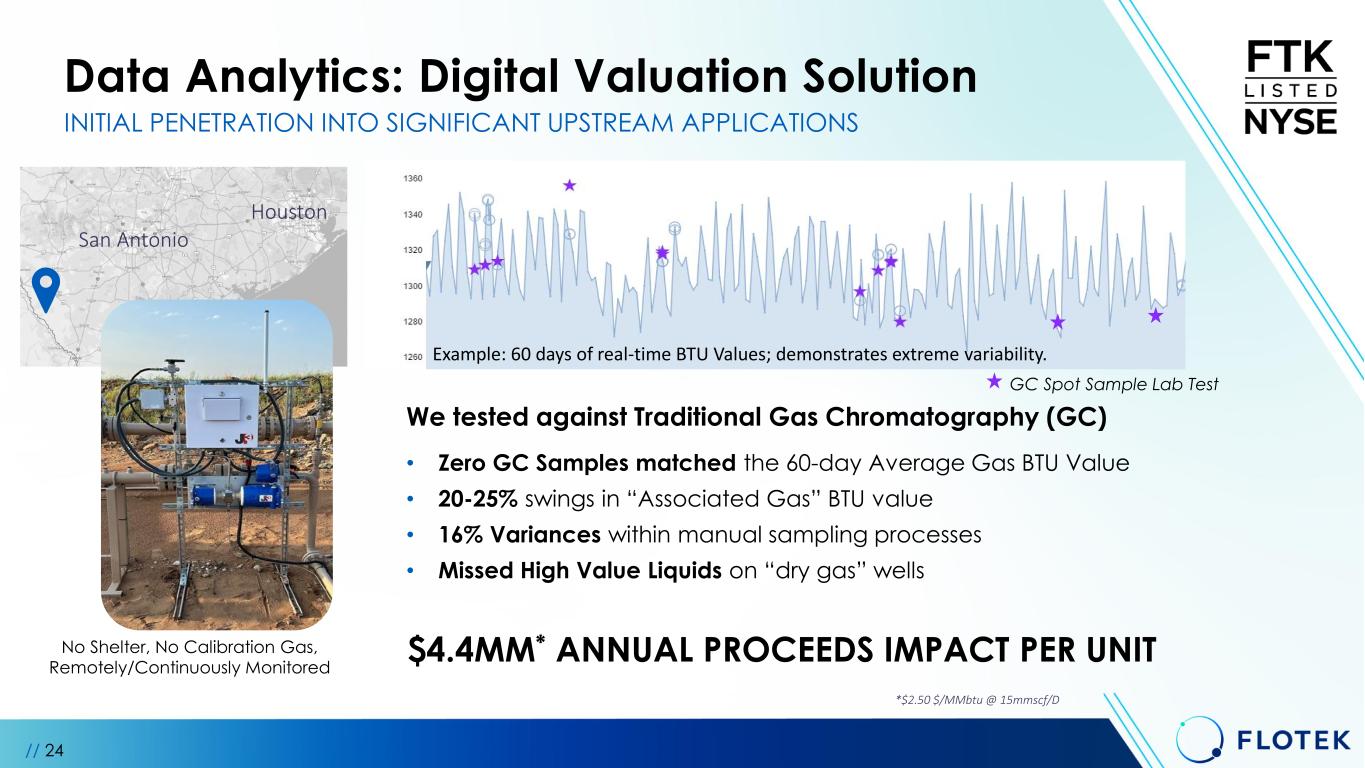
We tested against Traditional Gas Chromatography (GC) • Zero GC Samples matched the 60-day Average Gas BTU Value • 20-25% swings in “Associated Gas” BTU value • 16% Variances within manual sampling processes • Missed High Value Liquids on “dry gas” wells Data Analytics: Digital Valuation Solution // 24 INITIAL PENETRATION INTO SIGNIFICANT UPSTREAM APPLICATIONS No Shelter, No Calibration Gas, Remotely/Continuously Monitored San Antonio Houston Example: 60 days of real-time BTU Values; demonstrates extreme variability. GC Spot Sample Lab Test $4.4MM* ANNUAL PROCEEDS IMPACT PER UNIT *$2.50 $/MMbtu @ 15mmscf/D
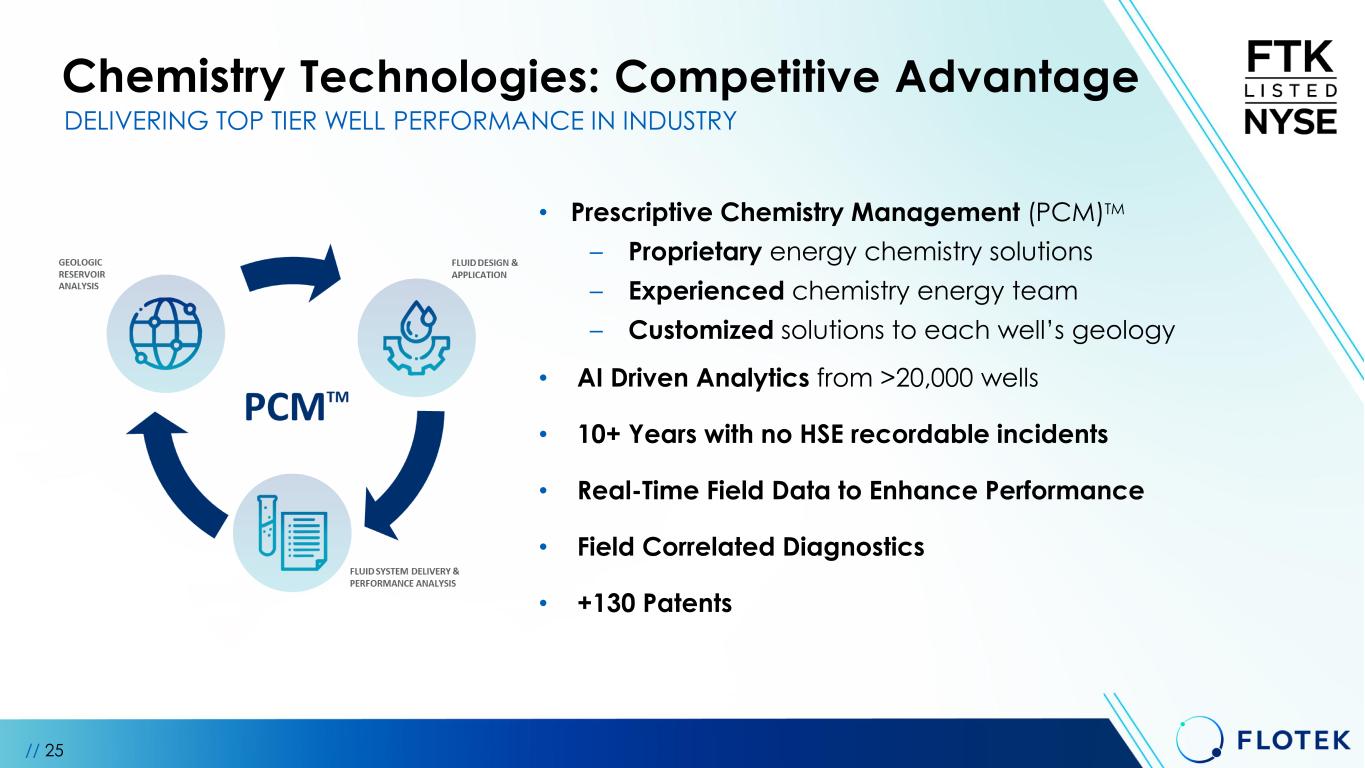
// 25 • Prescriptive Chemistry Management (PCM)TM – Proprietary energy chemistry solutions – Experienced chemistry energy team – Customized solutions to each well’s geology • AI Driven Analytics from >20,000 wells • 10+ Years with no HSE recordable incidents • Real-Time Field Data to Enhance Performance • Field Correlated Diagnostics • +130 Patents DELIVERING TOP TIER WELL PERFORMANCE IN INDUSTRY Chemistry Technologies: Competitive Advantage
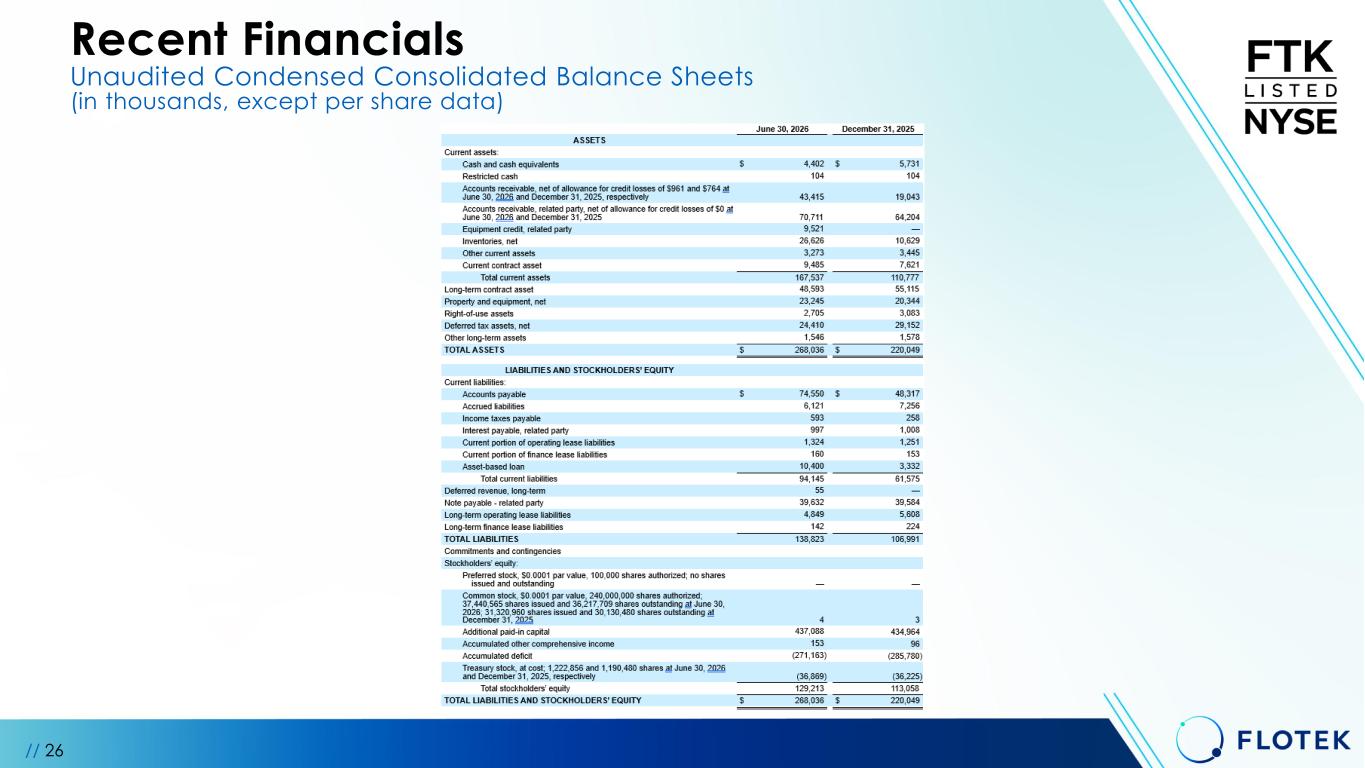
// 26 Recent Financials Unaudited Condensed Consolidated Balance Sheets (in thousands, except per share data)
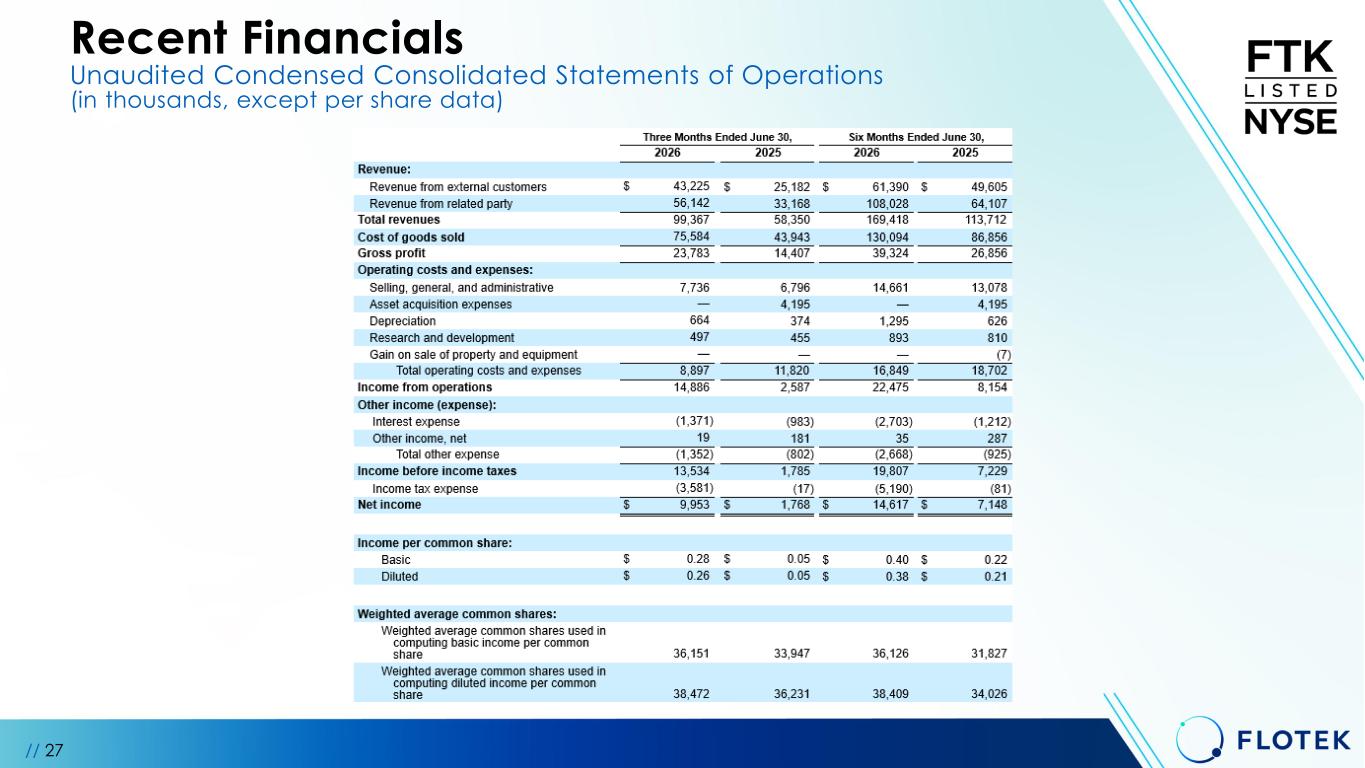
Recent Financials Unaudited Condensed Consolidated Statements of Operations (in thousands, except per share data) // 27
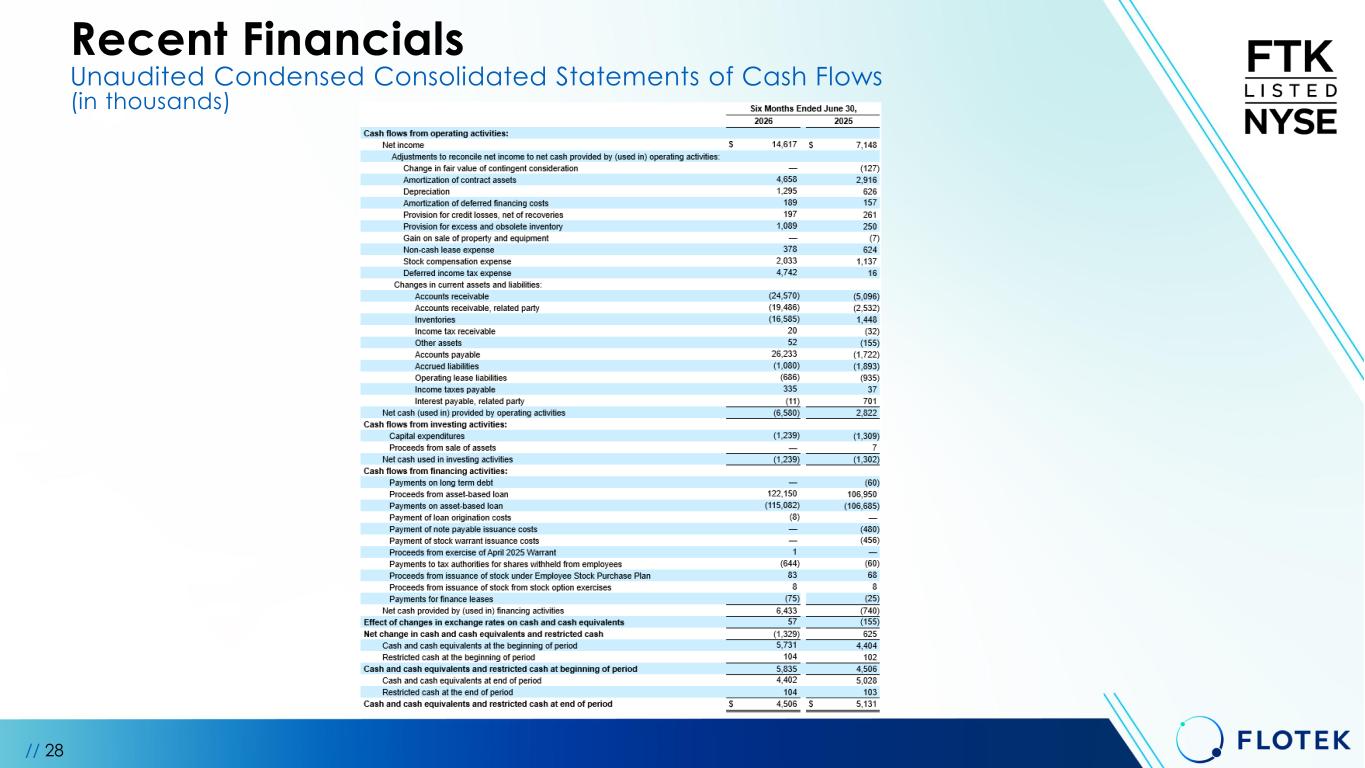
// 28 Recent Financials Unaudited Condensed Consolidated Statements of Cash Flows (in thousands)
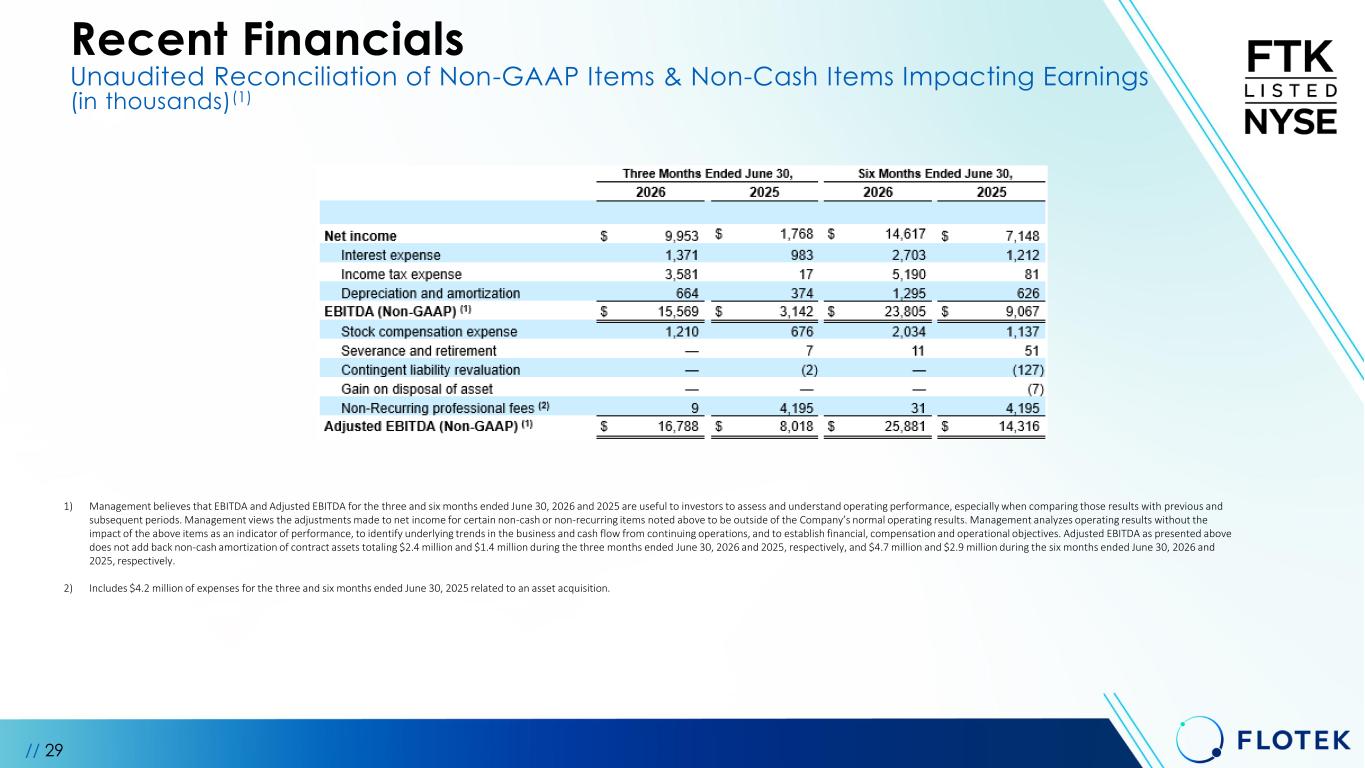
// 29 1) Management believes that EBITDA and Adjusted EBITDA for the three and six months ended June 30, 2026 and 2025 are useful to investors to assess and understand operating performance, especially when comparing those results with previous and subsequent periods. Management views the adjustments made to net income for certain non-cash or non-recurring items noted above to be outside of the Company’s normal operating results. Management analyzes operating results without the impact of the above items as an indicator of performance, to identify underlying trends in the business and cash flow from continuing operations, and to establish financial, compensation and operational objectives. Adjusted EBITDA as presented above does not add back non-cash amortization of contract assets totaling $2.4 million and $1.4 million during the three months ended June 30, 2026 and 2025, respectively, and $4.7 million and $2.9 million during the six months ended June 30, 2026 and 2025, respectively. 2) Includes $4.2 million of expenses for the three and six months ended June 30, 2025 related to an asset acquisition. Recent Financials Unaudited Reconciliation of Non-GAAP Items & Non-Cash Items Impacting Earnings (in thousands)(1)
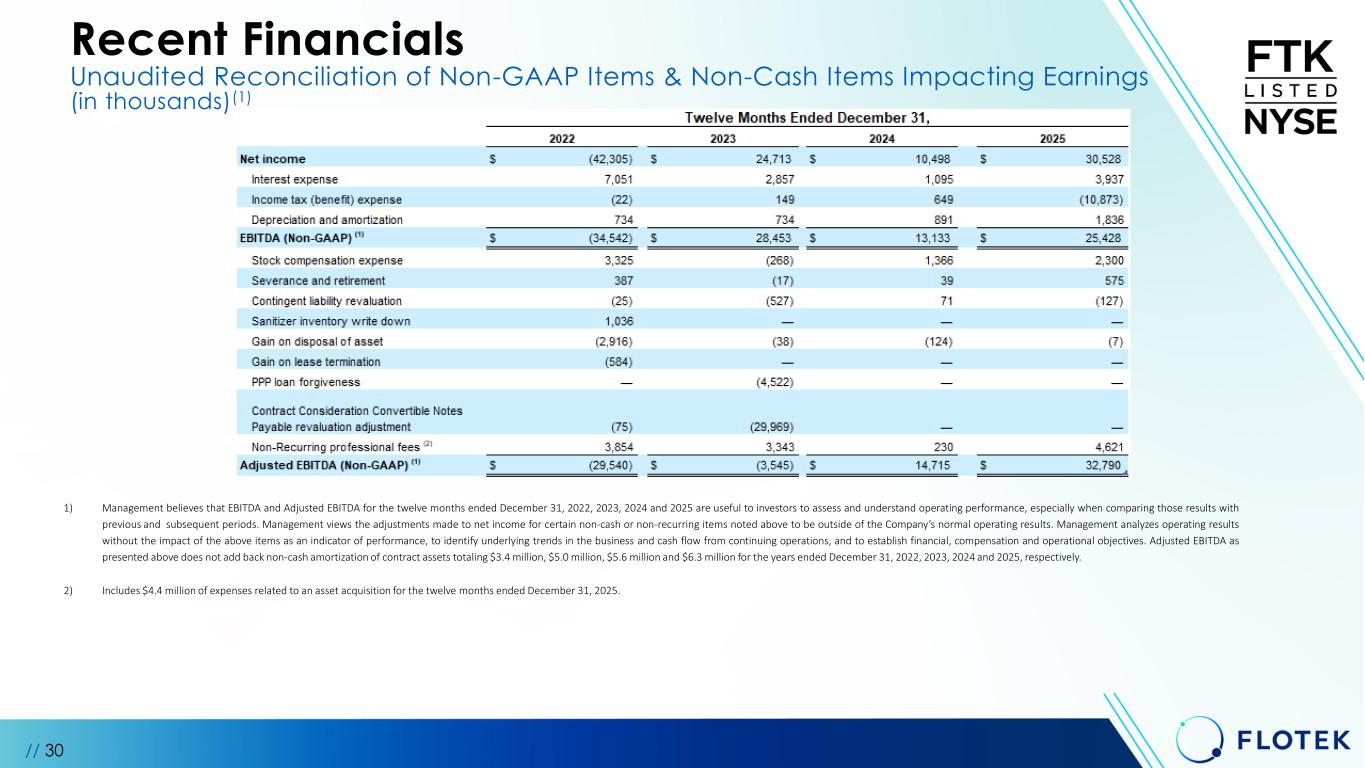
// 30 1) Management believes that EBITDA and Adjusted EBITDA for the twelve months ended December 31, 2022, 2023, 2024 and 2025 are useful to investors to assess and understand operating performance, especially when comparing those results with previous and subsequent periods. Management views the adjustments made to net income for certain non-cash or non-recurring items noted above to be outside of the Company’s normal operating results. Management analyzes operating results without the impact of the above items as an indicator of performance, to identify underlying trends in the business and cash flow from continuing operations, and to establish financial, compensation and operational objectives. Adjusted EBITDA as presented above does not add back non-cash amortization of contract assets totaling $3.4 million, $5.0 million, $5.6 million and $6.3 million for the years ended December 31, 2022, 2023, 2024 and 2025, respectively. 2) Includes $4.4 million of expenses related to an asset acquisition for the twelve months ended December 31, 2025. Recent Financials Unaudited Reconciliation of Non-GAAP Items & Non-Cash Items Impacting Earnings (in thousands)(1)