Exhibit 99.2


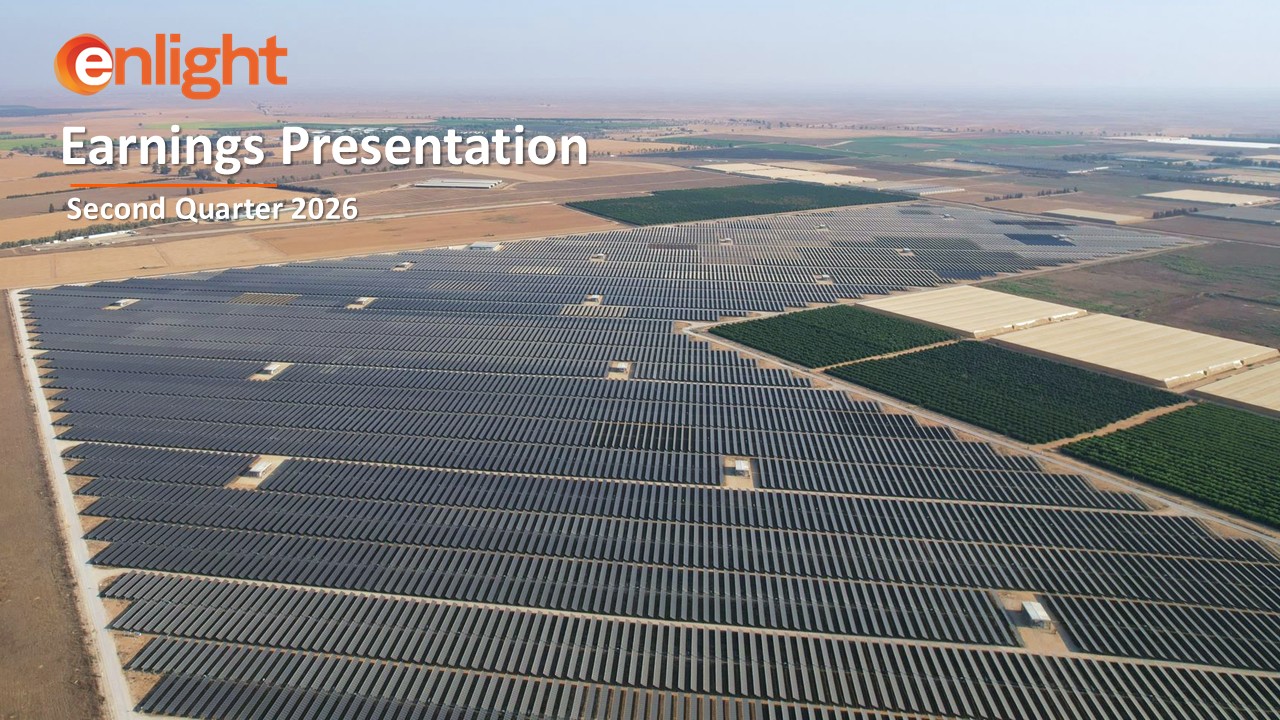
 Earnings Presentation   Second Quarter 2026 


 Legal disclaimer  This presentation contains forward-looking statements within the meaning of the U.S. Private Securities Litigation Reform Act of 1995. We intend such forward-looking statements to be covered by the safe harbor provisions for forward-looking statements as contained in Section 27A of the Securities Act of 1933, as amended, and Section 21E of the Securities Exchange Act of 1934, as amended. All statements contained in this presentation other than statements of historical fact, including, without limitation, statements regarding Enlight Renewable Energy's (the "Company") business strategy and plans, capabilities of the Company’s project portfolio and achievement of operational objectives, market opportunity and potential growth, discussions with commercial counterparties and financing sources, pricing trends, progress of Company projects, including anticipated timing of related approvals and project completion, the Company’s future financial results, expected impact from various regulatory developments, Revenue and Income, EBITDA, and Adjusted EBITDA guidance, the expected timing of completion of our ongoing projects, macroeconomic trends, and the Company’s anticipated cash requirements and financing plans, are forward-looking statements. The words “may,” “might,” “will,” “could,” “would,” “should,” “expect,” “plan,” “anticipate,” “intend,” “target,” “seek,” “believe,” “estimate,” “predict,” “potential,” “continue,” “contemplate,” “possible,” “forecasts,” “aims” or the negative of these terms and similar expressions are intended to identify forward-looking statements, though not all forward-looking statements use these words or expressions.   These statements are neither promises nor guarantees, but involve known and unknown risks, uncertainties and other important factors that may cause our actual results, performance or achievements to be materially different from any future results, performance or achievements expressed or implied by the forward-looking statements, including, but not limited to, the following: our ability to site suitable land for, and otherwise source, renewable energy projects and to successfully develop and convert them into Operational Projects` the timing of construction of any project; availability of, and access to, interconnection facilities and transmission systems; our ability to obtain and maintain governmental and other regulatory approvals and permits, including environmental approvals and permits; construction delays, operational delays and supply chain disruptions leading to increased cost of materials required for the construction of our projects, as well as cost overruns and delays related to disputes with contractors; disruptions in trade caused by political, social or economic instability in regions where our components and materials are made; our suppliers’ ability and willingness to perform both existing and future obligations; competition from traditional and renewable energy companies in developing renewable energy projects; potential slowed demand for renewable energy projects and our ability to enter into new offtake contracts on acceptable terms and prices as current offtake contracts expire; offtakers’ ability to terminate contracts or seek other remedies resulting from failure of our projects to meet development, operational or performance benchmarks; exposure to market prices in some of our offtake contracts; various technical and operational challenges leading to unplanned outages, reduced output, interconnection or termination issues; the dependence of our production and revenue on suitable meteorological and environmental conditions, and our ability to accurately predict such conditions; our ability to enforce warranties provided by our counterparties in the event that our projects do not perform as expected; government curtailment, energy price caps and other government actions that restrict or reduce the profitability of renewable energy production; electricity price volatility, unusual weather conditions (including the effects of climate change, could adversely affect wind and solar conditions), catastrophic weather-related or other damage to facilities, unscheduled generation outages, maintenance or repairs, unanticipated changes to availability due to higher demand, shortages, transportation problems or other developments, environmental incidents, or electric transmission system constraints and the possibility that we may not have adequate insurance to cover losses as a result of such hazards; our dependence on certain operational projects for a substantial portion of our cash flows; our ability to continue to grow our portfolio of projects through successful acquisitions; changes and advances in technology that impair or eliminate the competitive advantage of our projects or upsets the expectations underlying investments in our technologies; our ability to effectively anticipate and manage cost inflation, interest rate risk, currency exchange fluctuations and other macroeconomic conditions that impact our business; our ability to retain and attract key personnel; our ability to manage legal and regulatory compliance and litigation risk across our global corporate structure; our ability to protect our business from, and manage the impact of, cyber-attacks, disruptions and security incidents, as well as acts of terrorism or war; health-related pandemics or outbreaks, including the COVID‑19 pandemic; changes to existing renewable energy industry policies and regulations that present technical, regulatory and economic barriers to renewable energy projects; the reduction, elimination or expiration of government incentives for, or regulations mandating the use of, renewable energy; our ability to effectively manage the global expansion of the scale of our business operations; our ability to perform to expectations in our new line of business involving the construction of PV systems for municipalities in Israel; our ability to effectively manage our supply chain and comply with applicable regulations with respect to international trade relations, tariffs and our ability to mitigate their impacts, sanctions, export controls and anti-bribery and anti-corruption laws; our ability to effectively comply with Environmental Health and Safety and other laws and regulations and receive and maintain all necessary licenses, permits and authorizations; our performance of various obligations under the terms of our indebtedness (and the indebtedness of our subsidiaries that we guarantee) and our ability to continue to secure project financing on attractive terms for our projects; limitations on our management rights and operational flexibility due to our use of tax equity arrangements; potential claims and disagreements with partners, investors and other counterparties that could reduce our right to cash flows generated by our projects; our ability to comply with increasingly complex tax laws of various jurisdictions in which we currently operate as well as the tax laws in jurisdictions in which we intend to operate in the future; our ability to obtain tax benefits and credits in the U.S. or other jurisdictions; the unknown effect of the dual listing of our ordinary shares on the price of our ordinary shares; various risks related to our incorporation and location in Israel, including the ongoing war in Israel, where our headquarters and some of our wind energy and solar energy projects are located; the costs and requirements of being a public company, including the diversion of management’s attention with respect to such requirements; certain provisions in our Articles of Association and certain applicable regulations that may delay or prevent a change of control; and other risk factors set forth in the section titled “Risk factors” in our Annual Report on Form 20-F for the fiscal year ended December 31, 2025 filed with the Securities and Exchange Commission (the “SEC”), as may be updated in our other documents filed with or furnished to the SEC.   These statements reflect management’s current expectations regarding future events and operating performance and speak only as of the date of this presentation. You should not put undue reliance on any forward-looking statements. Although we believe that the expectations reflected in the forward-looking statements are reasonable, we cannot guarantee that future results, levels of activity, performance and events and circumstances reflected in the forward-looking statements will be achieved or will occur. Except as required by applicable law, we undertake no obligation to update or revise publicly any forward-looking statements, whether as a result of new information, future events or otherwise, after the date on which the statements are made or to reflect the occurrence of unanticipated events.  Unless otherwise indicated, information contained in this presentation concerning the industry, competitive position and the markets in which the Company operates is based on information from independent industry and research organizations, other third- party sources and management estimates. Management estimates are derived from publicly available information released by independent industry analysts and other third-party sources, as well as data from the Company's internal research, and are based on assumptions made by the Company upon reviewing such data, and the Company's experience in, and knowledge of, such industry and markets, which the Company believes to be reasonable. In addition, projections, assumptions and estimates of the future performance of the industry in which the Company operates, and the Company's future performance are necessarily subject to uncertainty and risk due to a variety of factors, including those described above. These and other factors could cause results to differ materially from those expressed in the estimates made by independent parties and by the Company. Industry publications, research, surveys and studies generally state that the information they contain has been obtained from sources believed to be reliable, but that the accuracy and completeness of such information is not guaranteed. Forecasts and other forward-looking information obtained from these sources are subject to the same qualifications and uncertainties as the other forward-looking statements in this presentation.   Non-IFRS Financial Metrics  This presentation presents Adjusted EBITDA, a non-IFRS financial metric, which is provided as a complement to the results provided in accordance with the International Financial Reporting Standards as issued by the International Accounting Standards Board (“IFRS”). A reconciliation of Adjusted EBITDA to Net Income, its most directly comparable IFRS financial measure, is contained in the tables at the end of this presentation. The Company is unable to provide a reconciliation of Adjusted EBITDA to Net Income on a forward-looking basis without unreasonable effort because items that impact this IFRS financial measure are not within the Company’s control and/or cannot be reasonably predicted. These items may include, but are not limited to, forward-looking depreciation and amortization, share based compensation, other income, finance income, finance expenses, share of losses of equity accounted investees and taxes on income. Such information may have a significant, and potentially unpredictable, impact on the Company’s future financial results.  The trademarks included herein are the property of the owners thereof and are used for reference purposes only. Such use should not be construed as an endorsement of the products or services of the Company. 


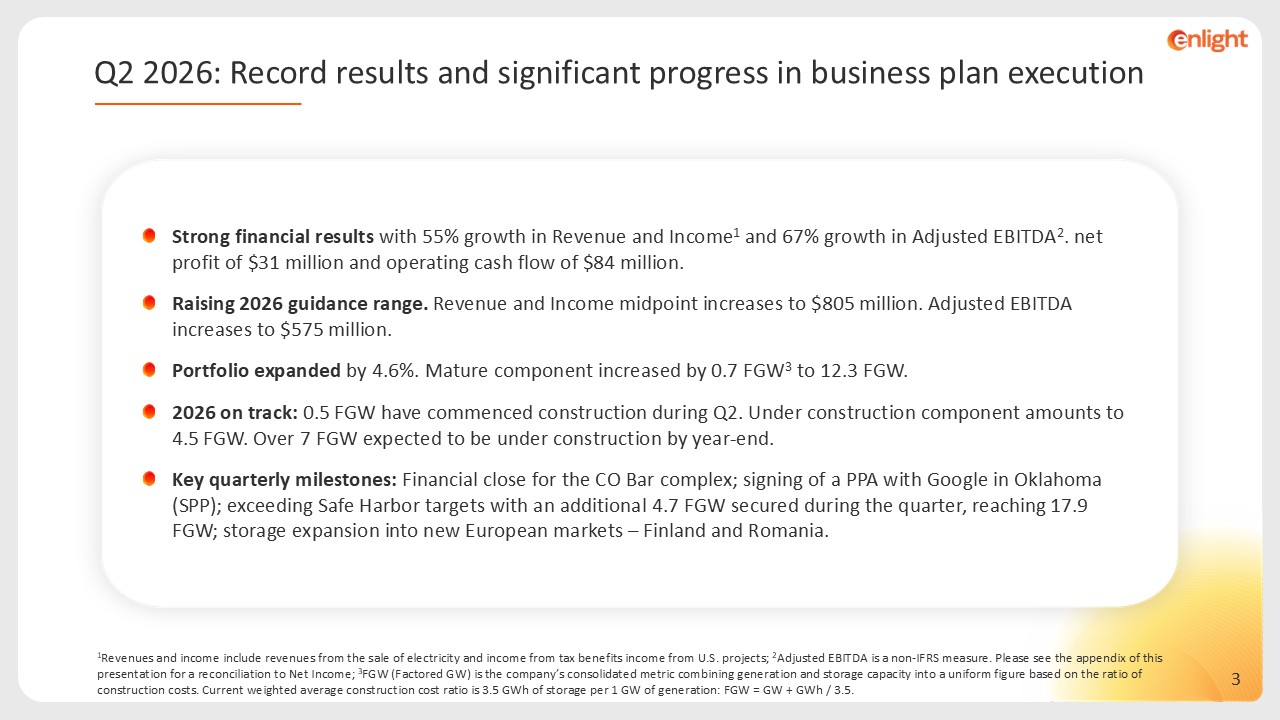
 1Revenues and income include revenues from the sale of electricity and income from tax benefits income from U.S. projects; 2Adjusted EBITDA is a non-IFRS measure. Please see the appendix of this presentation for a reconciliation to Net Income; 3FGW (Factored GW) is the company’s consolidated metric combining generation and storage capacity into a uniform figure based on the ratio of construction costs. Current weighted average construction cost ratio is 3.5 GWh of storage per 1 GW of generation: FGW = GW + GWh / 3.5.  Strong financial results with 55% growth in Revenue and Income1 and 67% growth in Adjusted EBITDA2. net profit of $31 million and operating cash flow of $84 million.   Raising 2026 guidance range. Revenue and Income midpoint increases to $805 million. Adjusted EBITDA increases to $575 million.  Portfolio expanded by 4.6%. Mature component increased by 0.7 FGW3 to 12.3 FGW.   2026 on track: 0.5 FGW have commenced construction during Q2. Under construction component amounts to 4.5 FGW. Over 7 FGW expected to be under construction by year-end.   Key quarterly milestones: Financial close for the CO Bar complex; signing of a PPA with Google in Oklahoma (SPP); exceeding Safe Harbor targets with an additional 4.7 FGW secured during the quarter, reaching 17.9 FGW; storage expansion into new European markets – Finland and Romania.  Q2 2026: Record results and significant progress in business plan execution  


 Financial Results – Growth Momentum Continues 


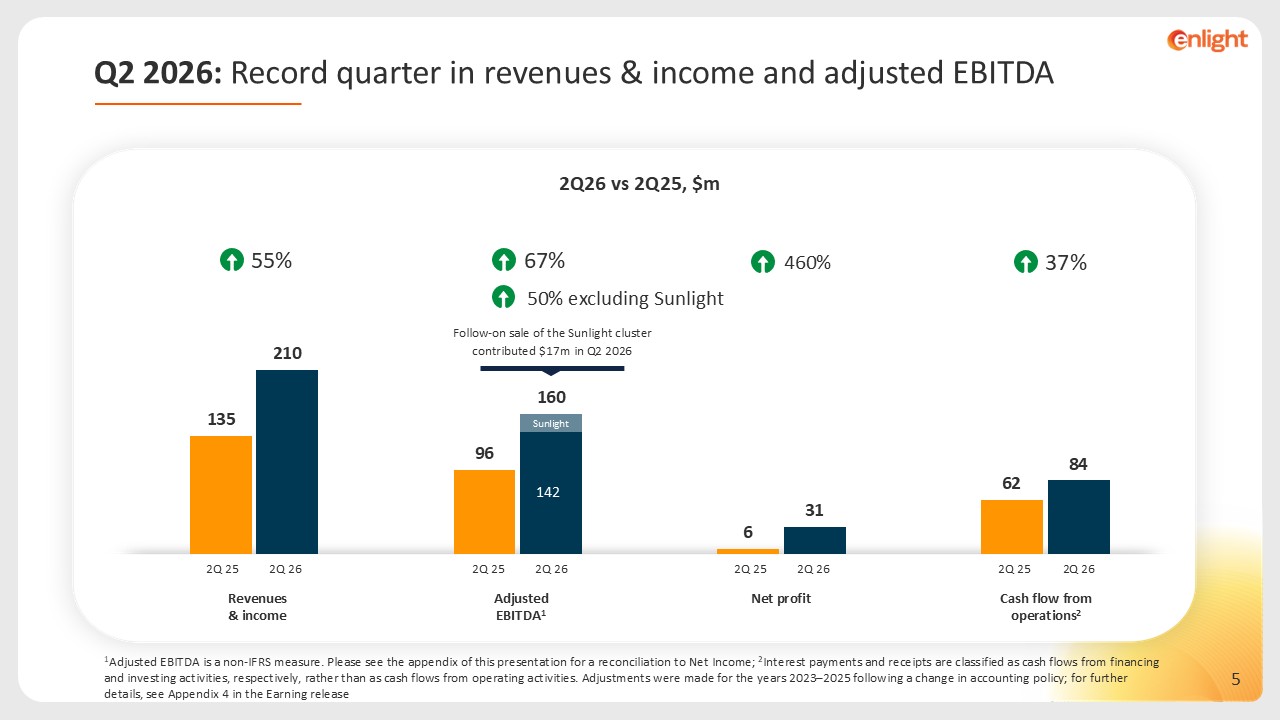
 2Q26 vs 2Q25, $m  Revenues & income  Adjusted   EBITDA1  Net profit  Cash flow from operations2  55%  67%  2Q 26  2Q 25  2Q 26  2Q 25  2Q 26  2Q 25  2Q 26  2Q 25  37%  Follow-on sale of the Sunlight cluster contributed $17m in Q2 2026  460%  50% excluding Sunlight  Sunlight  142  Q2 2026: Record quarter in revenues & income and adjusted EBITDA  1Adjusted EBITDA is a non-IFRS measure. Please see the appendix of this presentation for a reconciliation to Net Income; 2Interest payments and receipts are classified as cash flows from financing and investing activities, respectively, rather than as cash flows from operating activities. Adjustments were made for the years 2023–2025 following a change in accounting policy; for further details, see Appendix 4 in the Earning release  


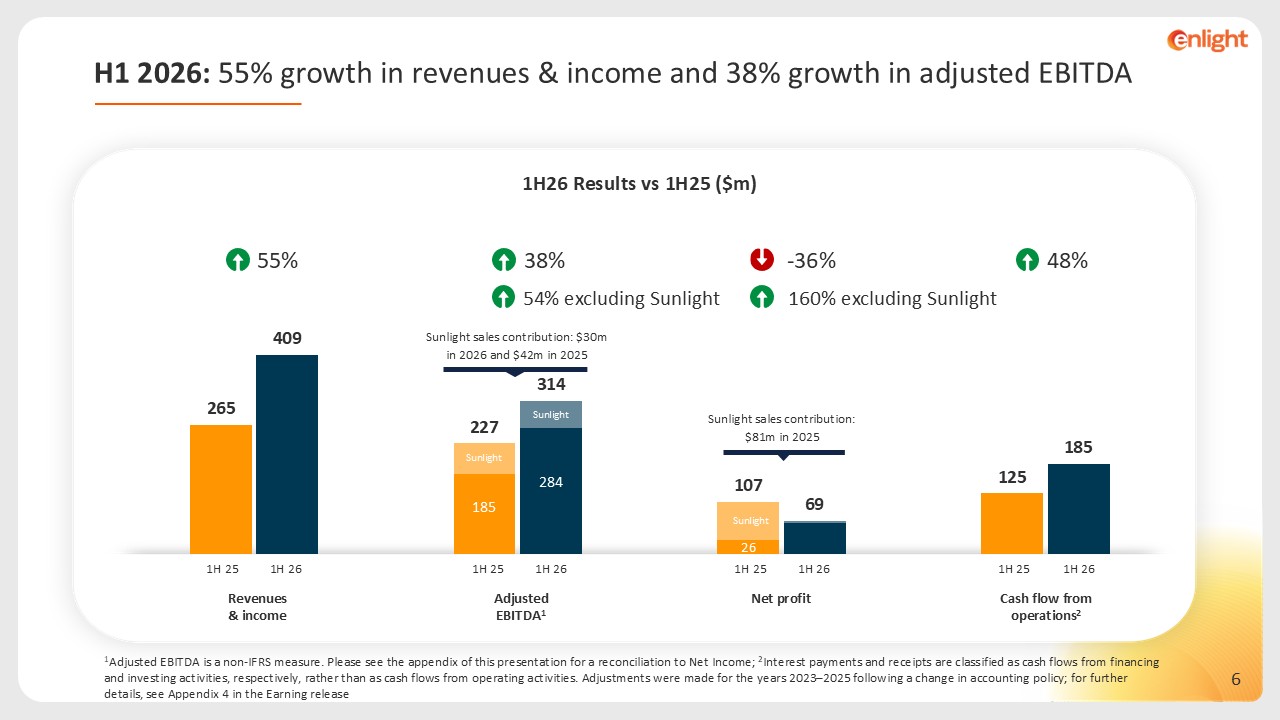
 Revenues & income  Adjusted   EBITDA1  Net profit  Cash flow from operations2  H1 2026: 55% growth in revenues & income and 38% growth in adjusted EBITDA  1Adjusted EBITDA is a non-IFRS measure. Please see the appendix of this presentation for a reconciliation to Net Income; 2Interest payments and receipts are classified as cash flows from financing and investing activities, respectively, rather than as cash flows from operating activities. Adjustments were made for the years 2023–2025 following a change in accounting policy; for further details, see Appendix 4 in the Earning release   55%  38%  1H 26  1H 25  1H 26  1H 25  1H 26  1H 25  1H 26  1H 25  -36%  48%  Sunlight sales contribution: $81m in 2025  Sunlight sales contribution: $30m in 2026 and $42m in 2025  160% excluding Sunlight  54% excluding Sunlight  Sunlight  284  Sunlight  185  Sunlight  1H26 Results vs 1H25 ($m)  26 


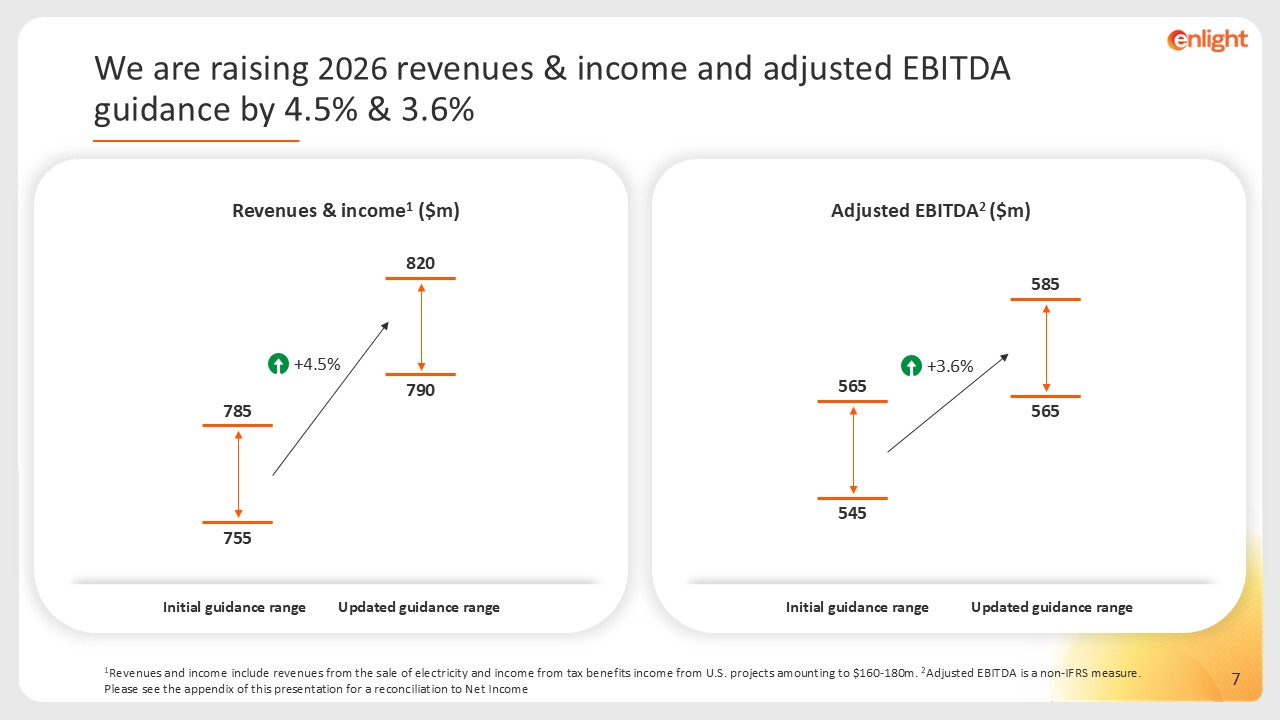
 1Revenues and income include revenues from the sale of electricity and income from tax benefits income from U.S. projects amounting to $160-180m. 2Adjusted EBITDA is a non-IFRS measure. Please see the appendix of this presentation for a reconciliation to Net Income  Revenues & income1 ($m)  785  755  Adjusted EBITDA2 ($m)  +4.5%  820  790  Updated guidance range  Initial guidance range  Updated guidance range  Initial guidance range  We are raising 2026 revenues & income and adjusted EBITDA guidance by 4.5% & 3.6%  565  545  +3.6%  585  565 


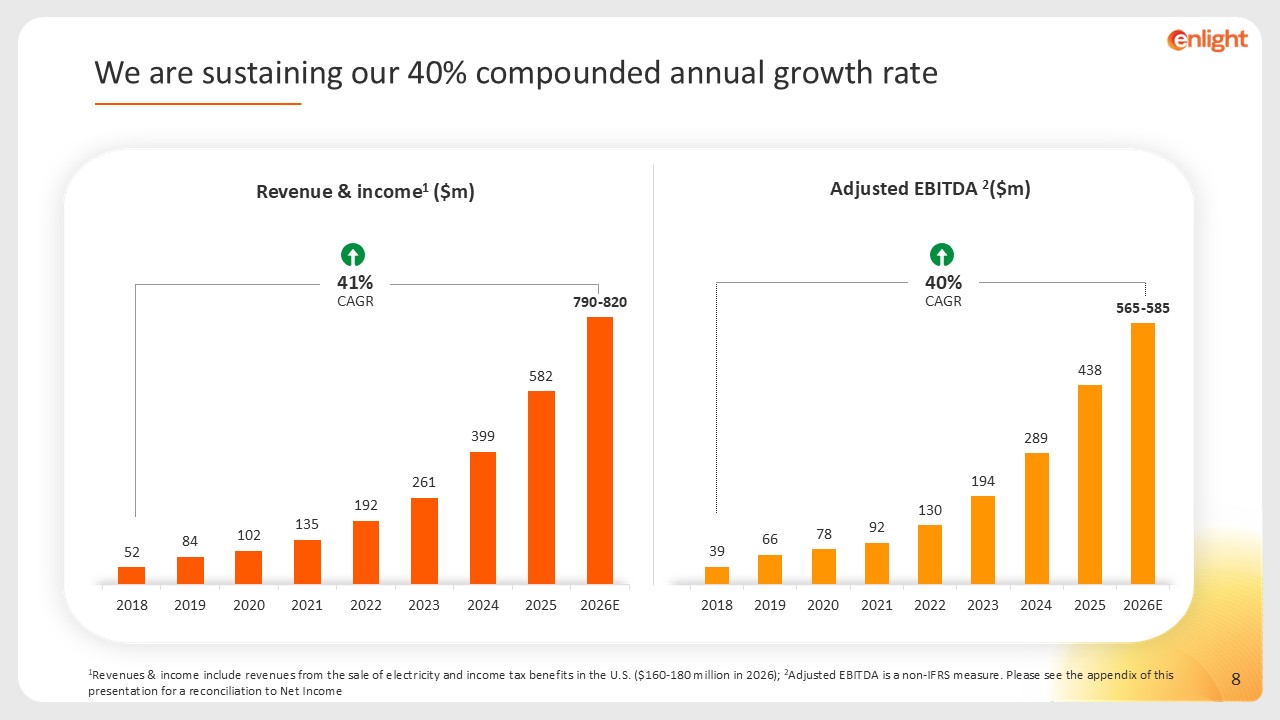
 Revenue & income1 ($m)  1Revenues & income include revenues from the sale of electricity and income tax benefits in the U.S. ($160-180 million in 2026); 2Adjusted EBITDA is a non-IFRS measure. Please see the appendix of this presentation for a reconciliation to Net Income  We are sustaining our 40% compounded annual growth rate  41%  CAGR  Adjusted EBITDA2 ($m)  40%  CAGR 


 Significant Milestones Achieved 


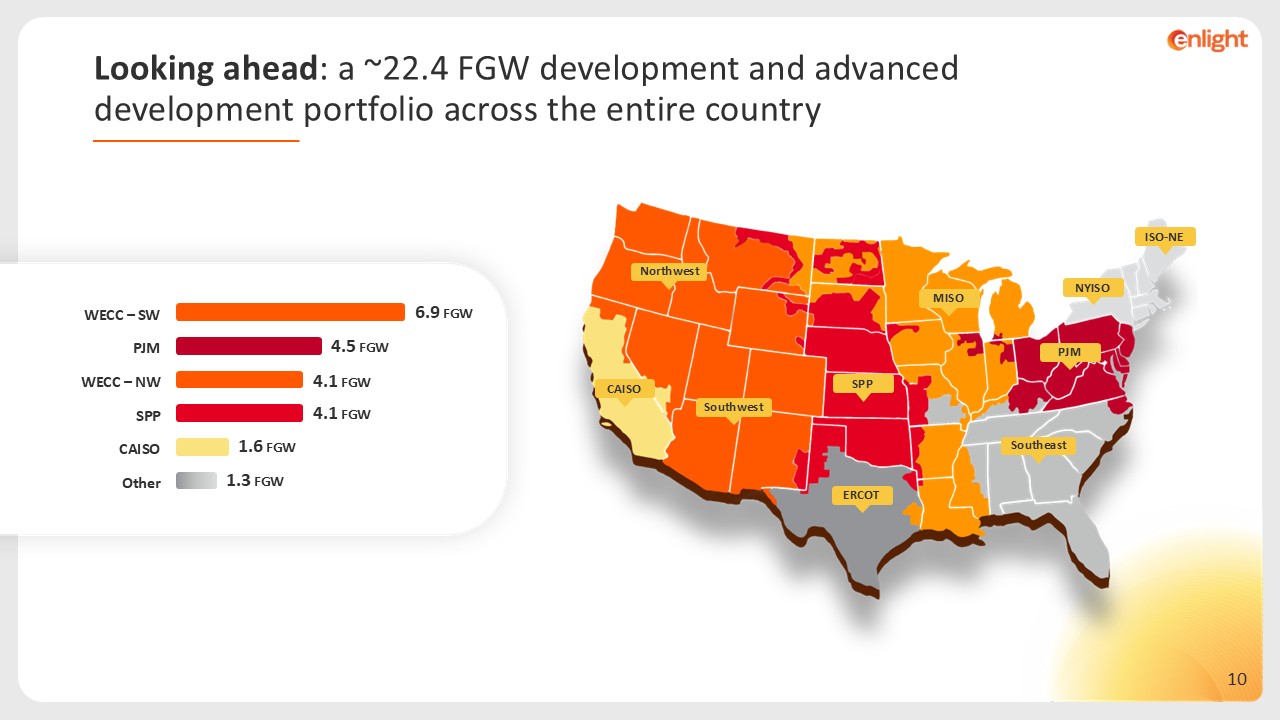
 ISO-NE  NYISO  Southwest  Northwest  CAISO  Southeast  SPP  ERCOT  MISO  PJM  6.9 FGW   WECC – SW   4.5 FGW   PJM  4.1 FGW   WECC – NW  1.6 FGW   CAISO  4.1 FGW   SPP  1.3 FGW   Other  Looking ahead: a ~22.4 FGW development and advanced development portfolio across the entire country 
 

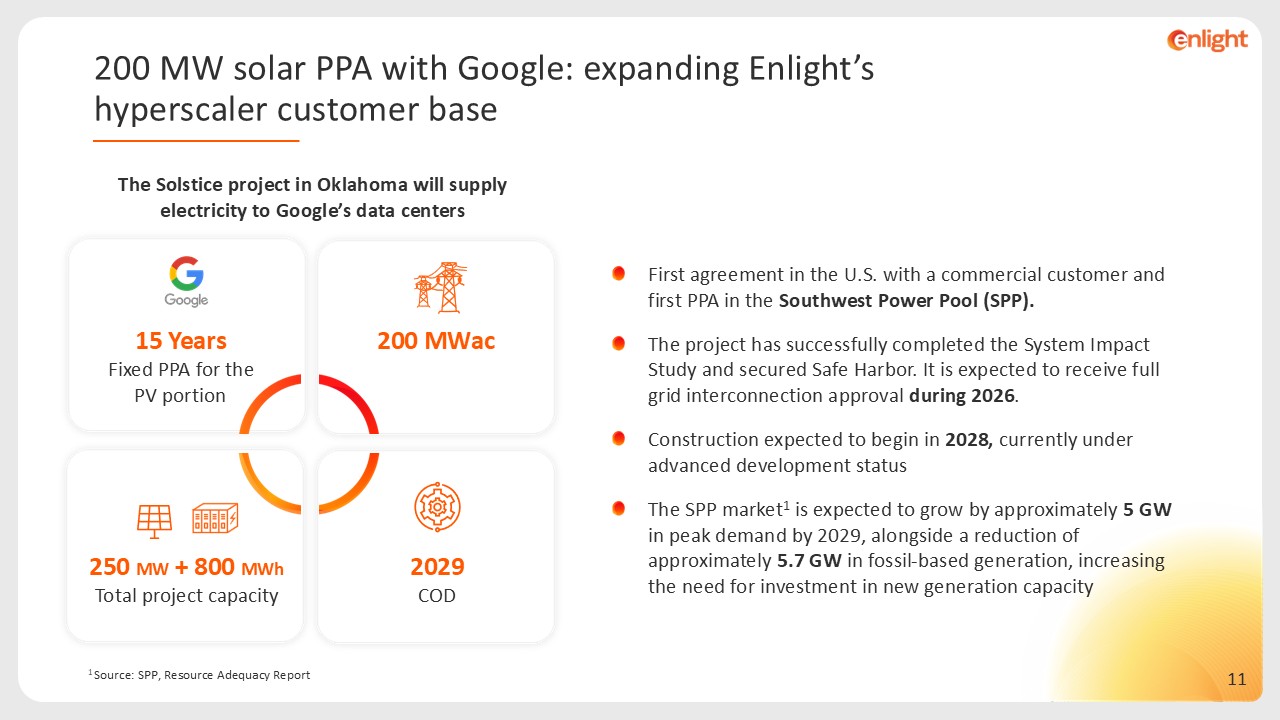
 The Solstice project in Oklahoma will supply electricity to Google’s data centers  First agreement in the U.S. with a commercial customer and first PPA in the Southwest Power Pool (SPP).   The project has successfully completed the System Impact Study and secured Safe Harbor. It is expected to receive full grid interconnection approval during 2026.   Construction expected to begin in 2028, currently under advanced development status  The SPP market1 is expected to grow by approximately 5 GW in peak demand by 2029, alongside a reduction of approximately 5.7 GW in fossil-based generation, increasing the need for investment in new generation capacity  2029  COD  15 Years  Fixed PPA for the PV portion  250 MW + 800 MWh  Total project capacity  200 MWac  1 Source: SPP, Resource Adequacy Report  200 MW solar PPA with Google: expanding Enlight’s hyperscaler customer base 


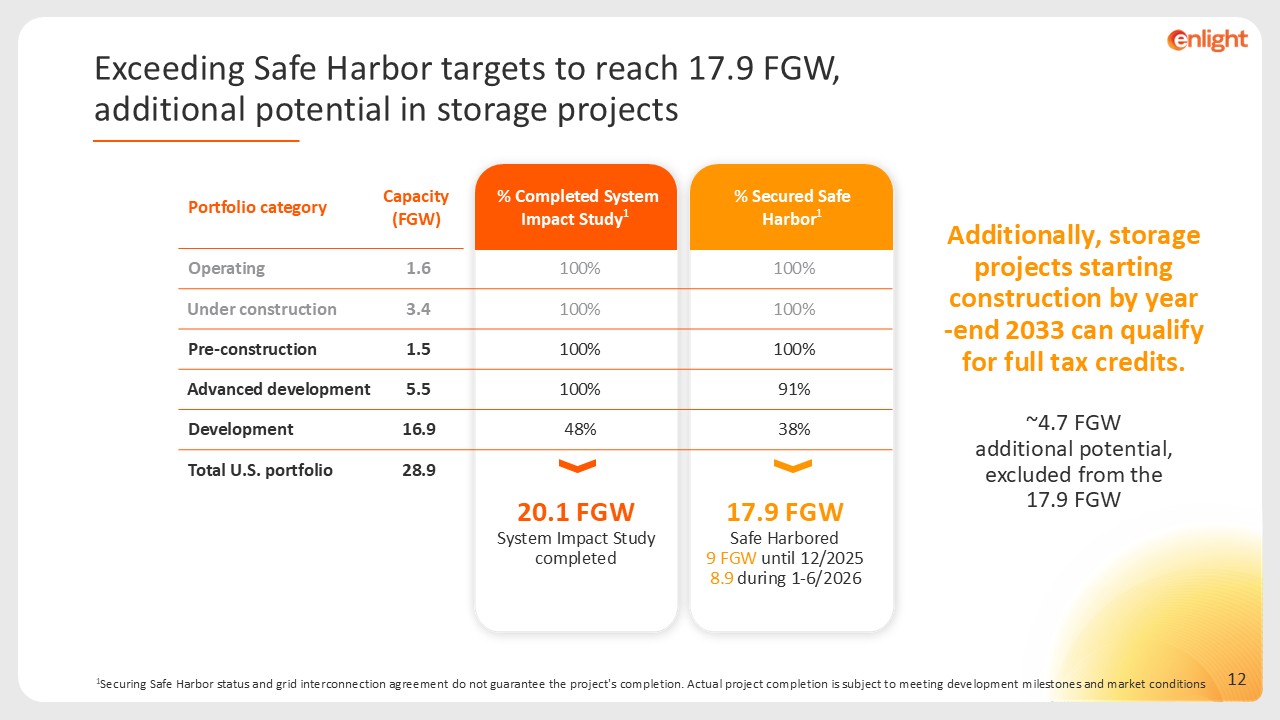
 Portfolio category  Capacity (FGW)  % Completed System Impact Study1   % Secured Safe Harbor1  Operating  1.6  100%  100%   Under construction  3.4  100%  100%  Pre-construction  1.5  100%  100%   Advanced development  5.5  100%  91%  Development  16.9  48%  38%  Total U.S. portfolio  28.9  1Securing Safe Harbor status and grid interconnection agreement do not guarantee the project's completion. Actual project completion is subject to meeting development milestones and market conditions  17.9 FGW   Safe Harbored  9 FGW until 12/2025  8.9 during 1-6/2026  20.1 FGW   System Impact Study completed  Exceeding Safe Harbor targets to reach 17.9 FGW, additional potential in storage projects  Additionally, storage projects starting construction by year-end 2033 can qualify for full tax credits.  ~4.7 FGW   additional potential, excluded from the   17.9 FGW 


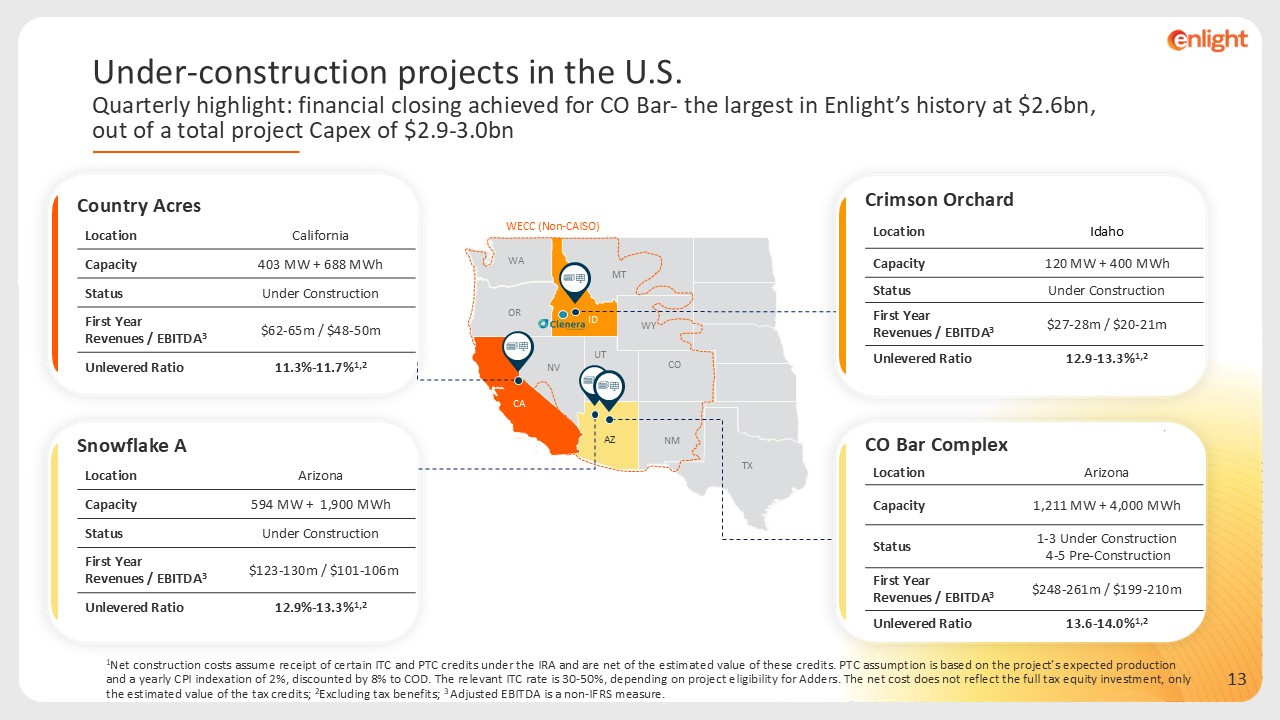
 WECC (Non-CAISO)  AZ  NM  TX  CA  NV  OR  WA  UT  CO  WY  ID  MT  Snowflake A  California  Location  403 MW + 688 MWh  Capacity   Under Construction  Status  $62-65m / $48-50m  First YearRevenues / EBITDA3  11.3%-11.7%1,2  Unlevered Ratio  Country Acres  Arizona  Location  594 MW + 1,900 MWh  Capacity   Under Construction  Status   $123-130m / $101-106m  First Year Revenues / EBITDA3  12.9%-13.3%1,2  Unlevered Ratio  Arizona  Location  1,211 MW + 4,000 MWh   Capacity    1-3 Under Construction   4-5 Pre-Construction  Status  $248-261m / $199-210m  First YearRevenues / EBITDA3  13.6-14.0%1,2  Unlevered Ratio  CO Bar Complex  Idaho  Location  120 MW + 400 MWh   Capacity   Under Construction  Status  $27-28m / $20-21m  First YearRevenues / EBITDA3  12.9-13.3%1,2  Unlevered Ratio  Crimson Orchard  1Net construction costs assume receipt of certain ITC and PTC credits under the IRA and are net of the estimated value of these credits. PTC assumption is based on the project’s expected production and a yearly CPI indexation of 2%, discounted by 8% to COD. The relevant ITC rate is 30-50%, depending on project eligibility for Adders. The net cost does not reflect the full tax equity investment, only the estimated value of the tax credits; 2Excluding tax benefits; 3 Adjusted EBITDA is a non-IFRS measure.  Quarterly highlight: financial closing achieved for CO Bar- the largest in Enlight’s history at $2.6bn, out of a total project Capex of $2.9-3.0bn  Under-construction projects in the U.S. 


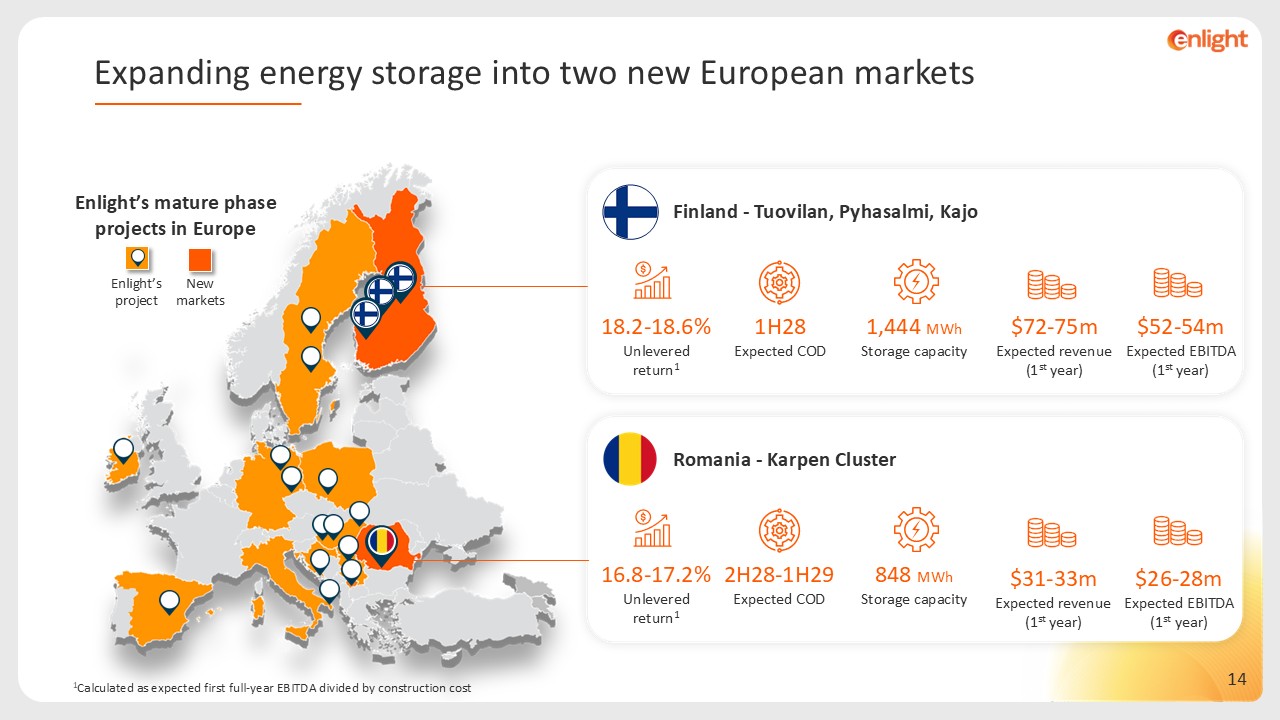
 1Calculated as expected first full-year EBITDA divided by construction cost  Enlight’s mature phase projects in Europe  1,444 MWh  Storage capacity  1H28  Expected COD  $72-75m  Expected revenue (1st year)  $52-54m  Expected EBITDA (1st year)  18.2-18.6%  Unlevered return1  Finland - Tuovilan, Pyhasalmi, Kajo  848 MWh  Storage capacity  2H28-1H29  Expected COD  $31-33m  Expected revenue (1st year)  $26-28m  Expected EBITDA (1st year)  16.8-17.2%  Unlevered return1  Romania - Karpen Cluster   Enlight’s project  Expanding energy storage into two new European markets  New markets 


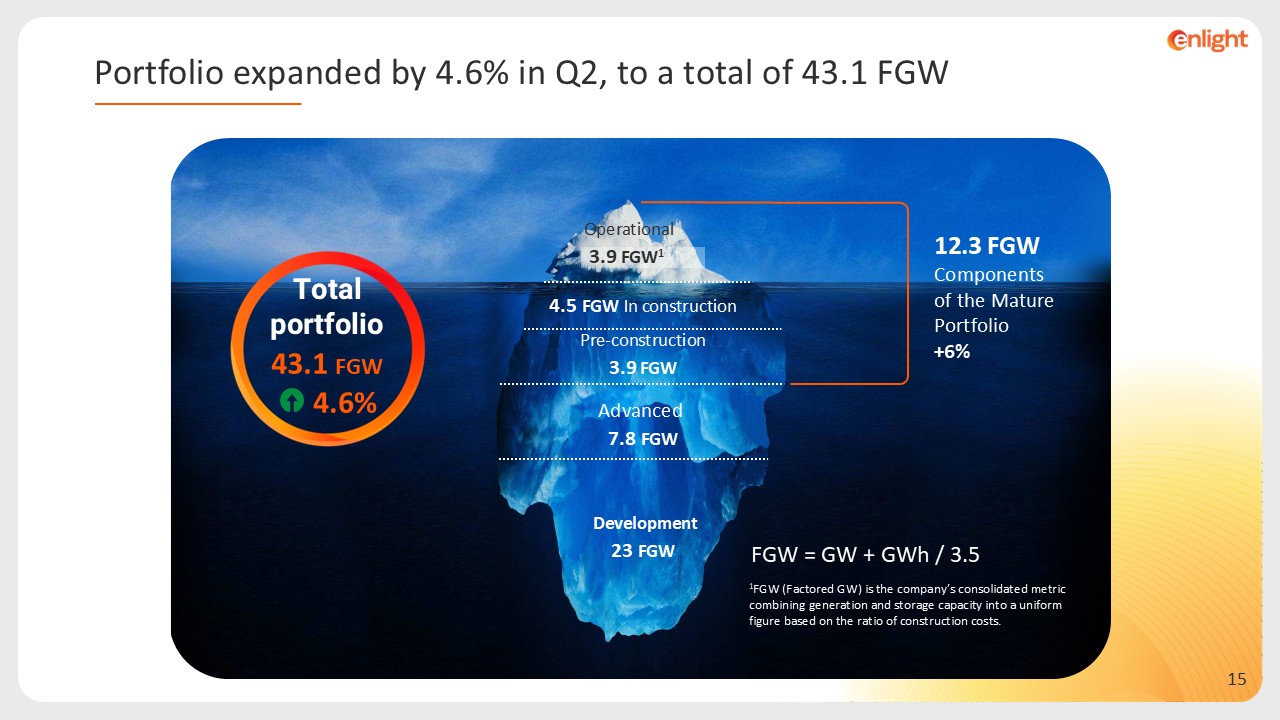
 Operational   FGW1 3.9   In construction FGW 4.5   Pre-construction  FGW 3.9   Advanced   FGW 7.8   Development  FGW 23   Total portfolio  FGW 43.1   4.6%  FGW = GW + GWh / 3.5  Portfolio expanded by 4.6% in Q2, to a total of 43.1 FGW  12.3 FGW  Components of the Mature Portfolio  +6%  1FGW (Factored GW) is the company’s consolidated metric combining generation and storage capacity into a uniform figure based on the ratio of construction costs.  


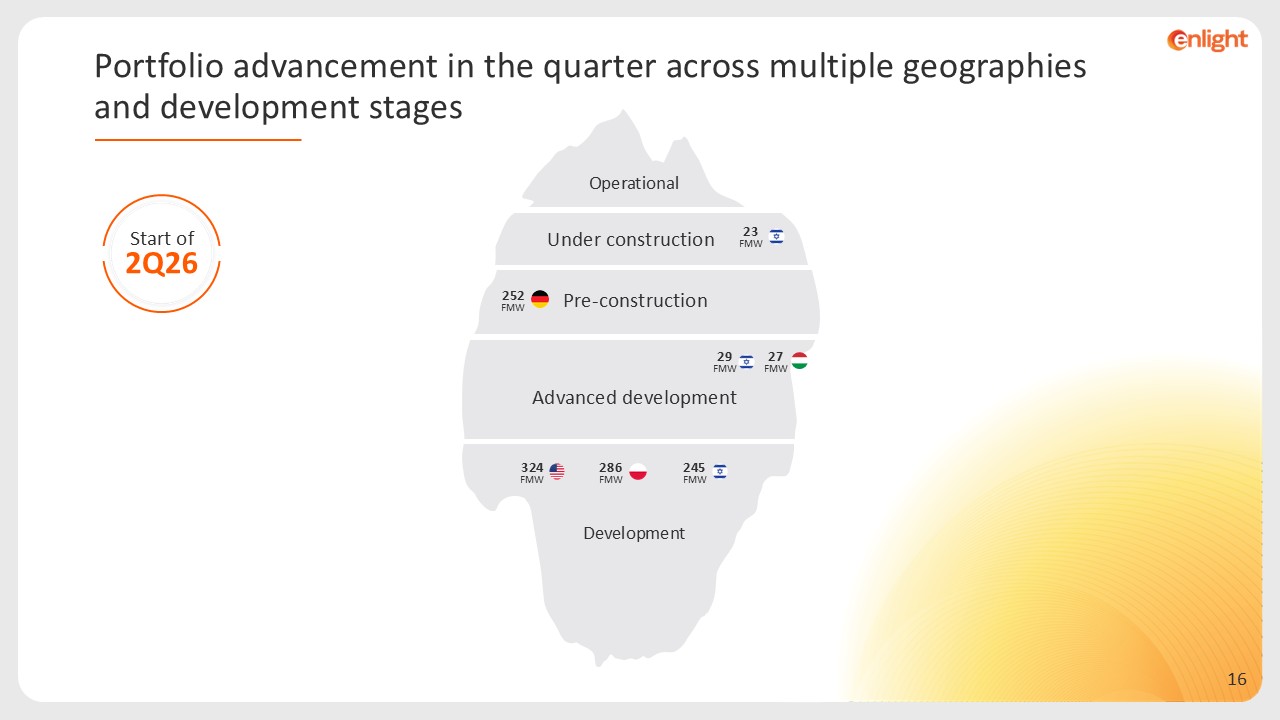
 Development     Under construction  Operational  Portfolio advancement in the quarter across multiple geographies and development stages  Start of 2Q26  Pre-construction  Advanced development  29 FMW  23 FMW  324FMW  245 FMW  286 FMW  252 FMW  27 FMW 


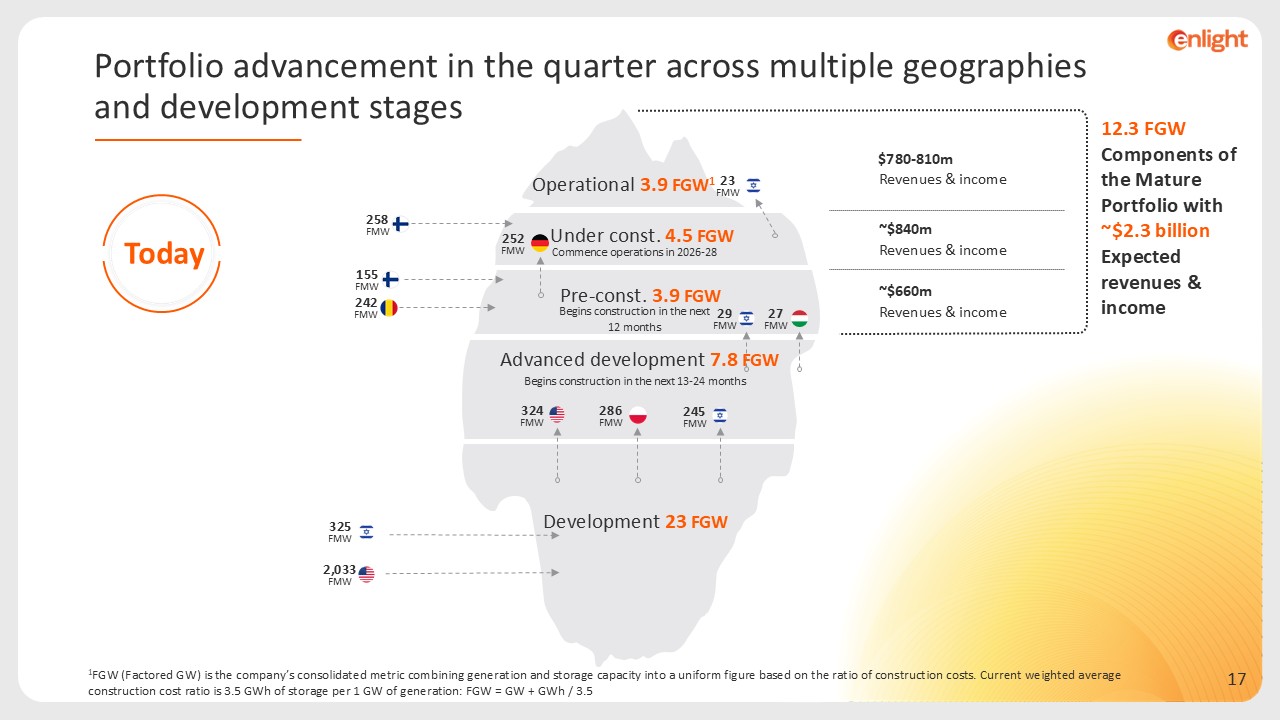
 Today  Portfolio advancement in the quarter across multiple geographies and development stages  $780-810m  Revenues & income  ~$840m  Revenues & income  ~$660m  Revenues & income  12.3 FGW  Components of the Mature Portfolio with ~$2.3 billion Expected revenues & income  Operational 3.9 FGW1   Under const. 4.5 FGW   Pre-const. 3.9 FGW   Development 23 FGW   Commence operations in 2026-28  Begins construction in the next 12 months  Begins construction in the next 13-24 months  324FMW  29 FMW  286 FMW  325 FMW  2,033FMW  23 FMW  245 FMW  252 FMW  258 FMW  27 FMW  155 FMW  242 FMW  Advanced development 7.8 FGW  1FGW (Factored GW) is the company’s consolidated metric combining generation and storage capacity into a uniform figure based on the ratio of construction costs. Current weighted average construction cost ratio is 3.5 GWh of storage per 1 GW of generation: FGW = GW + GWh / 3.5 


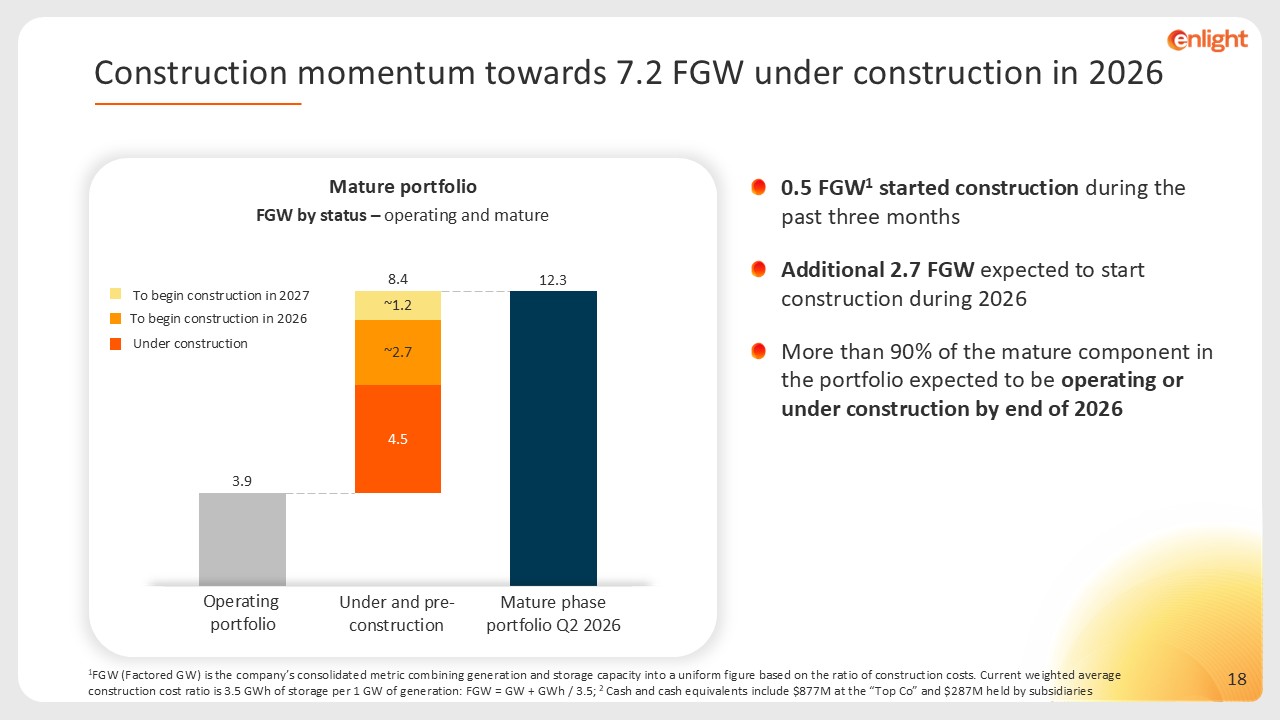
 0.5 FGW1 started construction during the past three months  Additional 2.7 FGW expected to start construction during 2026  More than 90% of the mature component in the portfolio expected to be operating or under construction by end of 2026   Mature portfolio  FGW by status – operating and mature  1FGW (Factored GW) is the company’s consolidated metric combining generation and storage capacity into a uniform figure based on the ratio of construction costs. Current weighted average construction cost ratio is 3.5 GWh of storage per 1 GW of generation: FGW = GW + GWh / 3.5; 2 Cash and cash equivalents include $877M at the “Top Co” and $287M held by subsidiaries  4.0  ~1.2  ~2.7  8.4  To begin construction in 2026  To begin construction in 2027  Under construction  Construction momentum towards 7.2 FGW under construction in 2026   Mature phase portfolio Q2 2026  Operating portfolio  Under and pre-construction 


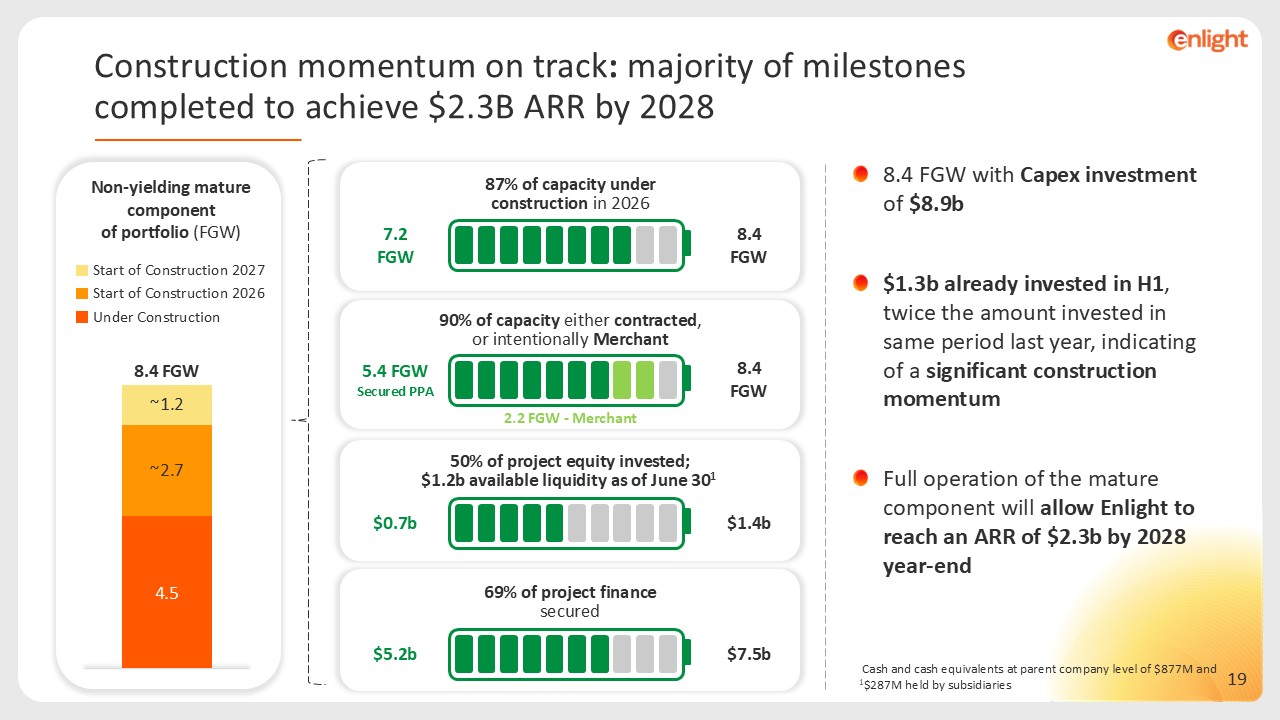
  Cash and cash equivalents at parent company level of $877M and $287M held by subsidiaries 1  8.4 FGW with Capex investment of $8.9b   $1.3b already invested in H1, twice the amount invested in same period last year, indicating of a significant construction momentum  Full operation of the mature component will allow Enlight to reach an ARR of $2.3b by 2028 year-end  Non-yielding mature component of portfolio (FGW)  ~1.2  ~2.7  8.4 FGW  Under Construction  Start of Construction 2027  Start of Construction 2026  Construction momentum on track: majority of milestones completed to achieve $2.3B ARR by 2028   8.4 FGW  7.2 FGW  87% of capacity under construction in 2026  2.2 FGW - Merchant   8.4 FGW  5.4 FGWSecured PPA  90% of capacity either contracted, or intentionally Merchant  $1.4b  $0.7b  50% of project equity invested;   $1.2b available liquidity as of June 30 1  $7.5b  $5.2b  69% of project finance secured 


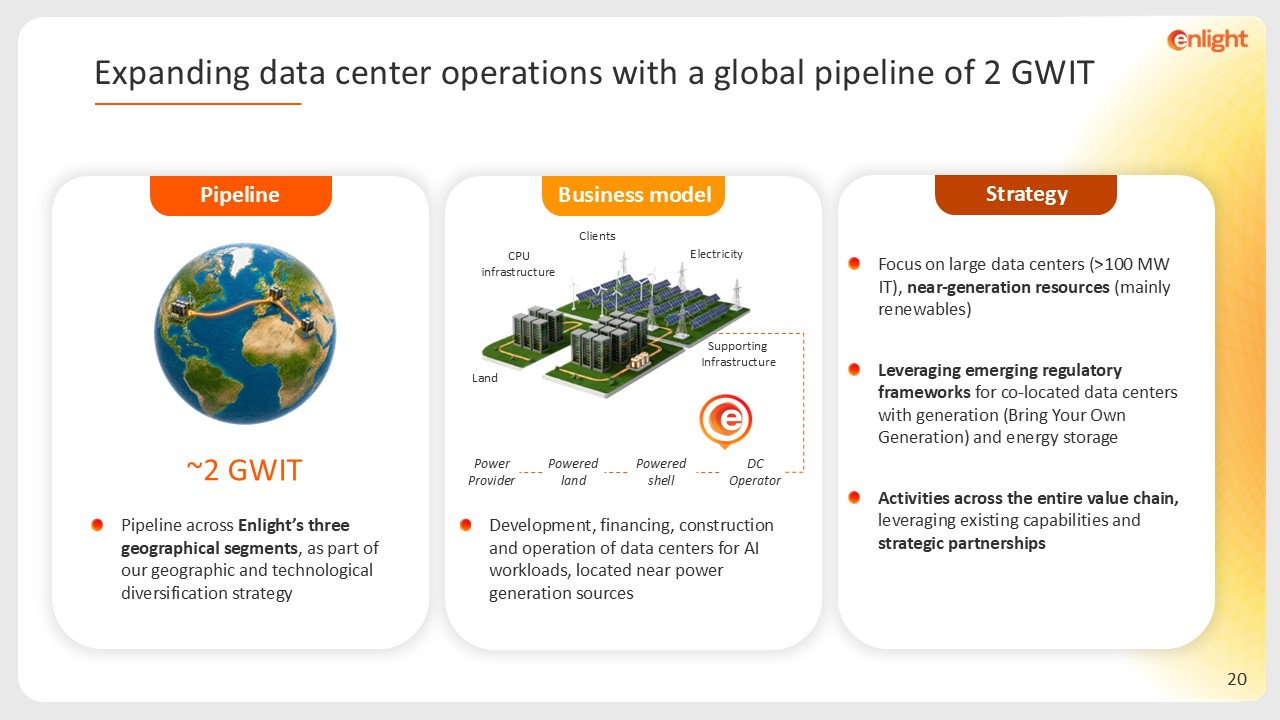
 Expanding data center operations with a global pipeline of 2 GWIT  Pipeline across Enlight’s three geographical segments, as part of our geographic and technological diversification strategy  Development, financing, construction and operation of data centers for AI workloads, located near power generation sources  Focus on large data centers (>100 MW IT), near-generation resources (mainly renewables)  Leveraging emerging regulatory frameworks for co-located data centers with generation (Bring Your Own Generation) and energy storage   Activities across the entire value chain, leveraging existing capabilities and strategic partnerships  ~2 GWIT  Pipeline  Business model  Strategy  Power Provider  Powered land  Powered shell  DC Operator  CPU infrastructure  Electricity  Land  Supporting Infrastructure  Clients 


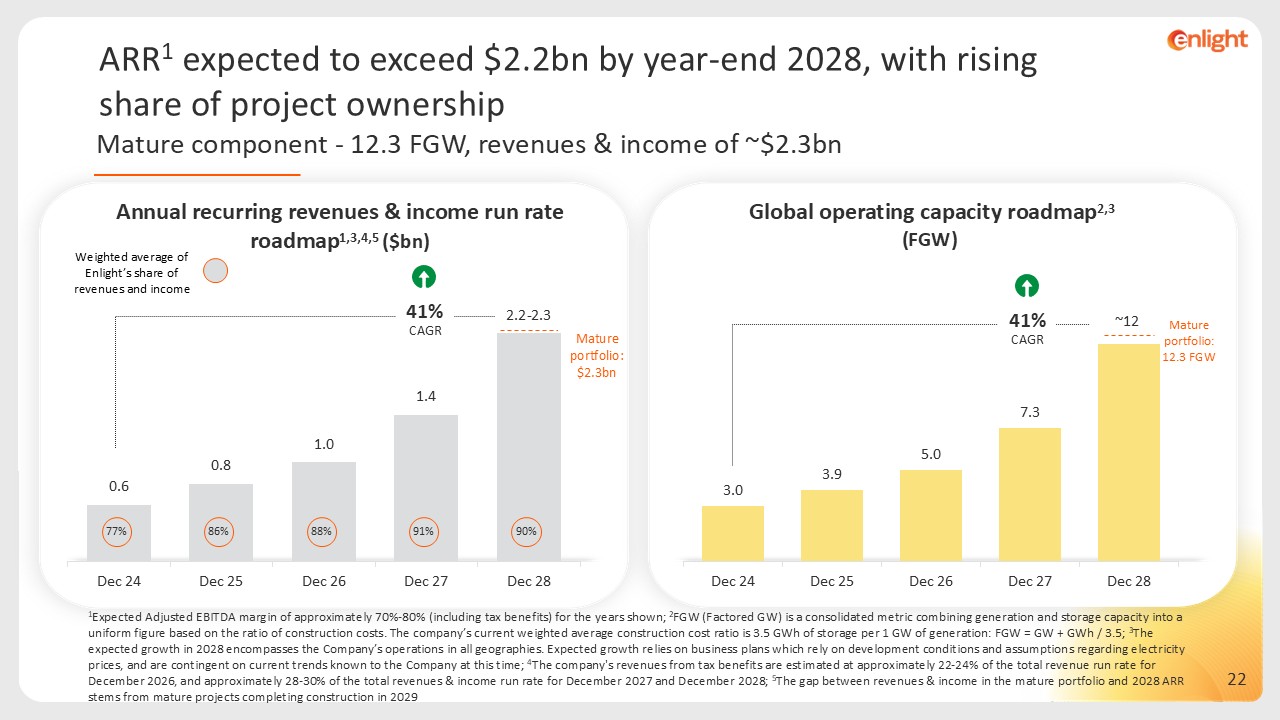
 1Based on 2026 guidance added to revenues & income (sale of electricity, tax benefits) of projects in the under construction and pre-construction portions of the Mature portfolio, and advanced development projects with an expected COD in 2028  Business Plan: 3X growth in 3 years, reaching a revenue run-rate of over $2.2 billion1 by end-2028 


 Mature component - 12.3 FGW, revenues & income of ~$2.3bn  1Expected Adjusted EBITDA margin of approximately 70%-80% (including tax benefits) for the years shown; 2FGW (Factored GW) is a consolidated metric combining generation and storage capacity into a uniform figure based on the ratio of construction costs. The company’s current weighted average construction cost ratio is 3.5 GWh of storage per 1 GW of generation: FGW = GW + GWh / 3.5; 3The expected growth in 2028 encompasses the Company’s operations in all geographies. Expected growth relies on business plans which rely on development conditions and assumptions regarding electricity prices, and are contingent on current trends known to the Company at this time; 4The company's revenues from tax benefits are estimated at approximately 22-24% of the total revenue run rate for December 2026, and approximately 28-30% of the total revenues & income run rate for December 2027 and December 2028; 5The gap between revenues & income in the mature portfolio and 2028 ARR stems from mature projects completing construction in 2029  Weighted average of Enlight’s share of revenues and income  Annual recurring revenues & income run rate roadmap1,3,4,5 ($bn)  Global operating capacity roadmap2,3   (FGW)  Mature portfolio: $2.3bn  Mature portfolio: 12.3 FGW  ARR1 expected to exceed $2.2bn by year-end 2028, with rising share of project ownership  41%  CAGR   77%  90%  86%  88%  91%  41%  CAGR  


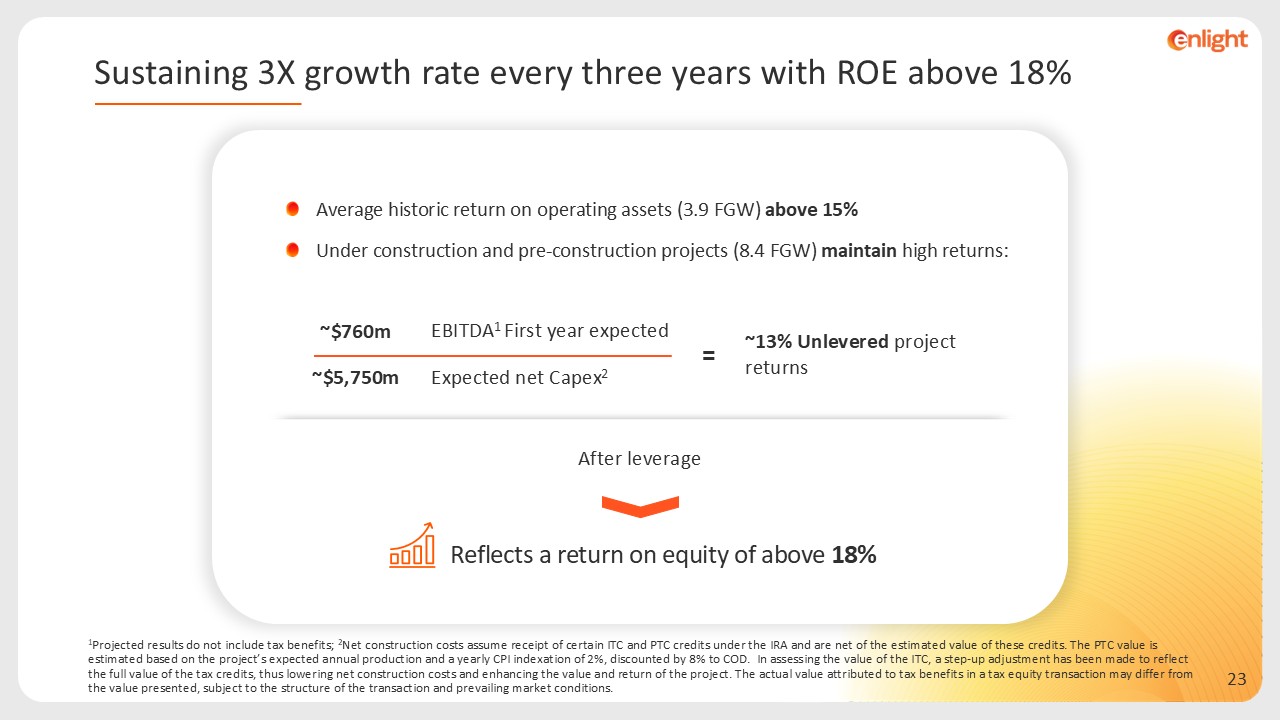
 Average historic return on operating assets (3.9 FGW) above 15%  Under construction and pre-construction projects (8.4 FGW) maintain high returns:  ~13% Unlevered project returns  EBITDA1 First year expected   ~$760m  Expected net Capex2  ~$5,750m  =  Reflects a return on equity of above 18%  After leverage  1Projected results do not include tax benefits; 2Net construction costs assume receipt of certain ITC and PTC credits under the IRA and are net of the estimated value of these credits. The PTC value is estimated based on the project’s expected annual production and a yearly CPI indexation of 2%, discounted by 8% to COD. In assessing the value of the ITC, a step-up adjustment has been made to reflect the full value of the tax credits, thus lowering net construction costs and enhancing the value and return of the project. The actual value attributed to tax benefits in a tax equity transaction may differ from the value presented, subject to the structure of the transaction and prevailing market conditions.  Sustaining 3X growth rate every three years with ROE above 18% 


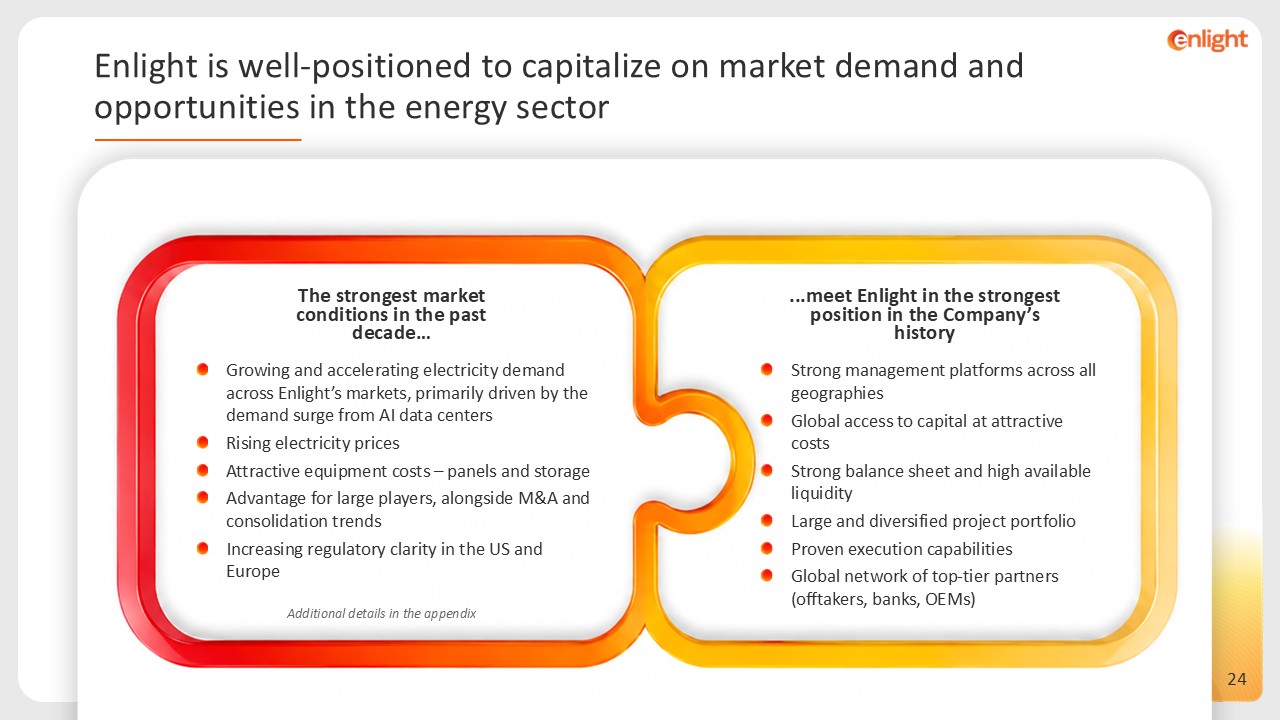
 Strong management platforms across all geographies  Global access to capital at attractive costs  Strong balance sheet and high available liquidity  Large and diversified project portfolio  Proven execution capabilities  Global network of top-tier partners (offtakers, banks, OEMs)  Additional details in the appendix  The strongest market conditions in the past decade…  Growing and accelerating electricity demand across Enlight’s markets, primarily driven by the demand surge from AI data centers  Rising electricity prices  Attractive equipment costs – panels and storage  Advantage for large players, alongside M&A and consolidation trends  Increasing regulatory clarity in the US and Europe  ...meet Enlight in the strongest position in the Company’s history  Enlight is well-positioned to capitalize on market demand and opportunities in the energy sector 


 Appendix 


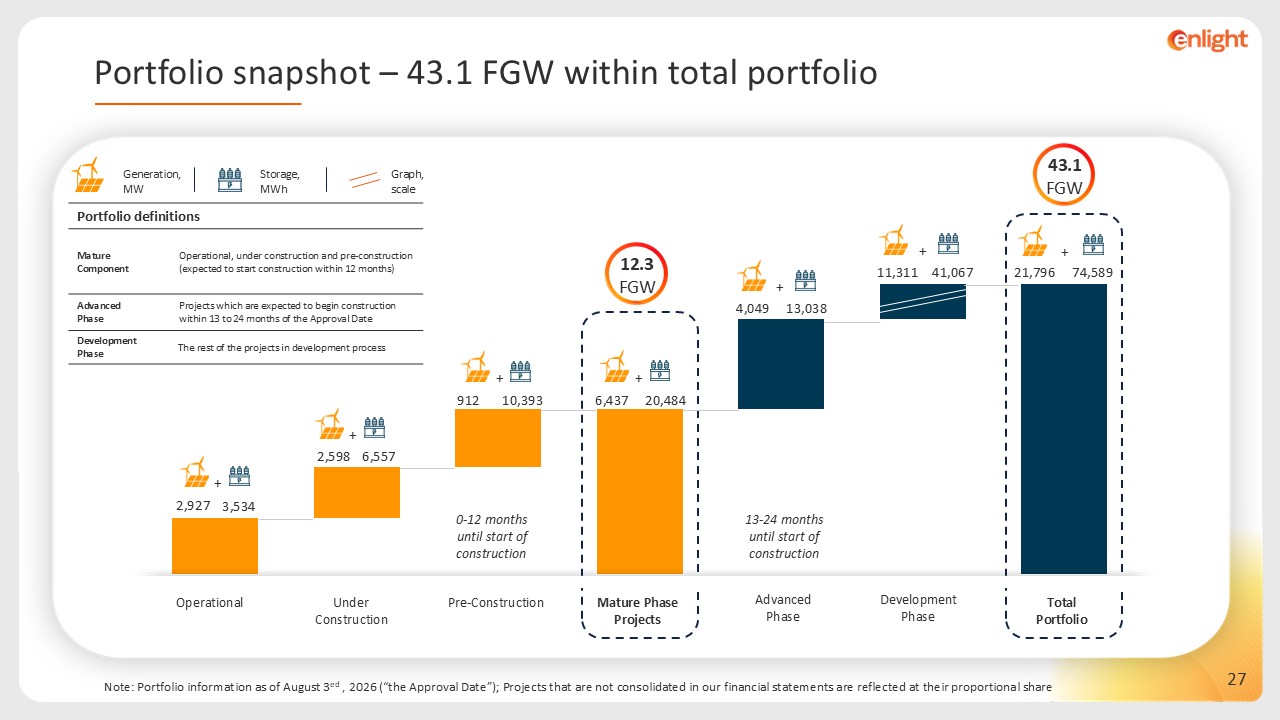
 Graph, scale  Generation, MW  Storage, MWh  Portfolio definitions  Operational, under construction and pre-construction (expected to start construction within 12 months)  Mature Component   Projects which are expected to begin construction within 13 to 24 months of the Approval Date  Advanced  Phase  The rest of the projects in development process  Development Phase  Note: Portfolio information as of August 3ed , 2026 (“the Approval Date”); Projects that are not consolidated in our financial statements are reflected at their proportional share   Advanced  Phase  Under Construction  Operational  Pre-Construction  Mature Phase   Projects  Development Phase  Total   Portfolio  0-12 months  until start of construction   13-24 months   until start of construction  Portfolio snapshot – 43.1 FGW within total portfolio  2,927  6,437  912  10,393   2,598  41,067  13,038  74,589  20,484  6,557  11,311  4,049  21,796  3,534  +  +  +  +  +  +  +  43.1  FGW  12.3  FGW 


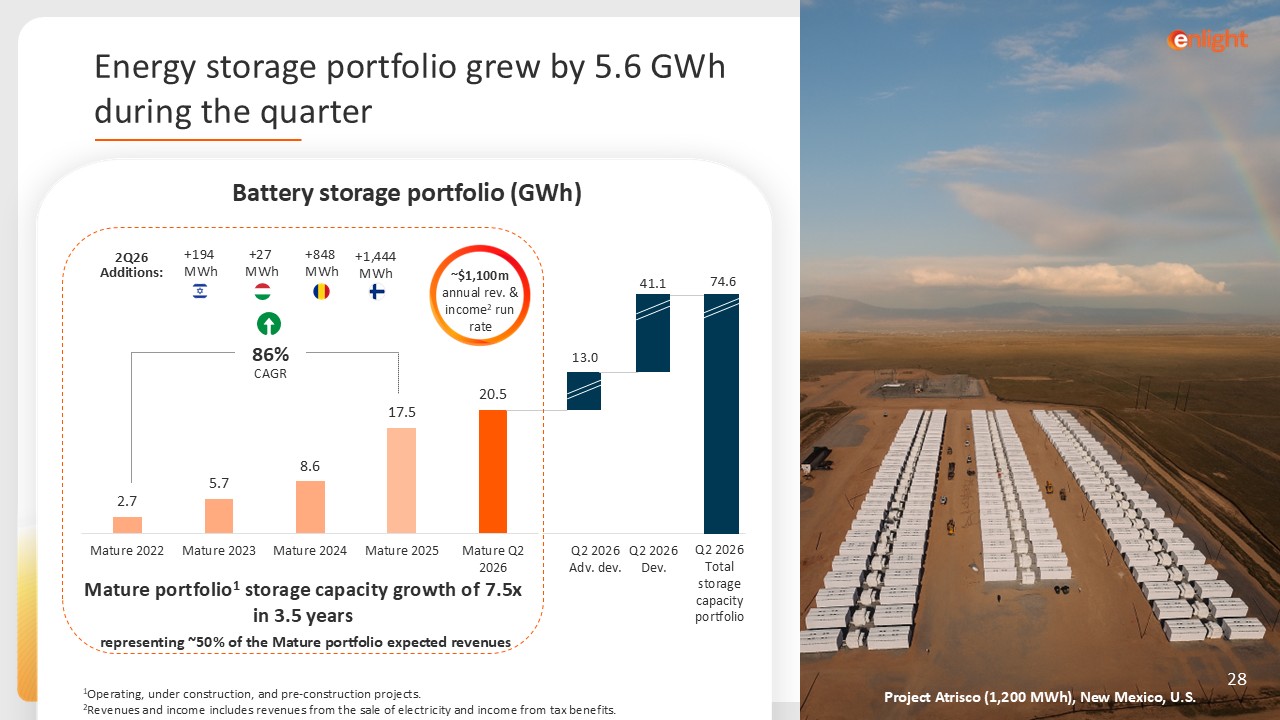
 Project Atrisco (1,200 MWh), New Mexico, U.S.  Mature portfolio1 storage capacity growth of 7.5x in 3.5 years   representing ~50% of the Mature portfolio expected revenues  2Q26  Additions:  Q2 2026  Adv. dev.  Q2 2026 Dev.  Q2 2026 Total storage capacity portfolio  41.1  13.0  74.6  86%  CAGR   ~$1,100m  annual rev. & income2 run rate  1Operating, under construction, and pre-construction projects. 2Revenues and income includes revenues from the sale of electricity and income from tax benefits.  28  Battery storage portfolio (GWh)  Energy storage portfolio grew by 5.6 GWh   during the quarter  +27   MWh  +1,444 MWh  +848   MWh  +194   MWh 


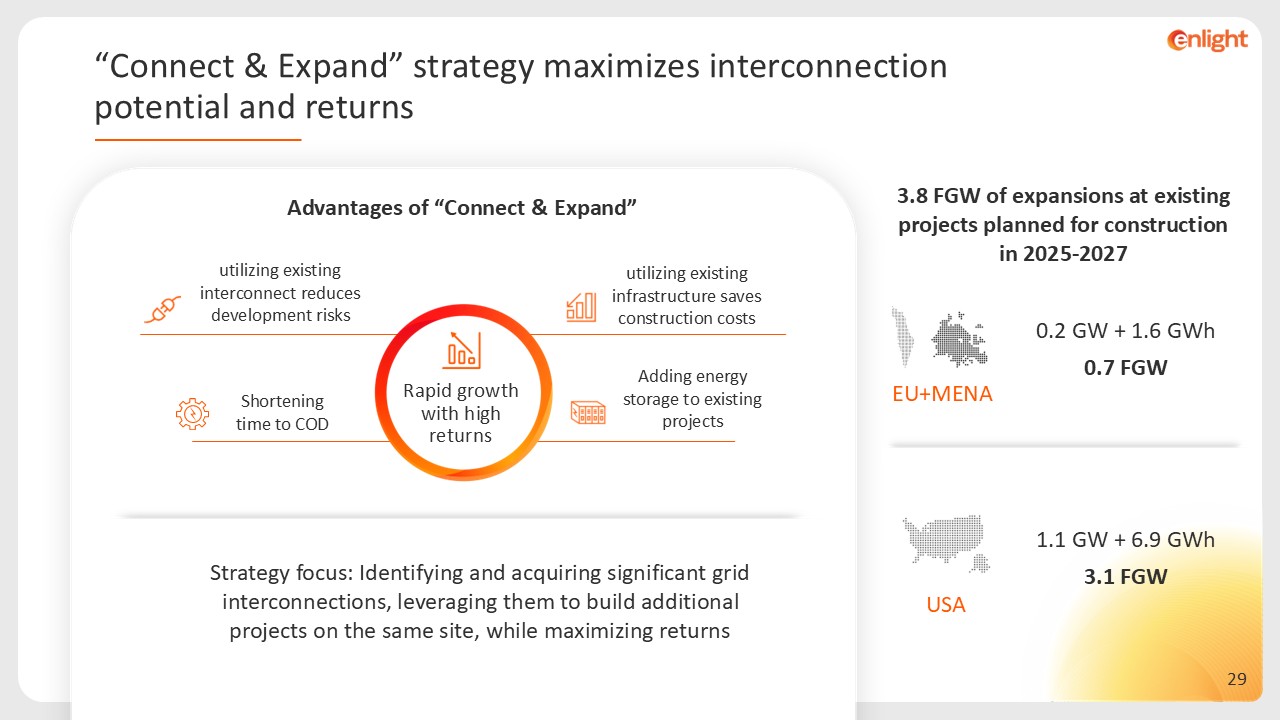
 Advantages of “Connect & Expand”  Shortening time to COD  utilizing existing infrastructure saves construction costs  utilizing existing interconnect reduces development risks  Adding energy storage to existing projects  EU+MENA  1.1 GW + 6.9 GWh  3.1 FGW  USA  0.2 GW + 1.6 GWh  0.7 FGW  Rapid growth with high returns  3.8 FGW of expansions at existing projects planned for construction in 2025-2027  Strategy focus: Identifying and acquiring significant grid interconnections, leveraging them to build additional projects on the same site, while maximizing returns  “Connect & Expand” strategy maximizes interconnection potential and returns 


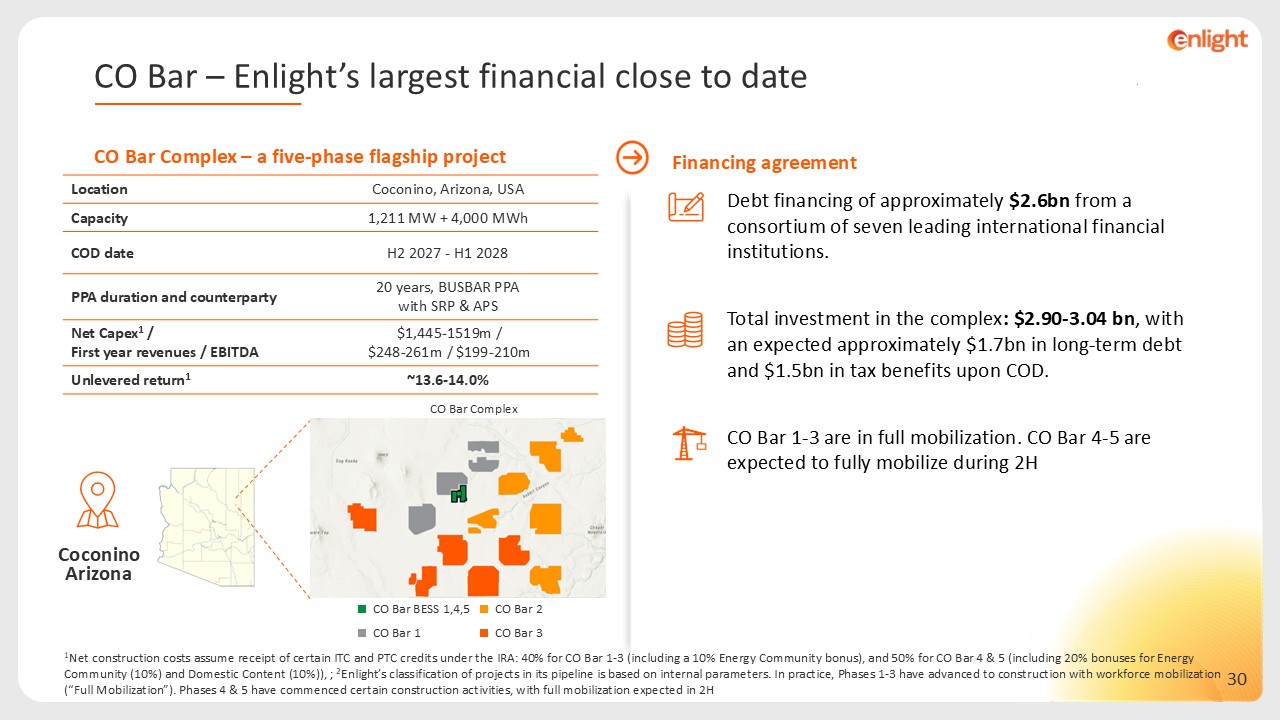
 CO Bar Complex – a five-phase flagship project  Financing agreement   Coconino Arizona  1Net construction costs assume receipt of certain ITC and PTC credits under the IRA: 40% for CO Bar 1-3 (including a 10% Energy Community bonus), and 50% for CO Bar 4 & 5 (including 20% bonuses for Energy Community (10%) and Domestic Content (10%)), ; 2Enlight’s classification of projects in its pipeline is based on internal parameters. In practice, Phases 1-3 have advanced to construction with workforce mobilization (“Full Mobilization”). Phases 4 & 5 have commenced certain construction activities, with full mobilization expected in 2H  Debt financing of approximately $2.6bn from a consortium of seven leading international financial institutions.  Total investment in the complex: $2.90-3.04 bn, with an expected approximately $1.7bn in long-term debt and $1.5bn in tax benefits upon COD.  CO Bar 1-3 are in full mobilization. CO Bar 4-5 are expected to fully mobilize during 2H  CO Bar 2  CO Bar 3  CO Bar BESS 1,4,5  CO Bar 1  CO Bar Complex  Coconino, Arizona, USA  Location  1,211 MW + 4,000 MWh  Capacity   H2 2027 - H1 2028  COD date  20 years, BUSBAR PPA  with SRP & APS  PPA duration and counterparty   $1,445-1519m /   $248-261m / $199-210m  Net Capex1 /   First year revenues / EBITDA  ~13.6-14.0%  Unlevered return1  CO Bar – Enlight’s largest financial close to date 


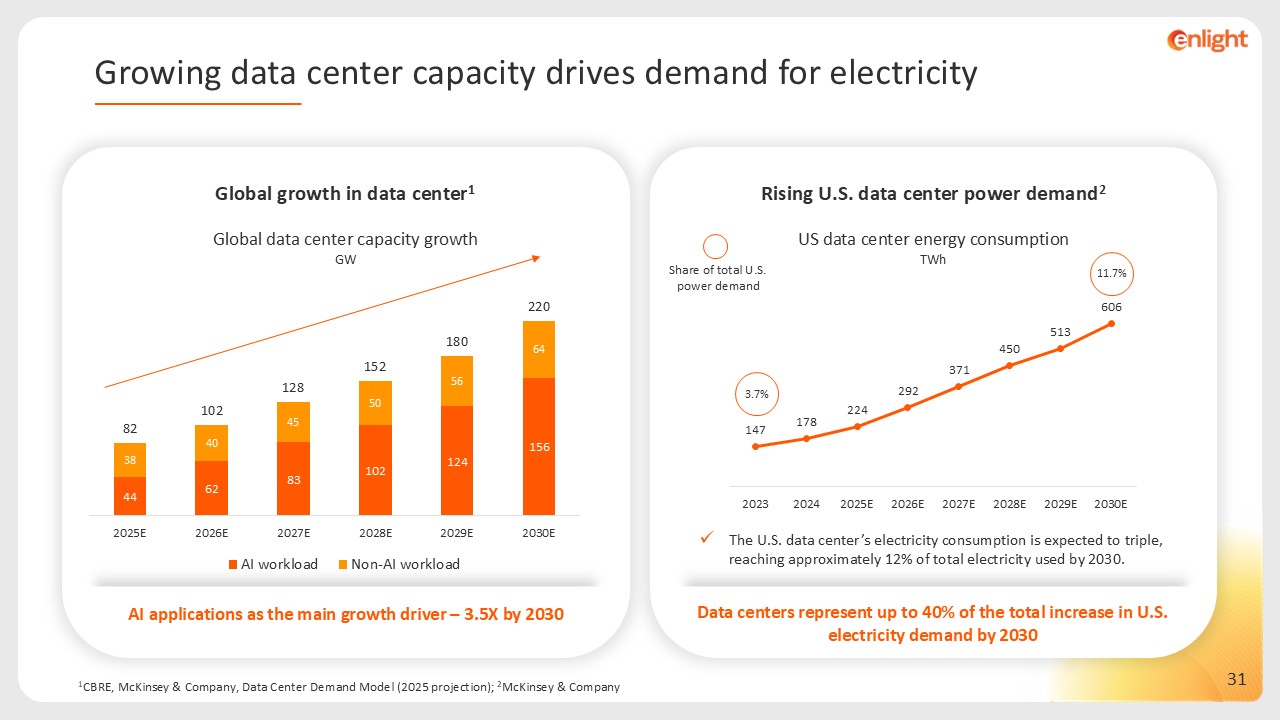
 AI applications as the main growth driver – 3.5X by 2030  Global growth in data center1  Global data center capacity growth  GW  1CBRE, McKinsey & Company, Data Center Demand Model (2025 projection); 2McKinsey & Company  Rising U.S. data center power demand2  The U.S. data center’s electricity consumption is expected to triple, reaching approximately 12% of total electricity used by 2030.  Data centers represent up to 40% of the total increase in U.S. electricity demand by 2030  US data center energy consumption  TWh  Share of total U.S. power demand  3.7%  11.7%  Growing data center capacity drives demand for electricity 


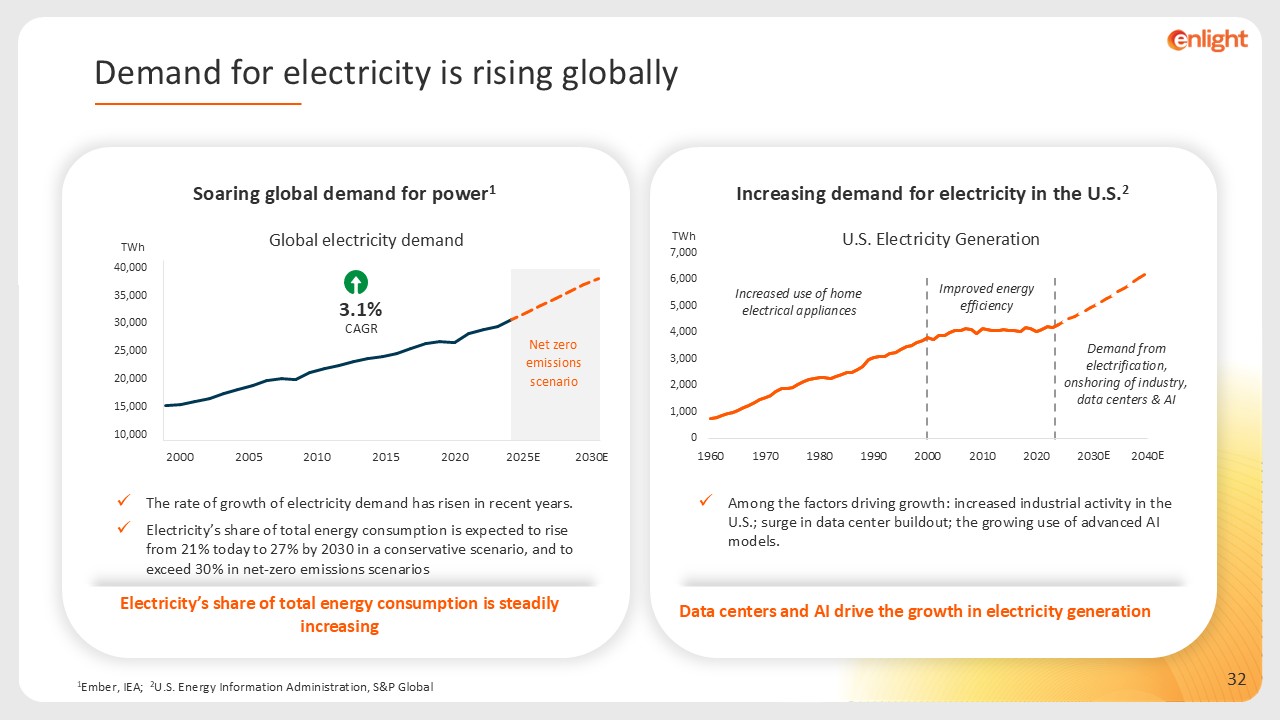
 1Ember, IEA; 2 U.S. Energy Information Administration, S&P Global  Electricity’s share of total energy consumption is steadily increasing  Soaring global demand for power1  The rate of growth of electricity demand has risen in recent years.   Electricity’s share of total energy consumption is expected to rise from 21% today to 27% by 2030 in a conservative scenario, and to exceed 30% in net-zero emissions scenarios  TWh  Net zero emissions scenario  2000  2010  2020  2030E  2005  2015  2025E  3.1%  CAGR   Increasing demand for electricity in the U.S.2  Among the factors driving growth: increased industrial activity in the U.S.; surge in data center buildout; the growing use of advanced AI models.   Data centers and AI drive the growth in electricity generation  U.S. Electricity Generation  TWh  Increased use of home electrical appliances  Improved energy efficiency  Demand from electrification, onshoring of industry, data centers & AI  E  E  Demand for electricity is rising globally 


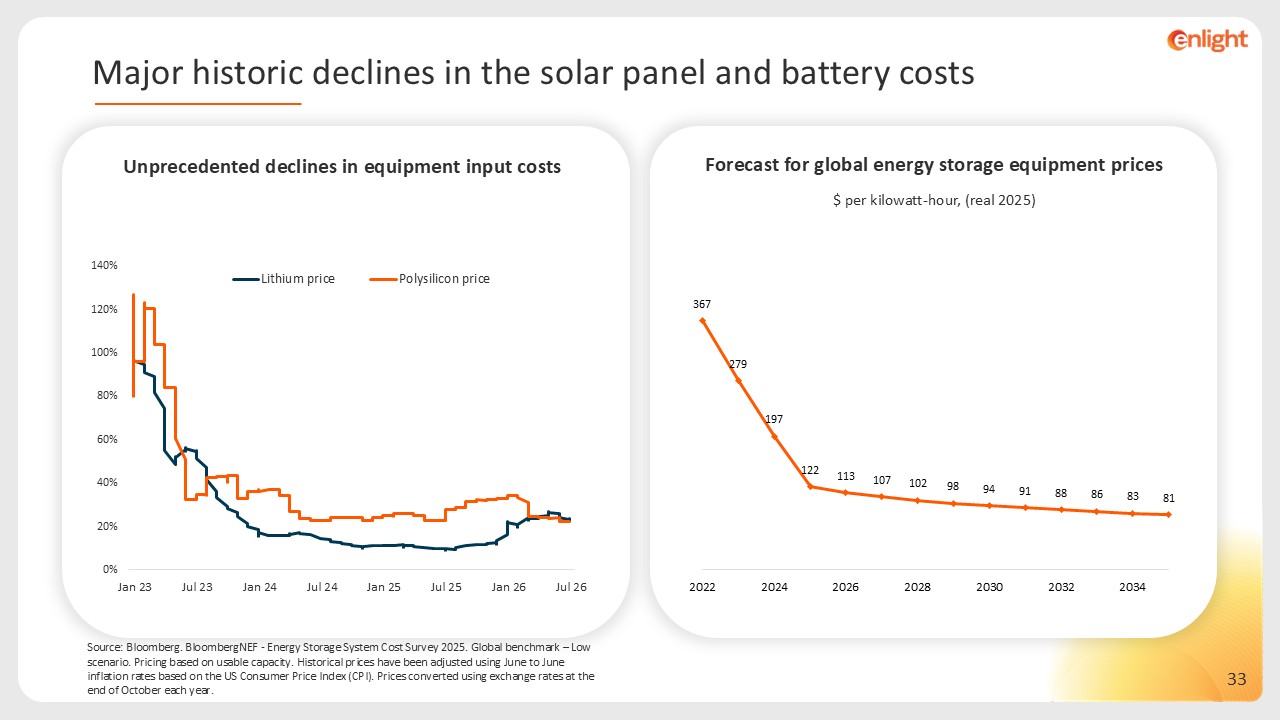
 Source: Bloomberg. BloombergNEF - Energy Storage System Cost Survey 2025. Global benchmark – Low scenario. Pricing based on usable capacity. Historical prices have been adjusted using June to June inflation rates based on the US Consumer Price Index (CPI). Prices converted using exchange rates at the end of October each year.  Unprecedented declines in equipment input costs  Forecast for global energy storage equipment prices  $ per kilowatt-hour, (real 2025)  Major historic declines in the solar panel and battery costs 


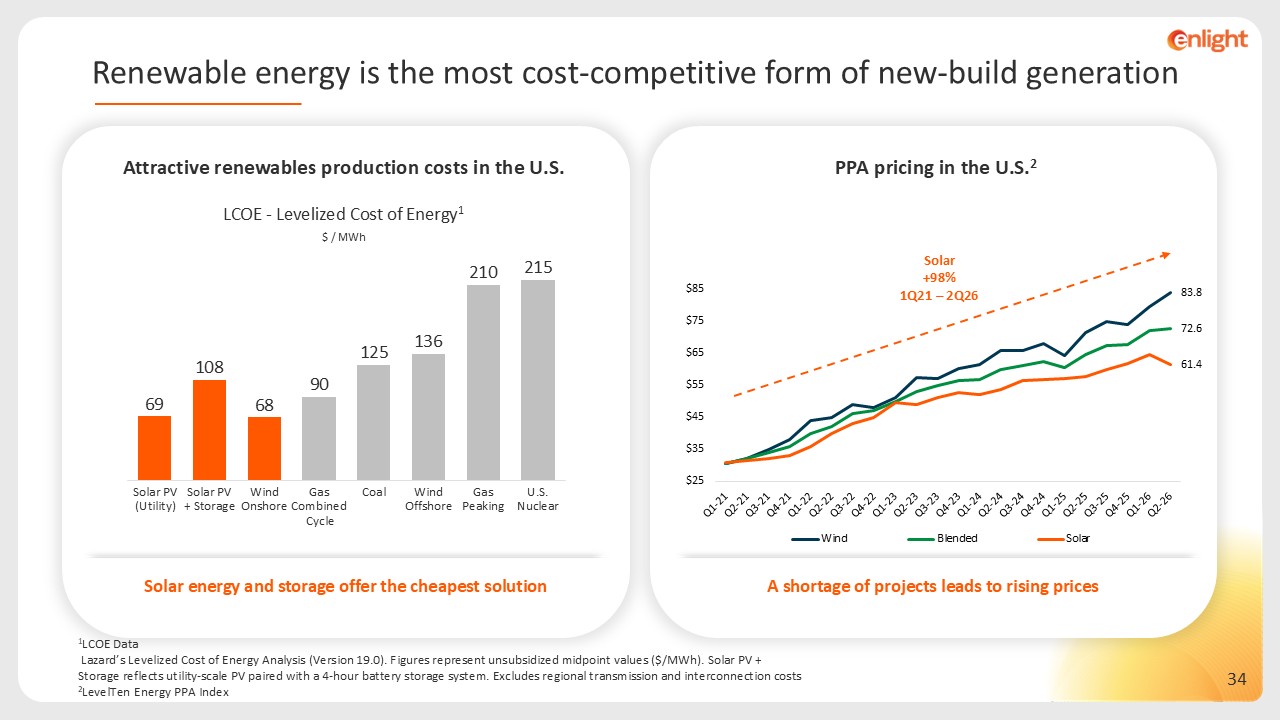
 Renewable energy is the most cost-competitive form of new-build generation  1LCOE Data   Lazard’s Levelized Cost of Energy Analysis (Version 19.0). Figures represent unsubsidized midpoint values ($/MWh). Solar PV + Storage reflects utility-scale PV paired with a 4-hour battery storage system. Excludes regional transmission and interconnection costs2LevelTen Energy PPA Index  PPA pricing in the U.S.2  A shortage of projects leads to rising prices  LCOE - Levelized Cost of Energy1  Attractive renewables production costs in the U.S.  $ / MWh   Solar energy and storage offer the cheapest solution  Solar   +98%1Q21 – 2Q26  Solar PV (Utility)  Solar PV + Storage  Wind Onshore  Gas Combined Cycle  Coal  Wind Offshore  Gas Peaking  U.S. Nuclear 


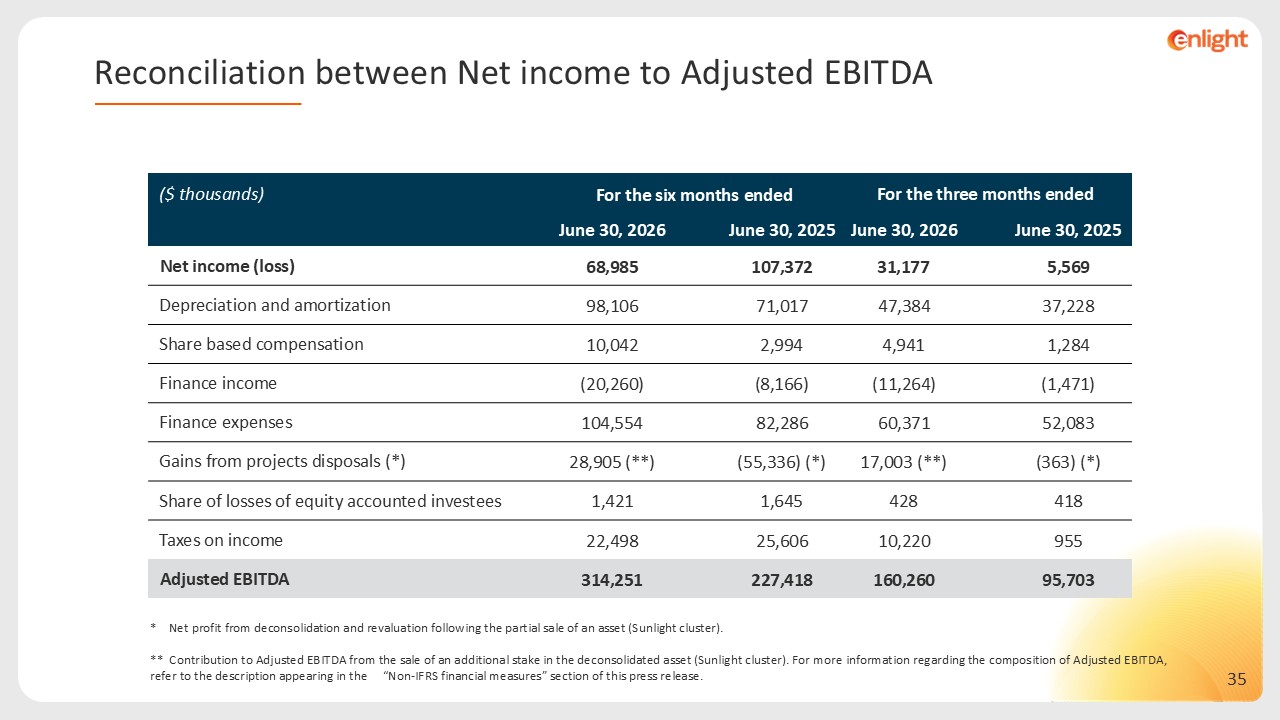
 Reconciliation between Net income to Adjusted EBITDA  * Net profit from deconsolidation and revaluation following the partial sale of an asset (Sunlight cluster).  ** Contribution to Adjusted EBITDA from the sale of an additional stake in the deconsolidated asset (Sunlight cluster). For more information regarding the composition of Adjusted EBITDA, refer to the description appearing in the “Non-IFRS financial measures” section of this press release.  ($ thousands)  For the six months ended  For the three months ended     June 30, 2026  June 30, 2025  June 30, 2026     June 30, 2025  Net income (loss)  68,985     107,372  31,177     5,569  Depreciation and amortization  98,106     71,017  47,384     37,228  Share based compensation  10,042     2,994  4,941     1,284  Finance income   (20,260)     (8,166)  (11,264)     (1,471)  Finance expenses  104,554     82,286  60,371     52,083  Gains from projects disposals (*)  28,905 (**)     (55,336) (*)  17,003 (**)     (363) (*)  Share of losses of equity accounted investees  1,421     1,645  428     418  Taxes on income  22,498     25,606  10,220     955  Adjusted EBITDA  314,251     227,418  160,260     95,703