
1 Helping People Live Healthier and Longer Lives Investor Presentation August 4, 2026 | NYSE American: INFU
2 Forward-Looking Statements / Non-GAAP Measures Forward-Looking Statements Certain statements contained in this presentation are forward-looking statements within the meaning of Section 27A of the Securities Act of 1933, as amended, and Section 21E of the Securities Exchange Act of 1934, as amended, such as statements relating to future actions, our share repurchase program and capital allocation strategy, business plans, strategic partnerships, growth initiatives, objectives and prospects, future operating or financial performance, guidance and expected new business relationships and the terms thereof (including estimated potential revenue under new or existing contracts). The words “believe,” “may,” “will,” “estimate,” “continue,” “anticipate,” “intend,” “should,” “plan,” "goal," “expect,” “strategy,” “future,” “likely,” variations of such words, and other similar expressions, as they relate to the Company, are intended to identify forward-looking statements. Forward-looking statements are subject to factors, risks and uncertainties that could cause actual results to differ materially, including, but not limited to, our ability to successfully execute on our growth initiatives and strategic partnerships, our ability to enter into definitive agreements for the new business relationships on expected terms or at all, our ability to generate estimated potential revenue amounts under new or existing contracts, the uncertain impact of disruptions caused by public health emergencies or extreme weather or other climate change-related events, our dependence on estimates of collectible revenue, potential litigation, changes in third-party reimbursement processes, changes in law, global financial conditions and recessionary risks, rising inflation and interest rates, supply chain disruptions, systemic pressures in the banking sector, including disruptions to credit markets, contributions from acquired businesses or new business lines, products or services and other risk factors disclosed in the Company’s most recent annual report on Form 10-K and, to the extent applicable, quarterly reports on Form 10- Q. Our strategic partnerships are subject to similar factors, risks and uncertainties. All forward- looking statements made in this presentation speak only as of the date hereof. InfuSystem does not undertake any obligation to update any forward-looking statements to reflect future events or circumstances, except as required by law. Non-GAAP Measures This presentation contains information prepared in conformity with GAAP as well as non-GAAP financial information. The Company believes that the non-GAAP financial measures presented in this presentation provide useful information to the Company’s management, investors and other interested parties about the Company’s operating performance because they allow them to understand and compare the Company’s operating results during the current periods to the prior year periods in a more consistent manner. This non-GAAP information should be considered by the reader in addition to, but not instead of, the financial statements prepared in accordance with GAAP, and similarly titled non-GAAP measures may be calculated differently by other companies. The Company calculates those non- GAAP measures by adjusting for non-recurring or non-core items that are not part of the normal course of business and that the Company’s management does not believe will have similar comparable year-over-year items. A reconciliation of those measures to the most directly comparable GAAP measures is provided in Appendix A of this presentation. Investor Presentation l August 4, 2026 l NYSE American: INFU
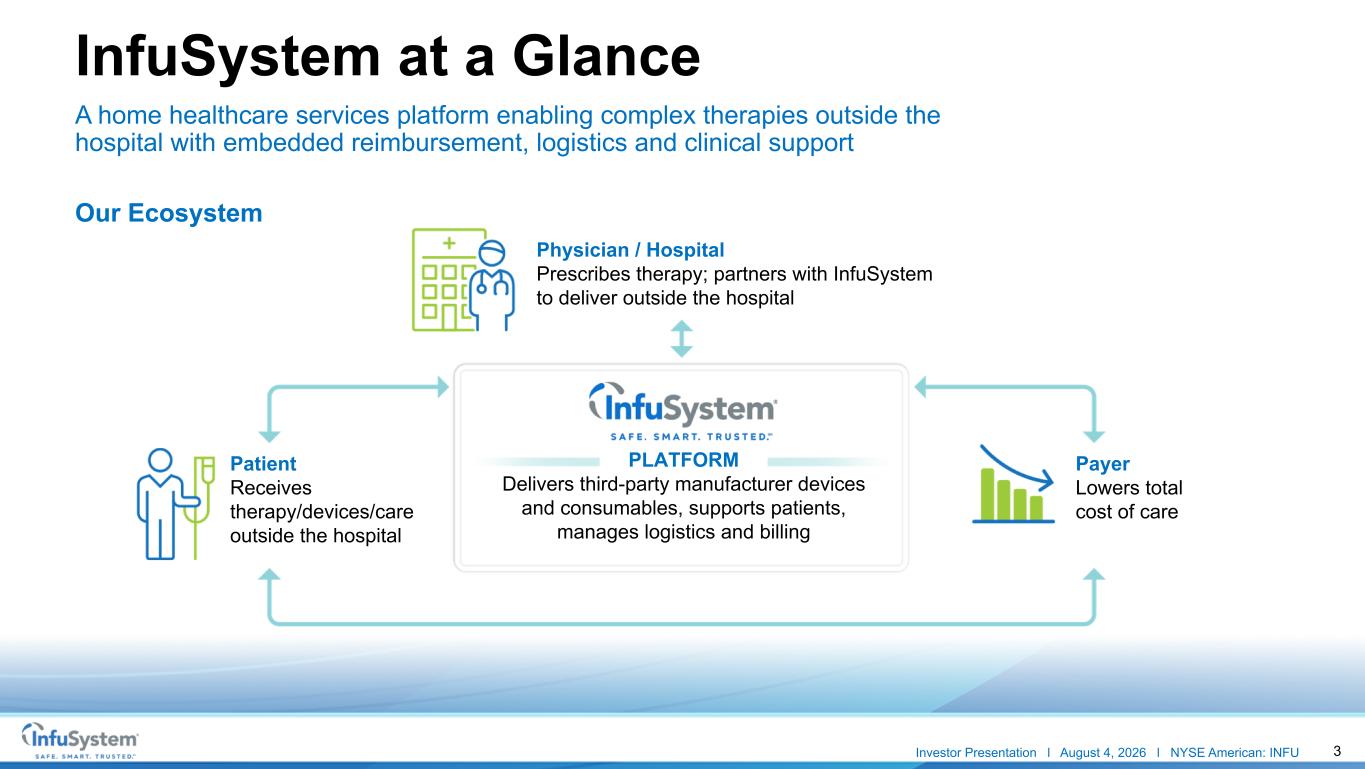
3 InfuSystem at a Glance A home healthcare services platform enabling complex therapies outside the hospital with embedded reimbursement, logistics and clinical support Our Ecosystem Physician / Hospital Prescribes therapy; partners with InfuSystem to deliver outside the hospital Patient Receives therapy/devices/care outside the hospital Payer Lowers total cost of care PLATFORM Delivers third-party manufacturer devices and consumables, supports patients, manages logistics and billing Investor Presentation l August 4, 2026 l NYSE American: INFU
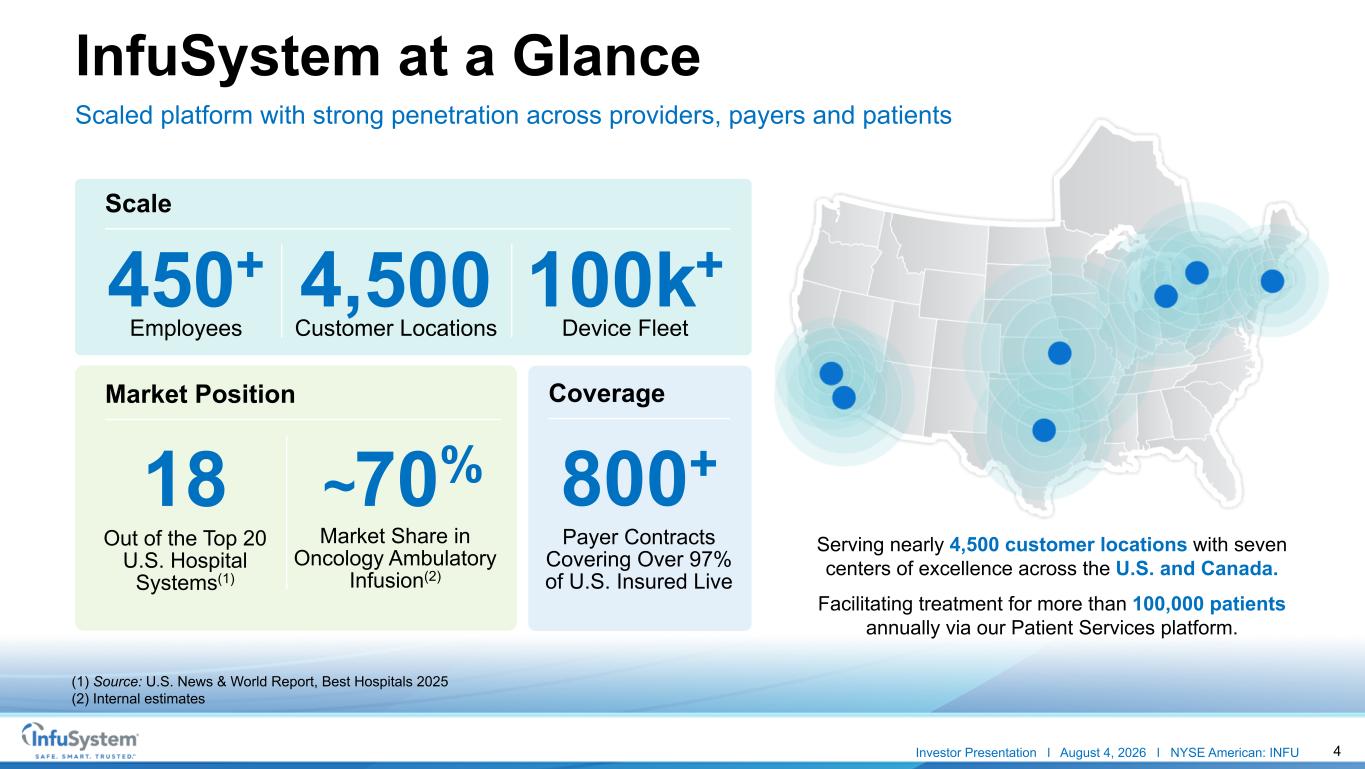
4 InfuSystem at a Glance Scaled platform with strong penetration across providers, payers and patients Serving nearly 4,500 customer locations with seven centers of excellence across the U.S. and Canada. Facilitating treatment for more than 100,000 patients annually via our Patient Services platform. 450+ Employees 4,500 Customer Locations 100k+ Device Fleet Scale Out of the Top 20 U.S. Hospital Systems(1) Market Share in Oncology Ambulatory Infusion(2) Payer Contracts Covering Over 97% of U.S. Insured Live Market Position Coverage (1) Source: U.S. News & World Report, Best Hospitals 2025 (2) Internal estimates 18 ~70% 800+ Investor Presentation l August 4, 2026 l NYSE American: INFU
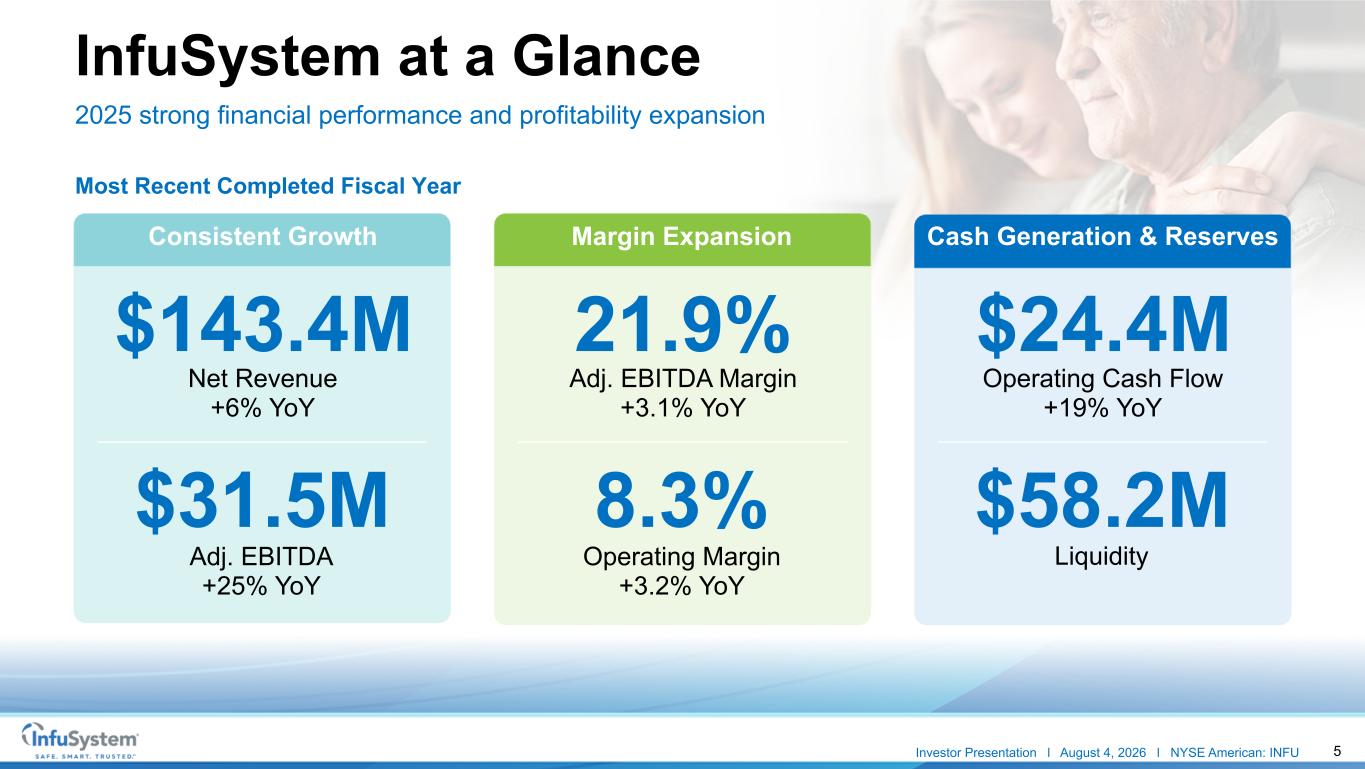
5 InfuSystem at a Glance 2025 strong financial performance and profitability expansion Consistent Growth Margin Expansion Cash Generation & Reserves Net Revenue +6% YoY Adj. EBITDA +25% YoY Adj. EBITDA Margin +3.1% YoY Operating Margin +3.2% YoY Operating Cash Flow +19% YoY Liquidity Most Recent Completed Fiscal Year $143.4M $31.5M 21.9% 8.3% $24.4M $58.2M Investor Presentation l August 4, 2026 l NYSE American: INFU
6 1. Scalable Platform With Multiple Growth Vectors • Seven consecutive years of record revenue (11% CAGR) • Capital-efficient expansion into adjacent therapies • $58.2M liquidity supports growth and selective tuck-in acquisitions 2. Meaningful Margin Expansion Underway • Infrastructure investments complete • Growth mix shifting toward less capital-intensive opportunities • Adjusted EBITDA margin of 21.9% for FY 2025 • Long-term target: 22%-25% 3. High-Quality, De-Risked Revenue Profile • No customer represents more than 10% of total revenue • Medicare exposure is below 10%, well below typical DME peers • Multi-year payer contracts provide revenue visibility and predictability 4. Durable, Hard-to-Replicate Competitive Moats • ~70%+ market share in outpatient oncology ambulatory infusion • 800+ payer contracts covering more than 97% of U.S. insured lives • Deep relationships with 1,800+ oncology practices and 18 of the top 20 U.S. hospital systems Why InfuSystem Today: Key Investor Considerations Investor Presentation l August 4, 2026 l NYSE American: INFU
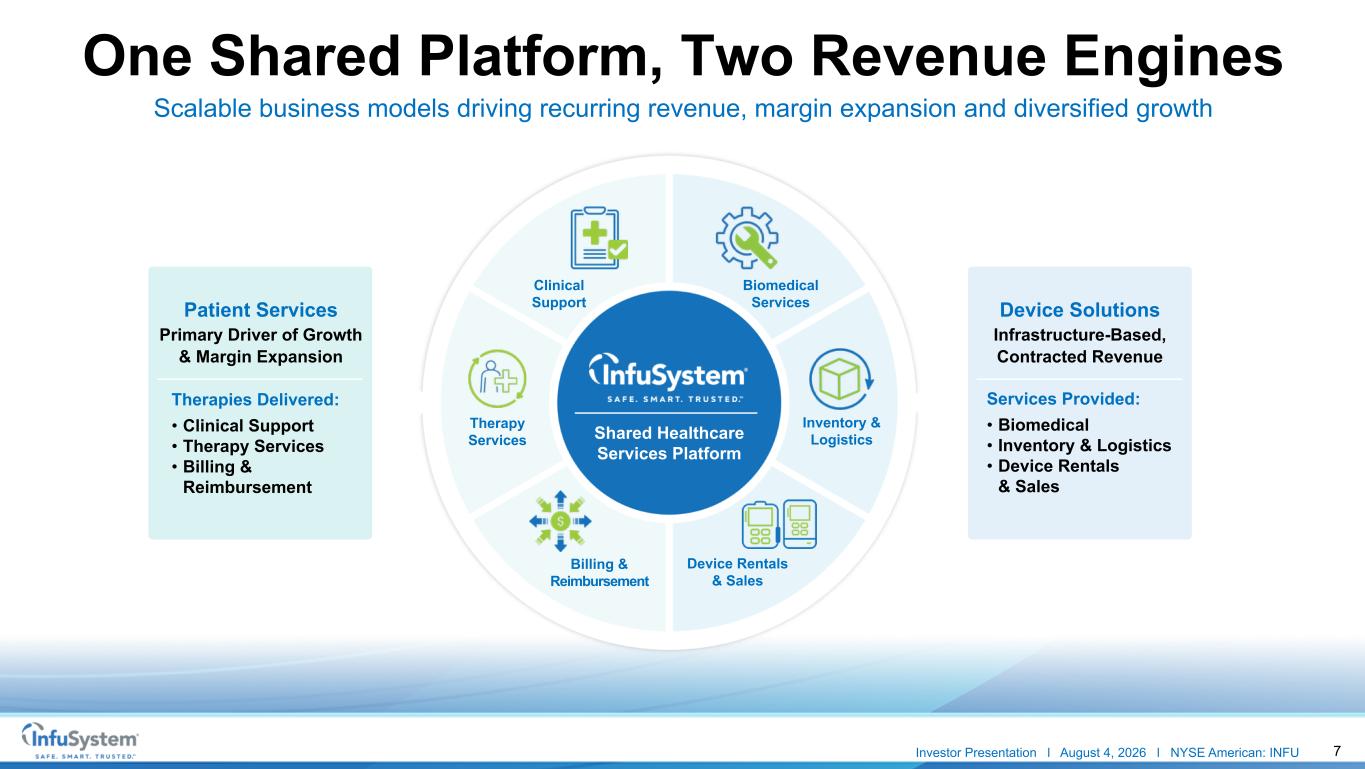
7 Device Solutions Infrastructure-Based, Contracted Revenue One Shared Platform, Two Revenue Engines Scalable business models driving recurring revenue, margin expansion and diversified growth Clinical Support Billing & Reimbursement Device Rentals & Sales Inventory & Logistics Therapy Services Shared Healthcare Services Platform Patient Services Primary Driver of Growth & Margin Expansion • Clinical Support • Therapy Services • Billing & Reimbursement Therapies Delivered: • Biomedical • Inventory & Logistics • Device Rentals & Sales Services Provided: Biomedical Services Investor Presentation l August 4, 2026 l NYSE American: INFU
8 Revenue Platform Economics Differentiated revenue models support growth, recurring revenue and profitability Patient Services (~60% of revenue, $86M+) Primary driver of growth and margin expansion • Insurance-reimbursed therapy programs • ~$200–$4,000 revenue per patient per month • Recurring treatment cycles for the majority of patients • Expansion into new therapies Device Solutions (~40% of revenue, $56M+) Contracted, infrastructure-based revenue with high visibility • Equipment rentals, services and direct-to-facility contracts • Multi-year agreements with recurring revenue components • Ongoing equipment management across health systems • Expansion of biomedical services and device management Strategic Synergy • Diversified revenue streams with complementary growth drivers Ability to expand services within existing customer relationships • Increasing scale supports margin expansion Investor Presentation l August 4, 2026 l NYSE American: INFU
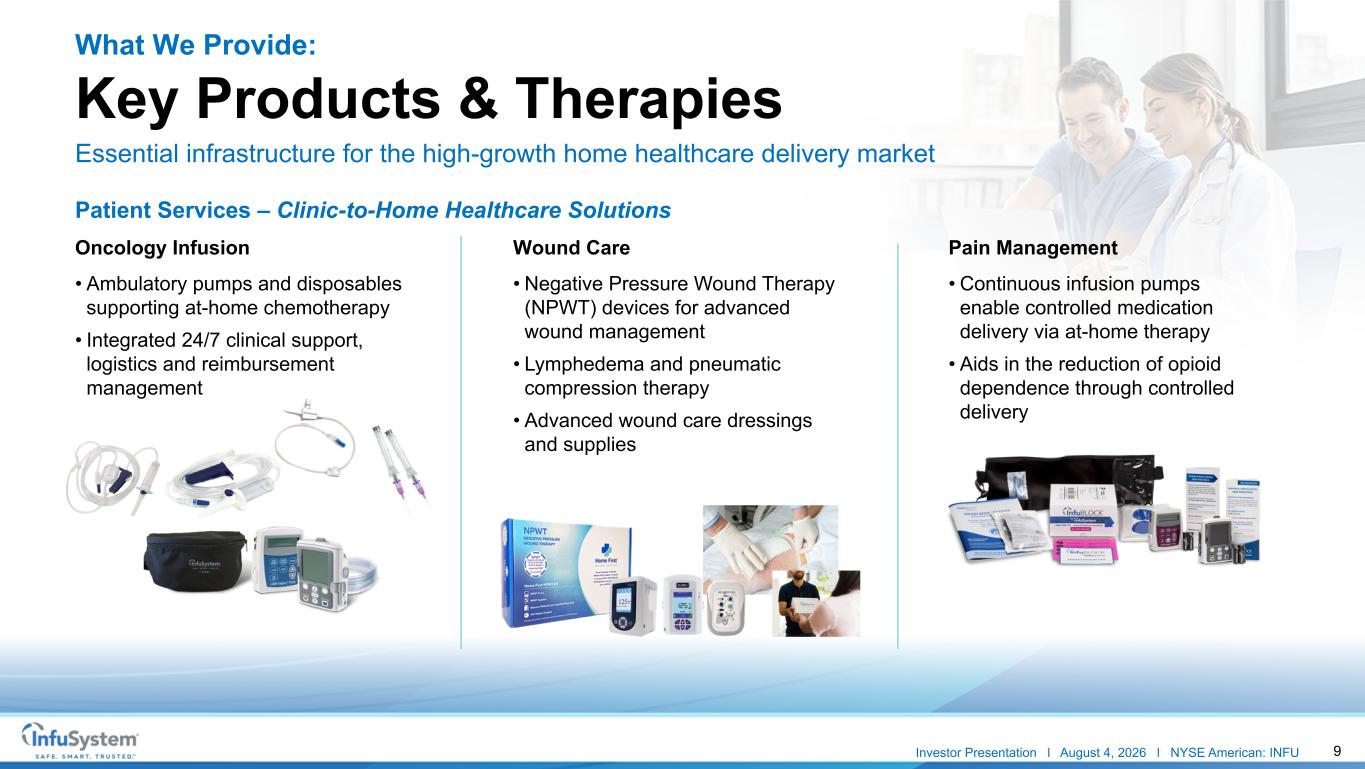
9 Oncology Infusion • Ambulatory pumps and disposables supporting at-home chemotherapy • Integrated 24/7 clinical support, logistics and reimbursement management Wound Care • Negative Pressure Wound Therapy (NPWT) devices for advanced wound management • Lymphedema and pneumatic compression therapy • Advanced wound care dressings and supplies Pain Management • Continuous infusion pumps enable controlled medication delivery via at-home therapy • Aids in the reduction of opioid dependence through controlled delivery What We Provide: Key Products & Therapies Patient Services – Clinic-to-Home Healthcare Solutions Essential infrastructure for the high-growth home healthcare delivery market Investor Presentation l August 4, 2026 l NYSE American: INFU
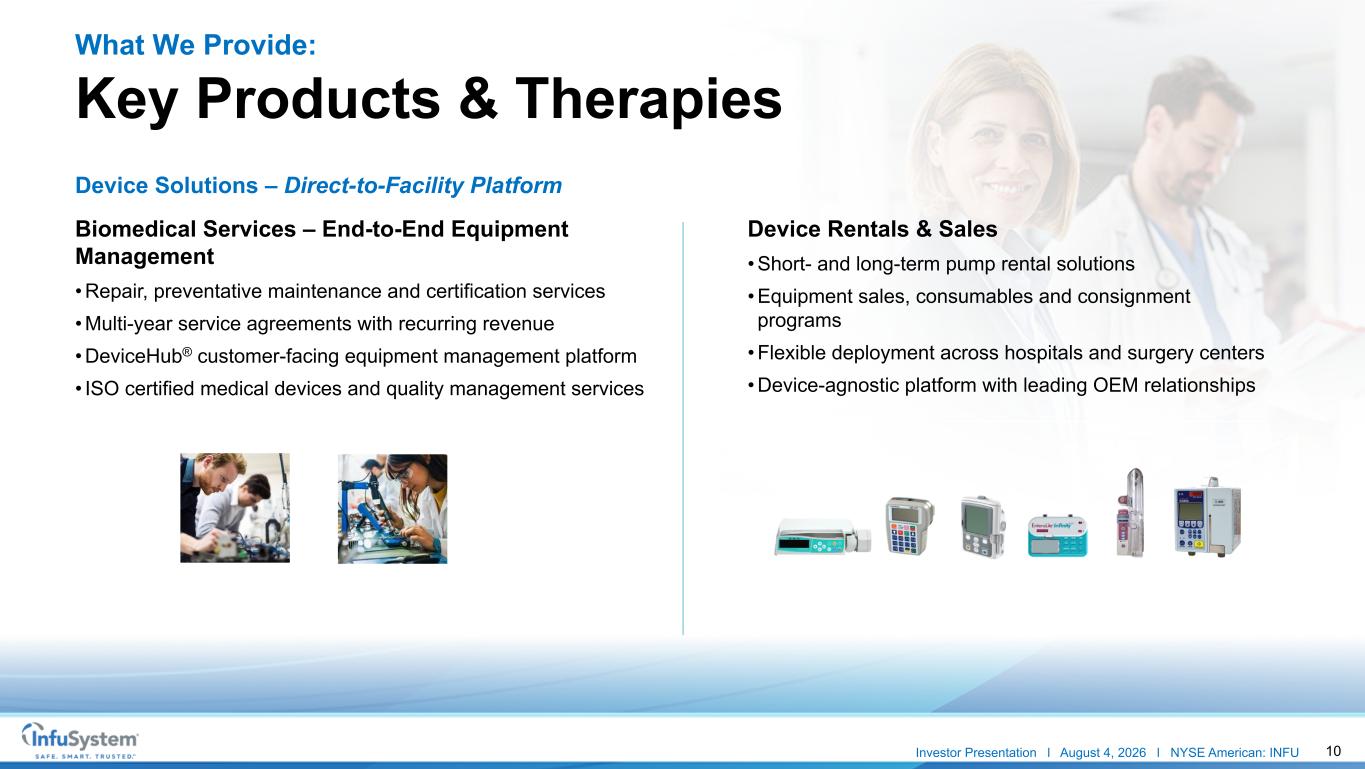
10 What We Provide: Key Products & Therapies Device Solutions – Direct-to-Facility Platform Biomedical Services – End-to-End Equipment Management • Repair, preventative maintenance and certification services • Multi-year service agreements with recurring revenue • DeviceHub® customer-facing equipment management platform • ISO certified medical devices and quality management services Device Rentals & Sales • Short- and long-term pump rental solutions • Equipment sales, consumables and consignment programs • Flexible deployment across hospitals and surgery centers • Device-agnostic platform with leading OEM relationships Investor Presentation l August 4, 2026 l NYSE American: INFU
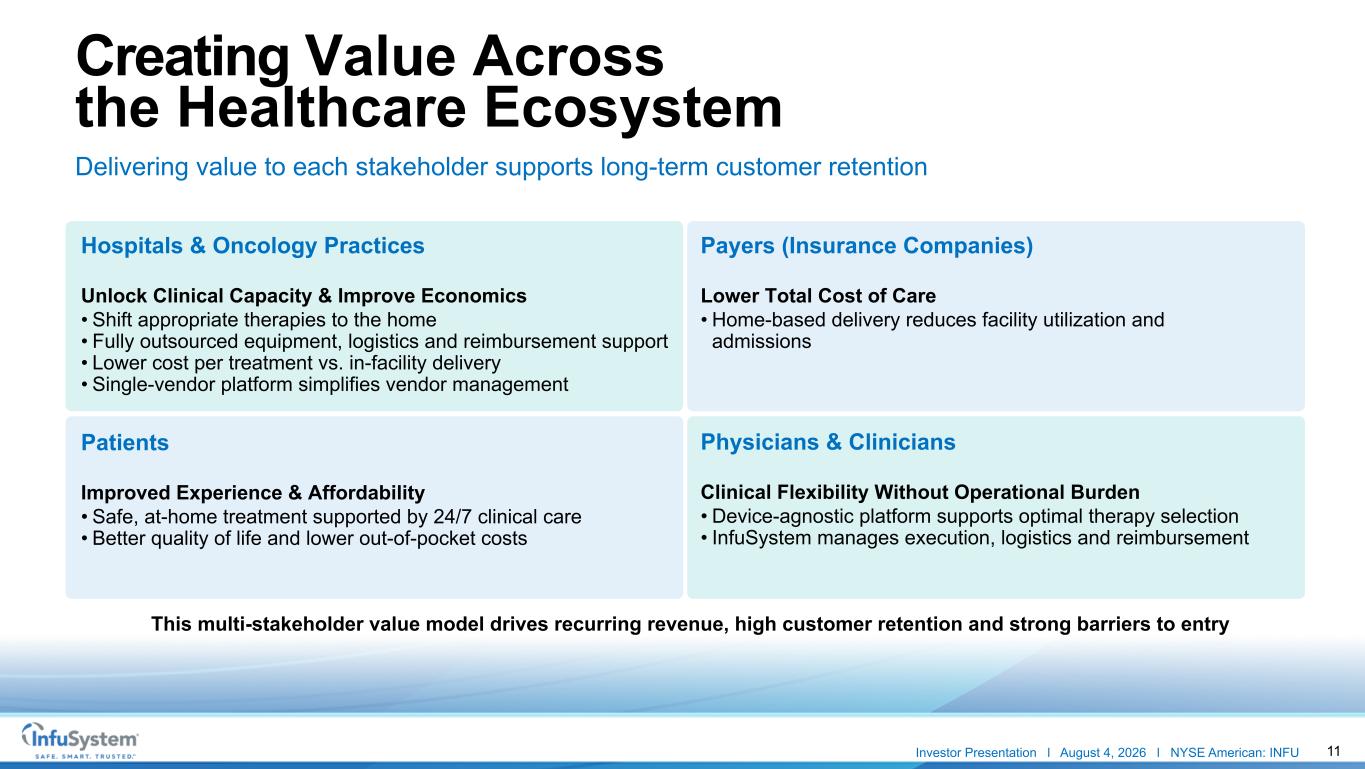
11 Creating Value Across the Healthcare Ecosystem Delivering value to each stakeholder supports long-term customer retention Hospitals & Oncology Practices Unlock Clinical Capacity & Improve Economics • Shift appropriate therapies to the home • Fully outsourced equipment, logistics and reimbursement support • Lower cost per treatment vs. in-facility delivery • Single-vendor platform simplifies vendor management Patients Improved Experience & Affordability • Safe, at-home treatment supported by 24/7 clinical care • Better quality of life and lower out-of-pocket costs This multi-stakeholder value model drives recurring revenue, high customer retention and strong barriers to entry Payers (Insurance Companies) Lower Total Cost of Care • Home-based delivery reduces facility utilization and admissions Physicians & Clinicians Clinical Flexibility Without Operational Burden • Device-agnostic platform supports optimal therapy selection • InfuSystem manages execution, logistics and reimbursement Investor Presentation l August 4, 2026 l NYSE American: INFU
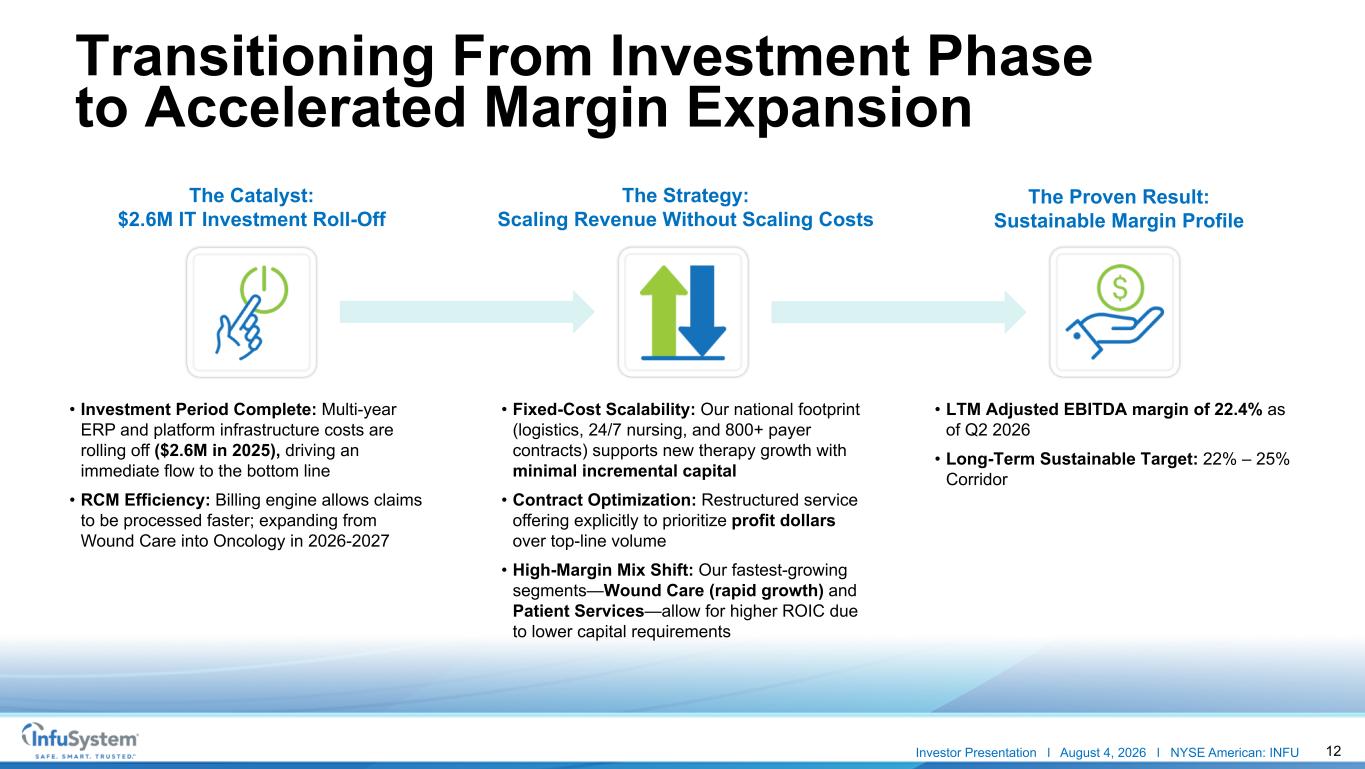
12 Transitioning From Investment Phase to Accelerated Margin Expansion The Catalyst: $2.6M IT Investment Roll-Off • Investment Period Complete: Multi-year ERP and platform infrastructure costs are rolling off ($2.6M in 2025), driving an immediate flow to the bottom line • RCM Efficiency: Billing engine allows claims to be processed faster; expanding from Wound Care into Oncology in 2026-2027 The Strategy: Scaling Revenue Without Scaling Costs • Fixed-Cost Scalability: Our national footprint (logistics, 24/7 nursing, and 800+ payer contracts) supports new therapy growth with minimal incremental capital • Contract Optimization: Restructured service offering explicitly to prioritize profit dollars over top-line volume • High-Margin Mix Shift: Our fastest-growing segments—Wound Care (rapid growth) and Patient Services—allow for higher ROIC due to lower capital requirements The Proven Result: Sustainable Margin Profile • LTM Adjusted EBITDA margin of 22.4% as of Q2 2026 • Long-Term Sustainable Target: 22% – 25% Corridor Investor Presentation l August 4, 2026 l NYSE American: INFU
13 Wound Care: Established & Scaling • Expanded into NPWT, lymphedema therapy, pneumatic compression devices and advanced wound care products • Wound Care treatment revenue grew 103% year over year in 2025 • Demonstrates successful expansion into a new therapy category Selective Tuck-In Acquisitions & Large-Scale Validation • Expanded capabilities in biomedical services, equipment management and distribution • Strengthened the Device Solutions platform through targeted acquisitions • Demonstrated ability to integrate and scale acquired businesses Validation: Proven Expansion Beyond Oncology Pain Management: Extension of Core Capabilities • Expanded ambulatory pump platform into pain management therapies • Builds on existing clinical, logistics and reimbursement capabilities • Supports home-based treatment delivery Repeatable Platform Expansion Model • New therapies added without incremental investment • Shared logistics, billing and clinical support enable efficient scaling • Existing customer relationships accelerate adoption Investor Presentation l August 4, 2026 l NYSE American: INFU
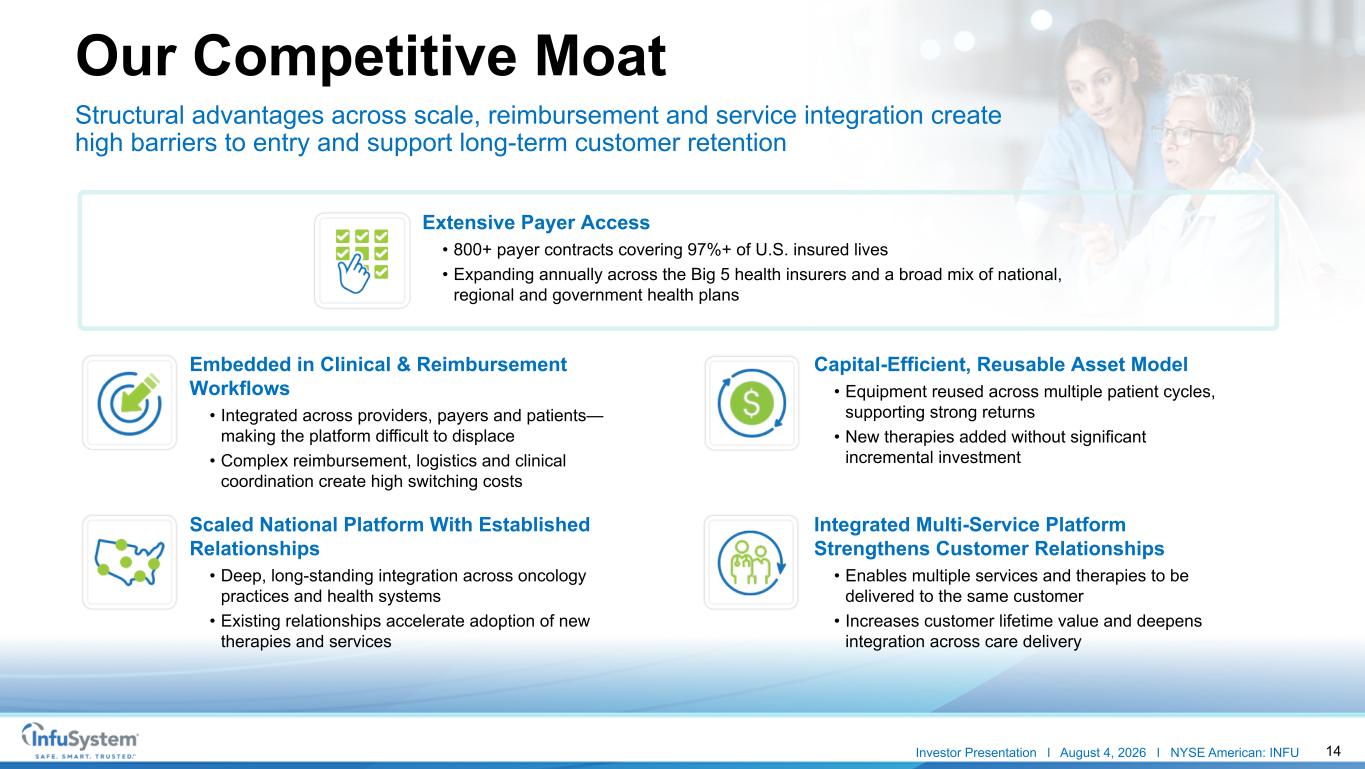
14 Our Competitive Moat Structural advantages across scale, reimbursement and service integration create high barriers to entry and support long-term customer retention Embedded in Clinical & Reimbursement Workflows • Integrated across providers, payers and patients— making the platform difficult to displace • Complex reimbursement, logistics and clinical coordination create high switching costs Capital-Efficient, Reusable Asset Model • Equipment reused across multiple patient cycles, supporting strong returns • New therapies added without significant incremental investment Scaled National Platform With Established Relationships • Deep, long-standing integration across oncology practices and health systems • Existing relationships accelerate adoption of new therapies and services Integrated Multi-Service Platform Strengthens Customer Relationships • Enables multiple services and therapies to be delivered to the same customer • Increases customer lifetime value and deepens integration across care delivery Embedded in Clinical and Reimbursement Workflows • Integrated across providers, payer and patients—making the platform difficult to displace • Complex reimbursement, logistics and clinical coordination create high switching costs Scaled National Platform With Established Relationships • Deep, long-standing integration across oncology practices and health systems • Existing relationships accelerate adoption of new therapies and services Extensive Payer Access • 800+ payer contracts covering 97%+ of U.S. insured lives • Expanding annually across the Big 5 health insurers and a broad mix of national, regional and government health plans Investor Presentation l August 4, 2026 l NYSE American: INFU
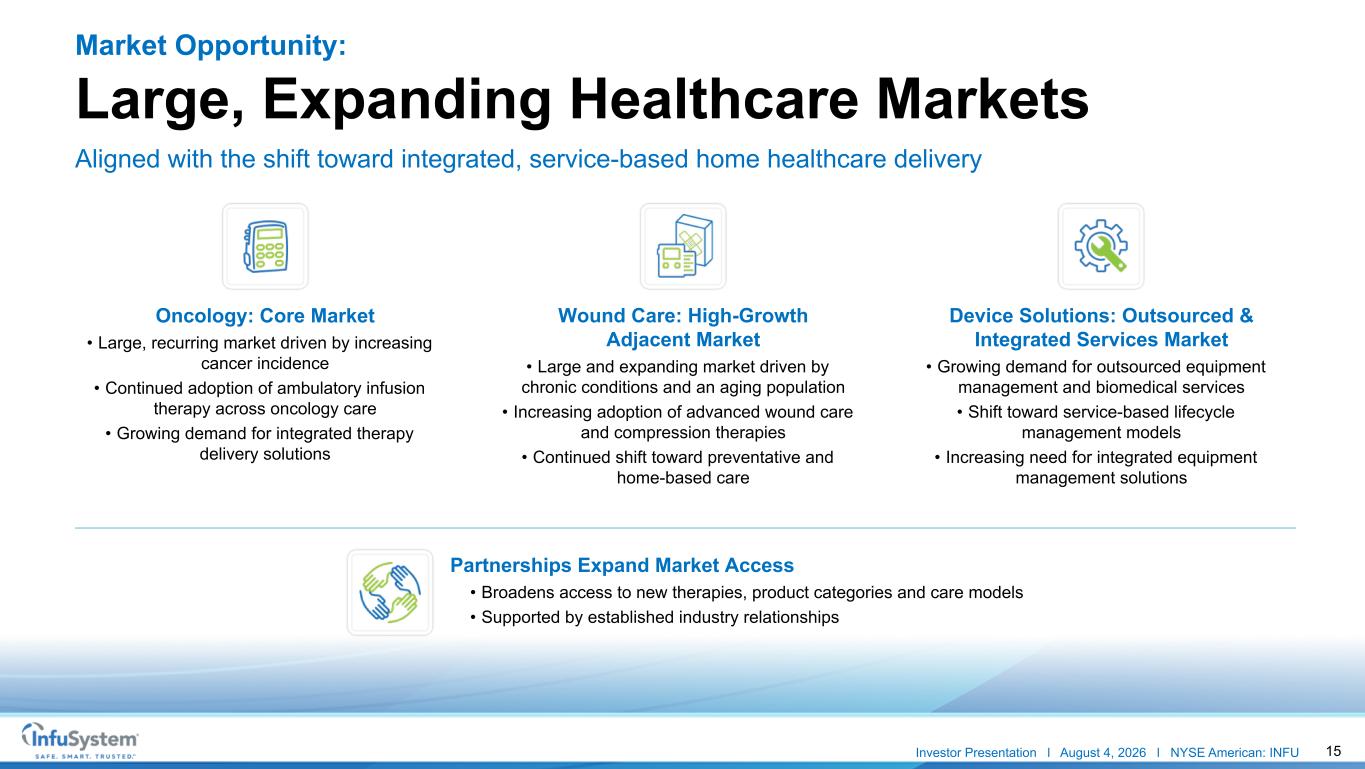
15 Oncology: Core Market • Large, recurring market driven by increasing cancer incidence • Continued adoption of ambulatory infusion therapy across oncology care • Growing demand for integrated therapy delivery solutions Aligned with the shift toward integrated, service-based home healthcare delivery Market Opportunity: Large, Expanding Healthcare Markets Wound Care: High-Growth Adjacent Market • Large and expanding market driven by chronic conditions and an aging population • Increasing adoption of advanced wound care and compression therapies • Continued shift toward preventative and home-based care Device Solutions: Outsourced & Integrated Services Market • Growing demand for outsourced equipment management and biomedical services • Shift toward service-based lifecycle management models • Increasing need for integrated equipment management solutions Partnerships Expand Market Access • Broadens access to new therapies, product categories and care models • Supported by established industry relationships Investor Presentation l August 4, 2026 l NYSE American: INFU
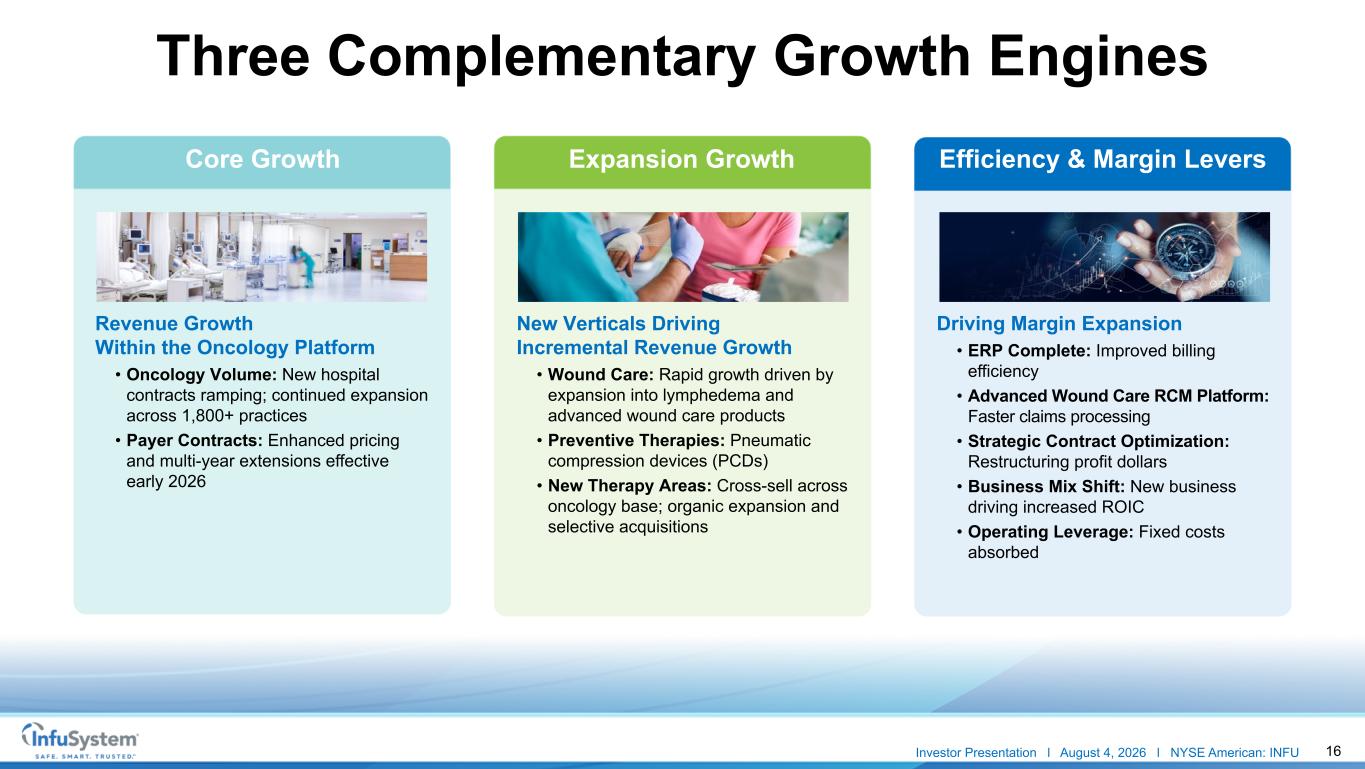
16 Revenue Growth Within the Oncology Platform • Oncology Volume: New hospital contracts ramping; continued expansion across 1,800+ practices • Payer Contracts: Enhanced pricing and multi-year extensions effective early 2026 Three Complementary Growth Engines Core Growth Expansion Growth Efficiency & Margin Levers New Verticals Driving Incremental Revenue Growth • Wound Care: Rapid growth driven by expansion into lymphedema and advanced wound care products • Preventive Therapies: Pneumatic compression devices (PCDs) • New Therapy Areas: Cross-sell across oncology base; organic expansion and selective acquisitions Driving Margin Expansion • ERP Complete: Improved billing efficiency • Advanced Wound Care RCM Platform: Faster claims processing • Strategic Contract Optimization: Restructuring profit dollars • Business Mix Shift: New business driving increased ROIC • Operating Leverage: Fixed costs absorbed Investor Presentation l August 4, 2026 l NYSE American: INFU
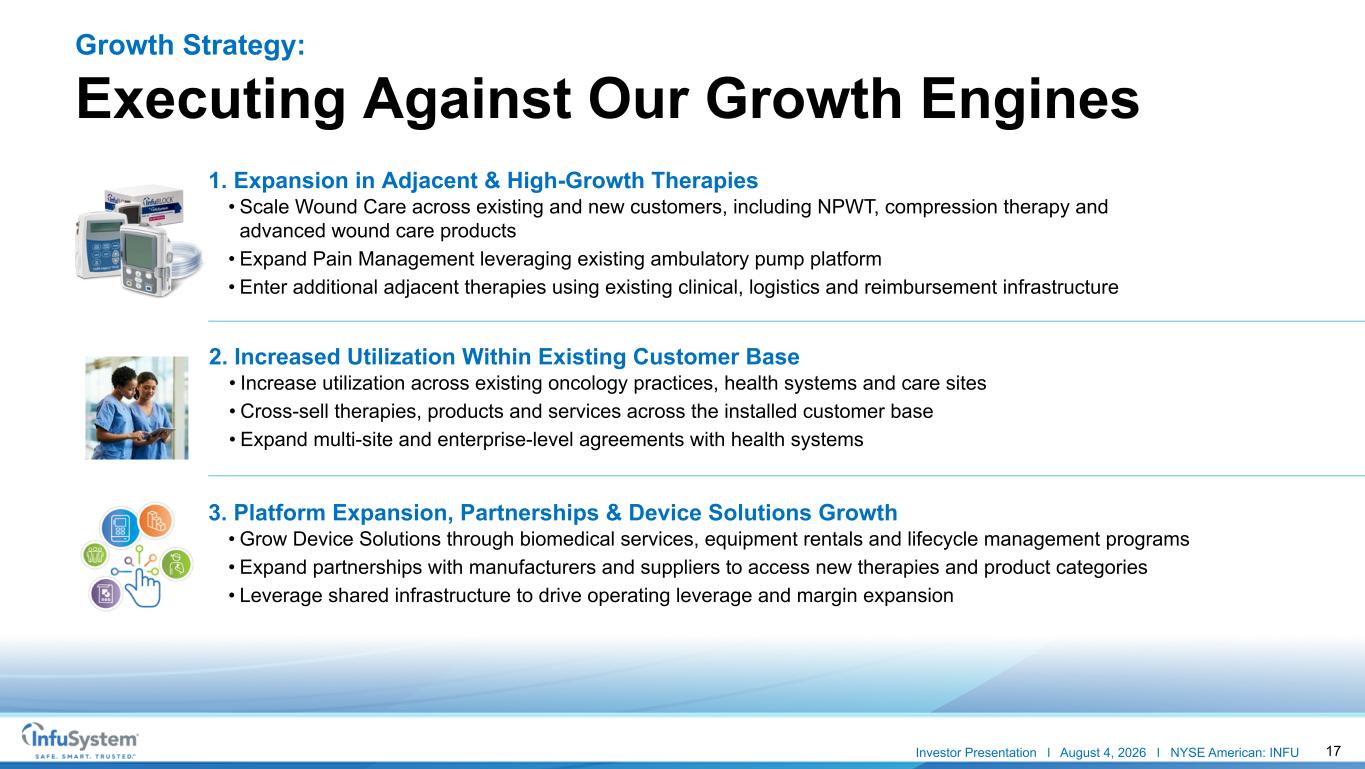
17 Growth Strategy: Executing Against Our Growth Engines 1. Expansion in Adjacent & High-Growth Therapies • Scale Wound Care across existing and new customers, including NPWT, compression therapy and advanced wound care products • Expand Pain Management leveraging existing ambulatory pump platform • Enter additional adjacent therapies using existing clinical, logistics and reimbursement infrastructure 2. Increased Utilization Within Existing Customer Base • Increase utilization across existing oncology practices, health systems and care sites • Cross-sell therapies, products and services across the installed customer base • Expand multi-site and enterprise-level agreements with health systems 3. Platform Expansion, Partnerships & Device Solutions Growth • Grow Device Solutions through biomedical services, equipment rentals and lifecycle management programs • Expand partnerships with manufacturers and suppliers to access new therapies and product categories • Leverage shared infrastructure to drive operating leverage and margin expansion Investor Presentation l August 4, 2026 l NYSE American: INFU
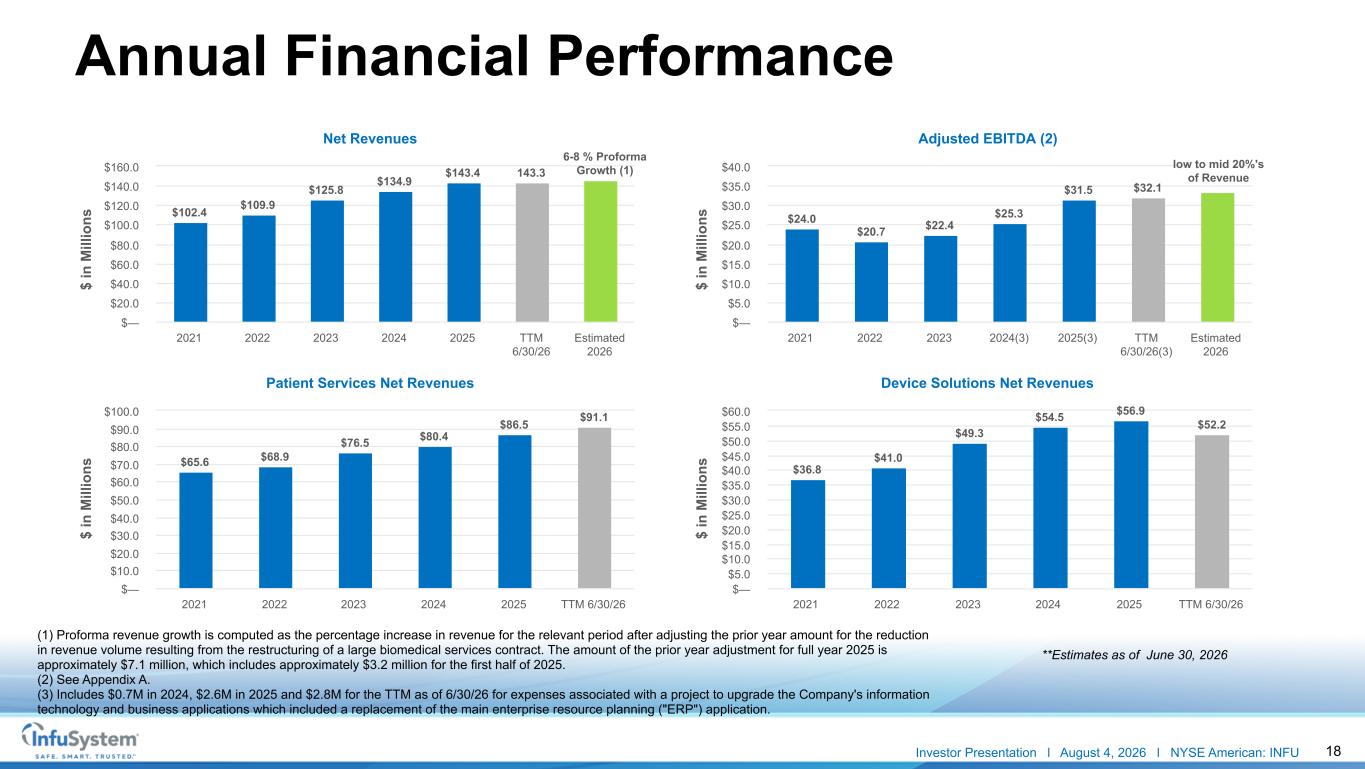
18 $ in M ill io ns $ in M ill io ns Net Revenues $102.4 $109.9 $125.8 $134.9 $143.4 143.3 2021 2022 2023 2024 2025 TTM 6/30/26 Estimated 2026 $— $20.0 $40.0 $60.0 $80.0 $100.0 $120.0 $140.0 $160.0 Adjusted EBITDA (2) $24.0 $20.7 $22.4 $25.3 $31.5 $32.1 2021 2022 2023 2024(3) 2025(3) TTM 6/30/26(3) Estimated 2026 $— $5.0 $10.0 $15.0 $20.0 $25.0 $30.0 $35.0 $40.0 Patient Services Net Revenues $65.6 $68.9 $76.5 $80.4 $86.5 $91.1 2021 2022 2023 2024 2025 TTM 6/30/26 $— $10.0 $20.0 $30.0 $40.0 $50.0 $60.0 $70.0 $80.0 $90.0 $100.0 Device Solutions Net Revenues $36.8 $41.0 $49.3 $54.5 $56.9 $52.2 2021 2022 2023 2024 2025 TTM 6/30/26 $— $5.0 $10.0 $15.0 $20.0 $25.0 $30.0 $35.0 $40.0 $45.0 $50.0 $55.0 $60.0 (1) Proforma revenue growth is computed as the percentage increase in revenue for the relevant period after adjusting the prior year amount for the reduction in revenue volume resulting from the restructuring of a large biomedical services contract. The amount of the prior year adjustment for full year 2025 is approximately $7.1 million, which includes approximately $3.2 million for the first half of 2025. (2) See Appendix A. (3) Includes $0.7M in 2024, $2.6M in 2025 and $2.8M for the TTM as of 6/30/26 for expenses associated with a project to upgrade the Company's information technology and business applications which included a replacement of the main enterprise resource planning ("ERP") application. $ in M ill io ns $ in M ill io ns **Estimates as of June 30, 2026 6-8 % Proforma Growth (1) low to mid 20%'s of Revenue Annual Financial Performance Investor Presentation l August 4, 2026 l NYSE American: INFU
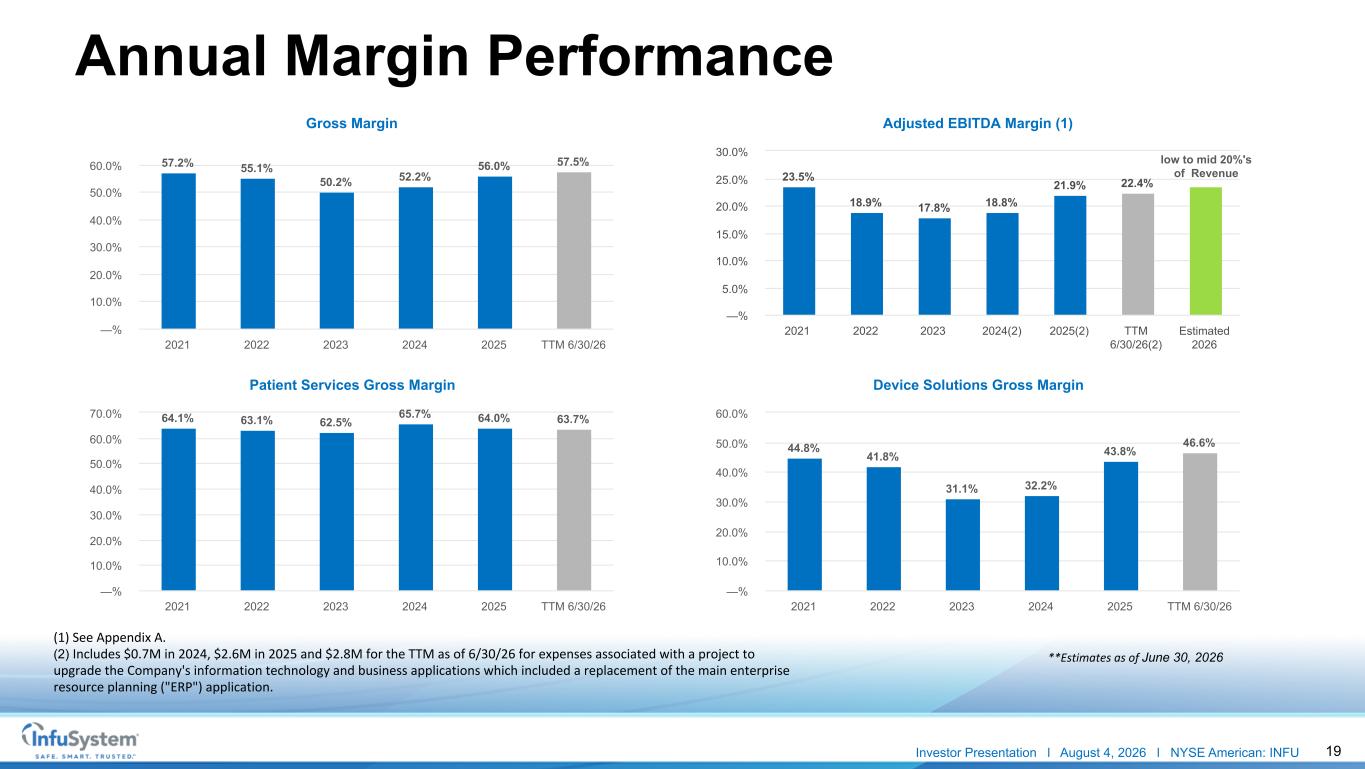
19 Gross Margin 57.2% 55.1% 50.2% 52.2% 56.0% 57.5% 2021 2022 2023 2024 2025 TTM 6/30/26 —% 10.0% 20.0% 30.0% 40.0% 50.0% 60.0% Adjusted EBITDA Margin (1) 23.5% 18.9% 17.8% 18.8% 21.9% 22.4% 2021 2022 2023 2024(2) 2025(2) TTM 6/30/26(2) Estimated 2026 —% 5.0% 10.0% 15.0% 20.0% 25.0% 30.0% Patient Services Gross Margin 64.1% 63.1% 62.5% 65.7% 64.0% 63.7% 2021 2022 2023 2024 2025 TTM 6/30/26 —% 10.0% 20.0% 30.0% 40.0% 50.0% 60.0% 70.0% Device Solutions Gross Margin 44.8% 41.8% 31.1% 32.2% 43.8% 46.6% 2021 2022 2023 2024 2025 TTM 6/30/26 —% 10.0% 20.0% 30.0% 40.0% 50.0% 60.0% (1) See Appendix A. (2) Includes $0.7M in 2024, $2.6M in 2025 and $2.8M for the TTM as of 6/30/26 for expenses associated with a project to upgrade the Company's information technology and business applications which included a replacement of the main enterprise resource planning ("ERP") application. **Estimates as of June 30, 2026 low to mid 20%'s of Revenue Annual Margin Performance Investor Presentation l August 4, 2026 l NYSE American: INFU
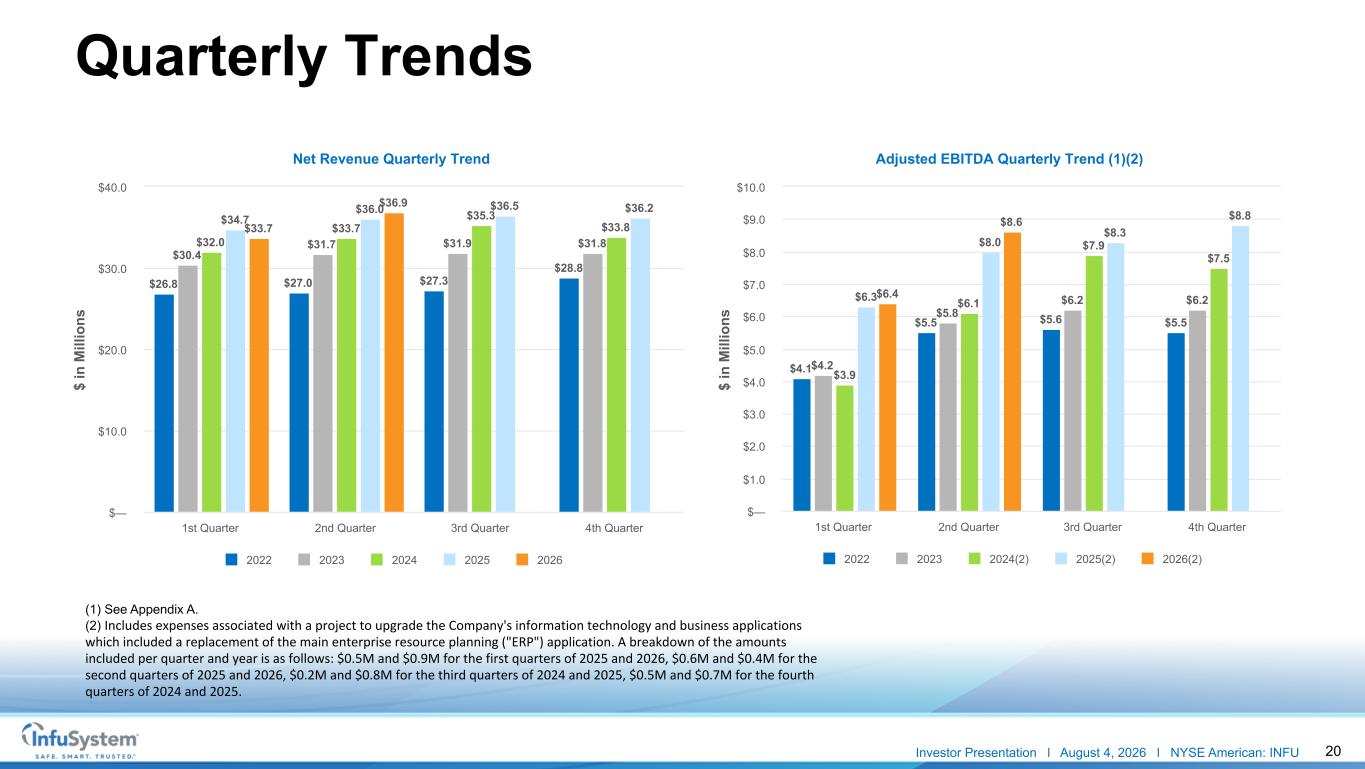
20 Quarterly Trends (1) See Appendix A. (2) Includes expenses associated with a project to upgrade the Company's information technology and business applications which included a replacement of the main enterprise resource planning ("ERP") application. A breakdown of the amounts included per quarter and year is as follows: $0.5M and $0.9M for the first quarters of 2025 and 2026, $0.6M and $0.4M for the second quarters of 2025 and 2026, $0.2M and $0.8M for the third quarters of 2024 and 2025, $0.5M and $0.7M for the fourth quarters of 2024 and 2025. Net Revenue Quarterly Trend $26.8 $27.0 $27.3 $28.8 $30.4 $31.7 $31.9 $31.8$32.0 $33.7 $35.3 $33.8$34.7 $36.0 $36.5 $36.2 $33.7 $36.9 2022 2023 2024 2025 2026 1st Quarter 2nd Quarter 3rd Quarter 4th Quarter $— $10.0 $20.0 $30.0 $40.0 Adjusted EBITDA Quarterly Trend (1)(2) $4.1 $5.5 $5.6 $5.5 $4.2 $5.8 $6.2 $6.2 $3.9 $6.1 $7.9 $7.5 $6.3 $8.0 $8.3 $8.8 $6.4 $8.6 2022 2023 2024(2) 2025(2) 2026(2) 1st Quarter 2nd Quarter 3rd Quarter 4th Quarter $— $1.0 $2.0 $3.0 $4.0 $5.0 $6.0 $7.0 $8.0 $9.0 $10.0 $ in M ill io ns $ in M ill io ns Investor Presentation l August 4, 2026 l NYSE American: INFU
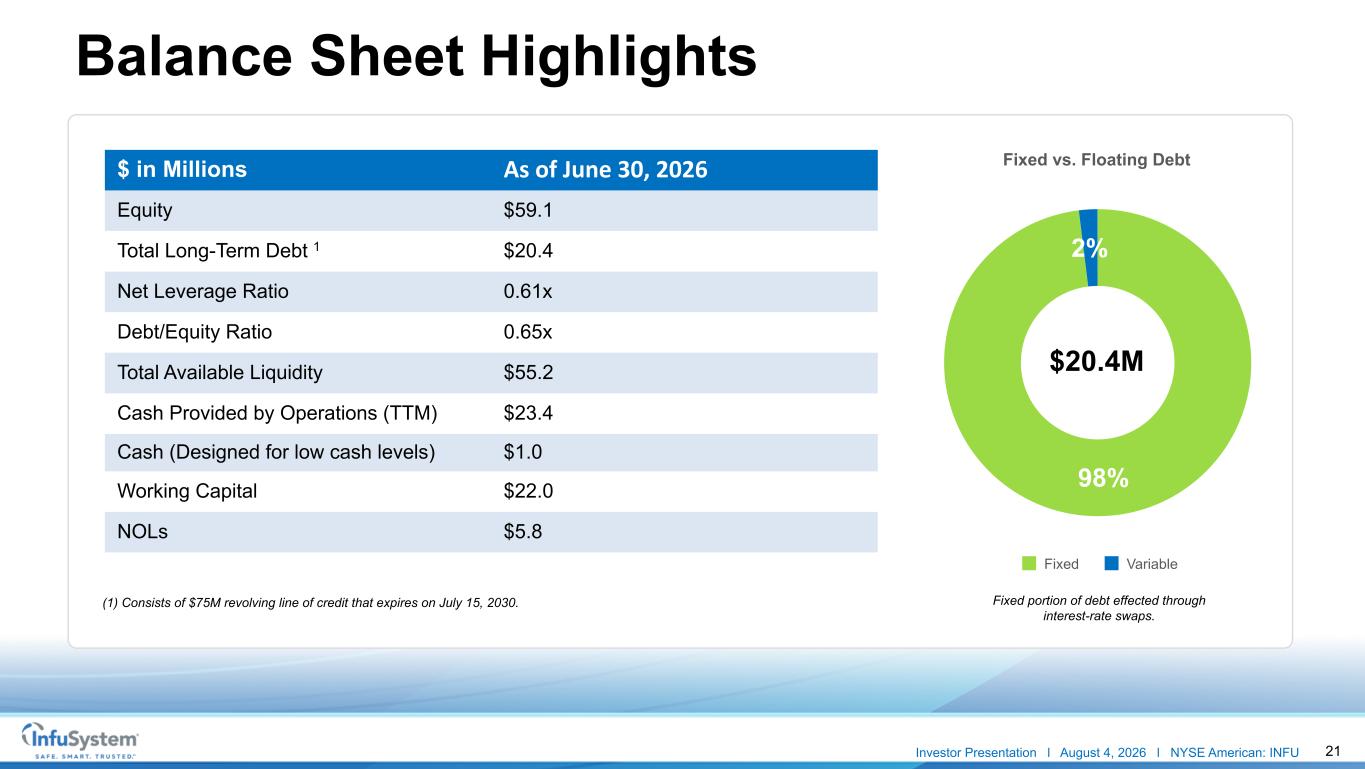
21 Balance Sheet Highlights (1) Consists of $75M revolving line of credit that expires on July 15, 2030. $ in Millions As of June 30, 2026 Equity $59.1 Total Long-Term Debt 1 $20.4 Net Leverage Ratio 0.61x Debt/Equity Ratio 0.65x Total Available Liquidity $55.2 Cash Provided by Operations (TTM) $23.4 Cash (Designed for low cash levels) $1.0 Working Capital $22.0 NOLs $5.8 Fixed vs. Floating Debt 98% 2% Fixed Variable $20.4M Fixed portion of debt effected through interest-rate swaps. Investor Presentation l August 4, 2026 l NYSE American: INFU
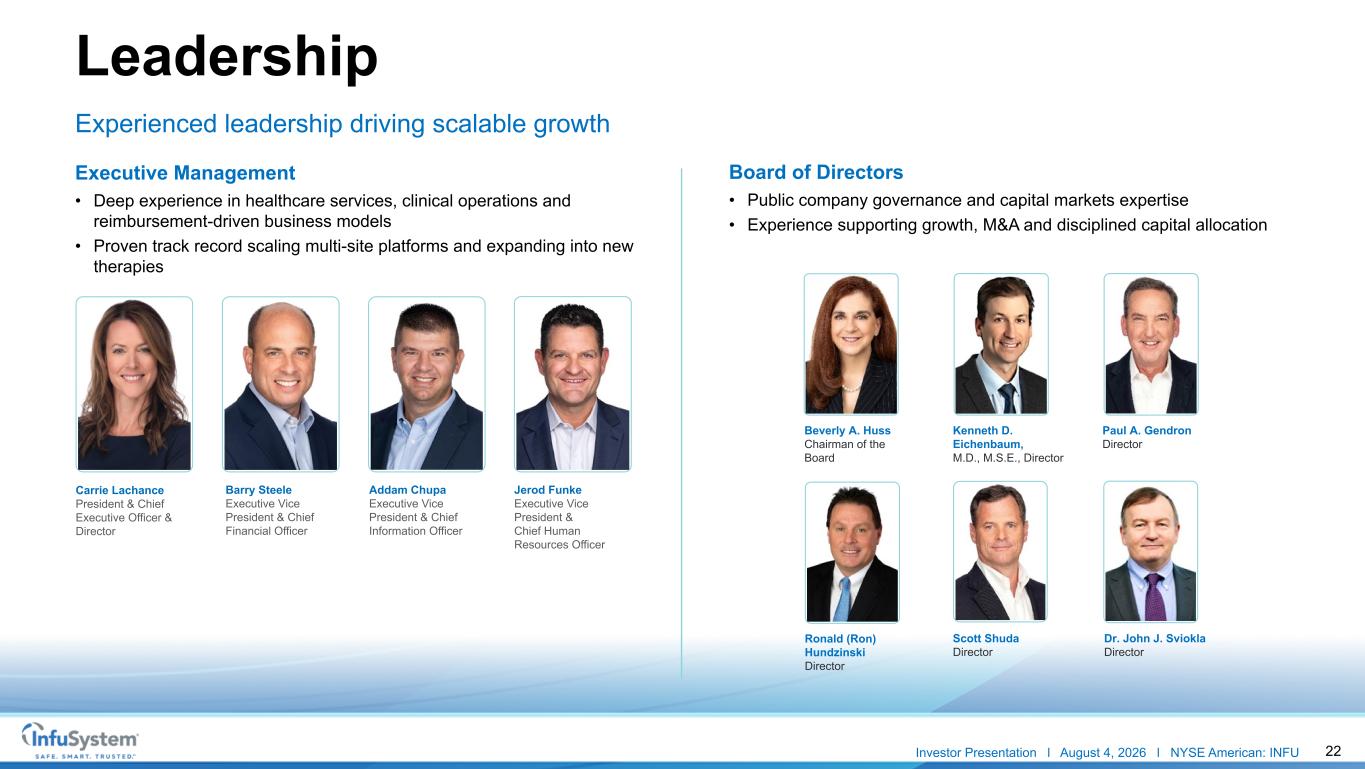
22 Ronald (Ron) Hundzinski Director Kenneth D. Eichenbaum, M.D., M.S.E., Director Paul A. Gendron Director Beverly A. Huss Chairman of the Board Scott Shuda Director Dr. John J. Sviokla Director Leadership Experienced leadership driving scalable growth Barry Steele Executive Vice President & Chief Financial Officer Carrie Lachance President & Chief Executive Officer & Director Addam Chupa Executive Vice President & Chief Information Officer Jerod Funke Executive Vice President & Chief Human Resources Officer Executive Management • Deep experience in healthcare services, clinical operations and reimbursement-driven business models • Proven track record scaling multi-site platforms and expanding into new therapies Board of Directors • Public company governance and capital markets expertise • Experience supporting growth, M&A and disciplined capital allocation Investor Presentation l August 4, 2026 l NYSE American: INFU
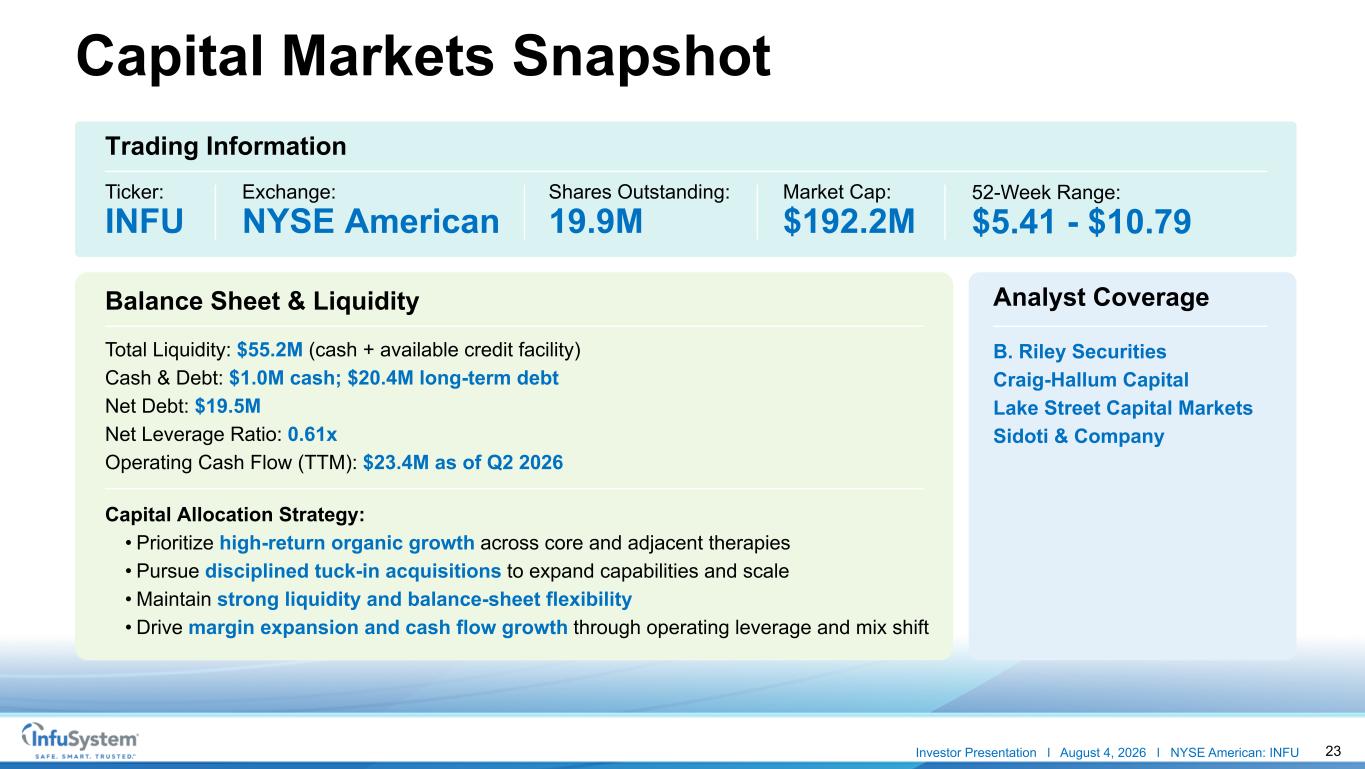
23 Capital Markets Snapshot Ticker: INFU Trading Information Balance Sheet & Liquidity Exchange: NYSE American Shares Outstanding: 19.9M Market Cap: $192.2M 52-Week Range: $5.41 - $10.79 Total Liquidity: $55.2M (cash + available credit facility) Cash & Debt: $1.0M cash; $20.4M long-term debt Net Debt: $19.5M Net Leverage Ratio: 0.61x Operating Cash Flow (TTM): $23.4M as of Q2 2026 Capital Allocation Strategy: • Prioritize high-return organic growth across core and adjacent therapies • Pursue disciplined tuck-in acquisitions to expand capabilities and scale • Maintain strong liquidity and balance-sheet flexibility • Drive margin expansion and cash flow growth through operating leverage and mix shift Analyst Coverage B. Riley Securities Craig-Hallum Capital Lake Street Capital Markets Sidoti & Company Investor Presentation l August 4, 2026 l NYSE American: INFU
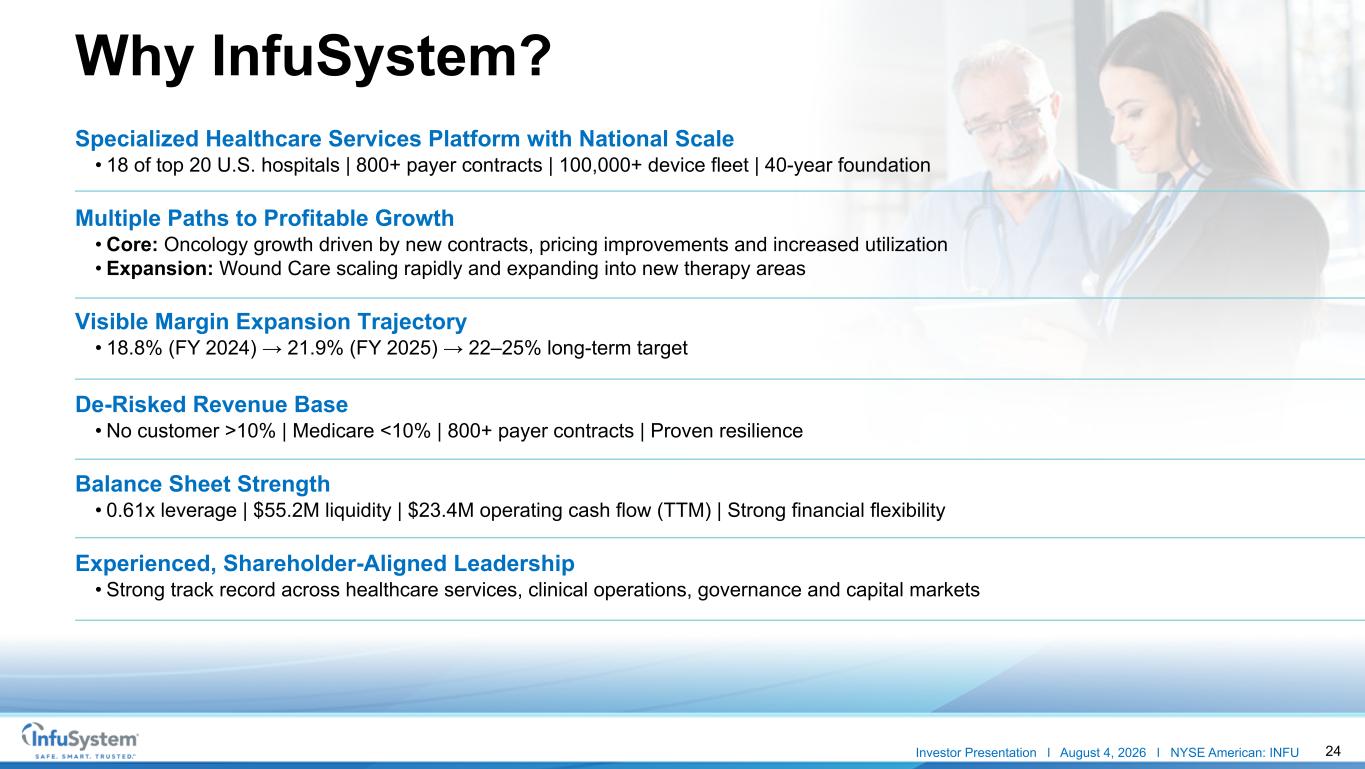
24 Specialized Healthcare Services Platform with National Scale • 18 of top 20 U.S. hospitals | 800+ payer contracts | 100,000+ device fleet | 40-year foundation Multiple Paths to Profitable Growth • Core: Oncology growth driven by new contracts, pricing improvements and increased utilization • Expansion: Wound Care scaling rapidly and expanding into new therapy areas Visible Margin Expansion Trajectory • 18.8% (FY 2024) → 21.9% (FY 2025) → 22–25% long-term target De-Risked Revenue Base • No customer >10% | Medicare <10% | 800+ payer contracts | Proven resilience Balance Sheet Strength • 0.61x leverage | $55.2M liquidity | $23.4M operating cash flow (TTM) | Strong financial flexibility Experienced, Shareholder-Aligned Leadership • Strong track record across healthcare services, clinical operations, governance and capital markets Why InfuSystem? Investor Presentation l August 4, 2026 l NYSE American: INFU
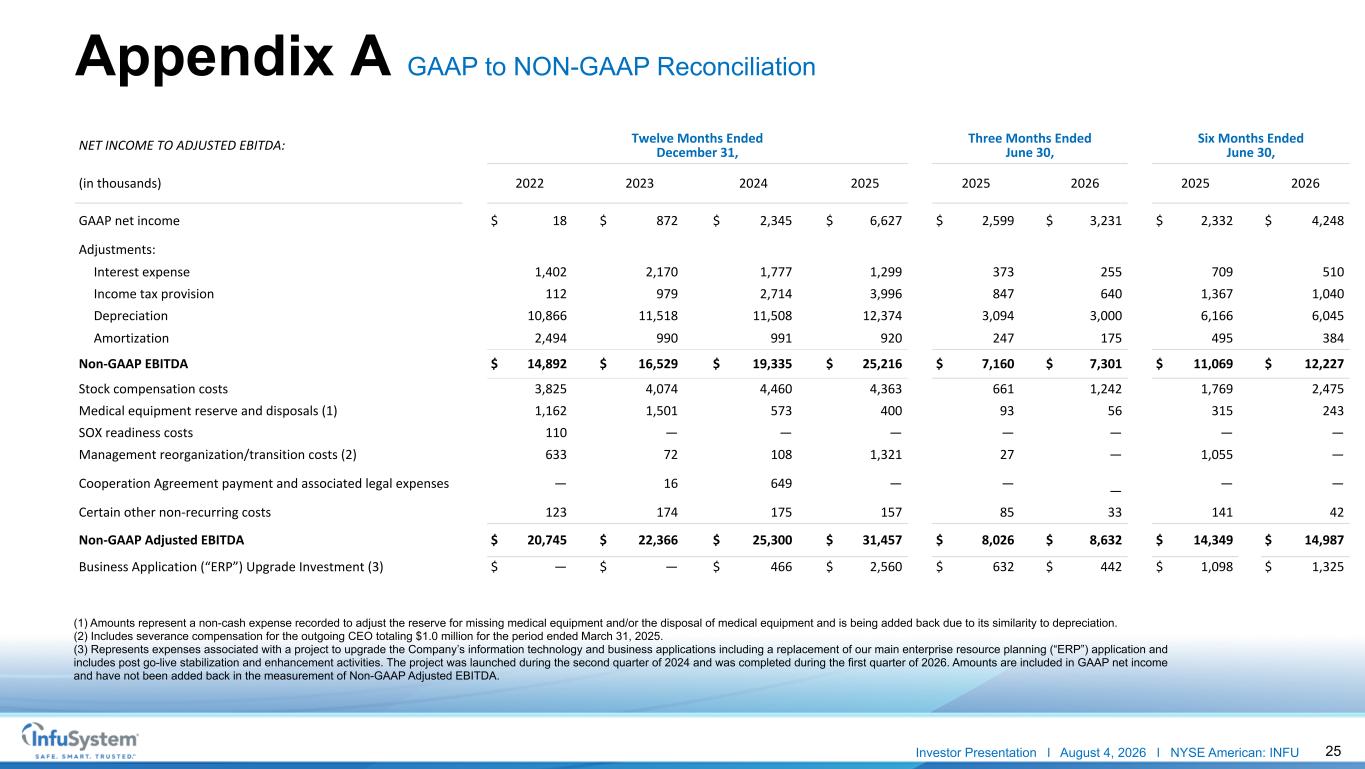
25 NET INCOME TO ADJUSTED EBITDA: Twelve Months Ended December 31, Three Months Ended June 30, Six Months Ended June 30, (in thousands) 2022 2023 2024 2025 2025 2026 2025 2026 GAAP net income $ 18 $ 872 $ 2,345 $ 6,627 $ 2,599 $ 3,231 $ 2,332 $ 4,248 Adjustments: Interest expense 1,402 2,170 1,777 1,299 373 255 709 510 Income tax provision 112 979 2,714 3,996 847 640 1,367 1,040 Depreciation 10,866 11,518 11,508 12,374 3,094 3,000 6,166 6,045 Amortization 2,494 990 991 920 247 175 495 384 Non-GAAP EBITDA $ 14,892 $ 16,529 $ 19,335 $ 25,216 $ 7,160 $ 7,301 $ 11,069 $ 12,227 Stock compensation costs 3,825 4,074 4,460 4,363 661 1,242 1,769 2,475 Medical equipment reserve and disposals (1) 1,162 1,501 573 400 93 56 315 243 SOX readiness costs 110 — — — — — — — Management reorganization/transition costs (2) 633 72 108 1,321 27 — 1,055 — Cooperation Agreement payment and associated legal expenses — 16 649 — — — — — Certain other non-recurring costs 123 174 175 157 85 33 141 42 Non-GAAP Adjusted EBITDA $ 20,745 $ 22,366 $ 25,300 $ 31,457 $ 8,026 $ 8,632 $ 14,349 $ 14,987 Business Application (“ERP”) Upgrade Investment (3) $ — $ — $ 466 $ 2,560 $ 632 $ 442 $ 1,098 $ 1,325 (1) Amounts represent a non-cash expense recorded to adjust the reserve for missing medical equipment and/or the disposal of medical equipment and is being added back due to its similarity to depreciation. (2) Includes severance compensation for the outgoing CEO totaling $1.0 million for the period ended March 31, 2025. (3) Represents expenses associated with a project to upgrade the Company’s information technology and business applications including a replacement of our main enterprise resource planning (“ERP”) application and includes post go-live stabilization and enhancement activities. The project was launched during the second quarter of 2024 and was completed during the first quarter of 2026. Amounts are included in GAAP net income and have not been added back in the measurement of Non-GAAP Adjusted EBITDA. Appendix A GAAP to NON-GAAP Reconciliation Investor Presentation l August 4, 2026 l NYSE American: INFU

26 Questions & Answers
27 Thank You Bristol Capital Ltd. Glen Akselrod & Stefan Eftychiou T: (905) 326-1888 Ext 1