
1 Financial ResultsQ1 Fiscal 2027 Jaime A. Irick President and CEO Tom L. Barbato Chief Financial Officer NASDAQ: TRNS August 4, 2026 Exhibit 99.2
2 Safe Harbor Statement This presentation contains forward-looking statements within the meaning of the Private Securities Litigation Reform Act of 1995. All statements other than historical fact are forward-looking statements. Forward-looking statements are not statements of historical fact and thus are subject to risks, uncertainties and assumptions. Forward-looking statements are identified by words such as “will,” “expect,” “anticipate,” “believe,” “plan,” “outlook,” “continue,” and other similar expressions or variations thereof. All statements addressing operating performance, events or developments that Transcat expects or anticipates will occur in the future, including but not limited to statements relating to outlook, anticipated revenue, profit margins, sales operations, capital expenditures, cash flows, operating income, growth strategy, potential acquisitions, integration of acquired businesses, market position, customer preferences, and changes in market conditions in the industries in which Transcat operates are forward-looking statements. Forward-looking statements should be evaluated in light of important risk factors and uncertainties. These risk factors and uncertainties include those more fully described in Transcat’s Annual Report and Quarterly Reports filed with the Securities and Exchange Commission, including under the heading entitled “Risk Factors.” Should one or more of these risks or uncertainties materialize, or should any of the Company’s underlying assumptions prove incorrect, actual results may vary materially from those currently anticipated. In addition, undue reliance should not be placed on the Company’s forward-looking statements, which speak only as of the date they are made. Except as required by law, the Company disclaims any obligation to update, correct or publicly announce any revisions to any of the forward-looking statements contained in this news release, whether as the result of new information, future events or otherwise. This presentation includes some non-GAAP financial measures, which the Company believes are useful in evaluating our performance. You should not consider the presentation of this additional information in isolation or as a substitute for results prepared in accordance with GAAP. The Company has provided a discussion of these non- GAAP financial measures and reconciliations of comparable GAAP to non-GAAP measures in tables found in the Supplemental Information portion of this presentation. © 2026 Transcat Inc.
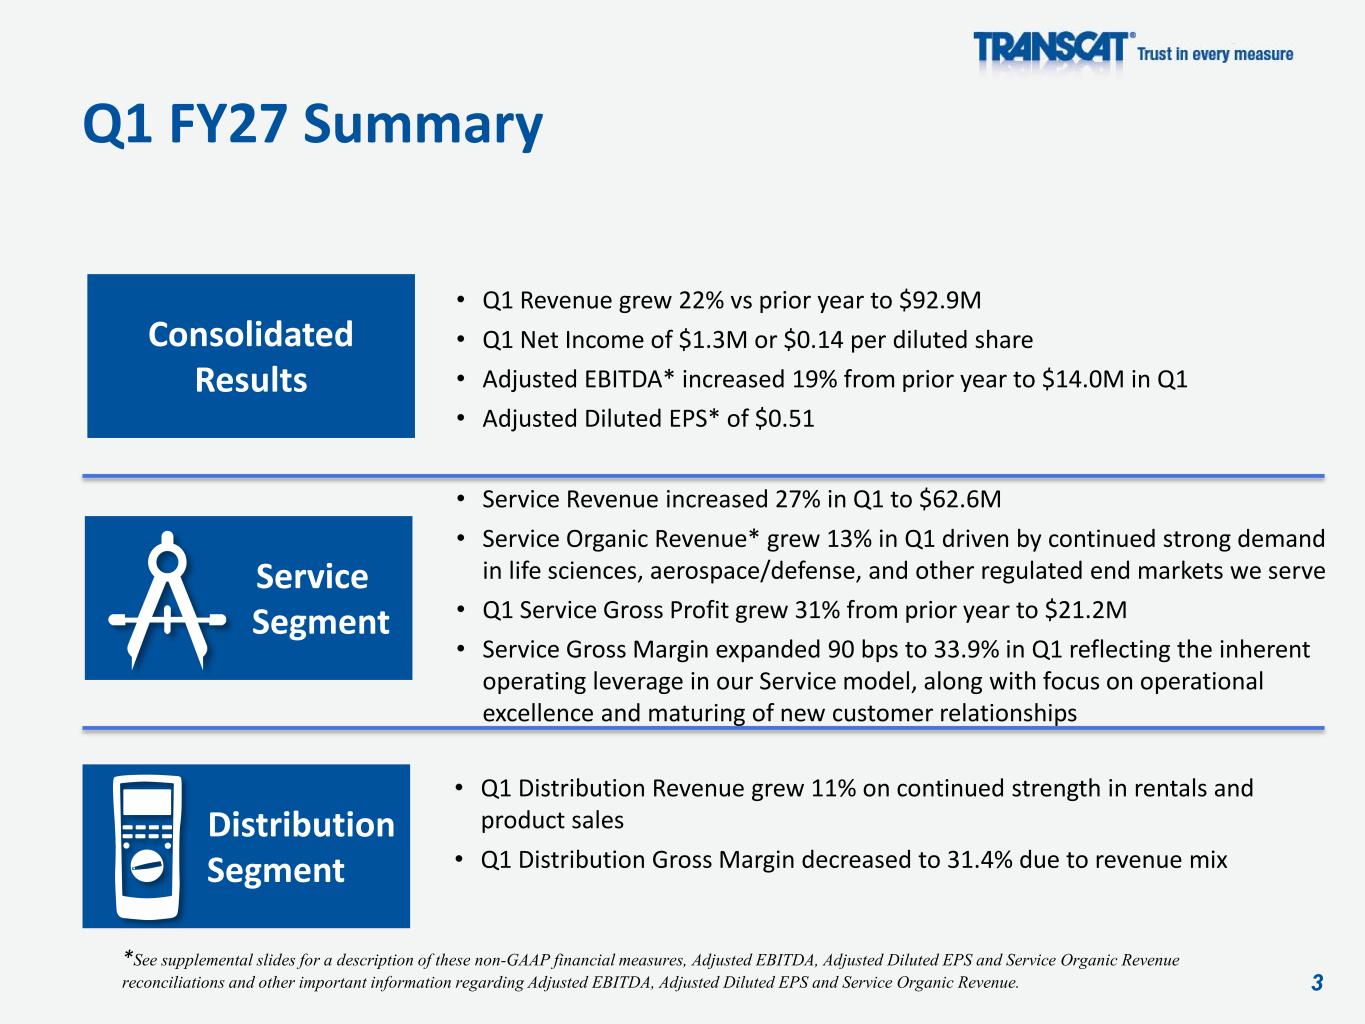
3 Q1 FY27 Summary Consolidated Results • Service Revenue increased 27% in Q1 to $62.6M • Service Organic Revenue* grew 13% in Q1 driven by continued strong demand in life sciences, aerospace/defense, and other regulated end markets we serve • Q1 Service Gross Profit grew 31% from prior year to $21.2M • Service Gross Margin expanded 90 bps to 33.9% in Q1 reflecting the inherent operating leverage in our Service model, along with focus on operational excellence and maturing of new customer relationships • Q1 Distribution Revenue grew 11% on continued strength in rentals and product sales • Q1 Distribution Gross Margin decreased to 31.4% due to revenue mix • Q1 Revenue grew 22% vs prior year to $92.9M • Q1 Net Income of $1.3M or $0.14 per diluted share • Adjusted EBITDA* increased 19% from prior year to $14.0M in Q1 • Adjusted Diluted EPS* of $0.51 Service Segment Distribution Segment *See supplemental slides for a description of these non-GAAP financial measures, Adjusted EBITDA, Adjusted Diluted EPS and Service Organic Revenue reconciliations and other important information regarding Adjusted EBITDA, Adjusted Diluted EPS and Service Organic Revenue.
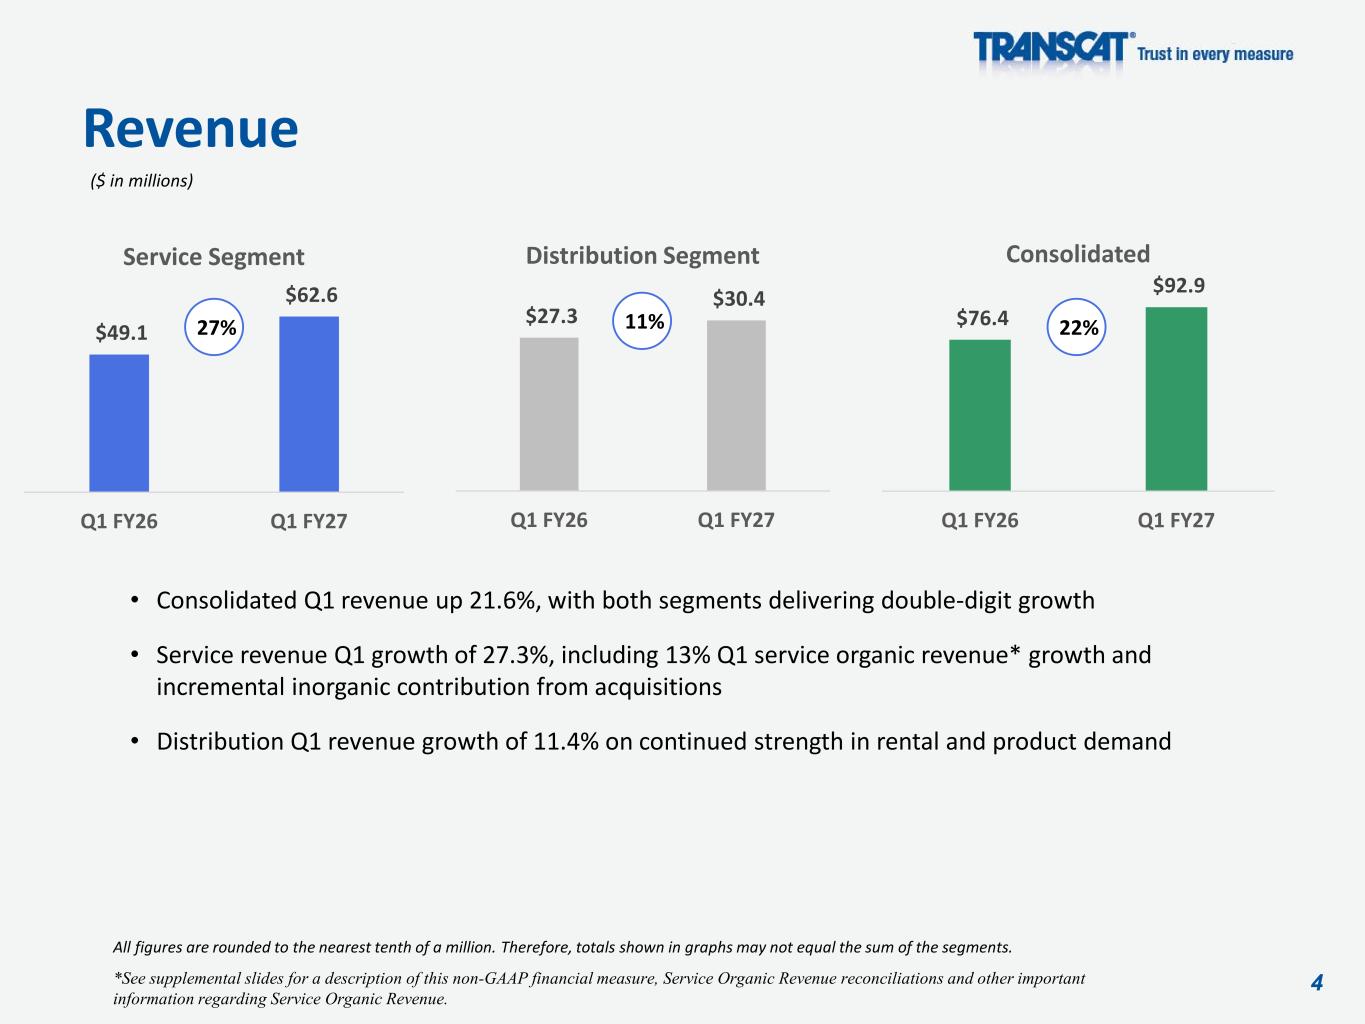
4 Revenue • Consolidated Q1 revenue up 21.6%, with both segments delivering double-digit growth • Service revenue Q1 growth of 27.3%, including 13% Q1 service organic revenue* growth and incremental inorganic contribution from acquisitions • Distribution Q1 revenue growth of 11.4% on continued strength in rental and product demand ($ in millions) All figures are rounded to the nearest tenth of a million. Therefore, totals shown in graphs may not equal the sum of the segments. *See supplemental slides for a description of this non-GAAP financial measure, Service Organic Revenue reconciliations and other important information regarding Service Organic Revenue. $49.1 $62.6 Q1 FY26 Q1 FY27 Service Segment $27.3 $30.4 Q1 FY26 Q1 FY27 Distribution Segment $76.4 $92.9 Q1 FY26 Q1 FY27 Consolidated 22%11%27%
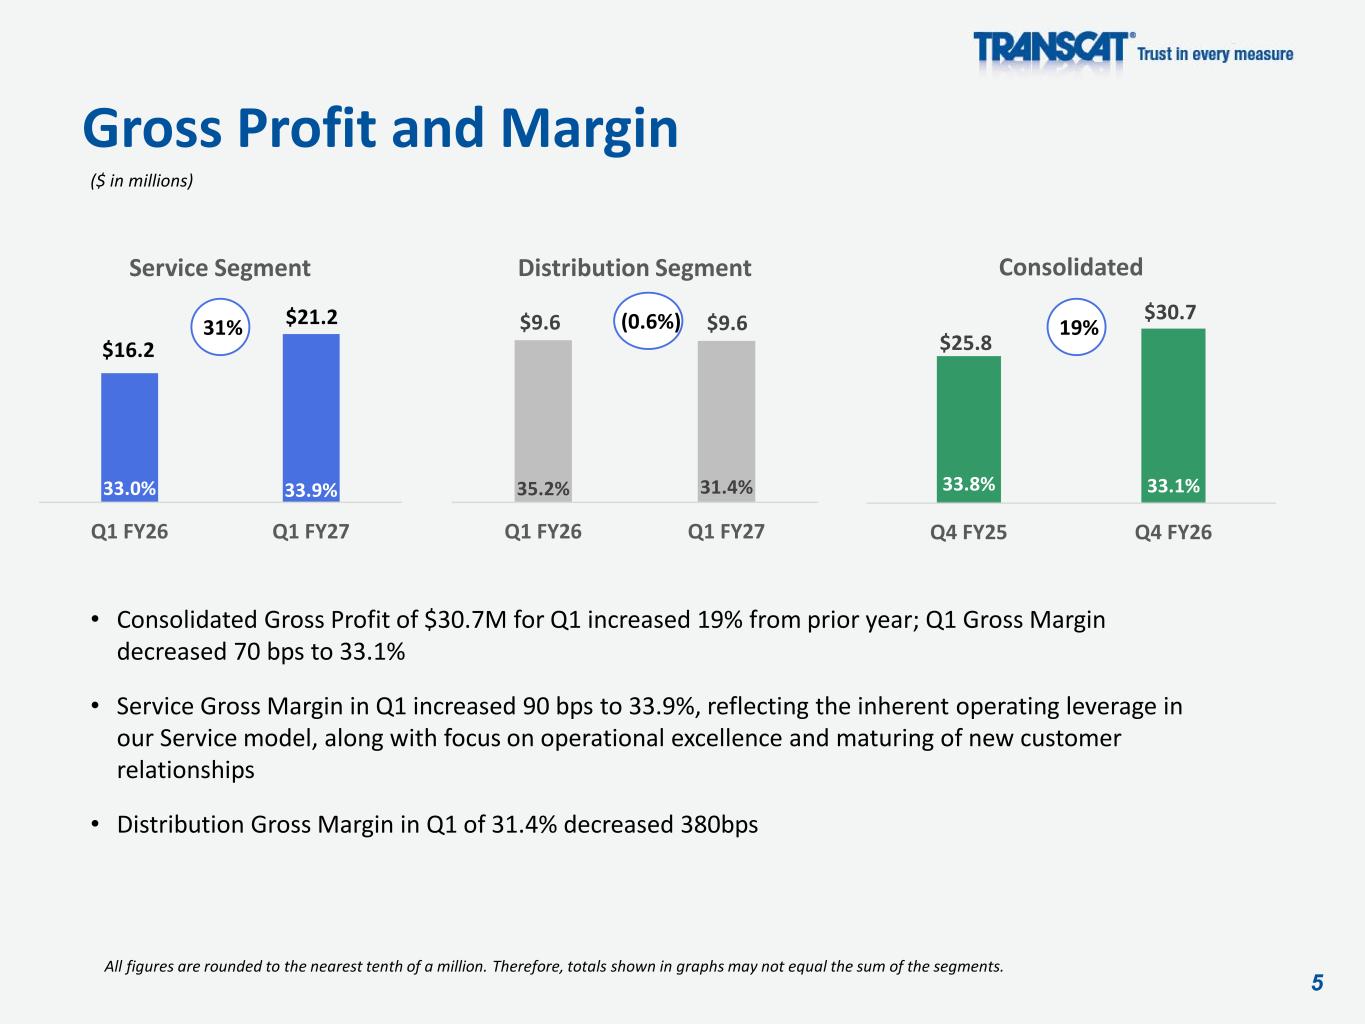
5 33.0% 33.9% $16.2 $21.2 Q1 FY26 Q1 FY27 Service Segment Gross Profit and Margin • Consolidated Gross Profit of $30.7M for Q1 increased 19% from prior year; Q1 Gross Margin decreased 70 bps to 33.1% • Service Gross Margin in Q1 increased 90 bps to 33.9%, reflecting the inherent operating leverage in our Service model, along with focus on operational excellence and maturing of new customer relationships • Distribution Gross Margin in Q1 of 31.4% decreased 380bps All figures are rounded to the nearest tenth of a million. Therefore, totals shown in graphs may not equal the sum of the segments. ($ in millions) 33.8% 33.1% $25.8 $30.7 Q4 FY25 Q4 FY26 Consolidated 35.2% 31.4% $9.6 $9.6 Q1 FY26 Q1 FY27 Distribution Segment 19%(0.6%)31%
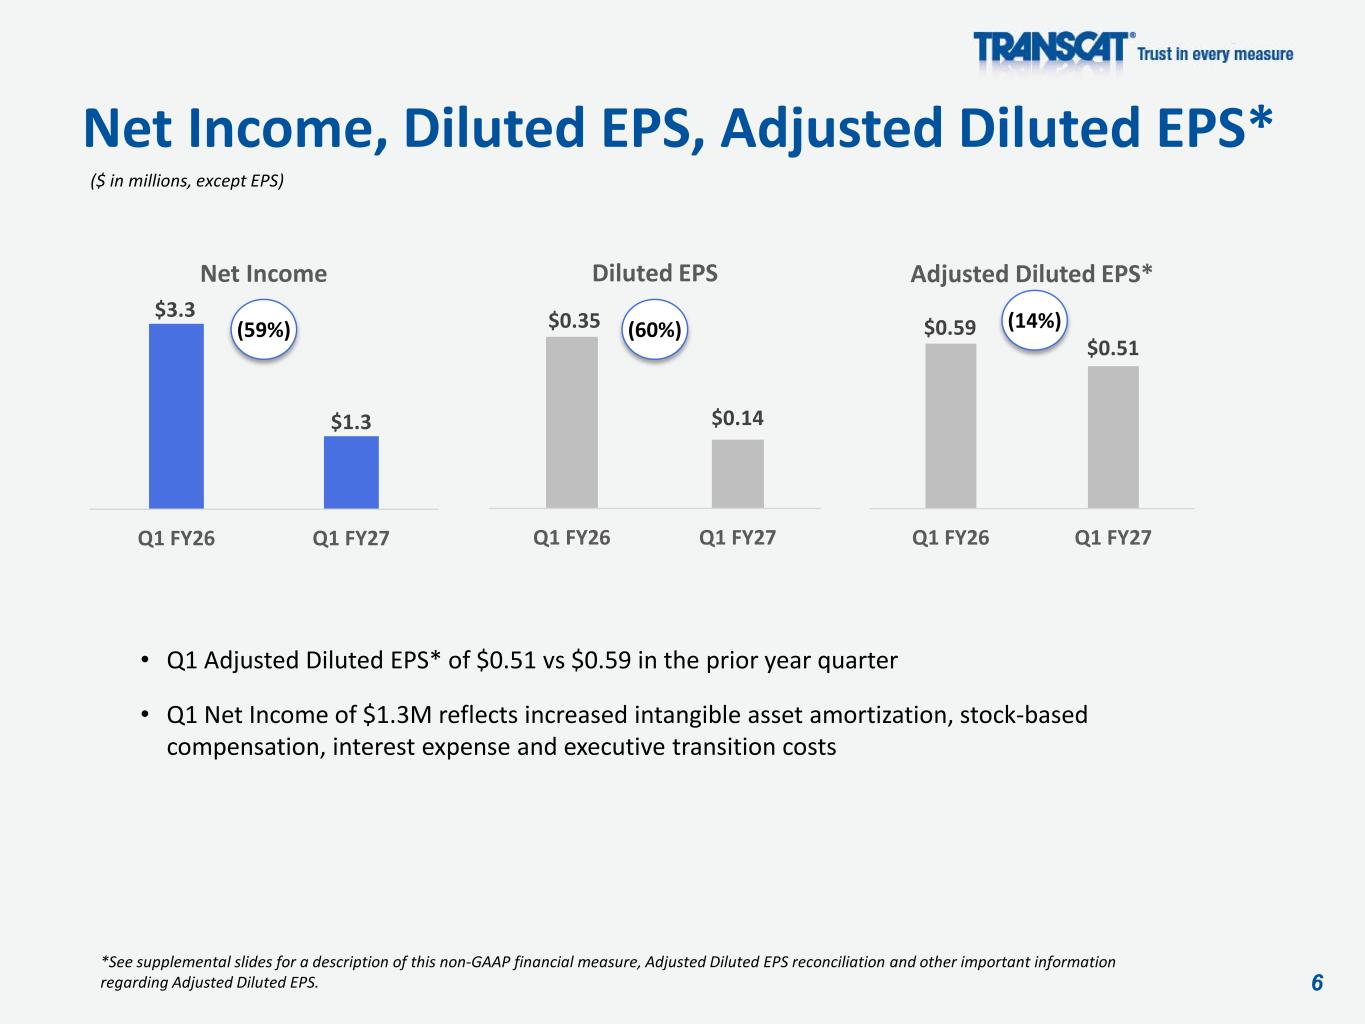
6 Net Income, Diluted EPS, Adjusted Diluted EPS* • Q1 Adjusted Diluted EPS* of $0.51 vs $0.59 in the prior year quarter • Q1 Net Income of $1.3M reflects increased intangible asset amortization, stock-based compensation, interest expense and executive transition costs ($ in millions, except EPS) *See supplemental slides for a description of this non-GAAP financial measure, Adjusted Diluted EPS reconciliation and other important information regarding Adjusted Diluted EPS. $3.3 $1.3 Q1 FY26 Q1 FY27 Net Income $0.35 $0.14 Q1 FY26 Q1 FY27 Diluted EPS $0.59 $0.51 Q1 FY26 Q1 FY27 Adjusted Diluted EPS* (59%) (60%) (14%)
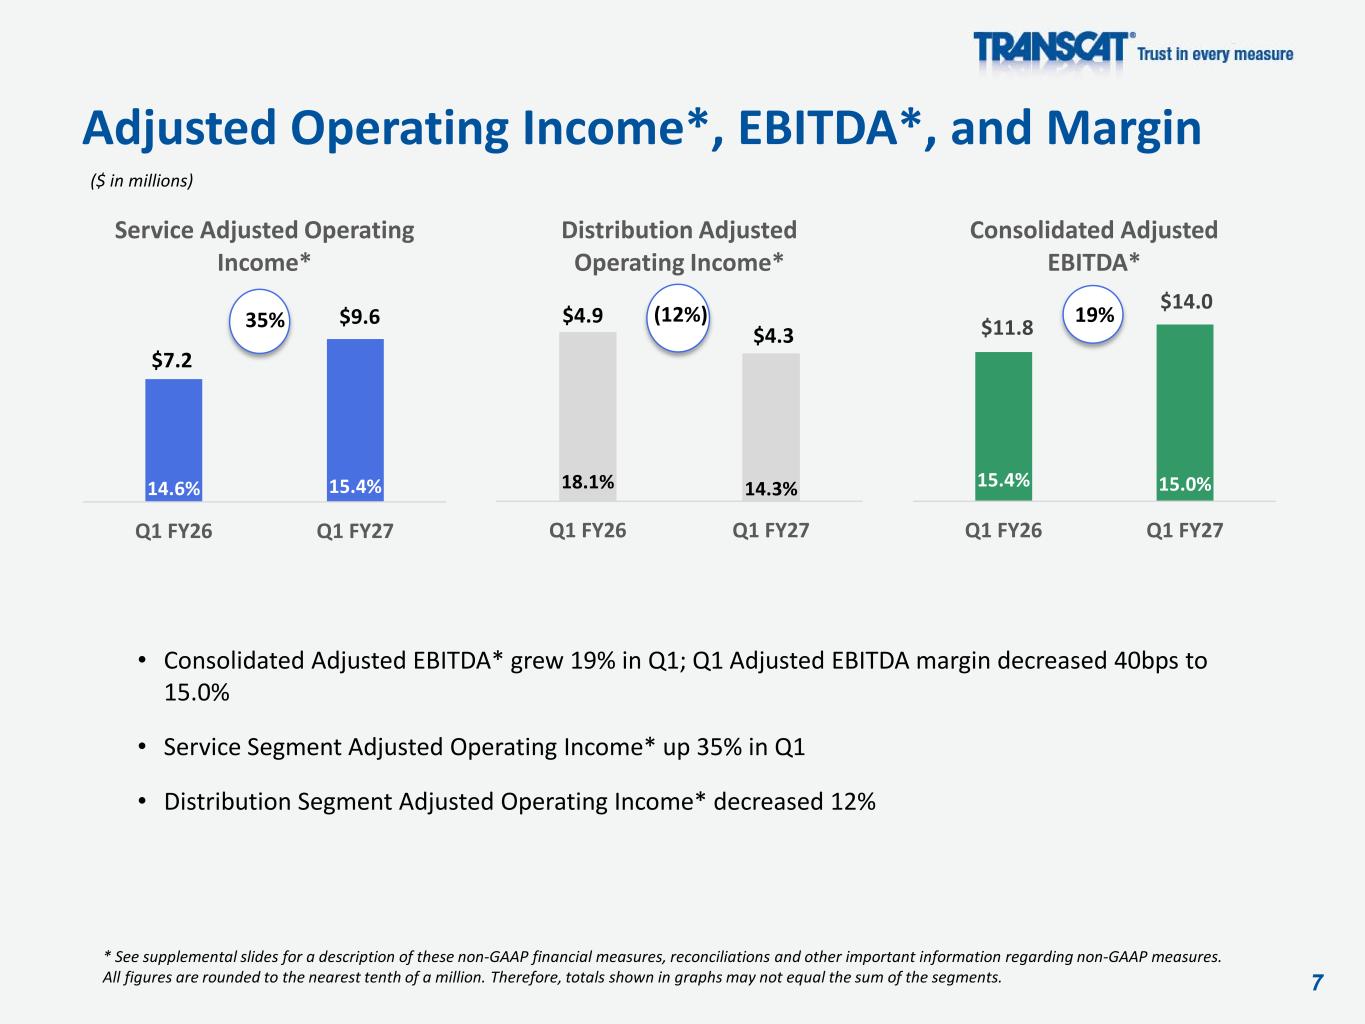
7 Adjusted Operating Income*, EBITDA*, and Margin • Consolidated Adjusted EBITDA* grew 19% in Q1; Q1 Adjusted EBITDA margin decreased 40bps to 15.0% • Service Segment Adjusted Operating Income* up 35% in Q1 • Distribution Segment Adjusted Operating Income* decreased 12% ($ in millions) * See supplemental slides for a description of these non-GAAP financial measures, reconciliations and other important information regarding non-GAAP measures. All figures are rounded to the nearest tenth of a million. Therefore, totals shown in graphs may not equal the sum of the segments. 14.6% 15.4% $7.2 $9.6 Q1 FY26 Q1 FY27 Service Adjusted Operating Income* 35% 15.4% 15.0% $11.8 $14.0 Q1 FY26 Q1 FY27 Consolidated Adjusted EBITDA* 18.1% 14.3% $4.9 $4.3 Q1 FY26 Q1 FY27 Distribution Adjusted Operating Income* (12%) 19%
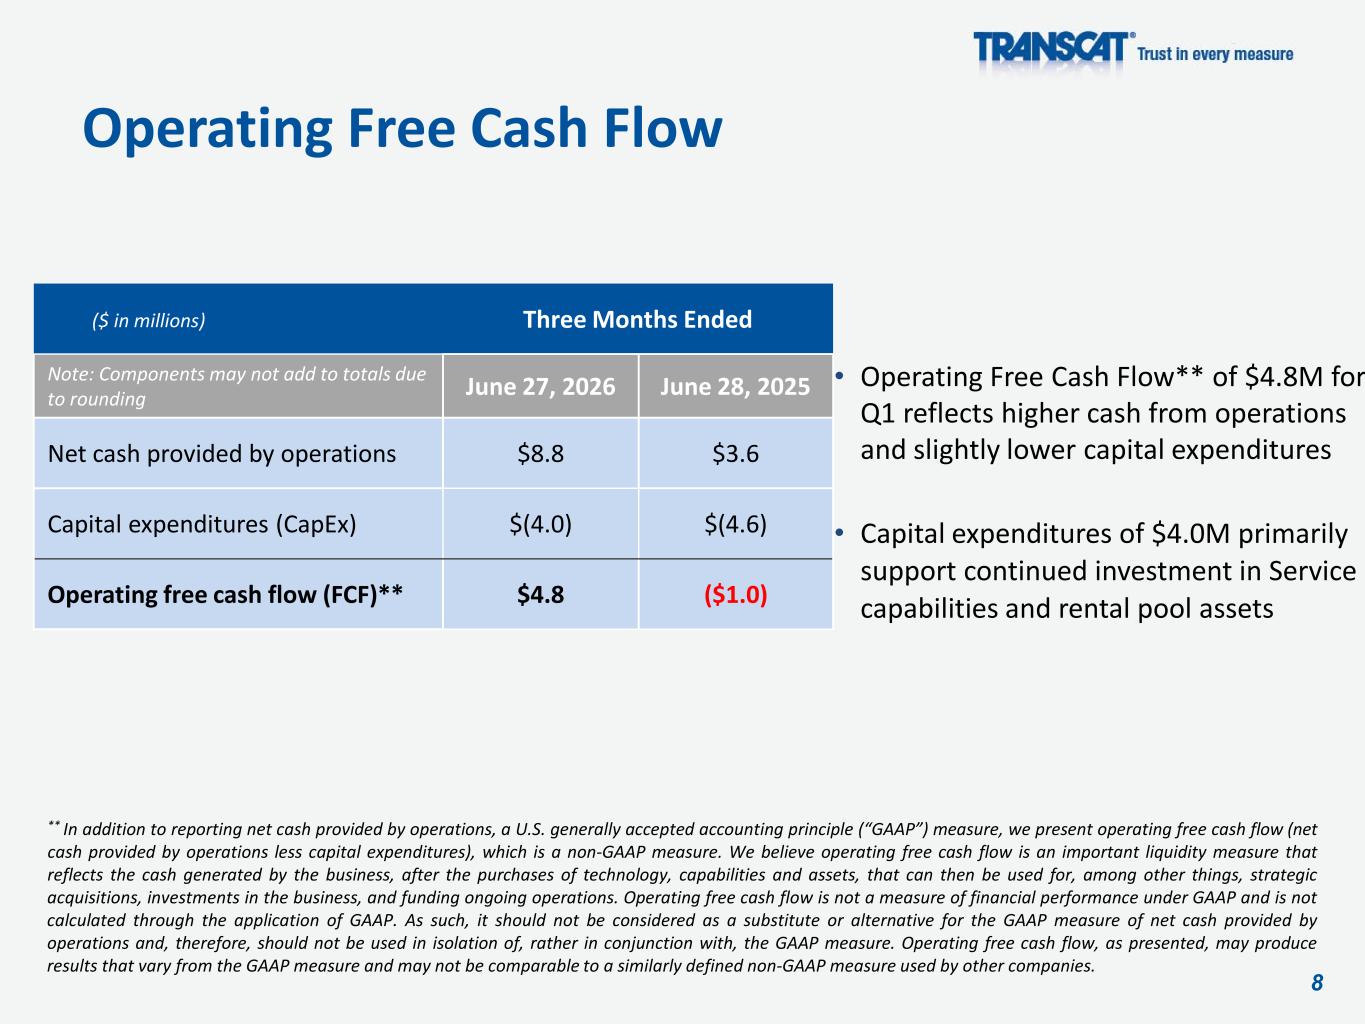
8 Operating Free Cash Flow ** In addition to reporting net cash provided by operations, a U.S. generally accepted accounting principle (“GAAP”) measure, we present operating free cash flow (net cash provided by operations less capital expenditures), which is a non-GAAP measure. We believe operating free cash flow is an important liquidity measure that reflects the cash generated by the business, after the purchases of technology, capabilities and assets, that can then be used for, among other things, strategic acquisitions, investments in the business, and funding ongoing operations. Operating free cash flow is not a measure of financial performance under GAAP and is not calculated through the application of GAAP. As such, it should not be considered as a substitute or alternative for the GAAP measure of net cash provided by operations and, therefore, should not be used in isolation of, rather in conjunction with, the GAAP measure. Operating free cash flow, as presented, may produce results that vary from the GAAP measure and may not be comparable to a similarly defined non-GAAP measure used by other companies. • Operating Free Cash Flow** of $4.8M for Q1 reflects higher cash from operations and slightly lower capital expenditures • Capital expenditures of $4.0M primarily support continued investment in Service capabilities and rental pool assets Three Months Ended Note: Components may not add to totals due to rounding June 27, 2026 June 28, 2025 Net cash provided by operations $8.8 $3.6 Capital expenditures (CapEx) $(4.0) $(4.6) Operating free cash flow (FCF)** $4.8 ($1.0) ($ in millions)
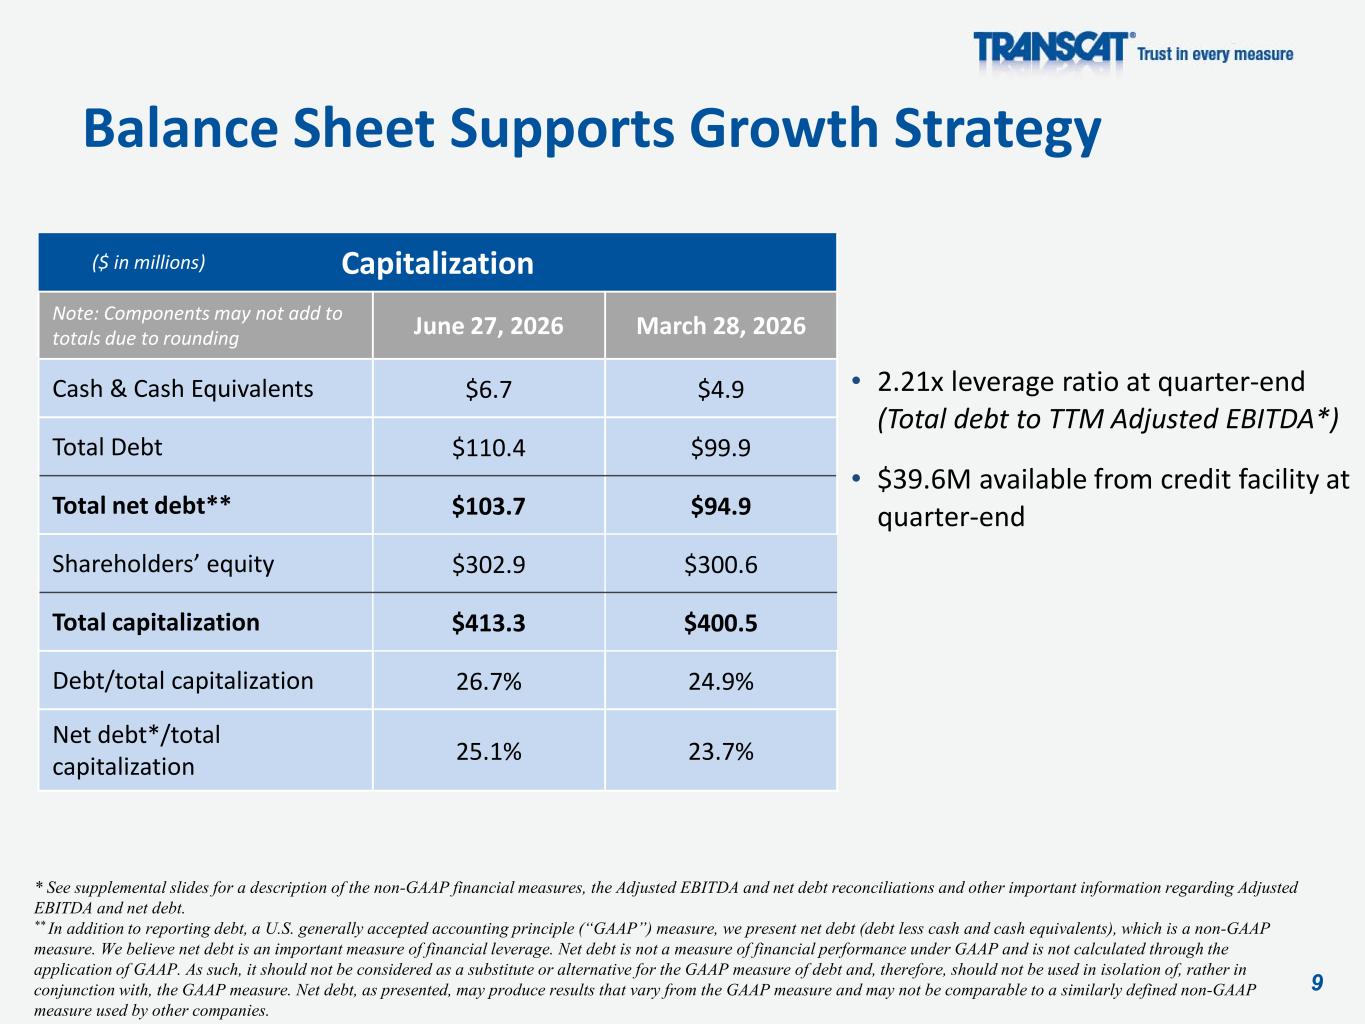
9 Balance Sheet Supports Growth Strategy • 2.21x leverage ratio at quarter-end (Total debt to TTM Adjusted EBITDA*) • $39.6M available from credit facility at quarter-end * See supplemental slides for a description of the non-GAAP financial measures, the Adjusted EBITDA and net debt reconciliations and other important information regarding Adjusted EBITDA and net debt. ** In addition to reporting debt, a U.S. generally accepted accounting principle (“GAAP”) measure, we present net debt (debt less cash and cash equivalents), which is a non-GAAP measure. We believe net debt is an important measure of financial leverage. Net debt is not a measure of financial performance under GAAP and is not calculated through the application of GAAP. As such, it should not be considered as a substitute or alternative for the GAAP measure of debt and, therefore, should not be used in isolation of, rather in conjunction with, the GAAP measure. Net debt, as presented, may produce results that vary from the GAAP measure and may not be comparable to a similarly defined non-GAAP measure used by other companies. Capitalization Note: Components may not add to totals due to rounding June 27, 2026 March 28, 2026 Cash & Cash Equivalents $6.7 $4.9 Total Debt $110.4 $99.9 Total net debt** $103.7 $94.9 Shareholders’ equity $302.9 $300.6 Total capitalization $413.3 $400.5 Debt/total capitalization 26.7% 24.9% Net debt*/total capitalization 25.1% 23.7% ($ in millions)
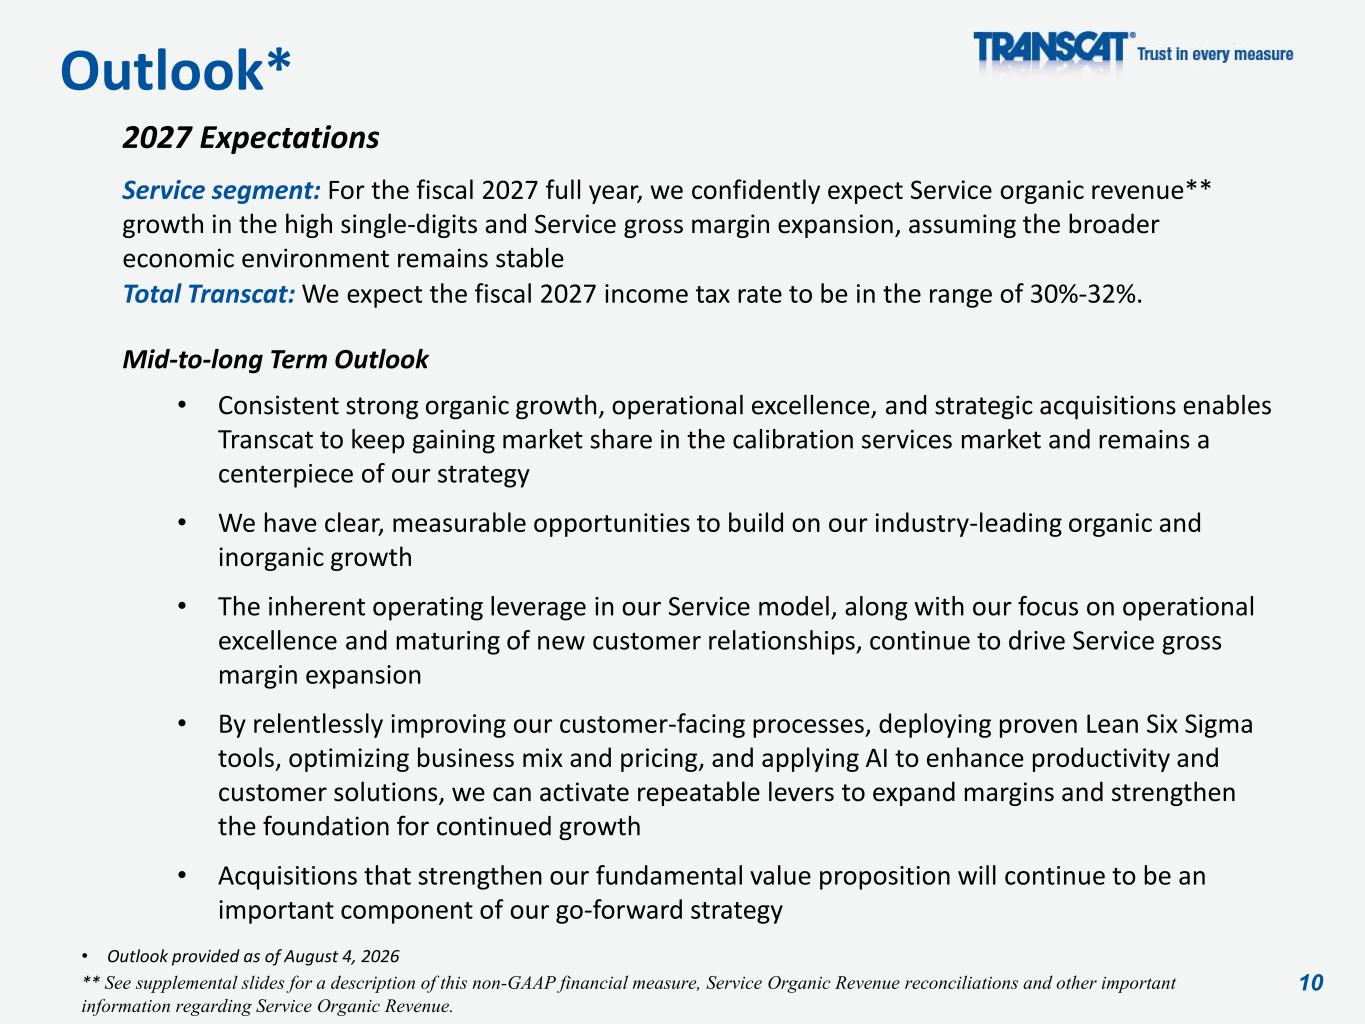
10 • Outlook provided as of August 4, 2026 ** See supplemental slides for a description of this non-GAAP financial measure, Service Organic Revenue reconciliations and other important information regarding Service Organic Revenue. Outlook* 2027 Expectations Service segment: For the fiscal 2027 full year, we confidently expect Service organic revenue** growth in the high single-digits and Service gross margin expansion, assuming the broader economic environment remains stable Total Transcat: We expect the fiscal 2027 income tax rate to be in the range of 30%-32%. Mid-to-long Term Outlook • Consistent strong organic growth, operational excellence, and strategic acquisitions enables Transcat to keep gaining market share in the calibration services market and remains a centerpiece of our strategy • We have clear, measurable opportunities to build on our industry-leading organic and inorganic growth • The inherent operating leverage in our Service model, along with our focus on operational excellence and maturing of new customer relationships, continue to drive Service gross margin expansion • By relentlessly improving our customer-facing processes, deploying proven Lean Six Sigma tools, optimizing business mix and pricing, and applying AI to enhance productivity and customer solutions, we can activate repeatable levers to expand margins and strengthen the foundation for continued growth • Acquisitions that strengthen our fundamental value proposition will continue to be an important component of our go-forward strategy
11 Financial ResultsQ1 Fiscal 2027 NASDAQ: TRNS Questions & Answers TRANSCAT, INC 35 Vantage Point Drive Rochester, NY 14624 Investor Relations Chris Tyson Executive Vice President MZ Group - MZ North America 949-491-8235 TRNS@mzgroup.us August 4, 2026
12 Conference Call and Webcast Playback • Replay Number: 1-844-512-2921 (US & Canada) 1-412-317-6671 (international) passcode: 11161995 Telephone replay available through Tuesday, August 18, 2026 • Webcast: https://viavid.webcasts.com/starthere.jsp?ei=1767397&tp_key=17aef9c35b • Webcast / Presentation / Replay available at https://www.transcat.com/investor-relations
13 Supplemental Information
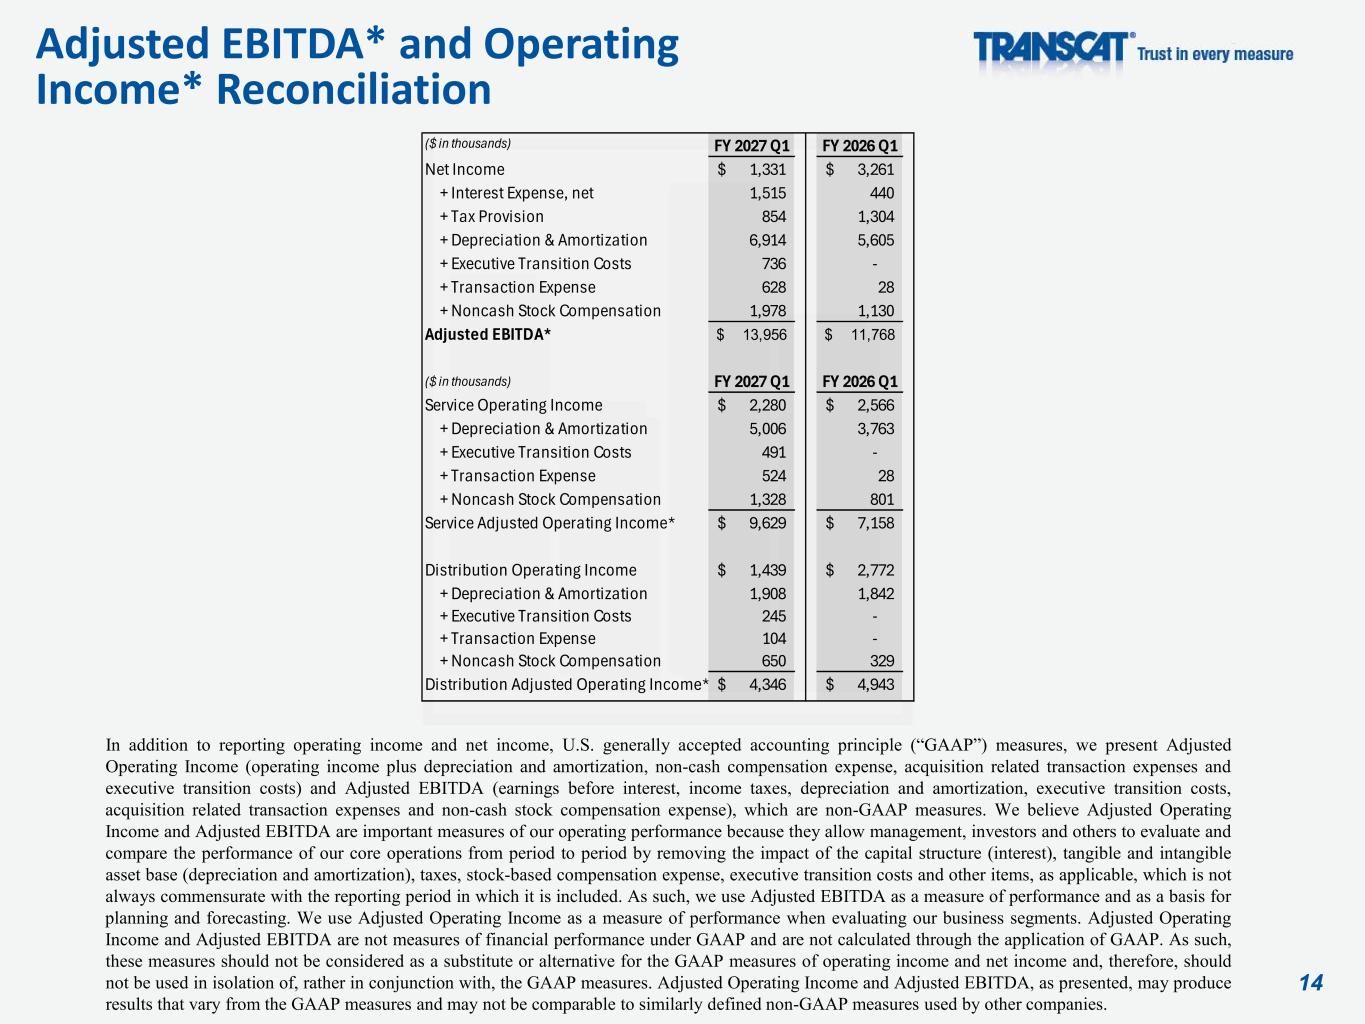
14 Adjusted EBITDA* and Operating Income* Reconciliation In addition to reporting operating income and net income, U.S. generally accepted accounting principle (“GAAP”) measures, we present Adjusted Operating Income (operating income plus depreciation and amortization, non-cash compensation expense, acquisition related transaction expenses and executive transition costs) and Adjusted EBITDA (earnings before interest, income taxes, depreciation and amortization, executive transition costs, acquisition related transaction expenses and non-cash stock compensation expense), which are non-GAAP measures. We believe Adjusted Operating Income and Adjusted EBITDA are important measures of our operating performance because they allow management, investors and others to evaluate and compare the performance of our core operations from period to period by removing the impact of the capital structure (interest), tangible and intangible asset base (depreciation and amortization), taxes, stock-based compensation expense, executive transition costs and other items, as applicable, which is not always commensurate with the reporting period in which it is included. As such, we use Adjusted EBITDA as a measure of performance and as a basis for planning and forecasting. We use Adjusted Operating Income as a measure of performance when evaluating our business segments. Adjusted Operating Income and Adjusted EBITDA are not measures of financial performance under GAAP and are not calculated through the application of GAAP. As such, these measures should not be considered as a substitute or alternative for the GAAP measures of operating income and net income and, therefore, should not be used in isolation of, rather in conjunction with, the GAAP measures. Adjusted Operating Income and Adjusted EBITDA, as presented, may produce results that vary from the GAAP measures and may not be comparable to similarly defined non-GAAP measures used by other companies. ($ in thousands) FY 2027 Q1 FY 2026 Q1 Net Income 1,331$ 3,261$ + Interest Expense, net 1,515 440 + Tax Provision 854 1,304 + Depreciation & Amortization 6,914 5,605 + Executive Transition Costs 736 - + Transaction Expense 628 28 + Noncash Stock Compensation 1,978 1,130 Adjusted EBITDA* 13,956$ 11,768$ ($ in thousands) FY 2027 Q1 FY 2026 Q1 Service Operating Income 2,280$ 2,566$ + Depreciation & Amortization 5,006 3,763 + Executive Transition Costs 491 - + Transaction Expense 524 28 + Noncash Stock Compensation 1,328 801 Service Adjusted Operating Income* 9,629$ 7,158$ Distribution Operating Income 1,439$ 2,772$ + Depreciation & Amortization 1,908 1,842 + Executive Transition Costs 245 - + Transaction Expense 104 - + Noncash Stock Compensation 650 329 Distribution Adjusted Operating Income* 4,346$ 4,943$
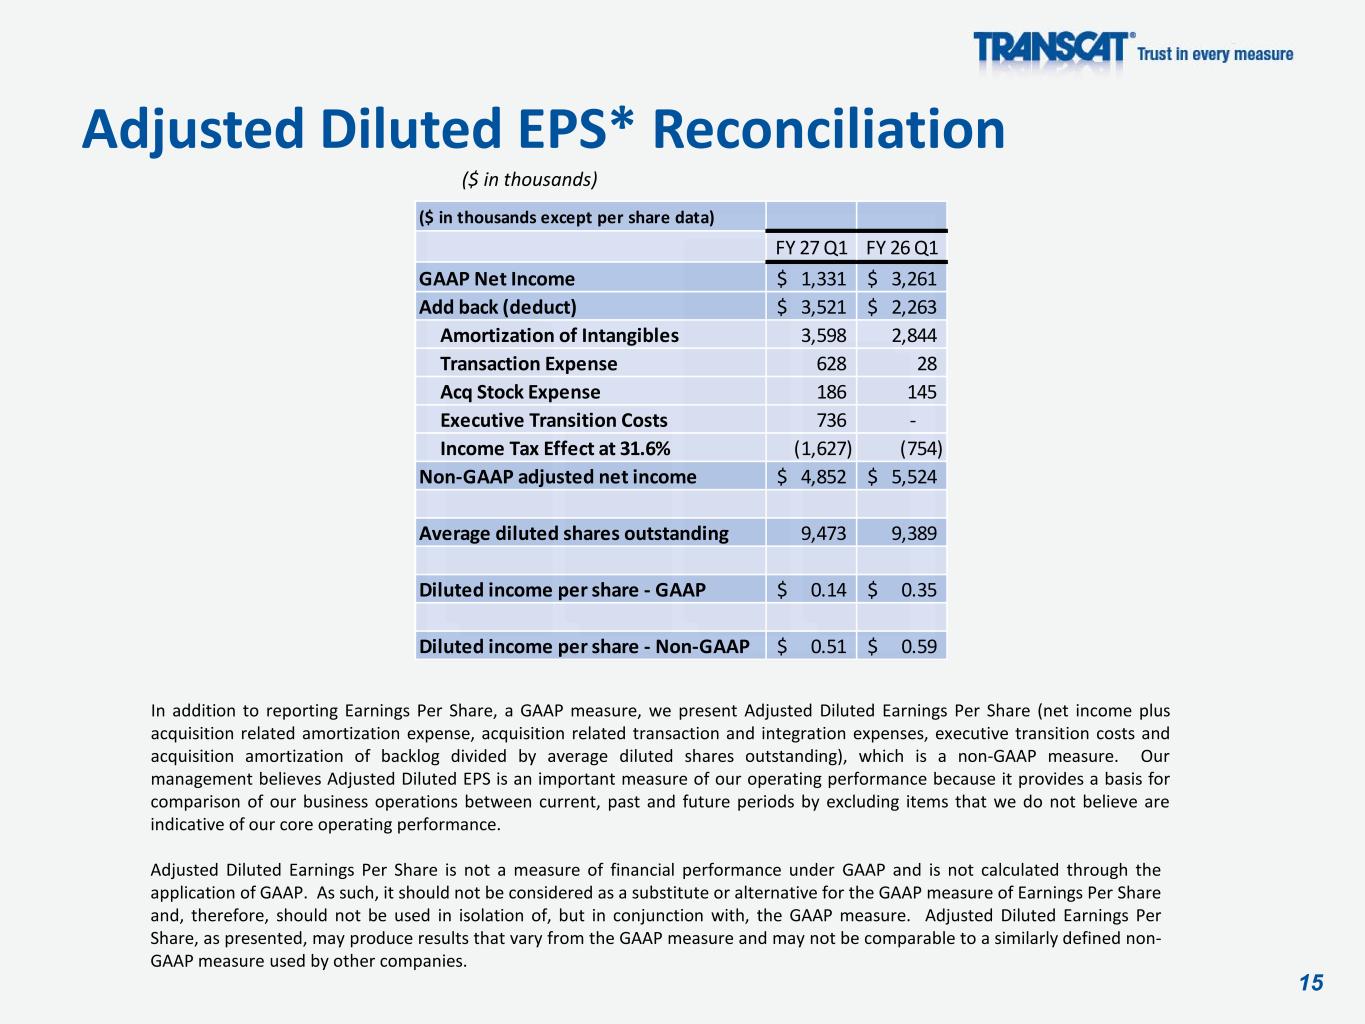
15 ($ in thousands) Adjusted Diluted EPS* Reconciliation In addition to reporting Earnings Per Share, a GAAP measure, we present Adjusted Diluted Earnings Per Share (net income plus acquisition related amortization expense, acquisition related transaction and integration expenses, executive transition costs and acquisition amortization of backlog divided by average diluted shares outstanding), which is a non-GAAP measure. Our management believes Adjusted Diluted EPS is an important measure of our operating performance because it provides a basis for comparison of our business operations between current, past and future periods by excluding items that we do not believe are indicative of our core operating performance. Adjusted Diluted Earnings Per Share is not a measure of financial performance under GAAP and is not calculated through the application of GAAP. As such, it should not be considered as a substitute or alternative for the GAAP measure of Earnings Per Share and, therefore, should not be used in isolation of, but in conjunction with, the GAAP measure. Adjusted Diluted Earnings Per Share, as presented, may produce results that vary from the GAAP measure and may not be comparable to a similarly defined non- GAAP measure used by other companies. ($ in thousands except per share data) FY 27 Q1 FY 26 Q1 GAAP Net Income 1,331$ 3,261$ Add back (deduct) 3,521$ 2,263$ Amortization of Intangibles 3,598 2,844 Transaction Expense 628 28 Acq Stock Expense 186 145 Executive Transition Costs 736 - Income Tax Effect at 31.6% (1,627) (754) Non-GAAP adjusted net income 4,852$ 5,524$ Average diluted shares outstanding 9,473 9,389 Diluted income per share - GAAP 0.14$ 0.35$ Diluted income per share - Non-GAAP 0.51$ 0.59$