
©2026 eHealthInsurance Services, Inc. 1 Q2 2026 Financial Results

©2026 eHealthInsurance Services, Inc. 2 Safe Harbor Statement Forward-Looking Statements This presentation includes forward-looking statements within the meaning of the Private Securities Litigation Reform Act of 1995. Forward-looking statements generally relate to future events or our future financial or operating performance. Forward-looking statements in this presentation include, but are not limited to, the following: our expectations regarding our business, industry and market trends, including market opportunity, consumer demand and our competitive advantage and long-term vision; our estimates regarding commissions receivable collection; our expectations regarding our technological and digital capabilities, including artificial intelligence (AI) capabilities; our business and growth strategy; our strategic priorities for 2026 and beyond, including our lifetime advisory model, member engagement, ancillary product sales and AI enhancement strategies, cost management and cash flow generation, and the current and anticipated impact of such strategic priorities; our financial strategies and our ability to achieve our financial targets, including our 2026 annual guidance for total revenue, GAAP net income, adjusted EBITDA and operating cash flow; our estimates for and the expected impact of positive net adjustment revenue on our 2026 annual guidance; and other statements regarding our future operations, financial condition, prospects and business strategies. Our expectations and beliefs regarding these matters may not materialize, and actual results in future periods are subject to risks and uncertainties that could cause actual results to differ materially from those projected. These risks include those set forth in our filings with the Securities and Exchange Commission, including our latest Form 10-Q and Form 10-K. The forward-looking statements in this presentation are based on information available to us as of today, and we disclaim any obligation to update any forward-looking statements, except as required by law. Non-GAAP Information This presentation includes both GAAP and non-GAAP financial measures. The presentation of non-GAAP financial information is not intended to be considered in isolation or as a substitute for results prepared in accordance with GAAP. Definitions and reconciliations of the non-GAAP financial measures included in this presentation to the most directly comparable GAAP financial measures is available in the Appendix to this presentation. Management uses both GAAP and non- GAAP information in evaluating and operating its business internally and as such has determined that it is important to provide this information to investors.
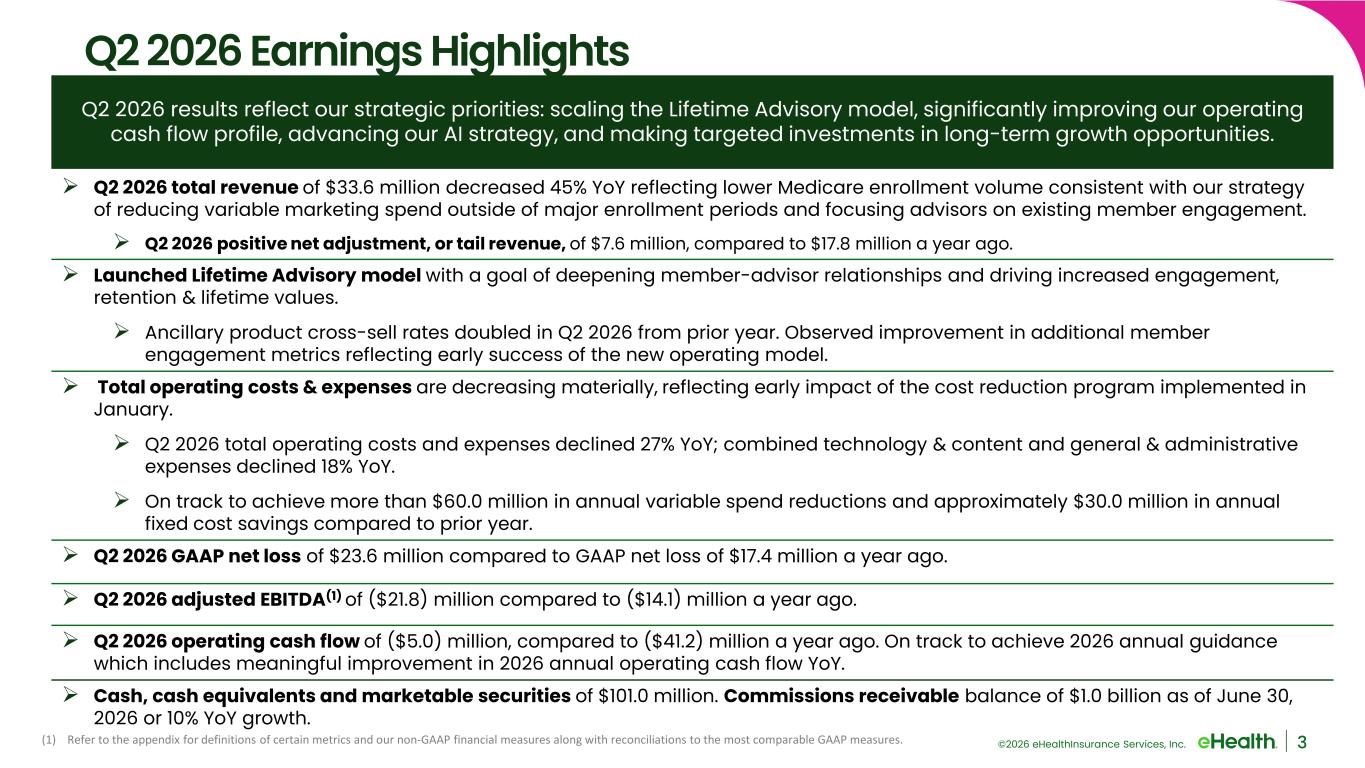
©2026 eHealthInsurance Services, Inc. 3 Q2 2026 Earnings Highlights Q2 2026 total revenue of $33.6 million decreased 45% YoY reflecting lower Medicare enrollment volume consistent with our strategy of reducing variable marketing spend outside of major enrollment periods and focusing advisors on existing member engagement. Q2 2026 positive net adjustment, or tail revenue, of $7.6 million, compared to $17.8 million a year ago. Launched Lifetime Advisory model with a goal of deepening member-advisor relationships and driving increased engagement, retention & lifetime values. Ancillary product cross-sell rates doubled in Q2 2026 from prior year. Observed improvement in additional member engagement metrics reflecting early success of the new operating model. Total operating costs & expenses are decreasing materially, reflecting early impact of the cost reduction program implemented in January. Q2 2026 total operating costs and expenses declined 27% YoY; combined technology & content and general & administrative expenses declined 18% YoY. On track to achieve more than $60.0 million in annual variable spend reductions and approximately $30.0 million in annual fixed cost savings compared to prior year. Q2 2026 GAAP net loss of $23.6 million compared to GAAP net loss of $17.4 million a year ago. Q2 2026 adjusted EBITDA(1) of ($21.8) million compared to ($14.1) million a year ago. Q2 2026 operating cash flow of ($5.0) million, compared to ($41.2) million a year ago. On track to achieve 2026 annual guidance which includes meaningful improvement in 2026 annual operating cash flow YoY. Cash, cash equivalents and marketable securities of $101.0 million. Commissions receivable balance of $1.0 billion as of June 30, 2026 or 10% YoY growth. Q2 2026 results reflect our strategic priorities: scaling the Lifetime Advisory model, significantly improving our operating cash flow profile, advancing our AI strategy, and making targeted investments in long-term growth opportunities. (1) Refer to the appendix for definitions of certain metrics and our non-GAAP financial measures along with reconciliations to the most comparable GAAP measures.
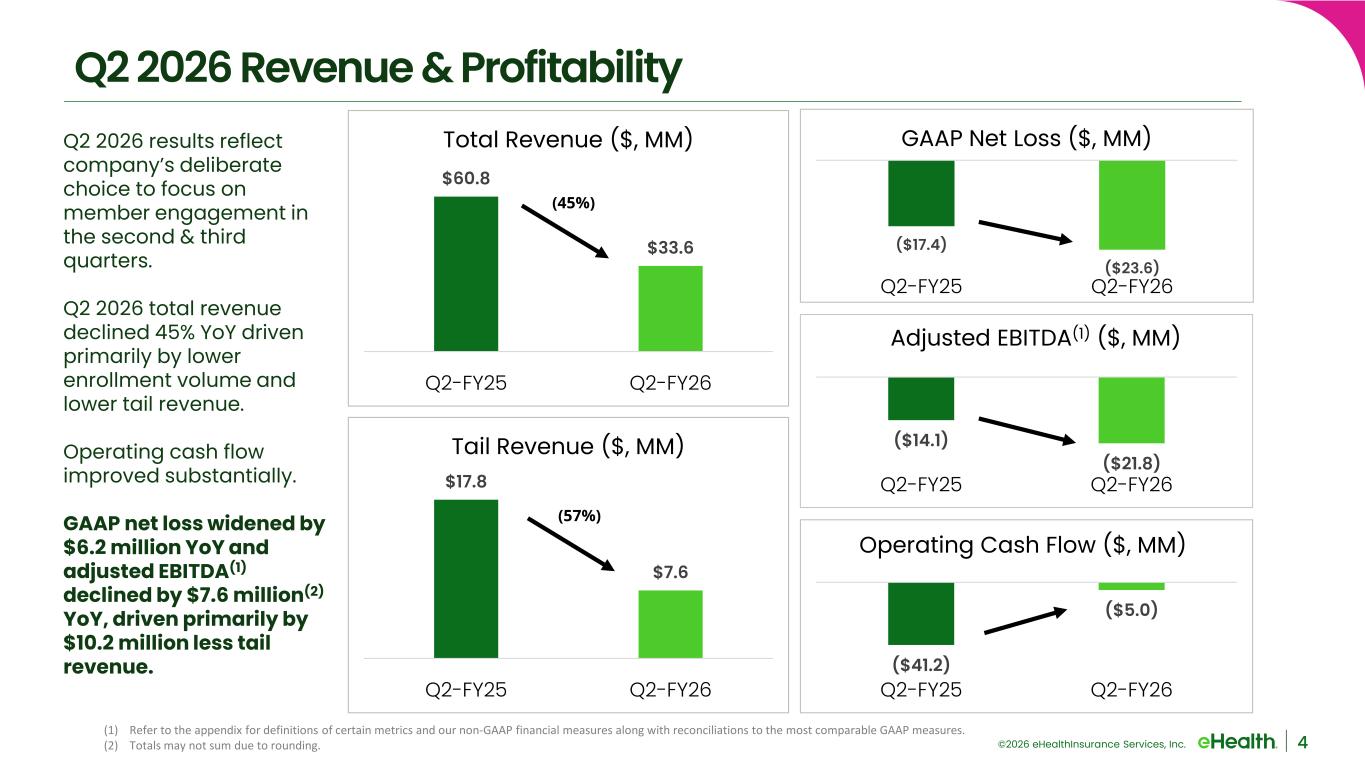
©2026 eHealthInsurance Services, Inc. ($14.1) ($21.8) Q2-FY25 Q2-FY26 Adjusted EBITDA(1) ($, MM) ($41.2) ($5.0) Q2-FY25 Q2-FY26 Operating Cash Flow ($, MM) ($17.4) ($23.6) Q2-FY25 Q2-FY26 GAAP Net Loss ($, MM) $60.8 $33.6 Q2-FY25 Q2-FY26 Total Revenue ($, MM) 4 Q2 2026 Revenue & Profitability (1) Refer to the appendix for definitions of certain metrics and our non-GAAP financial measures along with reconciliations to the most comparable GAAP measures. (2) Totals may not sum due to rounding. (45%) Q2 2026 results reflect company’s deliberate choice to focus on member engagement in the second & third quarters. Q2 2026 total revenue declined 45% YoY driven primarily by lower enrollment volume and lower tail revenue. Operating cash flow improved substantially. GAAP net loss widened by $6.2 million YoY and adjusted EBITDA(1) declined by $7.6 million(2) YoY, driven primarily by $10.2 million less tail revenue. $17.8 $7.6 Q2-FY25 Q2-FY26 Tail Revenue ($, MM) (57%)
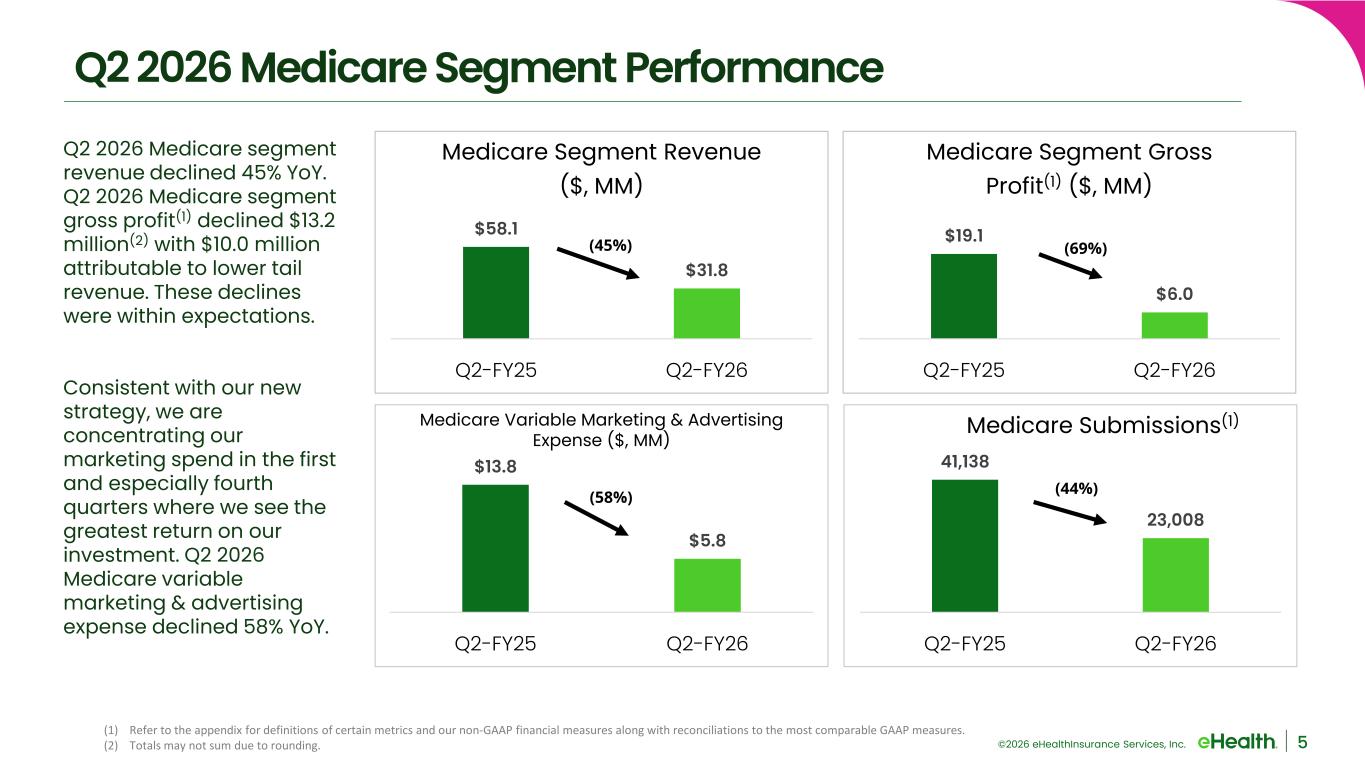
©2026 eHealthInsurance Services, Inc. $58.1 $31.8 Q2-FY25 Q2-FY26 Medicare Segment Revenue ($, MM) 5 Q2 2026 Medicare Segment Performance (1) Refer to the appendix for definitions of certain metrics and our non-GAAP financial measures along with reconciliations to the most comparable GAAP measures. (2) Totals may not sum due to rounding. Q2 2026 Medicare segment revenue declined 45% YoY. Q2 2026 Medicare segment gross profit(1) declined $13.2 million(2) with $10.0 million attributable to lower tail revenue. These declines were within expectations. Consistent with our new strategy, we are concentrating our marketing spend in the first and especially fourth quarters where we see the greatest return on our investment. Q2 2026 Medicare variable marketing & advertising expense declined 58% YoY. $19.1 $6.0 Q2-FY25 Q2-FY26 Medicare Segment Gross Profit(1) ($, MM) 41,138 23,008 Q2-FY25 Q2-FY26 Medicare Submissions(1) (44%) $13.8 $5.8 Q2-FY25 Q2-FY26 (58%) Medicare Variable Marketing & Advertising Expense ($, MM) (45%) (69%)
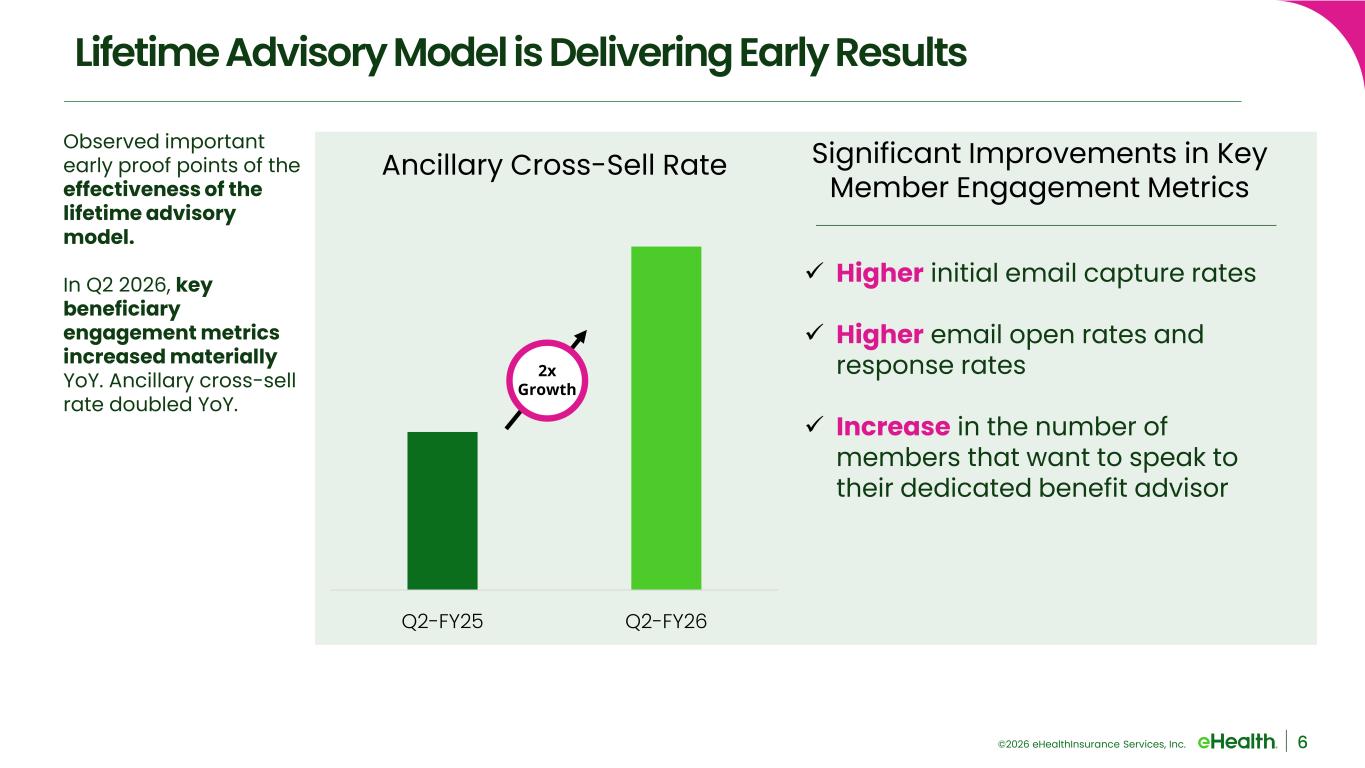
©2026 eHealthInsurance Services, Inc. 6 Lifetime Advisory Model is Delivering Early Results Observed important early proof points of the effectiveness of the lifetime advisory model. In Q2 2026, key beneficiary engagement metrics increased materially YoY. Ancillary cross-sell rate doubled YoY. Q2-FY25 Q2-FY26 Ancillary Cross-Sell Rate 2x Growth Significant Improvements in Key Member Engagement Metrics Higher initial email capture rates Higher email open rates and response rates Increase in the number of members that want to speak to their dedicated benefit advisor
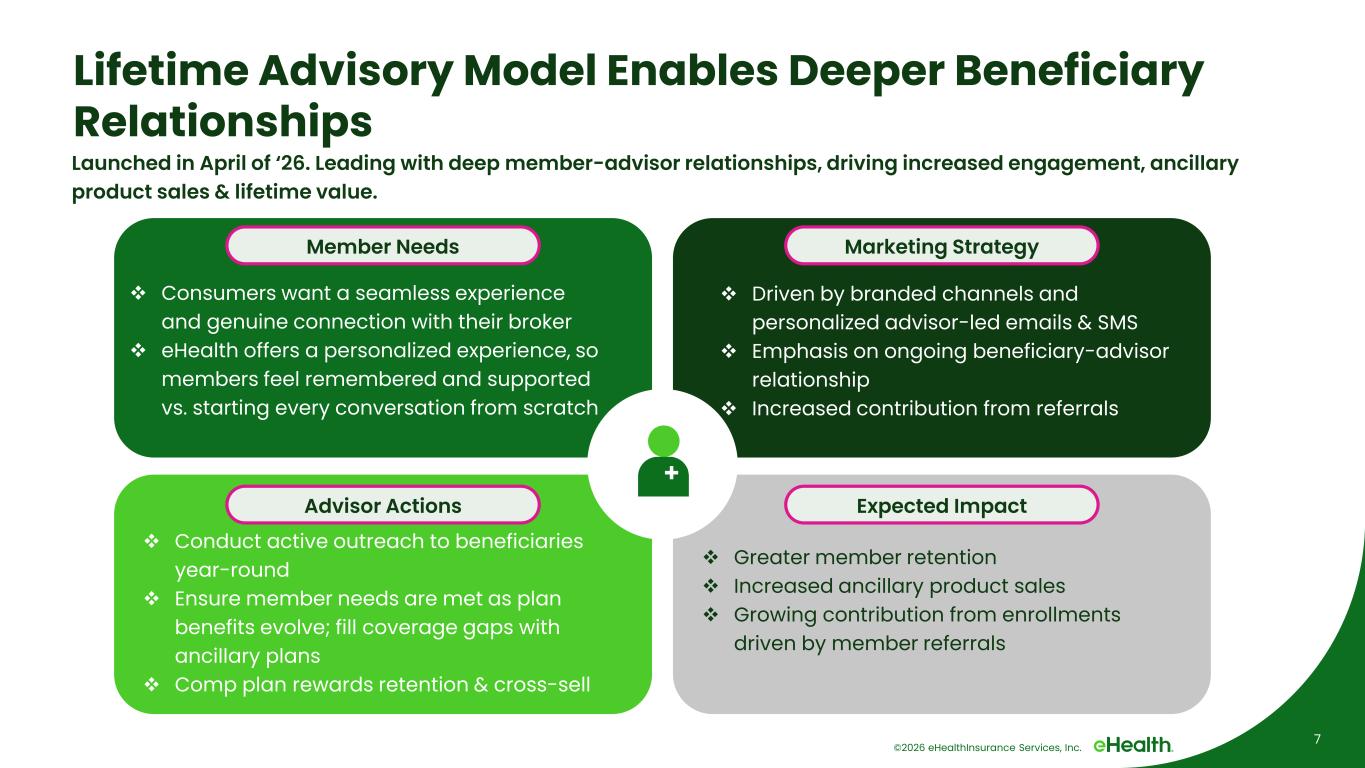
7 Lifetime Advisory Model Enables Deeper Beneficiary Relationships Launched in April of ‘26. Leading with deep member-advisor relationships, driving increased engagement, ancillary product sales & lifetime value. ©2026 eHealthInsurance Services, Inc. Member Needs Consumers want a seamless experience and genuine connection with their broker eHealth offers a personalized experience, so members feel remembered and supported vs. starting every conversation from scratch Advisor Actions Conduct active outreach to beneficiaries year-round Ensure member needs are met as plan benefits evolve; fill coverage gaps with ancillary plans Comp plan rewards retention & cross-sell Expected Impact Marketing Strategy Driven by branded channels and personalized advisor-led emails & SMS Emphasis on ongoing beneficiary-advisor relationship Increased contribution from referrals Greater member retention Increased ancillary product sales Growing contribution from enrollments driven by member referrals
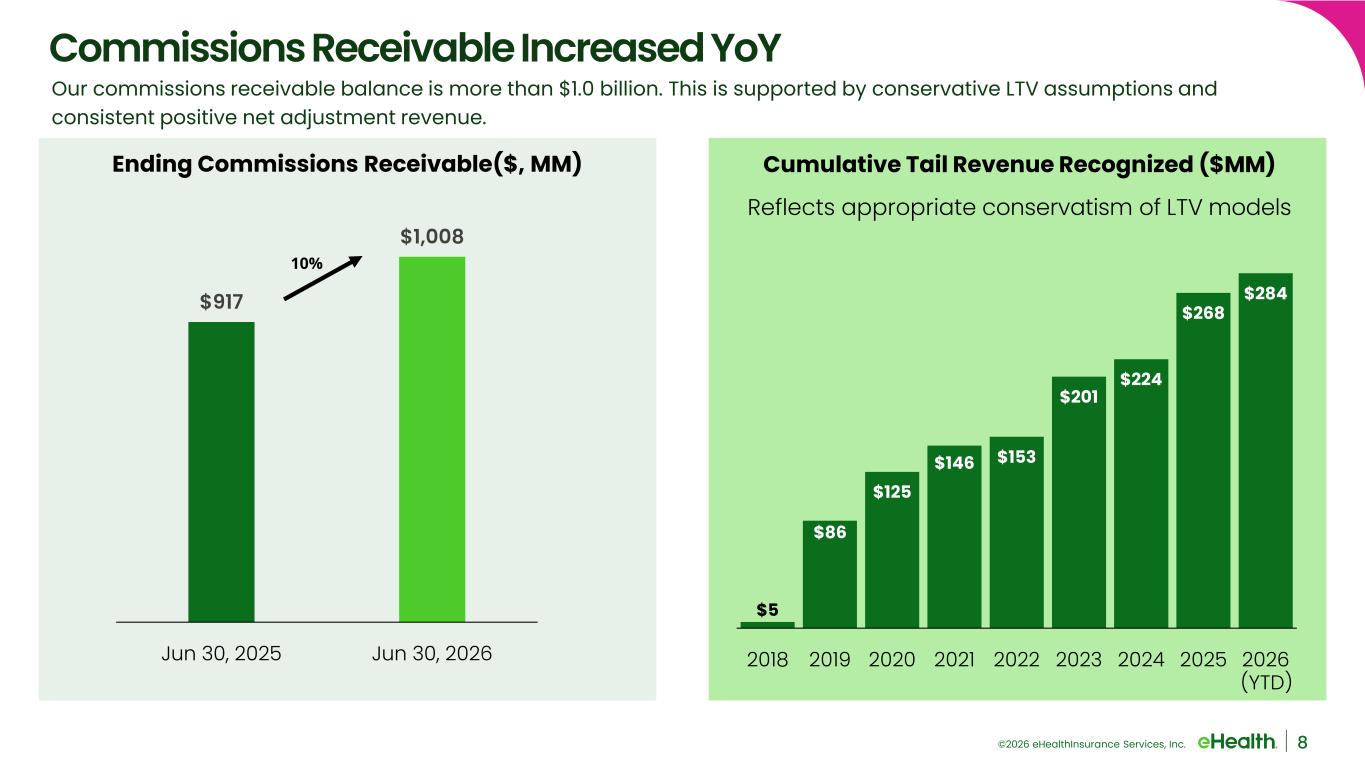
©2026 eHealthInsurance Services, Inc. Cumulative Tail Revenue Recognized ($MM) Reflects appropriate conservatism of LTV models $5 $86 $125 $146 $153 $201 $224 $268 $284 2018 2019 2020 2021 2022 2023 2024 2025 2026 Commissions Receivable Increased YoY $917 $1,008 Jun 30, 2025 Jun 30, 2026 Ending Commissions Receivable($, MM) 10% Our commissions receivable balance is more than $1.0 billion. This is supported by conservative LTV assumptions and consistent positive net adjustment revenue. (YTD) 8
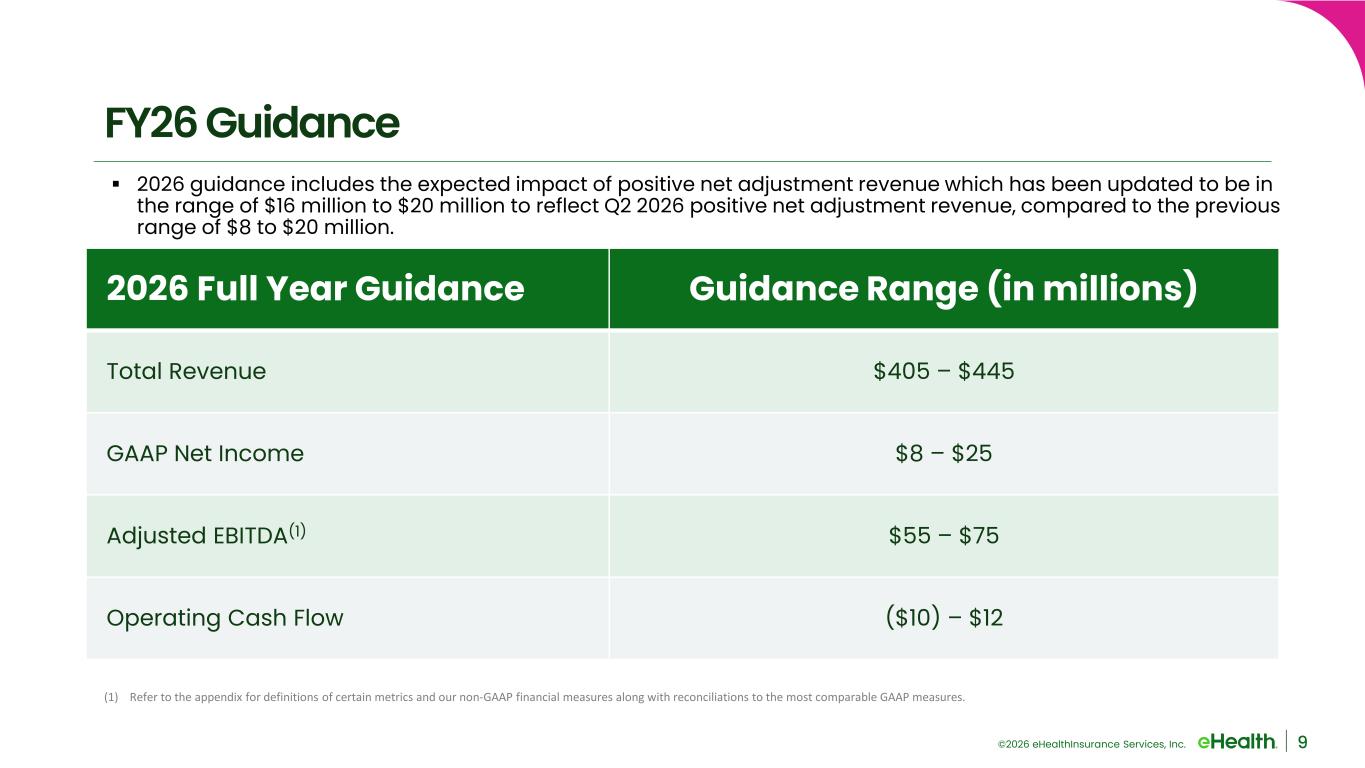
©2026 eHealthInsurance Services, Inc. 9 FY26 Guidance (1) Refer to the appendix for definitions of certain metrics and our non-GAAP financial measures along with reconciliations to the most comparable GAAP measures. 2026 Full Year Guidance Guidance Range (in millions) Total Revenue $405 – $445 GAAP Net Income $8 – $25 Adjusted EBITDA(1) $55 – $75 Operating Cash Flow ($10) – $12 2026 guidance includes the expected impact of positive net adjustment revenue which has been updated to be in the range of $16 million to $20 million to reflect Q2 2026 positive net adjustment revenue, compared to the previous range of $8 to $20 million.
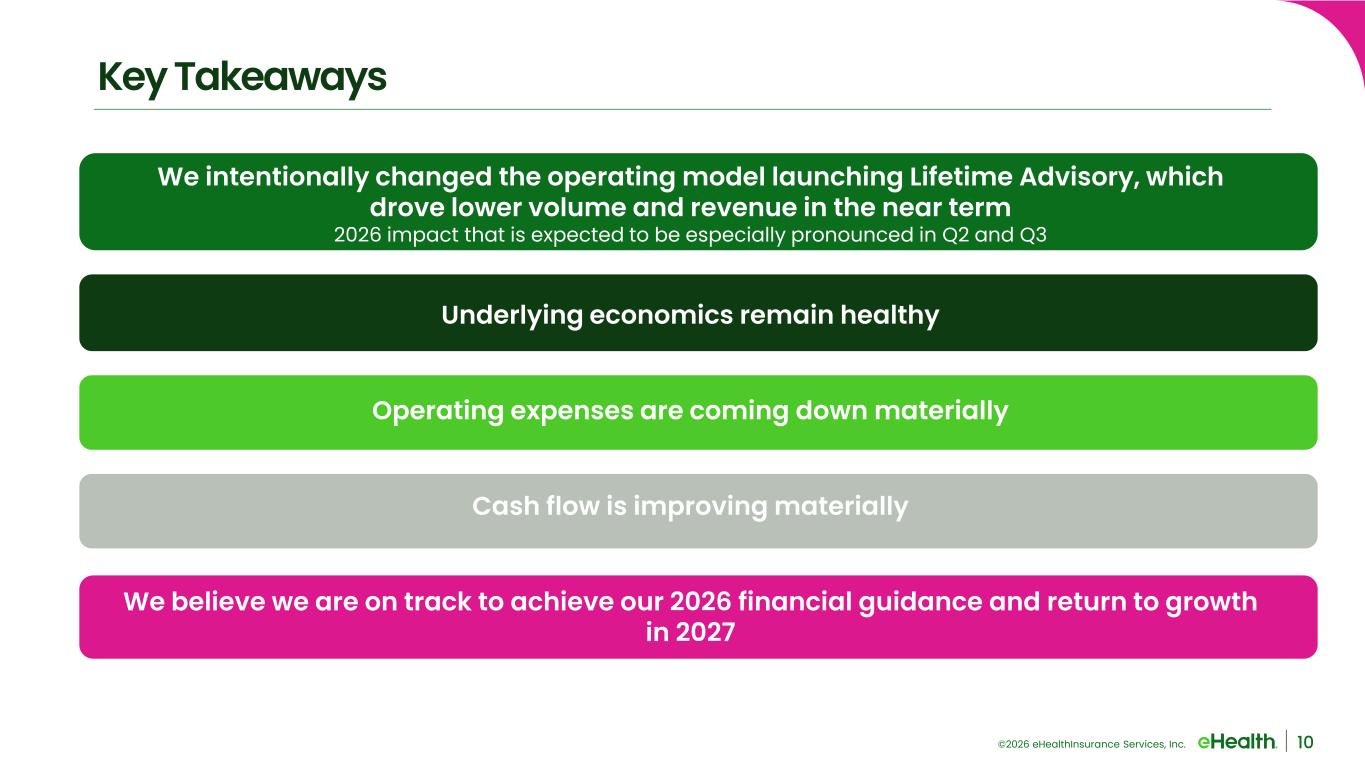
©2026 eHealthInsurance Services, Inc. 10 Key Takeaways We intentionally changed the operating model launching Lifetime Advisory, which drove lower volume and revenue in the near term 2026 impact that is expected to be especially pronounced in Q2 and Q3 Underlying economics remain healthy Operating expenses are coming down materially Cash flow is improving materially We believe we are on track to achieve our 2026 financial guidance and return to growth in 2027

©2026 eHealthInsurance Services, Inc. Appendix 11
©2026 eHealthInsurance Services, Inc. 12 Definitions Segment gross profit (loss) is calculated as total revenue for the applicable segment less variable marketing and advertising expenses, segment customer care and enrollment expenses and cost of revenue for the applicable segment. Variable marketing and advertising expenses represent costs incurred in member acquisition from our direct marketing and marketing partner channels and exclude fixed overhead costs, such as personnel related costs, consulting expenses and other operating costs allocated to the marketing and advertising department. Segment CC&E expenses include expenses we incur in assisting applicants during the enrollment process and exclude operating costs allocated to the CC&E department. Submissions describe applications that are submitted by individuals online through our eHealth platform or completed with the assistance of our benefit advisors where the individual provides authorization to the benefit advisor to submit the application to the insurance carrier partner. The individual may have additional actions to take before the application will be reviewed by the insurance carrier and not all submissions ultimately become approved members. Non-GAAP financial measures within this presentation are defined as follows: • Adjusted EBITDA is calculated by excluding dividends for preferred stock and change in preferred stock redemption value (together the “impact from preferred stock”), provision for (benefit from) income taxes, depreciation and amortization, stock- based compensation expense, impairment, restructuring and other charges, interest expense, other income (expense), net, and other non-recurring charges from GAAP net income (loss) attributable to common stockholders. Other non-recurring charges to GAAP net income (loss) attributable to common stockholders may include transaction expenses in connection with capital raising transactions (whether debt, equity or equity-linked) and acquisitions, whether or not consummated, purchase price adjustments and the cumulative effect of a change in accounting principles.
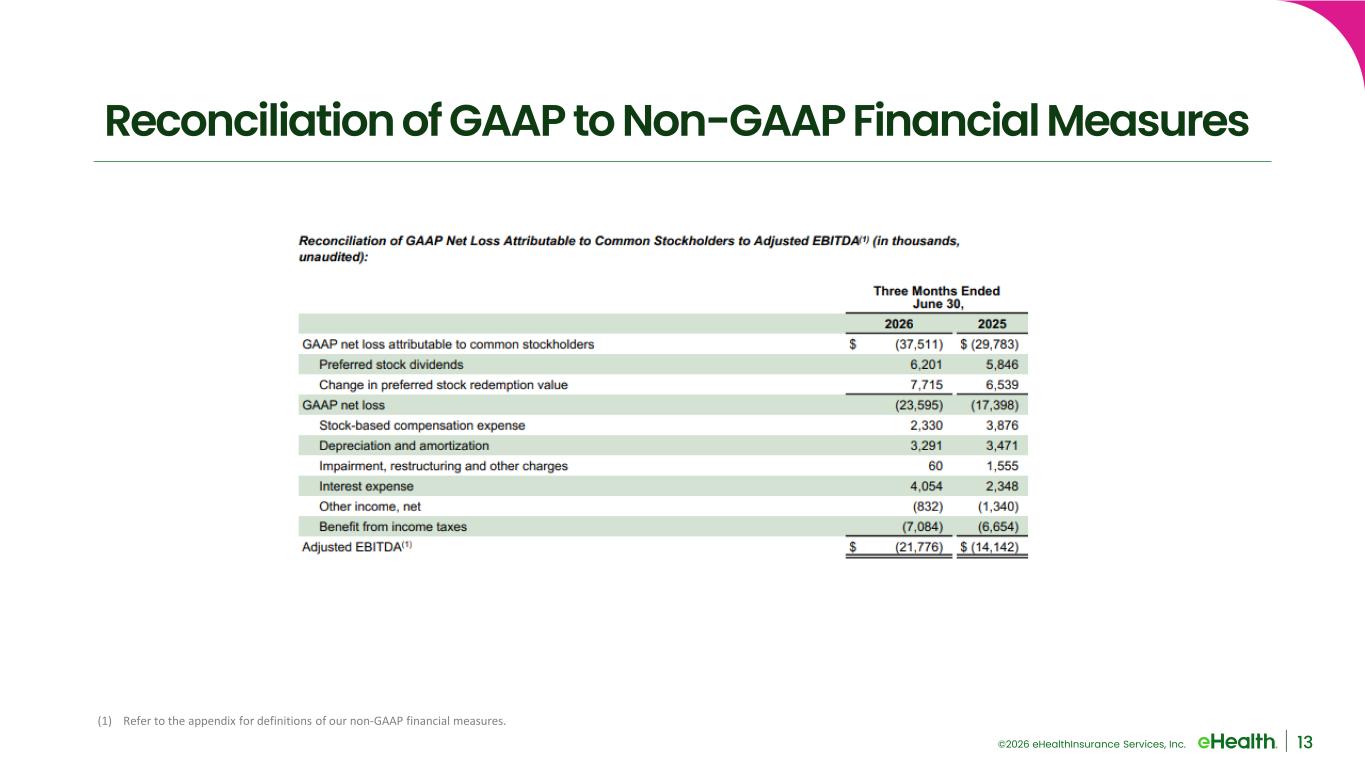
©2026 eHealthInsurance Services, Inc. 13 (1) Refer to the appendix for definitions of our non-GAAP financial measures. Reconciliation of GAAP to Non-GAAP Financial Measures
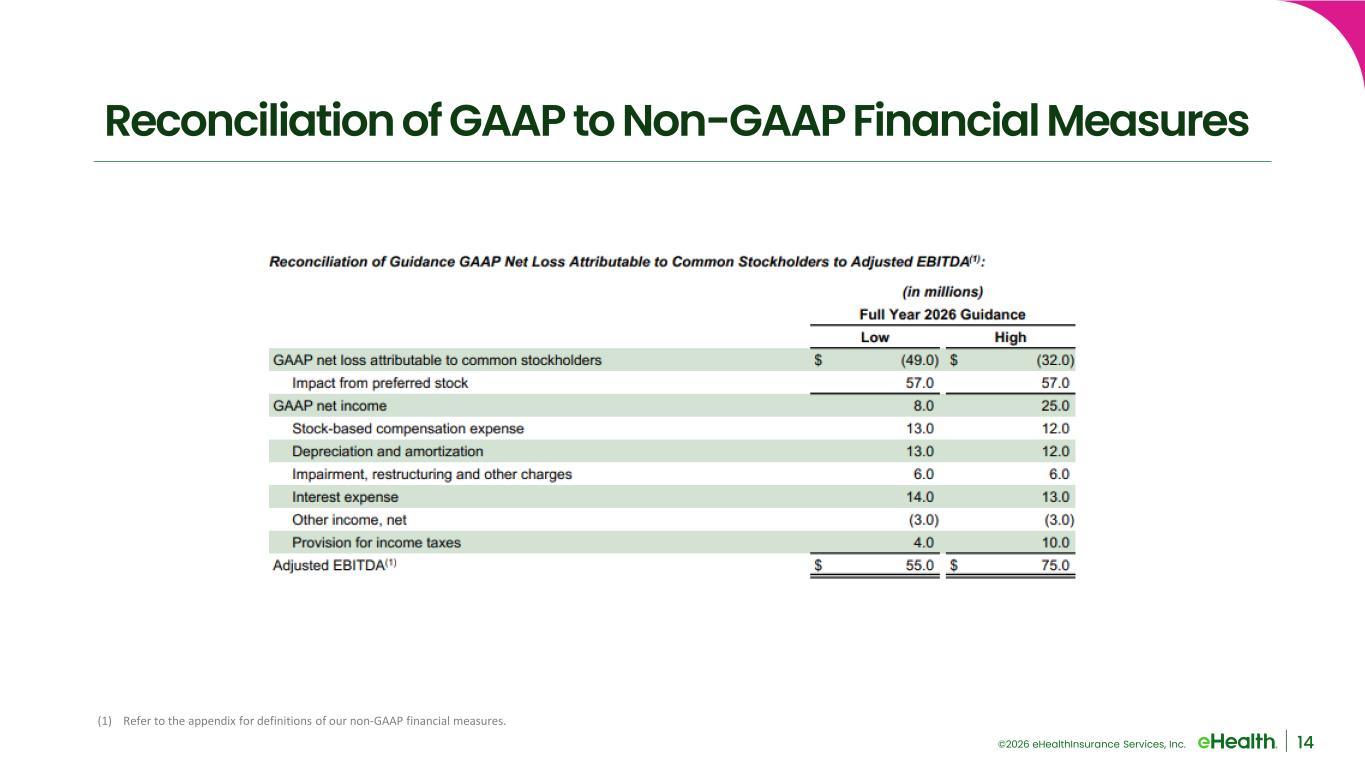
©2026 eHealthInsurance Services, Inc. 14 Reconciliation of GAAP to Non-GAAP Financial Measures (1) Refer to the appendix for definitions of our non-GAAP financial measures.