Report of the directors financial review risk report
Jun. 30, 2026
Summary of credit risk (excluding debt instruments measured at FVOCI) by stage distribution and ECL coverage by industry sector | |||||||||||||||
Gross carrying/nominal amount1 | Allowance for ECL | ECL coverage % | |||||||||||||
Stage 1 | Stage 2 | Stage 3 | POCI2 | Total | Stage 1 | Stage 2 | Stage 3 | POCI2 | Total | Stage 1 | Stage 2 | Stage 3 | POCI2 | Total | |
$m | $m | $m | $m | $m | $m | $m | $m | $m | $m | % | % | % | % | % | |
Loans and advances to customers at amortised cost | 923,849 | 85,657 | 24,004 | 336 | 1,033,846 | (1,282) | (2,397) | (7,986) | (76) | (11,741) | 0.1 | 2.8 | 33.3 | 22.6 | 1.1 |
– personal | 455,230 | 22,871 | 3,911 | — | 482,012 | (690) | (1,233) | (883) | — | (2,806) | 0.2 | 5.4 | 22.6 | — | 0.6 |
– corporate and commercial | 369,336 | 58,416 | 18,958 | 143 | 446,853 | (529) | (1,127) | (6,317) | (76) | (8,049) | 0.1 | 1.9 | 33.3 | 53.1 | 1.8 |
– non-bank financial institutions | 99,283 | 4,370 | 1,135 | 193 | 104,981 | (63) | (37) | (786) | — | (886) | 0.1 | 0.8 | 69.3 | — | 0.8 |
Loans and advances to banks at amortised cost | 110,258 | 280 | 1 | — | 110,539 | (7) | (2) | (1) | — | (10) | — | 0.7 | 100.0 | — | — |
Other financial assets measured at amortised cost | 963,708 | 1,854 | 262 | 6 | 965,830 | (93) | (19) | (45) | — | (157) | — | 1.0 | 17.2 | — | — |
Loan and other credit-related commitments | 757,187 | 20,282 | 944 | 4 | 778,417 | (157) | (103) | (107) | — | (367) | — | 0.5 | 11.3 | — | — |
– personal | 278,508 | 2,023 | 89 | — | 280,620 | (20) | (5) | — | — | (25) | — | 0.2 | — | — | — |
– corporate and commercial | 248,768 | 15,851 | 855 | 4 | 265,478 | (125) | (94) | (107) | — | (326) | 0.1 | 0.6 | 12.5 | — | 0.1 |
– financial | 229,911 | 2,408 | — | — | 232,319 | (12) | (4) | — | — | (16) | — | 0.2 | — | — | — |
Financial guarantees | 16,825 | 1,802 | 257 | — | 18,884 | (10) | (12) | (66) | — | (88) | 0.1 | 0.7 | 25.7 | — | 0.5 |
– personal | 1,432 | — | — | — | 1,432 | (1) | — | — | — | (1) | 0.1 | — | — | — | 0.1 |
– corporate and commercial | 10,536 | 1,522 | 255 | — | 12,313 | (8) | (12) | (66) | — | (86) | 0.1 | 0.8 | 25.9 | — | 0.7 |
– financial | 4,857 | 280 | 2 | — | 5,139 | (1) | — | — | — | (1) | — | — | — | — | — |
At 30 Jun 2026 | 2,771,827 | 109,875 | 25,468 | 346 | 2,907,516 | (1,549) | (2,533) | (8,205) | (76) | (12,363) | 0.1 | 2.3 | 32.2 | 22.0 | 0.4 |
Loans and advances to customers at amortised cost | 893,433 | 80,936 | 24,389 | 333 | 999,091 | (1,201) | (2,318) | (7,097) | (76) | (10,692) | 0.1 | 2.9 | 29.1 | 22.8 | 1.1 |
– personal | 446,696 | 23,887 | 3,945 | — | 474,528 | (667) | (1,235) | (895) | — | (2,797) | 0.1 | 5.2 | 22.7 | — | 0.6 |
– corporate and commercial | 349,763 | 54,636 | 19,966 | 140 | 424,505 | (478) | (1,064) | (5,909) | (75) | (7,526) | 0.1 | 1.9 | 29.6 | 53.6 | 1.8 |
– non-bank financial institutions | 96,974 | 2,413 | 478 | 193 | 100,058 | (56) | (19) | (293) | (1) | (369) | 0.1 | 0.8 | 61.3 | 0.5 | 0.4 |
Loans and advances to banks at amortised cost | 108,336 | 132 | 1 | — | 108,469 | (4) | (2) | (1) | — | (7) | — | 1.5 | 100.0 | — | — |
Other financial assets measured at amortised cost | 888,491 | 1,651 | 184 | — | 890,326 | (76) | (11) | (42) | — | (129) | — | 0.7 | 22.8 | — | — |
Loan and other credit-related commitments | 669,648 | 20,488 | 652 | 4 | 690,792 | (149) | (97) | (69) | — | (315) | — | 0.5 | 10.6 | — | — |
– personal | 270,494 | 1,945 | 92 | — | 272,531 | (22) | (5) | — | — | (27) | — | 0.3 | — | — | — |
– corporate and commercial | 255,740 | 14,649 | 560 | 4 | 270,953 | (115) | (88) | (69) | — | (272) | — | 0.6 | 12.3 | — | 0.1 |
– financial | 143,414 | 3,894 | — | — | 147,308 | (12) | (4) | — | — | (16) | — | 0.1 | — | — | — |
Financial guarantees | 15,913 | 1,371 | 192 | — | 17,476 | (8) | (17) | (26) | — | (51) | 0.1 | 1.2 | 13.5 | — | 0.3 |
– personal | 1,446 | — | — | — | 1,446 | (1) | — | — | — | (1) | 0.1 | — | — | — | 0.1 |
– corporate and commercial | 10,071 | 1,287 | 190 | — | 11,548 | (6) | (17) | (26) | — | (49) | 0.1 | 1.3 | 13.7 | — | 0.4 |
– financial | 4,396 | 84 | 2 | — | 4,482 | (1) | — | — | — | (1) | — | — | — | — | — |
At 31 Dec 2025 | 2,575,821 | 104,578 | 25,418 | 337 | 2,706,154 | (1,438) | (2,445) | (7,235) | (76) | (11,194) | 0.1 | 2.3 | 28.5 | 22.6 | 0.4 |
1Represents the maximum amount at risk should the contracts be fully drawn upon and clients default.
2Purchased or originated credit-impaired (‘POCI‘).
due (‘DPD’) and are transferred from stage 1 to stage 2. The following disclosure presents the ageing of stage 2 financial assets by those less than
30 and greater than 30 DPD and therefore presents those financial assets classified as stage 2 due to ageing (30 DPD) and those identified at an
earlier stage (less than 30 DPD).
Stage 2 days past due analysis | ||||||||||||
Gross carrying amount | Allowance for ECL | ECL coverage % | ||||||||||
Stage 2 | Up-to- date | 1 to 29 DPD1 | 30 and > DPD1 | Stage 2 | Up-to- date | 1 to 29 DPD1 | 30 and > DPD1 | Stage 2 | Up-to- date | 1 to 29 DPD | 30 and > DPD | |
At 30 Jun 2026 | $m | $m | $m | $m | $m | $m | $m | $m | % | % | % | % |
Loans and advances to customers at amortised cost | 85,657 | 82,087 | 2,225 | 1,345 | (2,397) | (1,922) | (224) | (251) | 2.8 | 2.3 | 10.1 | 18.7 |
– personal | 22,871 | 20,547 | 1,504 | 820 | (1,233) | (815) | (188) | (230) | 5.4 | 4.0 | 12.5 | 28.0 |
– corporate and commercial | 58,416 | 57,490 | 546 | 380 | (1,127) | (1,070) | (36) | (21) | 1.9 | 1.9 | 6.6 | 5.5 |
– non-bank financial institutions | 4,370 | 4,050 | 175 | 145 | (37) | (37) | — | — | 0.8 | 0.9 | — | — |
Loans and advances to banks at amortised cost | 280 | 280 | — | — | (2) | (2) | — | — | 0.7 | 0.7 | — | — |
Other financial assets measured at amortised cost | 1,854 | 1,772 | 59 | 23 | (19) | (16) | (2) | (1) | 1.0 | 0.9 | 3.4 | 2.6 |
At 31 Dec 2025 | ||||||||||||
Loans and advances to customers at amortised cost | 80,936 | 77,615 | 1,894 | 1,427 | (2,318) | (1,837) | (211) | (270) | 2.9 | 2.4 | 11.1 | 18.9 |
– personal | 23,887 | 21,481 | 1,483 | 923 | (1,235) | (797) | (188) | (250) | 5.2 | 3.7 | 12.7 | 27.1 |
– corporate and commercial | 54,636 | 53,898 | 400 | 338 | (1,064) | (1,024) | (23) | (17) | 1.9 | 1.9 | 5.8 | 5.0 |
– non-bank financial institutions | 2,413 | 2,236 | 11 | 166 | (19) | (16) | — | (3) | 0.8 | 0.7 | — | 1.8 |
Loans and advances to banks at amortised cost | 132 | 132 | — | — | (2) | (2) | — | — | 1.5 | 1.5 | — | — |
Other financial assets measured at amortised cost | 1,651 | 1,611 | 21 | 19 | (11) | (10) | — | (1) | 0.7 | 0.6 | — | 5.3 |
1The DPD amounts are presented on a contractual basis.
Measurement uncertainty and sensitivity analysis of ECL estimatesThe recognition and measurement of ECL involves the use of
significant judgement and estimation. We form multiple scenarios
based on economic forecasts and distributional estimates and apply
these to credit risk models to estimate future credit losses. The results
are then probability-weighted to determine an unbiased ECL estimate.
Management assessed the current economic environment, reviewed
the latest economic forecasts and discussed key risks before selecting
the economic scenarios and their weightings.
Management judgemental adjustments are used where modelled
allowance for ECL does not fully reflect the identified risks and related
uncertainty, or to capture significant late-breaking eventsMethodologyAt 30 June 2026, four scenarios were used to capture the latest
economic expectations and to articulate management’s view of the
range of risks and potential outcomes. Scenarios are updated with the
latest economic forecasts and distributional estimates in each quarter.
We derive three scenarios, the consensus Upside, Central and
Downside, from external consensus forecasts, market data and
distributional estimates that cover the entire range of economic
outcomes. These estimates are used as conditioning assumptions in a
modelled expansion of other variables to ensure scenarios are
economically coherent and internally consistent. The fourth scenario,
the Downside 2, represents management’s view of severe downside
risks.
The consensus Central scenario is deemed the ‘most likely’ scenario
and will, in most circumstances, attract the largest probability
weighting. The consensus Upside and Downside scenarios represent
short-term cyclical deviations from the Central scenario, where variable
paths eventually converge back to long-term trend expectations. They
are calibrated to a 10% probability.
The Downside 2 explores a more extreme economic outcome than
captured by the consensus scenarios. In this scenario, variables do not,
by design, revert to long-term trend expectations and may instead
explore alternative outcomes. It is calibrated to a 5% probability.
In most circumstances, the alignment of weightings with the calibrated
probability of scenarios is deemed appropriate for the unbiased
estimation of ECL. However, management may depart from this
probability-based scenario weighting approach when the economic
outlook and forecasts are determined to be particularly uncertain and
risks are elevated.
In the first quarter of 2026, the start of the conflict in the Middle East
prompted the addition of a fifth scenario to supplement the standard
four. The Downside 1 scenario was a regional conflict scenario that
incorporated a sharp increase in oil prices, leading to higher inflation
and a tightening of global financial conditions. Growth in the scenario
was weaker than in the Central scenario in our major markets, with the
Middle East particularly adversely affected.
The Downside 1 scenario was introduced because the Central scenario
was based on forecasts produced before the conflict began, and
because the outer scenarios for most markets were calibrated as
demand shocks linked to higher US tariff rates, and therefore did not
capture a supply-side energy shock.
During the second quarter of 2026 the Downside 1 scenario was
demised as the standard scenarios were assessed to adequately
reflect the expected implications and risks from the conflict.
The Central scenario was judged to have been updated to incorporate
the anticipated effects of the conflict, while the outer scenarios were
adjusted to reflect supply-side shocks, driven by higher energy prices
from protracted conflict in the Middle East. In the standard downside
scenarios, inflation and interest rates increase relative to the Central
scenario.
Scenario weights were also adjusted during the quarter to reflect an
assessment that risks around the Central scenario were more
adversely skewed. The Central scenario weighting was left unchanged,
but the weighting on the consensus Upside scenario was reduced to
reflect the conflict’s likely lasting impact on confidence. The weighting
applied to the consensus Downside scenario was increased, given the
higher risk of a longer and more damaging conflict than implied by the
distribution.
Description of economic scenariosThe economic assumptions presented in this section are formed by
HSBC with reference to external forecasts and estimates for the
purpose of calculating ECL.
Forecasts may change and remain subject to uncertainty. Outer
scenarios are designed to capture potential crystallisation of key
economic and financial risks and alternative paths for economic
variables.
The scenarios used to calculate ECL are described below.
The consensus Central scenarioHSBC’s Central scenario reflects the impact of the energy price shock
resulting from the conflict in the Middle East. Relative to the fourth
quarter of 2025, forecast growth is weaker and inflation is higher.
Policy interest rates are higher across most major markets in 2026–27,
reflecting expected central bank tightening in response to higher oil
prices and inflation.
The notable exceptions are the Chinese mainland, Hong Kong and the
US, where annual growth forecasts have improved relative to the
fourth quarter of 2025, supported by stronger-than-expected recent
activity. The improvements to annual forecasts partly reflect base
effects rather than a material strengthening of underlying quarter-on-
quarter momentum.
The largest revision is to Hong Kong GDP, reflecting an improvement in
first quarter growth driven by a build-up of trade-related inventories.
Activity has also been supported by stronger financial sector
performance and a revival in residential real estate transactions.
Global GDP is expected to grow by 2.6% in 2026 in the Central
scenario and the average rate of global GDP growth is forecast to be
2.7% over the entire forecast period.
The key features of our Central scenario include:
–Growth is forecast to remain positive across our major markets, but
to slow over the remainder of 2026, due to the impact of conflict in
the Middle East on confidence and activity. The exception is the
UAE where the economy is assumed to be in recession.
–The price of Brent crude oil is projected to peak in the second
quarter of 2026 and is lower over the remainder of the year as the
oil market rebalances. The price is forecast to average $91/bbl
during 2026 and $80/bbl in 2027.
–Higher energy prices are expected to lift inflation across our major
markets, although second-order impacts to wages and service
inflation are assumed to be limited. In most markets, inflation is
expected to ease back towards central bank targets in 2027.
–Major central banks are forecast to tighten policy during 2026 to
keep inflation expectations anchored. Policy easing is then forecast
in 2027, as the energy supply shock unwinds.
–In most markets, unemployment is forecast to rise moderately,
consistent with weaker economic growth and subdued business
confidence that constrains hiring.
–House prices in the Chinese mainland are expected to continue to
fall. In Hong Kong, house prices are forecast to improve further as
buyer interest recovers. In the UK and US, house price growth is
projected to remain positive but subdued.
The Central scenario was created from consensus forecasts available at
the end of May, and reviewed continually until the end of June 2026.
The following table describes key macroeconomic variables in the consensus Central scenario.Consensus Central scenario | ||||||||||||||
3Q26-2Q31 (as at 2Q26) | 2026–2030 (as at 4Q25) | |||||||||||||
UK | US | Hong Kong | Chinese mainland | France | UAE | Mexico | UK | US | Hong Kong | Chinese mainland | France | UAE | Mexico | |
GDP (annual average growth rate, %) | ||||||||||||||
2026 | 0.8 | 2.1 | 3.9 | 4.7 | 0.7 | (0.7) | 1.2 | 1.1 | 1.9 | 2.3 | 4.4 | 0.9 | 4.7 | 1.3 |
2027 | 1.2 | 2.0 | 2.6 | 4.4 | 0.9 | 7.2 | 1.8 | 1.4 | 2.0 | 2.3 | 4.2 | 1.2 | 4.1 | 2.0 |
2028 | 1.5 | 2.1 | 2.3 | 4.2 | 1.2 | 3.9 | 2.0 | 1.5 | 2.1 | 2.3 | 4.0 | 1.3 | 3.8 | 2.2 |
2029 | 1.5 | 2.1 | 2.2 | 4.1 | 1.2 | 3.7 | 2.1 | 1.5 | 2.1 | 2.4 | 3.8 | 1.3 | 3.5 | 2.2 |
2030 | 1.5 | 2.1 | 2.2 | 4.0 | 1.2 | 3.4 | 2.2 | 1.5 | 2.0 | 2.4 | 3.8 | 1.3 | 3.5 | 2.2 |
5-year average1 | 1.4 | 2.0 | 2.4 | 4.2 | 1.1 | 4.0 | 2.0 | 1.4 | 2.0 | 2.3 | 4.0 | 1.2 | 3.9 | 2.0 |
Unemployment rate (%) | ||||||||||||||
2026 | 5.3 | 4.4 | 3.6 | 5.2 | 7.9 | 2.5 | 2.8 | 4.9 | 4.4 | 3.6 | 5.2 | 7.6 | 2.5 | 3.2 |
2027 | 5.2 | 4.4 | 3.4 | 5.1 | 7.8 | 2.2 | 3.0 | 4.7 | 4.3 | 3.4 | 5.2 | 7.6 | 2.4 | 3.2 |
2028 | 5.0 | 4.2 | 3.1 | 5.1 | 7.6 | 2.1 | 3.0 | 4.7 | 4.1 | 3.1 | 5.1 | 7.5 | 2.4 | 3.2 |
2029 | 4.8 | 4.2 | 3.0 | 5.0 | 7.5 | 2.1 | 3.0 | 4.7 | 4.1 | 3.0 | 5.0 | 7.4 | 2.4 | 3.1 |
2030 | 4.6 | 4.1 | 2.9 | 5.0 | 7.4 | 2.0 | 3.0 | 4.7 | 4.1 | 3.0 | 5.0 | 7.4 | 2.4 | 3.1 |
5-year average1 | 4.9 | 4.2 | 3.2 | 5.1 | 7.6 | 2.1 | 3.0 | 4.7 | 4.2 | 3.2 | 5.1 | 7.5 | 2.4 | 3.2 |
House prices (annual average growth rate, %) | ||||||||||||||
2026 | 1.7 | 1.7 | 8.1 | (5.1) | 1.7 | 2.4 | 6.6 | 1.2 | 1.1 | 0.5 | (1.6) | 4.3 | 5.8 | 4.8 |
2027 | 1.6 | 1.7 | 4.2 | 0.1 | 4.4 | 0.4 | 4.3 | 2.8 | 1.9 | 1.5 | 2.1 | 5.0 | 3.2 | 4.5 |
2028 | 1.8 | 2.5 | 4.1 | 2.5 | 4.0 | 2.3 | 4.5 | 3.3 | 2.7 | 2.5 | 3.5 | 4.1 | 2.3 | 4.4 |
2029 | 2.4 | 2.8 | 3.7 | 3.1 | 3.1 | 2.0 | 4.3 | 2.7 | 3.2 | 2.1 | 3.4 | 3.1 | 2.0 | 4.3 |
2030 | 2.5 | 3.0 | 3.3 | 2.4 | 2.4 | 2.1 | 4.3 | 2.4 | 3.2 | 2.1 | 2.3 | 2.2 | 2.1 | 4.2 |
5-year average1 | 2.1 | 2.5 | 4.2 | 1.4 | 3.3 | 1.4 | 4.4 | 2.5 | 2.4 | 1.8 | 1.9 | 3.7 | 3.1 | 4.4 |
Inflation (annual average growth rate, %) | ||||||||||||||
2026 | 3.2 | 3.4 | 1.9 | 1.0 | 2.0 | 2.9 | 4.0 | 2.5 | 2.9 | 1.8 | 0.7 | 1.4 | 2.0 | 3.7 |
2027 | 2.5 | 2.4 | 1.8 | 1.1 | 1.6 | 1.8 | 3.7 | 2.1 | 2.3 | 1.9 | 1.2 | 1.7 | 1.9 | 3.6 |
2028 | 2.0 | 2.2 | 2.0 | 1.4 | 1.7 | 1.9 | 3.5 | 2.1 | 2.2 | 2.0 | 1.4 | 2.1 | 1.9 | 3.5 |
2029 | 2.1 | 2.2 | 2.1 | 1.5 | 2.0 | 1.9 | 3.4 | 2.0 | 2.2 | 2.2 | 1.5 | 2.1 | 2.0 | 3.4 |
2030 | 2.0 | 2.2 | 2.2 | 1.6 | 1.9 | 1.8 | 3.5 | 2.0 | 2.2 | 2.2 | 1.5 | 1.9 | 2.0 | 3.4 |
5-year average1 | 2.3 | 2.4 | 2.0 | 1.4 | 1.9 | 1.9 | 3.6 | 2.2 | 2.4 | 2.0 | 1.3 | 1.9 | 1.9 | 3.5 |
Central bank policy rate (annual average, %)2 | ||||||||||||||
2026 | 3.9 | 3.7 | 4.1 | 3.0 | 2.3 | 3.7 | 6.8 | 3.5 | 3.4 | 3.8 | 3.0 | 1.9 | 3.5 | 7.0 |
2027 | 4.3 | 3.9 | 4.3 | 3.1 | 2.7 | 4.0 | 7.6 | 3.4 | 3.1 | 3.5 | 3.0 | 2.0 | 3.1 | 7.2 |
2028 | 4.1 | 3.9 | 4.3 | 3.1 | 2.6 | 3.9 | 8.3 | 3.5 | 3.2 | 3.6 | 3.1 | 2.1 | 3.3 | 7.5 |
2029 | 4.1 | 3.9 | 4.2 | 3.2 | 2.7 | 3.9 | 8.6 | 3.7 | 3.4 | 3.8 | 3.1 | 2.3 | 3.4 | 7.7 |
2030 | 4.2 | 3.9 | 4.3 | 3.3 | 2.8 | 4.0 | 8.7 | 3.8 | 3.6 | 3.9 | 3.2 | 2.5 | 3.6 | 7.9 |
5-year average1 | 4.2 | 3.9 | 4.3 | 3.2 | 2.7 | 3.9 | 8.2 | 3.6 | 3.3 | 3.7 | 3.1 | 2.2 | 3.4 | 7.5 |
1The five-year average is calculated over the 20 quarter projection. For the 2Q26 scenario this is from 3Q26 to 2Q31. For the 4Q25 scenario it is from 1Q26 to 4Q30.
2For the Chinese mainland, rate shown is the Loan Prime Rate.
The consensus Upside scenarioCompared with the Central scenario, the consensus Upside scenario
features stronger economic activity in the near term, before
converging to long-run trend expectations. It incorporates lower
unemployment and higher asset prices than in the Central scenario.
The scenario is consistent with a number of key upside risk themes.
These include a de-escalation in geopolitical tensions, a partial rollback
of tariff measures, and an improvement in the US-China relationship.
The following table describes key macroeconomic variables in the consensus Upside scenario.
Consensus Upside scenario (3Q26–2Q31) | ||||||||||||||
UK | US | Hong Kong | Chinese mainland | France | UAE | Mexico | ||||||||
GDP level (%, start-to-peak)1 | 11.4 | (2Q31) | 15.3 | (2Q31) | 19.3 | (2Q31) | 29.6 | (2Q31) | 8.1 | (2Q31) | 40.4 | (2Q31) | 16.6 | (2Q31) |
Unemployment rate (%, min)2 | 3.5 | (2Q28) | 3.6 | (2Q28) | 2.8 | (2Q28) | 4.7 | (2Q28) | 6.9 | (2Q28) | 1.8 | (2Q28) | 2.5 | (1Q27) |
House price index (%, start-to-peak)1 | 17.5 | (2Q31) | 23.3 | (2Q31) | 30.4 | (2Q31) | 12.5 | (2Q31) | 19.5 | (2Q31) | 18.3 | (2Q31) | 29.3 | (2Q31) |
Inflation rate (YoY % change, min)3 | 1.9 | (4Q27) | 1.0 | (2Q27) | 0.4 | (2Q27) | 0.0 | (2Q27) | 0.6 | (2Q27) | 1.4 | (1Q27) | 2.4 | (2Q27) |
Central bank policy rate (%, min)3 | 3.8 | (3Q26) | 3.6 | (3Q26) | 3.9 | (3Q26) | 2.9 | (1Q27) | 2.3 | (3Q26) | 3.6 | (3Q26) | 5.7 | (4Q26) |
Consensus Upside scenario 2026–2030 (as at 4Q25) | ||||||||||||||
UK | US | Hong Kong | Chinese mainland | France | UAE | Mexico | ||||||||
GDP level (%, start-to-peak)1 | 11.0 | (4Q30) | 15.2 | (4Q30) | 20.7 | (4Q30) | 28.6 | (4Q30) | 8.5 | (4Q30) | 29.0 | (4Q30) | 16.9 | (4Q30) |
Unemployment rate (%, min)2 | 3.2 | (4Q27) | 3.5 | (4Q27) | 2.8 | (2Q28) | 4.7 | (4Q27) | 6.6 | (4Q27) | 2.0 | (4Q27) | 2.8 | (3Q26) |
House price index (%, start-to-peak)1 | 20.0 | (4Q30) | 23.2 | (4Q30) | 19.4 | (4Q30) | 14.9 | (4Q30) | 22.6 | (4Q30) | 22.2 | (4Q30) | 29.5 | (4Q30) |
Inflation rate (YoY % change, max)3 | 3.5 | (1Q26) | 3.6 | (3Q26) | 2.9 | (2Q26) | 1.5 | (4Q30) | 2.4 | (4Q27) | 3.1 | (2Q26) | 4.2 | (1Q26) |
Central bank policy rate (%, max)3 | 3.9 | (1Q26) | 3.9 | (1Q26) | 4.2 | (1Q26) | 3.4 | (1Q27) | 2.5 | (4Q30) | 3.9 | (1Q26) | 8.1 | (4Q30) |
1Cumulative change to the highest level of the series during the 20-quarter projection.
2Lowest projected unemployment rate in the scenario.
3Lowest/highest projected policy rate and year-on-year percentage change in inflation in the scenario. For the Chinese mainland, the policy rate shown is the Loan
Prime Rate.
Downside scenariosDownside scenarios explore the intensification and crystallisation of a
number of risk themes.
In the second quarter of 2026, these scenarios were designed as
supply-side shocks, in which higher energy prices push inflation higher
and weaken economic growth.
Key downside risks include:
–a prolonged conflict in the Middle East, damage to regional energy
infrastructure and sustained disruption of flows through the Strait of
Hormuz, which would push oil prices and inflation higher;
–an abrupt repricing of risk assets given elevated valuations,
particularly in the technology sector, eroding wealth effects and
increasing credit risk;
–an intensification of protectionist policies which could reduce
investment, disrupt international supply chains and lower trade
flows;
–persistent tensions between the US and China, which could weigh
on confidence and disrupt global goods trade and supply chains for
critical technologies.
The consensus Downside scenario
In the consensus Downside scenario, conflict in the Middle East
continues for longer than expected, oil prices rise and economic activity
is weaker than in the Central scenario.
In the scenario, GDP growth is weaker than in the Central scenario and
our major markets enter into recession where unemployment rises and
financial asset prices fall. The scenario assumes a prolonged disruption
to oil and gas flows through the Strait of Hormuz, leading to a
drawdown in oil inventories and a further rise in oil prices.
Oil prices are expected to peak at around $135/bbl by the end of 2026,
with flows through the Strait normalising during 2027. The energy price
shock causes inflation to rise sharply, prompting central banks to raise
policy rates.
The following table describes key macroeconomic variables in the consensus Downside scenario.
Consensus Downside scenario (3Q26–2Q31) | ||||||||||||||
UK | US | Hong Kong | Chinese mainland | France | UAE | Mexico | ||||||||
GDP level (%, start-to-trough)1 | (0.5) | (4Q26) | (0.6) | (1Q27) | (2.6) | (2Q28) | (1.9) | (4Q26) | (0.6) | (1Q27) | (1.5) | (3Q26) | (1.0) | (3Q27) |
Unemployment rate (%, max)2 | 6.6 | (2Q27) | 5.3 | (1Q27) | 4.7 | (2Q27) | 6.7 | (2Q28) | 8.8 | (1Q27) | 3.0 | (4Q26) | 3.4 | (2Q27) |
House price index (%, start-to-trough)1 | (4.4) | (3Q27) | (3.1) | (3Q27) | 0.1 | (4Q26) | (6.2) | (4Q27) | 0.2 | (3Q26) | (6.6) | (4Q26) | 0.5 | (3Q26) |
Inflation rate (YoY % change, max)3 | 4.4 | (4Q26) | 4.7 | (4Q26) | 2.7 | (2Q27) | 2.5 | (1Q27) | 3.1 | (4Q26) | 3.4 | (3Q26) | 5.9 | (2Q27) |
Central bank policy rate (%, max)3 | 4.4 | (1Q27) | 4.2 | (4Q26) | 4.6 | (4Q26) | 3.4 | (2Q31) | 2.9 | (3Q27) | 4.2 | (4Q26) | 9.3 | (1Q27) |
Consensus Downside scenario 2026–2030 (as at 4Q25) | ||||||||||||||
UK | US | Hong Kong | Chinese mainland | France | UAE | Mexico | ||||||||
GDP level (%, start-to-trough)1 | (0.2) | (2Q27) | (0.8) | (3Q26) | (1.7) | (4Q27) | (1.7) | (3Q26) | (0.4) | (3Q26) | 0.4 | (1Q26) | (1.0) | (1Q27) |
Unemployment rate (%, max)2 | 6.2 | (4Q26) | 5.3 | (3Q26) | 4.8 | (4Q26) | 6.8 | (4Q27) | 8.6 | (3Q26) | 3.2 | (3Q27) | 3.8 | (3Q26) |
House price index (%, start-to-trough)1 | (4.1) | (1Q27) | (3.1) | (1Q27) | (3.8) | (1Q27) | (5.6) | (1Q27) | 0.7 | (1Q26) | (3.4) | (2Q26) | 0.6 | (1Q26) |
Inflation rate (YoY % change, min)3 | 1.3 | (3Q26) | 3.4 | (1Q26) | 0.1 | (4Q26) | (2.9) | (4Q26) | 0.4 | (4Q26) | 0.5 | (4Q26) | 4.7 | (1Q26) |
Central bank policy rate (%, min)3 | 2.2 | (3Q28) | 4.6 | (2Q26) | 5.0 | (2Q26) | 1.5 | (4Q26) | 0.6 | (1Q27) | 4.6 | (2Q26) | 9.5 | (2Q26) |
1Cumulative change to the lowest level of the series during the 20-quarter projection.
2The highest projected unemployment rate in the scenario.
3Lowest/highest projected policy rate and year-on-year percentage change in inflation in the scenario. For the Chinese mainland, the policy rate shown is the Loan
Prime Rate.
Downside 2 scenarioThe Downside 2 scenario reflects management’s view of the tail of the
economic distribution. It incorporates the simultaneous crystallisation of
a number of risks that lead to a deep global recession, including
escalation of geopolitical risks and a more prolonged disruption to
energy supply. In this scenario, oil prices are expected to peak at $170
per barrel, consistent with conflict escalation, inventory drawdown and
substantial damage to Gulf energy infrastructure. Inflation rises sharply,
asset prices fall and unemployment rises quickly.
The economic recovery paths in the Downside 2 scenario are based on
how each market has typically recovered from past downturns, and are
calibrated to capture both the expected duration of the recovery and
the potential for longer-lasting economic effects.
The following table describes key macroeconomic variables in the
Downside 2 scenario.
Downside 2 scenario (3Q26–2Q31) | ||||||||||||||
UK | US | Hong Kong | Chinese mainland | France | UAE | Mexico | ||||||||
GDP level (%, start-to-trough)1 | (8.4) | (1Q28) | (5.5) | (1Q28) | (9.9) | (2Q28) | (9.3) | (4Q27) | (8.0) | (4Q27) | (10.4) | (4Q27) | (10.4) | (4Q27) |
Unemployment rate (%, max)2 | 10.1 | (2Q28) | 10.6 | (4Q28) | 7.0 | (2Q27) | 6.9 | (2Q28) | 10.5 | (1Q28) | 4.6 | (1Q27) | 5.2 | (4Q27) |
House price index (%, start-to-trough)1 | (34.0) | (3Q28) | (17.4) | (3Q27) | (11.6) | (3Q29) | (25.3) | (2Q28) | (11.3) | (2Q28) | (46.9) | (3Q28) | 0.5 | (3Q26) |
Inflation rate (YoY % change, max)3 | 6.6 | (4Q26) | 5.2 | (4Q26) | 3.7 | (4Q26) | 2.7 | (4Q26) | 4.2 | (1Q27) | 3.9 | (3Q26) | 5.8 | (1Q27) |
Central bank policy rate (%, max)3 | 4.7 | (4Q26) | 4.5 | (4Q26) | 4.8 | (4Q26) | 3.5 | (4Q26) | 3.1 | (4Q26) | 4.5 | (4Q26) | 9.5 | (4Q26) |
Downside 2 scenario 2026–2030 (as at 4Q25) | ||||||||||||||
UK | US | Hong Kong | Chinese mainland | France | UAE | Mexico | ||||||||
GDP level (%, start-to-trough)1 | (5.3) | (2Q27) | (4.5) | (1Q27) | (9.3) | (3Q27) | (6.0) | (1Q27) | (6.2) | (2Q27) | (5.7) | (2Q27) | (10.0) | (1Q27) |
Unemployment rate (%, max)2 | 8.9 | (2Q27) | 9.0 | (1Q28) | 7.0 | (4Q26) | 7.0 | (4Q27) | 10.7 | (4Q27) | 3.9 | (3Q26) | 5.2 | (2Q27) |
House price index (%, start-to-trough)1 | (24.2) | (4Q27) | (17.1) | (4Q26) | (19.6) | (2Q29) | (23.1) | (4Q27) | (5.9) | (3Q27) | (30.5) | (1Q28) | 0.6 | (1Q26) |
Inflation rate (YoY % change, min)3 | (1.9) | (4Q26) | 4.1 | (2Q26) | (1.7) | (2Q27) | (6.5) | (4Q26) | (0.6) | (4Q26) | 0.3 | (4Q26) | 4.8 | (1Q26) |
Central bank policy rate (%, min)3 | 1.4 | (1Q27) | 4.7 | (2Q26) | 5.0 | (2Q26) | 1.2 | (2Q27) | 0.1 | (4Q26) | 4.7 | (2Q26) | 9.9 | (2Q26) |
1Cumulative change to the lowest level of the series during the 20-quarter projection.
2The highest projected unemployment rate in the scenario.
3 Lowest/highest projected policy rate and year-on-year percentage change in inflation in the scenario. For the Chinese mainland, the policy rate shown is the Loan
Prime Rate.
Scenario weightingScenario weightings are set with reference to consensus forecast
probability distributions. Management may subsequently vary weights
where they assess that the calibration lags more recent events, or that
it does not reflect their view of the distribution of economic, financial
and geopolitical risks.
During the first quarter of 2026, the use of a fifth scenario, the
Downside 1, to capture the risks associated with conflict in the Middle
East, resulted in the reassignment of weight from the Upside and
Central scenarios. The Downside 1 received a weight of 30%, with the
Upside reduced from 10% to 5% and the Central from 75% to 50%.
The weights assigned to the standard downside scenarios remained
unchanged. Although the Downside 1 scenario was discontinued in the
second quarter of 2026, scenario weights were adjusted to reflect the
higher assessed downside risk relating to the potential duration and
impact of conflict in the Middle East.
In the second quarter of 2026, the consensus Upside scenario was
assigned a weight of 5% for most of our major markets, down from
10% at 31 December 2025. Management considered the conflict was
likely to have an enduring impact on confidence and therefore reduced
the likelihood of the Upside scenario.
Although it was noted that the oil price assumption in the Central
scenario remained uncertain, the risk was assessed to be adequately
addressed in the downside scenarios, in which oil prices are assumed
to rise. The weight assigned to the consensus Central scenario was
aligned with the calibrated probability of 75%.
The risk of a longer duration conflict and higher oil prices was seen to
be higher than implied by the consensus distribution. The weight
applied to the consensus Downside scenario was therefore increased
to 15% from 10% at 31 December 2025, while the Downside 2
scenario was left unchanged at 5%.
For the UAE, forecasts were assessed to be subject to greater
uncertainty and both Central and outer scenario weights were adjusted.
The consensus Upside scenario was assigned a weight of 5%, the
consensus Central 65%, the consensus Downside 25%, and the
Downside 2 was assigned 5%.
It was noted that dispersion in the consensus forecast for the UAE had
widened significantly, and that the longer publication lag for official data
made assessment of current conditions particularly challenging.
Management continued to monitor developments in the Middle East
and their implications for economic forecasts, scenarios and weights
after 30 June 2026. It was noted that forecasts had remained stable
since the scenarios were created and that while the oil price was
volatile, its development remained in line with the price assumption
underpinning the Central scenario. Renewed hostilities were also seen
to affirm the decision to re-weight scenarios in order to better capture
the risk of a more prolonged conflict.
The following table describes the probabilities assigned in each
scenario.
Scenario weightings, % | ||||||||
Standard weights | UK | US | Hong Kong | Chinese mainland | France | UAE | Mexico | |
2Q26 | ||||||||
Consensus Upside | 10 | 5 | 5 | 5 | 5 | 5 | 5 | 5 |
Consensus Central | 75 | 75 | 75 | 75 | 75 | 75 | 65 | 75 |
Consensus Downside | 10 | 15 | 15 | 15 | 15 | 15 | 25 | 15 |
Downside 2 | 5 | 5 | 5 | 5 | 5 | 5 | 5 | 5 |
4Q25 | ||||||||
Consensus Upside | 10 | 10 | 10 | 10 | 10 | 10 | 10 | 10 |
Consensus Central | 75 | 75 | 75 | 75 | 75 | 75 | 75 | 75 |
Consensus Downside | 10 | 10 | 10 | 10 | 10 | 10 | 10 | 10 |
Downside 2 | 5 | 5 | 5 | 5 | 5 | 5 | 5 | 5 |
Hong Kong |
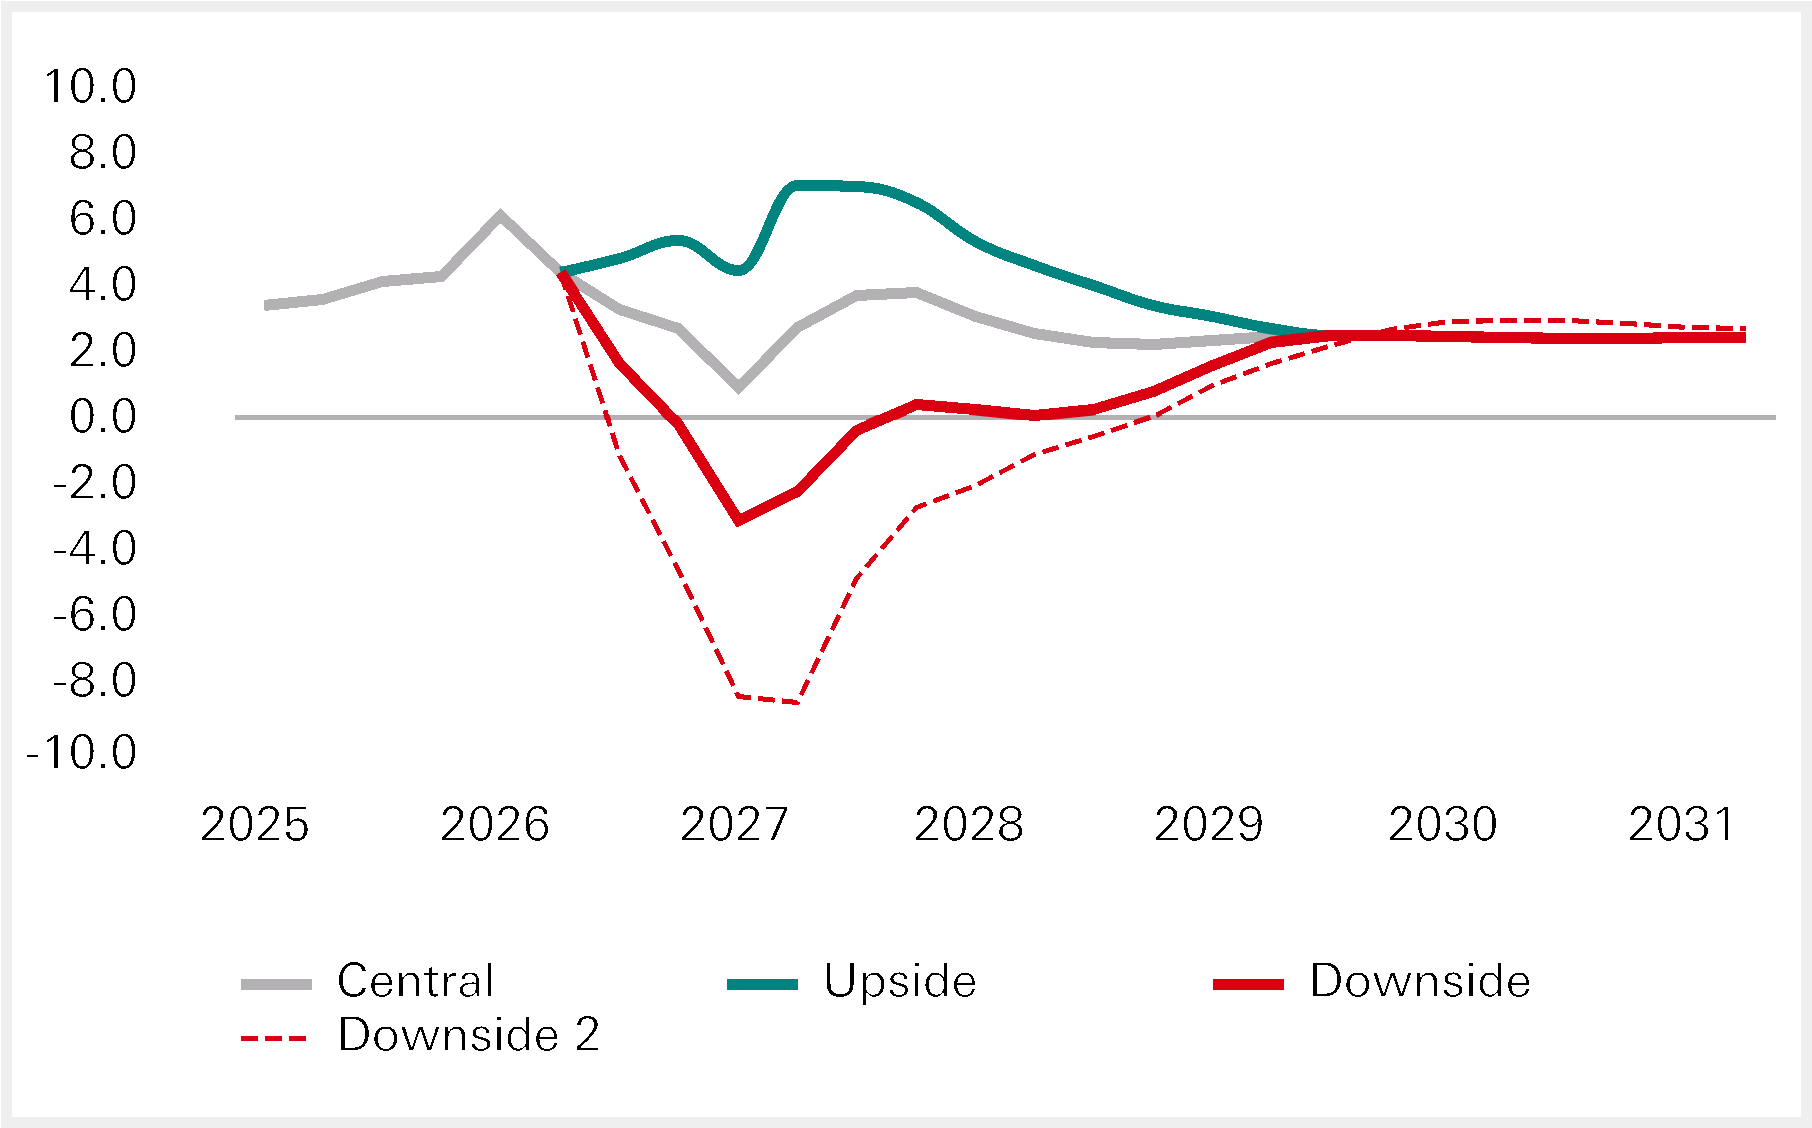
Note: Real GDP shown as year-on-year percentage change.
UK |
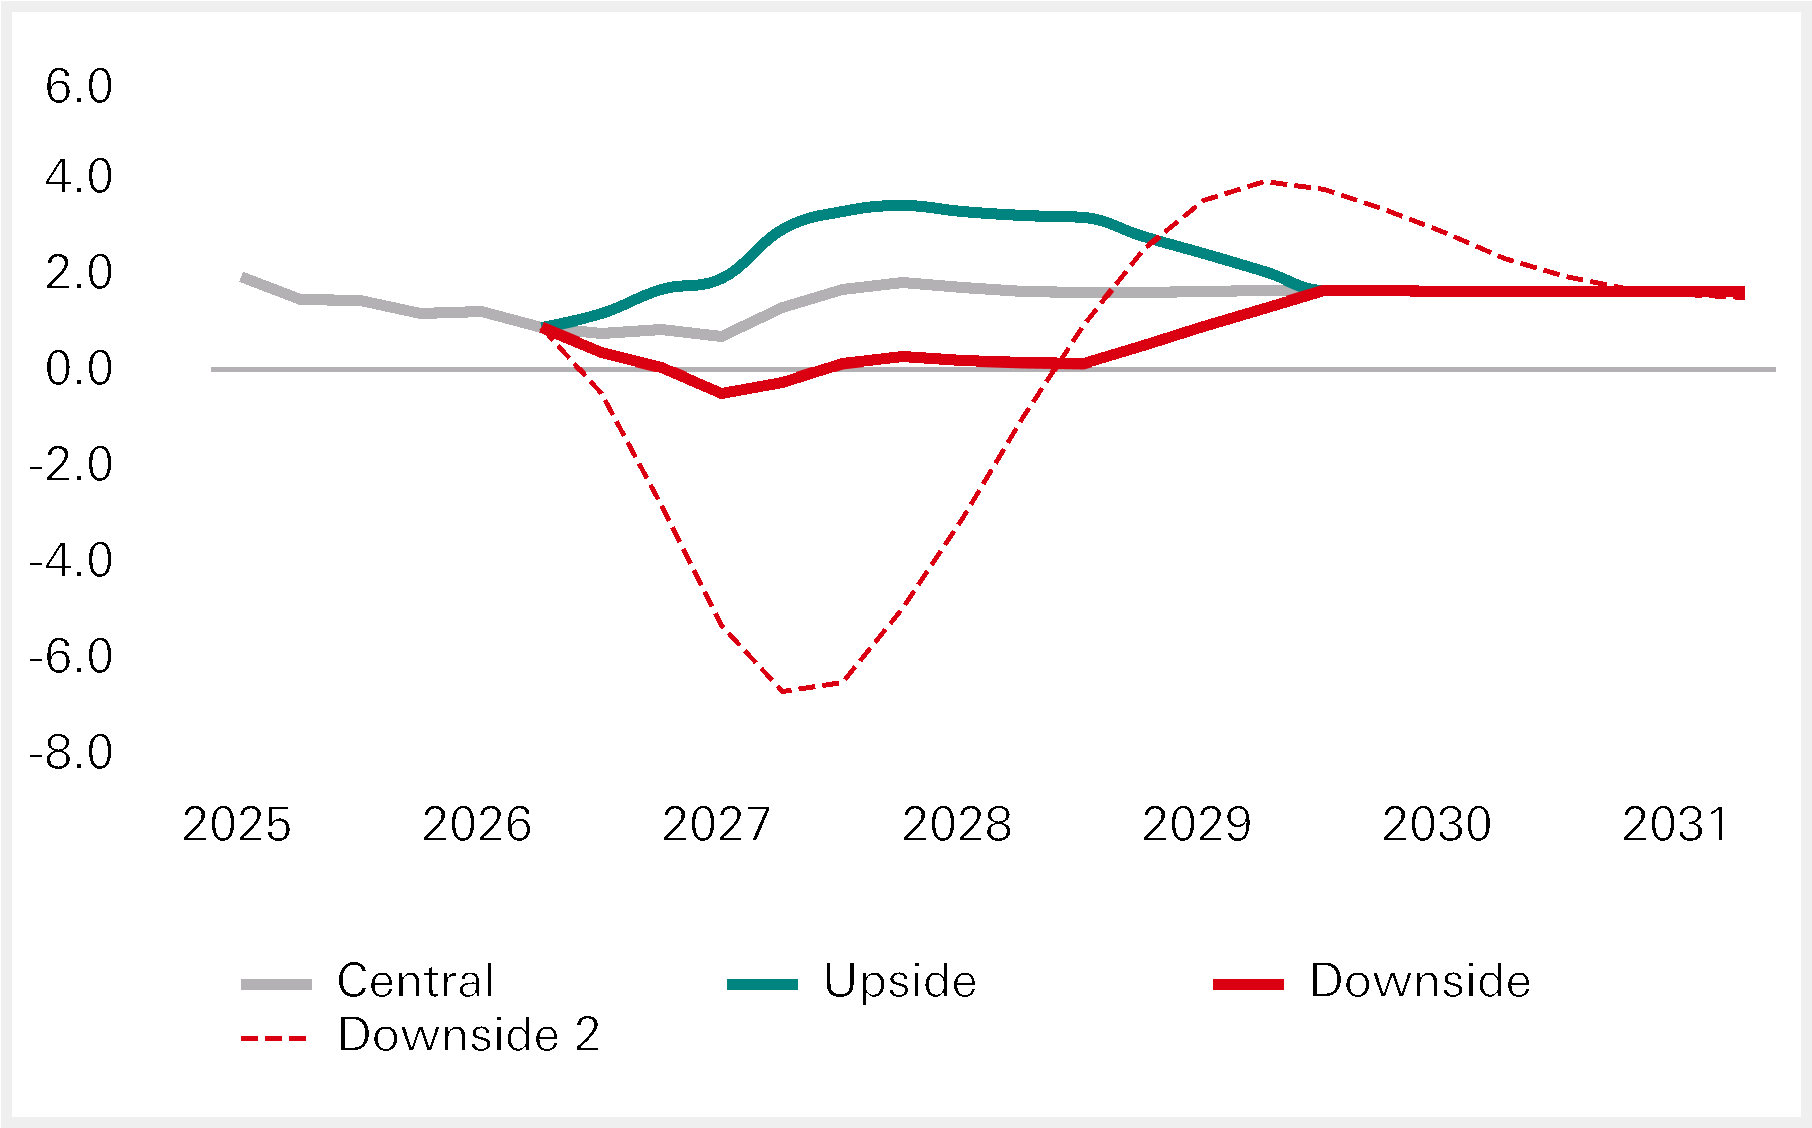
Note: Real GDP shown as year-on-year percentage change.
Chinese mainland |
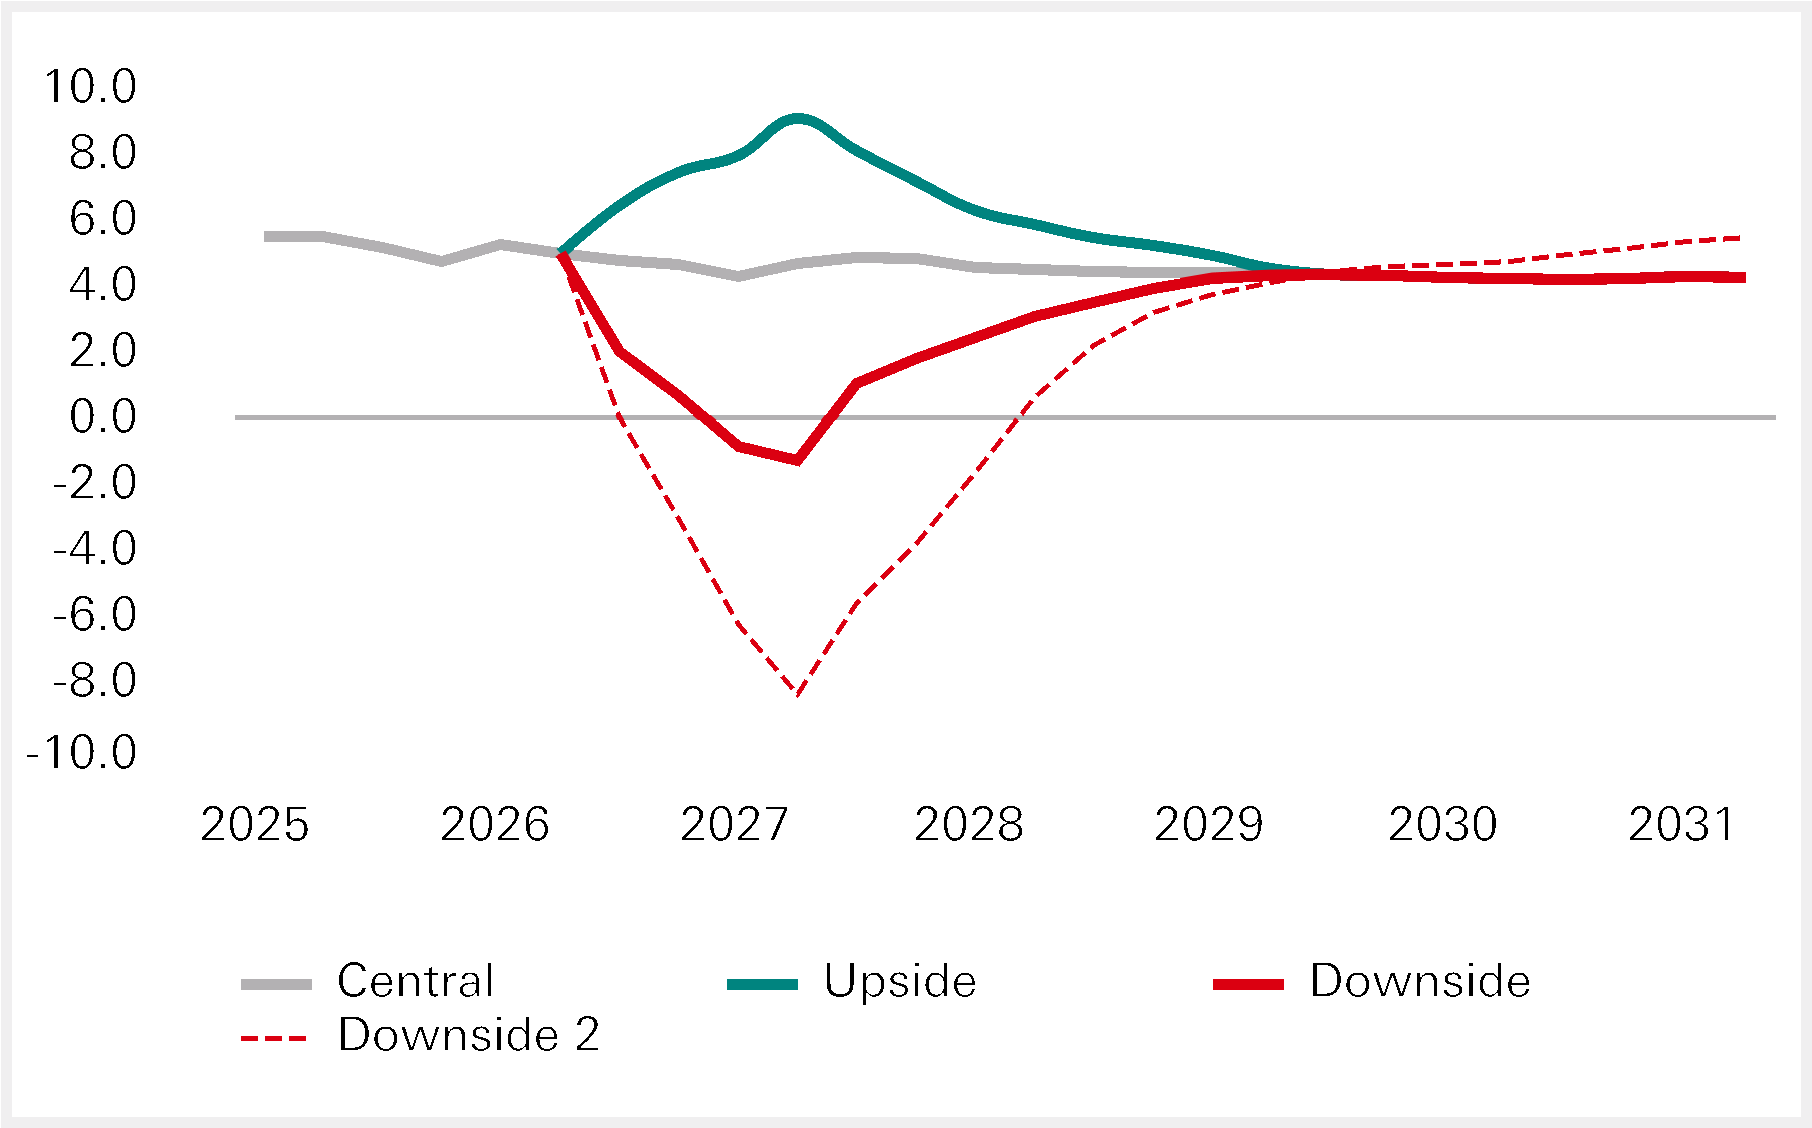
Note: Real GDP shown as year-on-year percentage change.
US |
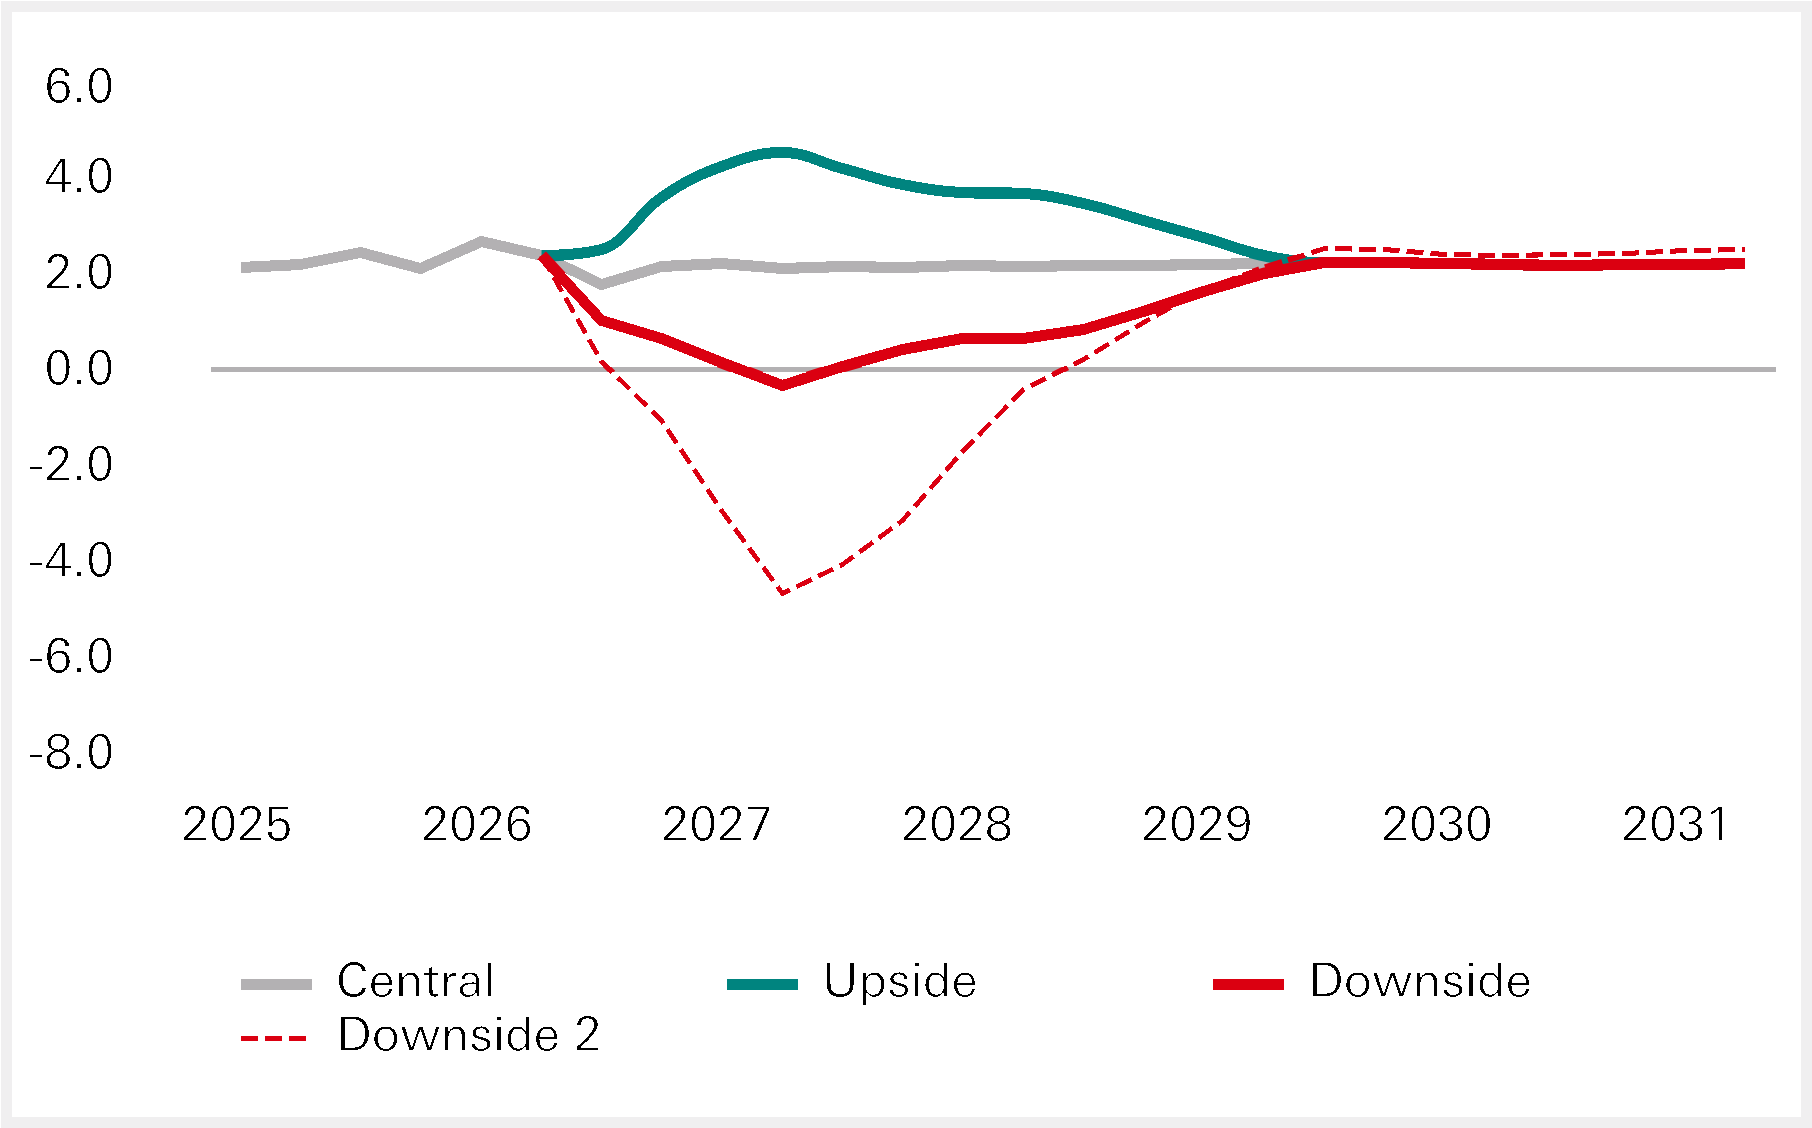
Note: Real GDP shown as year-on-year percentage change.
Critical estimates and judgementsThe IFRS 9 expected credit losses (‘ECL’) calculation involved
significant judgements, assumptions and estimates. These included
selecting and configuring economic scenarios amid changing economic
conditions and risks and estimating their effects on ECL, especially
when historical conditions were not fully captured by credit risk models.
How economic scenarios are reflected in ECL calculations
The methodologies for the application of forward economic guidance
into the calculation of ECL for wholesale and retail portfolios are set out
on page 153 of the Annual Report and Accounts 2025 on Form 20-F.
Models are used to reflect economic scenarios in ECL estimates.
These models are based largely on historical observations and
correlations with default.
Economic forecasts and ECL model responses to these forecasts are
subject to a degree of uncertainty. The models continue to be
supplemented by management judgemental adjustments where
required.
Management judgemental adjustmentsDetails regarding management judgemental adjustments in relation to ECL allowance are on page 153 of the Annual Report and Accounts 2025 on
Form 20-F.
Management judgemental adjustments to ECL1 | ||||||
At 30 Jun 2026 | At 31 Dec 2025 | |||||
Retail | Wholesale2 | Total | Retail | Wholesale2 | Total | |
$bn | $bn | $bn | $bn | $bn | $bn | |
Modelled ECL (A)3 | 2.8 | 1.9 | 4.7 | 2.8 | 1.8 | 4.6 |
Banks, sovereigns, government entities and low-risk counterparties | 0.0 | |||||
Corporate lending adjustments | 0.1 | 0.1 | 0.1 | 0.1 | ||
Other credit judgements | 0.1 | 0.1 | 0.1 | 0.1 | ||
Total management judgemental adjustments (B)4 | 0.1 | 0.1 | 0.2 | 0.1 | 0.1 | 0.2 |
Other adjustments (C)5 | 0.0 | 0.1 | 0.1 | (0.0) | 0.1 | 0.1 |
Final ECL (A + B + C)6 | 2.9 | 2.1 | 5.0 | 2.9 | 2.0 | 4.9 |
1Management judgemental adjustments presented in the table reflect increases or (decreases) in allowance for ECL, respectively.
2The wholesale portfolio corresponds to adjustments to the performing portfolio (stage 1 and stage 2).
3(A) refers to probability-weighted allowance for ECL before any adjustments are applied.
4(B) refers to adjustments that are applied where management believes allowance for ECL does not sufficiently reflect the credit risk/expected credit losses of
any given portfolio at the reporting date. These can relate to risks or uncertainties that are not reflected in the model, and/or to any late-breaking events.
5(C) refers to adjustments to allowance for ECL made to address process limitations, data/model deficiencies, and can also include, where appropriate, the impact
of new models where governance has sufficiently progressed to allow an accurate estimate of ECL allowance to be incorporated into the total reported ECL. At
30 June 2026 a qualitative industry sector framework adjustment increased the wholesale portfolio allowance for ECL by $0.1bn.
6As presented within our internal credit risk governance (see page 140 of the Annual Report and Accounts 2025 on Form 20-F).
In the wholesale portfolio, management judgemental adjustments were
an increase to the modelled allowance for ECL of $0.1bn (31 December
2025: $0.1bn increase), due to economic and geopolitical concerns, and
potential lagged impacts. This was reflected in specific sectors and
geographies. Compared with 31 December 2025, management
judgemental adjustments were stable.
In the retail portfolio, management judgemental adjustments were an
increase to the modelled allowance for ECL of $0.1bn at 30 June 2026
(31 December 2025: $0.1bn increase). ‘Other credit judgements’
remained stable compared with 31 December 2025, with market-
specific uncertainties across a number of geographies not individually
significant.
Economic scenarios sensitivity analysis of ECL estimates
Management considered the sensitivity of the ECL outcome against
the economic forecasts as part of the ECL governance process by
recalculating the allowance for ECL under each scenario described
above for selected portfolios, applying a 100% weighting to each
scenario in turn. The weighting is reflected in both the determination of
a significant increase in credit risk and the measurement of the
resulting allowances.
The allowance for ECL calculated for the Upside and Downside
scenarios should not be taken to represent the upper and lower limits
of possible ECL outcomes. The impact of defaults that might occur in
the future under different economic scenarios is captured by
recalculating allowances for loans at the balance sheet date.
There is a particularly high degree of estimation uncertainty in numbers
representing tail risk scenarios when assigned a 100% weighting.
For wholesale credit risk exposures, the sensitivity analysis excludes
allowance for ECL and financial instruments related to defaulted (stage
3) obligors. The measurement of stage 3 ECL is relatively more
sensitive to credit factors specific to the obligor than future economic
scenarios, and therefore the effects of macroeconomic factors are not
necessarily the key consideration when performing individual
assessments of allowances for obligors in default. Loans to defaulted
obligors are a small portion of the overall wholesale lending exposure,
even if representing the majority of the allowance for ECL. Due to the
range and specificity of the credit factors to which the ECL is sensitive,
it is not possible to provide a meaningful alternative sensitivity analysis
for a consistent set of risks across all defaulted obligors.
For retail mortgage exposures the sensitivity analysis includes
allowance for ECL for defaulted obligors of loans and advances. This is
because the retail ECL for secured mortgage portfolios, including loans
in all stages, is sensitive to macroeconomic variables.
Wholesale and retail ECL sensitivityThe wholesale and retail sensitivity tables present the 100%-weighted
results for each of the four scenarios. These exclude portfolios held by
the insurance business, private banking and small portfolios, and as
such cannot be directly compared with personal and wholesale lending
presented in other credit risk tables. In both the wholesale and retail
analysis, the comparative period results for the Downside 2 scenario
are also not directly comparable with the current period, because they
reflect different risks relative to the consensus scenarios for the period
end.
The wholesale and retail sensitivity analysis is stated inclusive of
management judgemental adjustments, as appropriate to each
scenario.
For both the retail and wholesale portfolios, the gross carrying amount
of financial instruments is the same under each scenario. For
exposures with similar risk profiles and product characteristics, the
sensitivity impact is therefore largely the result of changes in
macroeconomic assumptions.
Wholesale analysisAt 30 June 2026, the highest level of 100% scenario-weighted ECL
was observed in the UK and Hong Kong. This higher ECL impact was
largely driven by significant exposure in these regions compared with
other regions. In the wholesale portfolio, off-balance sheet financial
instruments have a lower likelihood to be fully converted to a funded
exposure at the point of default, and consequently the ECL sensitivity
impact is lower in relation to its nominal amount when compared with
an on-balance sheet exposure with a similar risk profile.
The Downside 2 ECL increased by $1.7bn compared with
31 December 2025. The 30 June 2026 Downside 2 scenario reflects a
refreshed calibration of credit risks under a higher interest rate
environment, with the biggest changes in the UK, Hong Kong and the
UAE. Furthermore, since 31 December 2025, the range of scenarios
has widened due to an energy-driven supply shock, with oil prices rising
sharply following a major escalation of the conflict in the Middle East. In
the recalibrated scenario, the supply shock proves particularly damaging
to the UK, Hong Kong and the UAE and drives a deeper economic
recession, higher unemployment and a sharper drop in house prices.
Wholesale IFRS 9 ECL sensitivity to future economic conditions1,2,3 | ||||||
By geography at 30 Jun 20265 | Reported Gross carrying amount4 | Reported allowance for ECL | Consensus Central scenario allowance for ECL | Consensus Upside scenario allowance for ECL | Consensus Downside scenario allowance for ECL | Downside 2 scenario allowance for ECL |
$m | $m | $m | $m | $m | $m | |
UK | 463,607 | 681 | 621 | 527 | 796 | 1,657 |
US | 216,936 | 165 | 144 | 112 | 214 | 610 |
Hong Kong | 507,393 | 508 | 430 | 295 | 710 | 1,513 |
Chinese mainland | 134,513 | 181 | 152 | 103 | 259 | 531 |
Mexico | 39,710 | 59 | 54 | 41 | 68 | 124 |
UAE | 67,950 | 120 | 91 | 85 | 172 | 356 |
France | 197,768 | 120 | 112 | 95 | 140 | 245 |
Other geographies6 | 492,137 | 272 | 202 | 132 | 406 | 1,178 |
Total | 2,120,017 | 2,105 | 1,807 | 1,390 | 2,764 | 6,214 |
of which: | ||||||
Stage 1 | 1,978,717 | 799 | 656 | 474 | 968 | 1,233 |
Stage 2 | 141,299 | 1,307 | 1,151 | 916 | 1,797 | 4,981 |
UK | 465,228 | 598 | 571 | 513 | 680 | 1,119 |
US | 208,425 | 210 | 194 | 166 | 264 | 563 |
Hong Kong | 472,454 | 439 | 401 | 305 | 570 | 1,143 |
Chinese mainland | 133,814 | 188 | 176 | 137 | 256 | 397 |
Mexico | 38,076 | 62 | 58 | 47 | 76 | 202 |
UAE | 62,827 | 52 | 51 | 47 | 56 | 82 |
France | 196,137 | 121 | 117 | 103 | 139 | 188 |
Other geographies6 | 487,987 | 234 | 208 | 158 | 358 | 790 |
Total | 2,064,949 | 1,905 | 1,778 | 1,477 | 2,399 | 4,485 |
of which: | ||||||
Stage 1 | 1,940,746 | 690 | 638 | 522 | 830 | 971 |
Stage 2 | 124,203 | 1,214 | 1,139 | 955 | 1,569 | 3,514 |
1Allowance for ECL sensitivity includes off-balance sheet financial instruments. These are subject to significant measurement uncertainty.
2Includes low credit-risk financial instruments such as debt instruments at FVOCI, which have high carrying amounts but low ECL under all the above scenarios.
3Excludes defaulted obligors. For a detailed breakdown of performing and non-performing wholesale portfolio exposures, see page 63.
4Staging refers only to probability-weighted/reported gross carrying amount. Stage allocation of gross exposures varies by scenario, with higher allocation to
stage 2 under the Downside 2 scenario.
5Geographies include all legal entities which share a common set of macroeconomic scenarios for the majority of exposures.
6Includes small portfolios that use less complex modelling approaches and are not sensitive to macroeconomic changes.
Retail analysisAt 30 June 2026, the most significant level of allowance for ECL
sensitivity was observed in the UK, Mexico and Hong Kong. Mortgages
reflected the lowest level of allowance for ECL sensitivity across most
markets given the significant levels of collateral relative to the exposure
values. Credit cards and other unsecured lending across stages 1 and 2
are more sensitive to economic forecasts and therefore reflected the
highest level of allowance for ECL sensitivity during the first half of
2026.
Downside 2 ECL increased by $0.2bn compared with 31 December
2025, primarily in UK unsecured portfolios, reflecting deterioration in
the macroeconomic outlook.
Retail IFRS 9 ECL sensitivity to future economic conditions1 | ||||||||||||
At 30 Jun 2026 | At 31 Dec 2025 | |||||||||||
By geography | Reported gross carrying amount | Reported allowance for ECL | Consensus Central scenario allowance for ECL | Consensus Upside scenario allowance for ECL | Consensus Downside scenario allowance for ECL | Downside 2 scenario allowance for ECL | Reported gross carrying amount | Reported allowance for ECL | Consensus Central scenario allowance for ECL | Consensus Upside scenario allowance for ECL | Consensus Downside scenario allowance for ECL | Downside 2 scenario allowance for ECL |
$m | $m | $m | $m | $m | $m | $m | $m | $m | $m | $m | $m | |
UK | ||||||||||||
Mortgages | 184,494 | 113 | 106 | 95 | 121 | 244 | 183,128 | 132 | 124 | 117 | 138 | 274 |
Credit cards | 8,307 | 407 | 401 | 380 | 413 | 507 | 8,317 | 356 | 354 | 338 | 355 | 419 |
Other | 9,706 | 293 | 282 | 257 | 306 | 463 | 9,513 | 265 | 261 | 238 | 276 | 370 |
Mexico | ||||||||||||
Mortgages | 8,528 | 211 | 207 | 200 | 214 | 251 | 8,430 | 190 | 188 | 180 | 193 | 237 |
Credit cards | 2,136 | 368 | 364 | 359 | 368 | 493 | 2,322 | 407 | 403 | 398 | 409 | 514 |
Other | 3,290 | 411 | 411 | 408 | 414 | 565 | 3,727 | 437 | 437 | 435 | 442 | 589 |
Hong Kong | ||||||||||||
Mortgages | 107,792 | 2 | 2 | 2 | 3 | 5 | 106,736 | 5 | 4 | 3 | 6 | 13 |
Credit cards | 9,863 | 299 | 291 | 286 | 309 | 467 | 9,739 | 313 | 306 | 300 | 324 | 496 |
Other | 6,269 | 146 | 146 | 142 | 148 | 169 | 6,085 | 146 | 137 | 136 | 144 | 173 |
UAE | ||||||||||||
Mortgages | 2,436 | 12 | 11 | 11 | 12 | 22 | 2,306 | 6 | 6 | 6 | 6 | 7 |
Credit cards | 557 | 55 | 50 | 49 | 63 | 89 | 591 | 39 | 39 | 38 | 40 | 46 |
Other | 556 | 17 | 16 | 15 | 19 | 24 | 620 | 12 | 11 | 11 | 12 | 13 |
US | ||||||||||||
Mortgages | 15,368 | 5 | 5 | 4 | 5 | 8 | 17,797 | 4 | 4 | 4 | 5 | 8 |
Credit cards | 178 | 15 | 15 | 15 | 15 | 18 | 187 | 14 | 14 | 14 | 14 | 16 |
Other geographies | ||||||||||||
Mortgages | 57,204 | 105 | 100 | 96 | 114 | 184 | 56,067 | 109 | 106 | 102 | 114 | 175 |
Credit cards | 3,659 | 169 | 167 | 163 | 170 | 203 | 3,834 | 175 | 174 | 173 | 179 | 202 |
Other | 2,299 | 79 | 78 | 78 | 80 | 91 | 2,313 | 78 | 78 | 77 | 78 | 85 |
Total | 422,642 | 2,707 | 2,652 | 2,560 | 2,774 | 3,803 | 421,712 | 2,688 | 2,646 | 2,570 | 2,735 | 3,637 |
of which: mortgages | 375,822 | 448 | 431 | 408 | 469 | 714 | 374,464 | 446 | 432 | 412 | 462 | 714 |
Stage 1 | 356,882 | 58 | 53 | 46 | 64 | 161 | 353,960 | 54 | 53 | 50 | 61 | 161 |
Stage 2 | 16,432 | 105 | 98 | 90 | 114 | 221 | 18,056 | 106 | 97 | 88 | 108 | 216 |
Stage 3 | 2,508 | 285 | 280 | 272 | 291 | 332 | 2,448 | 286 | 282 | 274 | 293 | 337 |
of which: credit cards | 24,700 | 1,313 | 1,288 | 1,252 | 1,338 | 1,777 | 24,990 | 1,304 | 1,290 | 1,261 | 1,321 | 1,693 |
Stage 1 | 20,858 | 365 | 355 | 340 | 377 | 624 | 21,258 | 353 | 347 | 335 | 366 | 553 |
Stage 2 | 3,557 | 724 | 709 | 688 | 737 | 919 | 3,450 | 731 | 723 | 706 | 735 | 913 |
Stage 3 | 285 | 224 | 224 | 224 | 224 | 234 | 282 | 220 | 220 | 220 | 220 | 227 |
of which: others | 22,120 | 946 | 933 | 900 | 967 | 1,312 | 22,258 | 938 | 924 | 897 | 952 | 1,230 |
Stage 1 | 19,136 | 256 | 250 | 233 | 267 | 495 | 19,494 | 253 | 249 | 233 | 265 | 444 |
Stage 2 | 2,378 | 411 | 404 | 388 | 421 | 525 | 2,177 | 403 | 393 | 382 | 405 | 494 |
Stage 3 | 606 | 279 | 279 | 279 | 279 | 292 | 587 | 282 | 282 | 282 | 282 | 292 |
1Allowance for ECL sensitivities includes defaulted obligors and excludes portfolios utilising less complex modelling approaches.
The ECL impact of the scenarios and management judgemental adjustments are highly sensitive to movements in economic forecasts.
Based upon the sensitivity tables presented above, if the Group ECL
balance (excluding wholesale stage 3, which is assessed individually)
was estimated solely on the basis of the Central scenario, Upside
scenario, Downside scenario or the Downside 2 scenario at 30 June
2026, it would increase/(decrease) as presented in the below table.
Retail1 | Wholesale1 | |
Scenarios | ||
1On the same basis as retail and wholesale sensitivity analysis.
At 30 June 2026, the Group allowance for reported ECL increased in
the wholesale portfolio by $0.2bn and remained stable in the retail
portfolio, compared with 31 December 2025.
In the retail portfolio the allowance for ECL under the 100% consensus
Downside and Downside 2 scenarios reflected an increase, which was
primarily in the UK unsecured portfolios reflecting deterioration in the
macroeconomic outlook, compared with 31 December 2025.
In the wholesale portfolio the allowance for reported ECL increased by
$0.2bn versus 31 December 2025, driven by heightened global
macroeconomic risks.
The ECL sensitivity to the 100% consensus Downside and Downside 2
scenarios rose to $0.7bn and $4.1bn respectively. The movement is
concentrated in the more severe Downside 2 scenario, where a
sustained oil price shock feeds through to elevated policy rates, a
deeper contraction and weaker collateral values, with the UK, Hong
Kong and the UAE most exposed.
Reconciliation of changes in gross carrying/nominal amount and
allowances for loans and advances to
banks and customers
The following disclosure provides a reconciliation by stage of the
Group’s gross carrying/nominal amount and allowances for loans and
advances to banks and customers, including loan commitments and
financial guarantees. Movements are calculated on a quarterly basis
and therefore fully capture stage movements between quarters. If
movements were calculated on a year-to-date basis they would only
reflect the opening and closing position of the financial instrument.
The transfers of financial instruments represent the impact of stage
transfers upon the gross carrying/nominal amount and associated
allowance for ECL.
The net remeasurement of ECL arising from stage transfers represents
the increase or decrease due to these transfers, for example, moving
from a 12-month (stage 1) to a lifetime (stage 2) ECL measurement
basis. Net remeasurement excludes the underlying customer risk rating
(‘CRR’)/PD movements of the financial instruments transferring stage.
This is captured, along with other credit quality movements in the
‘changes in risk parameters – credit quality’ line item.
Changes in ‘Net new and further lending/repayments’ represents the
impact from volume movements within the Group’s lending portfolio
and includes new financial assets originated or purchased, further
lending and repayments (including final repayments)Allowance for ECL | Allowance for ECL | Allowance for ECL | Allowance for ECL | Allowance for ECL | ||||||
(29,667) | (335) | 25,690 | 716 | 3,977 | (381) | — | — | — | — | |
(68,168) | 205 | 68,168 | (205) | — | — | — | — | — | — | |
39,640 | (515) | (39,640) | 515 | — | — | — | — | — | — | |
— | 290 | — | (307) | — | (58) | — | — | — | (75) | |
— | — | — | — | (8) | 2 | — | — | (8) | 2 | |
89,882 | (99) | (19,543) | 317 | (2,488) | 531 | 2 | 5 | 67,853 | 754 | |
— | 30 | — | (781) | — | (2,344) | — | (4) | — | (3,099) | |
— | 3 | — | (33) | — | 6 | — | — | — | (24) | |
— | — | — | — | — | — | — | — | — | — | |
Foreign exchange and others1 | (16,975) | 17 | (1,057) | 8 | (47) | (185) | 1 | (1) | (18,078) | (161) |
224 | (804) | (1,863) | 1 | (2,442) | ||||||
(2,384) | ||||||||||
1Total includes $4.7bn of gross carrying loans and advances to customers and banks, which were classified to assets held for sale, and a corresponding allowance
for ECL of $52m, reflecting planned business disposals as disclosed in Note 15 on page 100.
Reconciliation of changes in gross carrying/nominal amount and allowances for loans and advances to banks and customers including loan commitments and financial guarantees (continued) | |||
At 30 Jun 2026 | 6 months ended 30 Jun 2026 | ||
Gross carrying/ nominal amount | Allowance for ECL | ECL release/ (charge) | |
$m | $m | $m | |
As above | 1,788,761 | (12,206) | (2,384) |
Other financial assets measured at amortised cost | 965,830 | (157) | (24) |
Non-trading reverse purchase agreement commitments | 152,925 | — | — |
Performance and other guarantees not considered for IFRS 9 | — | — | 54 |
Summary of financial instruments to which the impairment requirements in IFRS 9 are applied – by business segment/Summary consolidated income statement | 2,907,516 | (12,363) | (2,354) |
Debt instruments measured at FVOCI | 386,831 | (29) | 1 |
Total allowance for ECL/total income statement ECL change for the period | n/a | (12,392) | (2,353) |
Non-credit impaired | Credit impaired | |||||||||
Stage 1 | Stage 2 | Stage 3 | POCI | Total | ||||||
Gross carrying/ nominal amount | Allowance for ECL | Gross carrying/ nominal amount | Allowance for ECL | Gross carrying/ nominal amount | Allowance for ECL | Gross carrying/ nominal amount | Allowance for ECL | Gross carrying/ nominal amount | Allowance for ECL | |
$m | $m | $m | $m | $m | $m | $m | $m | $m | $m | |
At 1 Jan 2025 | 1,489,687 | (1,232) | 115,898 | (2,674) | 23,823 | (6,148) | 93 | (51) | 1,629,501 | (10,105) |
Transfers of financial instruments: | (28,196) | (931) | 18,327 | 2,101 | 9,869 | (1,170) | — | — | — | — |
– transfers from stage 1 to stage 2 | (134,309) | 368 | 134,309 | (368) | — | — | — | — | — | — |
– transfers from stage 2 to stage 1 | 107,223 | (1,233) | (107,223) | 1,233 | — | — | — | — | — | — |
– transfers to stage 3 | (1,873) | 15 | (10,260) | 1,434 | 12,133 | (1,449) | — | — | — | — |
– transfers from stage 3 | 763 | (81) | 1,501 | (198) | (2,264) | 279 | — | — | — | — |
Net remeasurement of ECL arising from transfer of stage | — | 664 | — | (604) | — | (58) | — | — | — | 2 |
Changes due to modifications not derecognised | — | — | — | — | — | — | — | — | — | — |
Net new and further lending/repayments | 107,733 | (178) | (35,843) | 614 | (6,060) | 768 | 238 | 2 | 66,068 | 1,206 |
Changes to risk parameters – credit quality | — | 390 | — | (1,991) | — | (3,737) | — | (24) | — | (5,362) |
Changes to models used for ECL calculation | — | (59) | — | 272 | — | (16) | — | — | — | 197 |
Assets written off | — | — | — | — | (3,569) | 3,569 | — | — | (3,569) | 3,569 |
Credit-related modifications that resulted in derecognition | — | — | — | — | (88) | 9 | — | — | (88) | 9 |
Foreign exchange and others1,2 | 42,772 | (16) | 4,507 | (152) | 1,259 | (410) | 6 | (3) | 48,544 | (581) |
At 31 Dec 2025 | 1,611,996 | (1,362) | 102,889 | (2,434) | 25,234 | (7,193) | 337 | (76) | 1,740,456 | (11,065) |
ECL income statement change for the period | 817 | (1,709) | (3,043) | (22) | (3,957) | |||||
Recoveries | 320 | |||||||||
Other | (248) | |||||||||
Total ECL income statement change for the period2 | (3,885) | |||||||||
1Total includes $6.0bn of gross carrying loans and advances to customers and banks, which were classified to assets held for sale, and a corresponding allowance
for ECL of $27m, including business disposals as disclosed in Note 23 ‘Assets held for sale and liabilities of disposal groups held for sale’ on page 355 of the
Annual Report and Accounts 2025 on Form 20-F.
2This includes $7.2bn of gross carrying loans and advances to customers and corresponding allowance for ECL of $7m in relation to disposal of our retained
portfolio of home and other retail loans in France, as disclosed in Note 23 on page 355 of the Annual Report and Accounts 2025 on Form 20-F.
Reconciliation of changes in gross carrying/nominal amount and allowances for loans and advances to banks and customers including loan commitments and financial guarantees (continued) | |||
At 31 Dec 2025 | 12 months ended 31 Dec 2025 | ||
Gross carrying/ nominal amount | Allowance for ECL | ECL charge | |
$m | $m | $m | |
As above | 1,740,456 | (11,065) | (3,885) |
Other financial assets measured at amortised cost | 890,326 | (129) | (29) |
Non-trading reverse purchase agreement commitments | 75,372 | — | — |
Performance and other guarantees not considered for IFRS 9 | — | — | 46 |
Summary of financial instruments to which the impairment requirements in IFRS 9 are applied – by business segment/Summary consolidated income statement | 2,706,154 | (11,194) | (3,868) |
Debt instruments measured at FVOCI | 383,568 | (30) | 18 |
Total allowance for ECL/total income statement ECL change for the period | n/a | (11,224) | (3,850) |
We assess the credit quality of all financial instruments that are subject
to credit risk. The credit quality of financial instruments is a point-in-time
assessment of PD, whereas stages 1 and 2 are determined based on
relative deterioration of credit quality since initial recognition.
Accordingly, for non-credit-impaired financial instruments, there is no
direct relationship between the credit quality assessment and stages 1
and 2, though typically the lower credit quality bands exhibit a higher
proportion in stage 2.
The five credit quality classifications each encompass a range of
granular internal credit rating grades assigned to wholesale and
personal lending businesses and the external ratings attributed by
external agencies to debt securities, as shown in the following table.
Personal lending credit quality is disclosed based on a 12-month point-
in-time PD adjusted for multiple economic scenarios. The credit quality
classifications for wholesale lending are based on internal credit risk
ratings.
Distribution of financial instruments to which the impairment requirements in IFRS 9 are applied, by credit quality and stage allocation | ||||||||||||||||
At 30 Jun 2026 | At 31 Dec 2025 | |||||||||||||||
Gross carrying/nominal amount | Allowance for ECL | Net | Gross carrying/nominal amount | Allowance for ECL | Net | |||||||||||
Strong | Good | Satisfactory | Sub- standard | Credit impaired | Total | Strong | Good | Satisfactory | Sub- standard | Credit impaired | Total | |||||
$m | $m | $m | $m | $m | $m | $m | $m | $m | $m | $m | $m | $m | $m | $m | $m | |
Loans and advances to customers at amortised cost | 563,194 | 224,358 | 200,344 | 21,803 | 24,147 | 1,033,846 | (11,741) | 1,022,105 | 545,487 | 215,781 | 191,839 | 21,455 | 24,529 | 999,091 | (10,692) | 988,399 |
– stage 1 | 554,004 | 203,968 | 160,189 | 5,688 | — | 923,849 | (1,282) | 922,567 | 540,253 | 194,680 | 152,578 | 5,922 | — | 893,433 | (1,201) | 892,232 |
– stage 2 | 9,190 | 20,390 | 39,962 | 16,115 | — | 85,657 | (2,397) | 83,260 | 5,234 | 21,101 | 39,068 | 15,533 | — | 80,936 | (2,318) | 78,618 |
– stage 3 | — | — | — | — | 24,004 | 24,004 | (7,986) | 16,018 | — | — | — | — | 24,389 | 24,389 | (7,097) | 17,292 |
– POCI | — | — | 193 | — | 143 | 336 | (76) | 260 | — | — | 193 | — | 140 | 333 | (76) | 257 |
99,313 | 5,991 | 5,162 | 72 | 1 | 110,539 | (10) | 110,529 | 97,524 | 6,222 | 4,613 | 109 | 1 | 108,469 | (7) | 108,462 | |
– stage 1 | 99,183 | 5,972 | 5,033 | 70 | — | 110,258 | (7) | 110,251 | 97,426 | 6,215 | 4,608 | 87 | — | 108,336 | (4) | 108,332 |
– stage 2 | 130 | 19 | 129 | 2 | — | 280 | (2) | 278 | 98 | 7 | 5 | 22 | — | 132 | (2) | 130 |
– stage 3 | — | — | — | — | 1 | 1 | (1) | — | — | — | — | — | 1 | 1 | (1) | — |
– POCI | — | — | — | — | — | — | — | — | — | — | — | — | — | — | — | — |
Other financial assets measured at amortised cost | 836,063 | 93,151 | 35,959 | 389 | 268 | 965,830 | (157) | 965,673 | 746,697 | 94,241 | 48,865 | 339 | 184 | 890,326 | (129) | 890,197 |
– stage 1 | 835,833 | 92,403 | 35,200 | 272 | — | 963,708 | (93) | 963,615 | 746,536 | 93,759 | 48,121 | 75 | — | 888,491 | (76) | 888,415 |
– stage 2 | 230 | 748 | 759 | 117 | — | 1,854 | (19) | 1,835 | 161 | 482 | 744 | 264 | — | 1,651 | (11) | 1,640 |
– stage 3 | — | — | — | — | 262 | 262 | (45) | 217 | — | — | — | — | 184 | 184 | (42) | 142 |
– POCI | — | — | — | — | 6 | 6 | — | 6 | — | — | — | — | — | — | — | — |
Loan and other credit- related commitments | 499,711 | 168,705 | 100,155 | 8,898 | 948 | 778,417 | (367) | 778,050 | 441,740 | 146,923 | 91,400 | 10,073 | 656 | 690,792 | (315) | 690,477 |
– stage 1 | 496,331 | 164,590 | 91,296 | 4,970 | — | 757,187 | (157) | 757,030 | 437,973 | 143,849 | 82,145 | 5,681 | — | 669,648 | (149) | 669,499 |
– stage 2 | 3,380 | 4,115 | 8,859 | 3,928 | — | 20,282 | (103) | 20,179 | 3,767 | 3,074 | 9,255 | 4,392 | — | 20,488 | (97) | 20,391 |
– stage 3 | — | — | — | — | 944 | 944 | (107) | 837 | — | — | — | — | 652 | 652 | (69) | 583 |
– POCI | — | — | — | — | 4 | 4 | — | 4 | — | — | — | — | 4 | 4 | — | 4 |
Financial guarantees | 8,444 | 3,931 | 5,668 | 584 | 257 | 18,884 | (88) | 18,796 | 7,436 | 4,145 | 5,144 | 559 | 192 | 17,476 | (51) | 17,425 |
– stage 1 | 8,386 | 3,785 | 4,514 | 140 | — | 16,825 | (10) | 16,815 | 7,430 | 4,040 | 4,351 | 92 | — | 15,913 | (8) | 15,905 |
– stage 2 | 58 | 146 | 1,154 | 444 | — | 1,802 | (12) | 1,790 | 6 | 105 | 793 | 467 | — | 1,371 | (17) | 1,354 |
– stage 3 | — | — | — | — | 257 | 257 | (66) | 191 | — | — | — | — | 192 | 192 | (26) | 166 |
– POCI | — | — | — | — | — | — | — | — | — | — | — | — | — | — | — | — |
Total | 2,006,725 | 496,136 | 347,288 | 31,746 | 25,621 | 2,907,516 | (12,363) | 2,895,153 | 1,838,884 | 467,312 | 341,861 | 32,535 | 25,562 | 2,706,154 | (11,194) | 2,694,960 |
Debt instruments at FVOCI1 | ||||||||||||||||
– stage 1 | 378,772 | 5,839 | 6,085 | 64 | — | 390,760 | (27) | 390,733 | 375,894 | 2,592 | 7,015 | 3 | — | 385,504 | (28) | 385,476 |
– stage 2 | 55 | 8 | 449 | 142 | — | 654 | (2) | 652 | 56 | — | 557 | 283 | — | 896 | (2) | 894 |
– stage 3 | — | — | — | — | — | — | — | — | — | — | — | — | — | — | — | — |
– POCI | — | — | — | — | — | — | — | — | — | — | — | — | — | — | — | — |
Total | 378,827 | 5,847 | 6,534 | 206 | — | 391,414 | (29) | 391,385 | 375,950 | 2,592 | 7,572 | 286 | — | 386,400 | (30) | 386,370 |
1For the purposes of this disclosure, gross carrying value is defined as the amortised cost of a financial asset, before adjusting for any loss allowance. As such, the gross carrying value of debt instruments at FVOCI will not reconcile to the
balance sheet as it excludes fair value gains and losses.
Own fundsOwn funds disclosure | |||
30 Jun 2026 | 31 Dec 2025 | ||
Ref* | $m | $m | |
6 | Common equity tier 1 capital before regulatory adjustments | 167,958 | 172,987 |
28 | Total regulatory adjustments to common equity tier 1 | (40,266) | (40,394) |
29 | Common equity tier 1 capital | 127,692 | 132,593 |
36 | Additional tier 1 capital before regulatory adjustments | 23,722 | 20,874 |
43 | Total regulatory adjustments to additional tier 1 capital | (70) | (70) |
44 | Additional tier 1 capital | 23,652 | 20,804 |
45 | Tier 1 capital | 151,344 | 153,397 |
51 | Tier 2 capital before regulatory adjustments | 29,142 | 30,167 |
57 | Total regulatory adjustments to tier 2 capital | (1,710) | (1,193) |
58 | Tier 2 capital | 27,432 | 28,974 |
59 | Total capital | 178,776 | 182,371 |
Capital ratios | % | % | |
61 | Common equity tier 1 ratio | 14.1 | 14.9 |
62 | Tier 1 ratio | 16.7 | 17.3 |
63 | Total capital ratio | 19.7 | 20.5 |
*These are references to lines prescribed in the Pillar 3 ‘Own funds disclosure’ template.
Non-trading VaR, 99% 10 day | ||||
Interest rate | Credit spread | Portfolio diversification1 | Total2 | |
$m | $m | $m | $m | |
Half-year to 30 Jun 2026 | 427.3 | 144.9 | (92.6) | 479.5 |
Average | 464.8 | 148.1 | (106.3) | 506.6 |
Maximum | 518.7 | 155.8 | 581.0 | |
Minimum | 415.8 | 141.5 | 449.1 | |
Half-year to 30 Jun 2025 | 446.6 | 217.5 | (118.8) | 545.3 |
Average | 455.4 | 207.1 | (126.7) | 535.8 |
Maximum | 575.3 | 240.0 | 617.5 | |
Minimum | 378.9 | 181.3 | 458.0 | |
Half year to 31 Dec 2025 | 499.6 | 149.6 | (102.5) | 546.6 |
Average | 474.6 | 175.1 | (105.4) | 544.4 |
Maximum | 525.2 | 254.6 | 588.4 | |
Minimum | 419.8 | 93.9 | 482.7 | |
1Portfolio diversification is the market risk dispersion effect of holding a portfolio containing different risk types. It represents the reduction in unsystematic
market risk that occurs when combining a number of different risk types – such as interest rate and credit spreads – together in one portfolio. It is measured as
the difference between the sum of the VaR by individual risk type and the combined total VaR. A negative number represents the benefit of portfolio
diversification. As the maximum and minimum occurs on different days for different risk types, it is not meaningful to calculate a portfolio diversification benefit
for these measures.
2The total VaR is non-additive across risk types due to diversification effects.
Trading VaR, 99% 1 day | ||||||
Foreign exchange and commodity | Interest rate | Equity | Credit spread | Portfolio diversification1 | Total2 | |
$m | $m | $m | $m | $m | $m | |
Half-year to 30 Jun 2026 | 10.9 | 28.3 | 22.8 | 8.6 | (20.6) | 50.0 |
Average | 17.0 | 26.5 | 17.1 | 10.0 | (27.9) | 42.7 |
Maximum | 31.2 | 36.7 | 22.8 | 16.1 | 58.4 | |
Minimum | 10.9 | 18.2 | 14.0 | 6.2 | 31.5 | |
Half-year to 30 Jun 2025 | 11.2 | 20.5 | 18.2 | 13.1 | (28.3) | 34.6 |
Average | 14.7 | 31.4 | 15.6 | 11.3 | (34.3) | 38.8 |
Maximum | 26.9 | 54.9 | 20.9 | 17.9 | 57.1 | |
Minimum | 7.0 | 18.7 | 12.3 | 6.4 | 27.3 | |
Half-year to 31 Dec 2025 | 13.9 | 18.9 | 17.1 | 8.5 | (19.5) | 38.9 |
Average | 12.6 | 23.9 | 17.0 | 9.0 | (24.1) | 38.3 |
Maximum | 21.7 | 32.1 | 24.6 | 15.4 | 50.3 | |
Minimum | 6.2 | 17.1 | 13.5 | 6.4 | 32.3 | |
2The total VaR is non-additive across risk types due to diversification effects.
Balance sheet of insurance manufacturing subsidiaries by type of contract | |||||
Life direct participating and investment DPF contracts | Life other contracts | Other contracts | Shareholder assets and liabilities | Total | |
$m | $m | $m | $m | $m | |
Financial assets | 115,233 | 5,704 | 5,538 | 5,984 | 132,459 |
– financial assets designated and otherwise mandatorily measured at fair value through profit or loss | 109,463 | 5,350 | 4,217 | 58 | 119,088 |
– derivatives | 126 | 12 | 4 | 4 | 146 |
– financial investments – at amortised cost | 579 | 122 | 1,002 | 4,165 | 5,868 |
– financial assets at fair value through other comprehensive income | — | — | 6 | 187 | 193 |
– other financial assets | 5,065 | 220 | 309 | 1,570 | 7,164 |
Insurance contract assets | — | 92 | — | — | 92 |
Reinsurance contract assets | — | 8,302 | — | — | 8,302 |
Assets held for sale1 | 10,832 | 329 | 196 | 221 | 11,578 |
Other assets and investment properties | 1,740 | 64 | 37 | 2,910 | 4,751 |
Total assets at 30 Jun 2026 | 127,805 | 14,491 | 5,771 | 9,115 | 157,182 |
Liabilities under investment contracts designated at fair value | — | — | 5,113 | — | 5,113 |
Insurance contract liabilities | 123,261 | 5,298 | — | — | 128,559 |
Reinsurance contract liabilities | — | 343 | — | — | 343 |
Liabilities of disposal groups held for sale1 | 10,340 | 476 | — | 456 | 11,272 |
Other liabilities | — | — | — | 5,609 | 5,609 |
Total liabilities | 133,601 | 6,117 | 5,113 | 6,065 | 150,896 |
Total equity | — | — | — | 6,286 | 6,286 |
Total liabilities and equity at 30 Jun 2026 | 133,601 | 6,117 | 5,113 | 12,351 | 157,182 |
Financial assets | 111,078 | 5,277 | 5,672 | 5,405 | 127,432 |
– financial assets designated and otherwise mandatorily measured at fair value through profit or loss | 106,705 | 4,984 | 4,337 | 579 | 116,605 |
– derivatives | 136 | 8 | — | — | 144 |
– financial investments – at amortised cost | 609 | 115 | 1,010 | 3,654 | 5,388 |
– financial assets at fair value through other comprehensive income | — | — | 3 | 214 | 217 |
– other financial assets | 3,628 | 170 | 322 | 958 | 5,078 |
Insurance contract assets | 12 | 98 | — | — | 110 |
Reinsurance contract assets | — | 5,948 | — | — | 5,948 |
Assets held for sale1 | 4,748 | 258 | 1,347 | 271 | 6,624 |
Other assets and investment properties | 1,785 | 118 | 45 | 2,696 | 4,644 |
Total assets at 31 Dec 2025 | 117,623 | 11,699 | 7,064 | 8,372 | 144,758 |
Liabilities under investment contracts designated at fair value | — | — | 5,288 | — | 5,288 |
Insurance contract liabilities | 117,107 | 4,761 | — | — | 121,868 |
Reinsurance contract liabilities | — | 680 | — | — | 680 |
Liabilities of disposal groups held for sale1 | 4,734 | 234 | — | 1,418 | 6,386 |
Other liabilities | — | — | — | 3,821 | 3,821 |
Total liabilities | 121,841 | 5,675 | 5,288 | 5,239 | 138,043 |
Total equity | — | — | — | 6,715 | 6,715 |
Total liabilities and equity at 31 Dec 2025 | 121,841 | 5,675 | 5,288 | 11,954 | 144,758 |
1HSBC Life (Singapore) Pte. Ltd. and HSBC Life Assurance (Malta) Ltd. are classified as held for sale at 30 June 2026. HSBC Life (UK) Limited was classified as
held for sale at 31 December 2025.
ÑFurther details are provided on page 100.