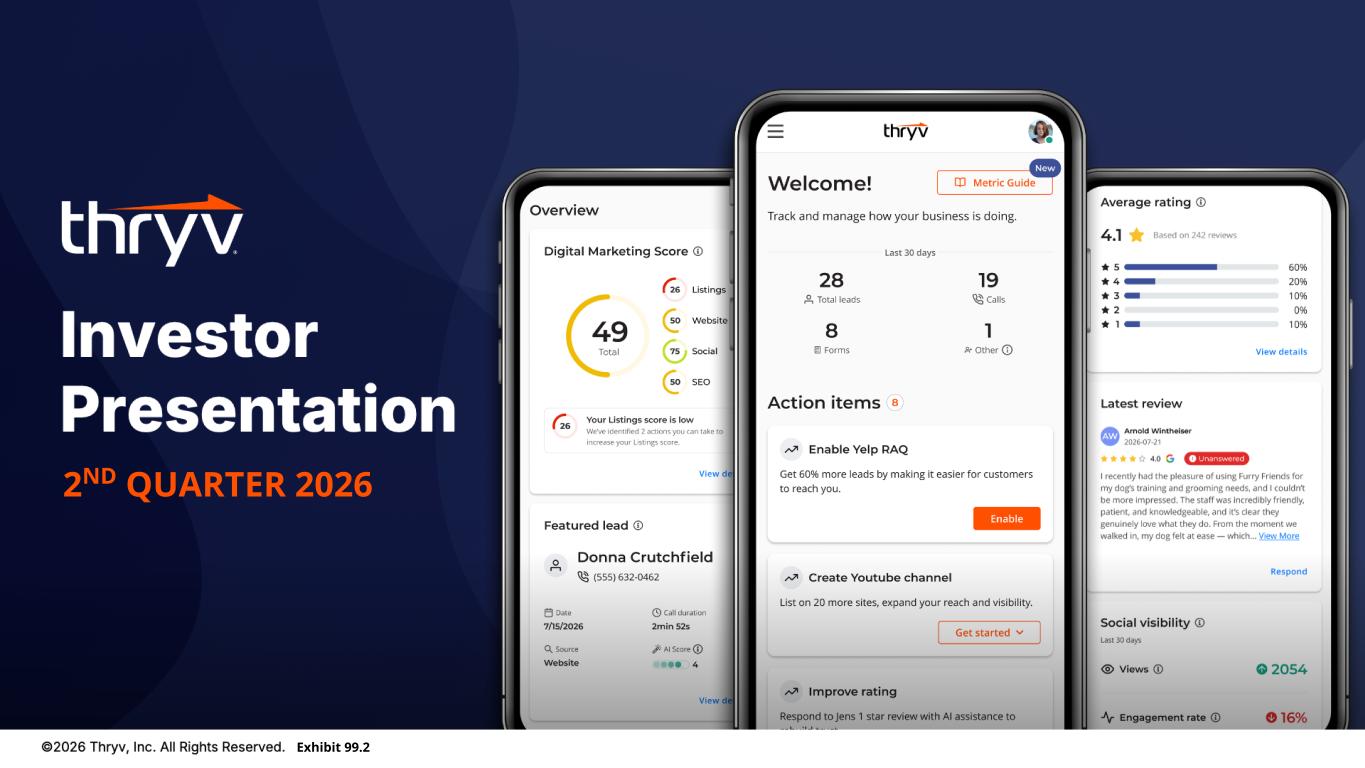
Exhibit 99.2 2ND QUARTER 2026
2
3

4
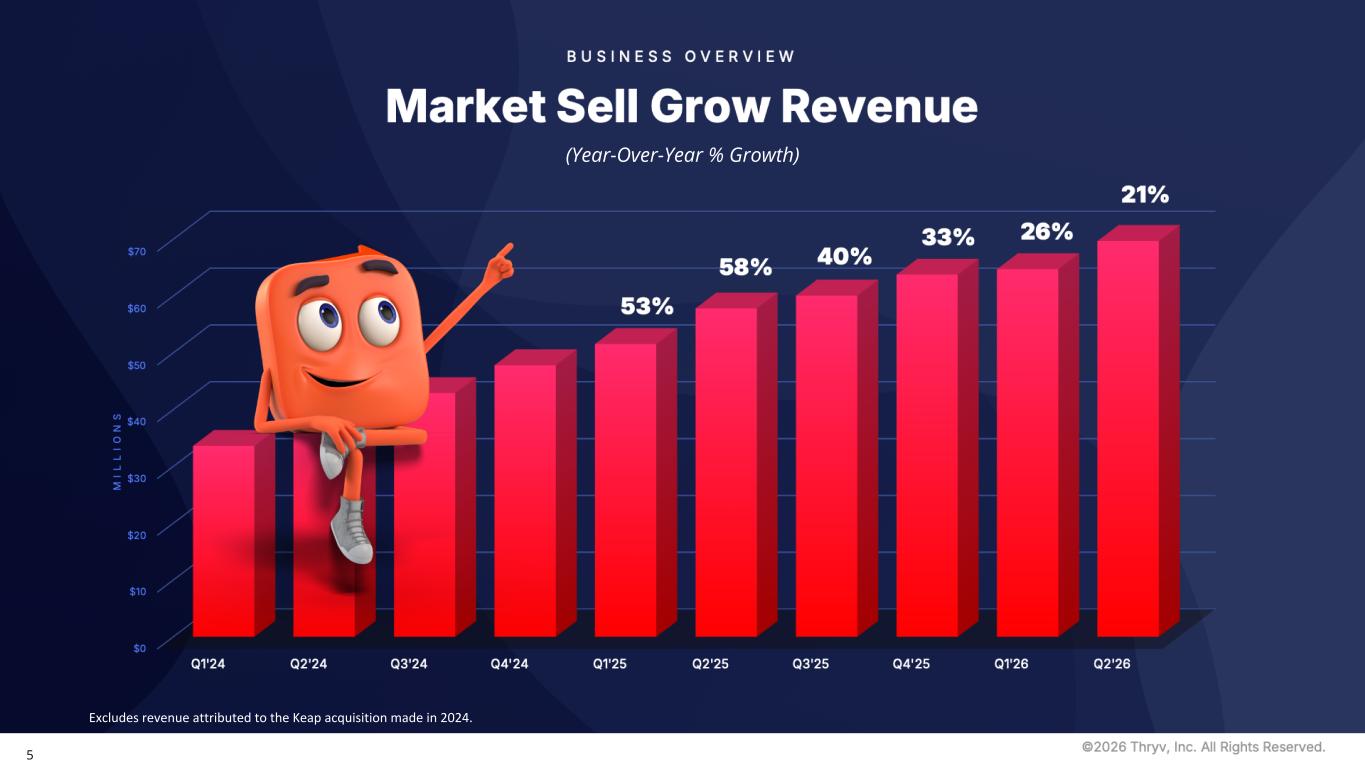
5 Excludes revenue attributed to the Keap acquisition made in 2024. (Year-Over-Year % Growth)
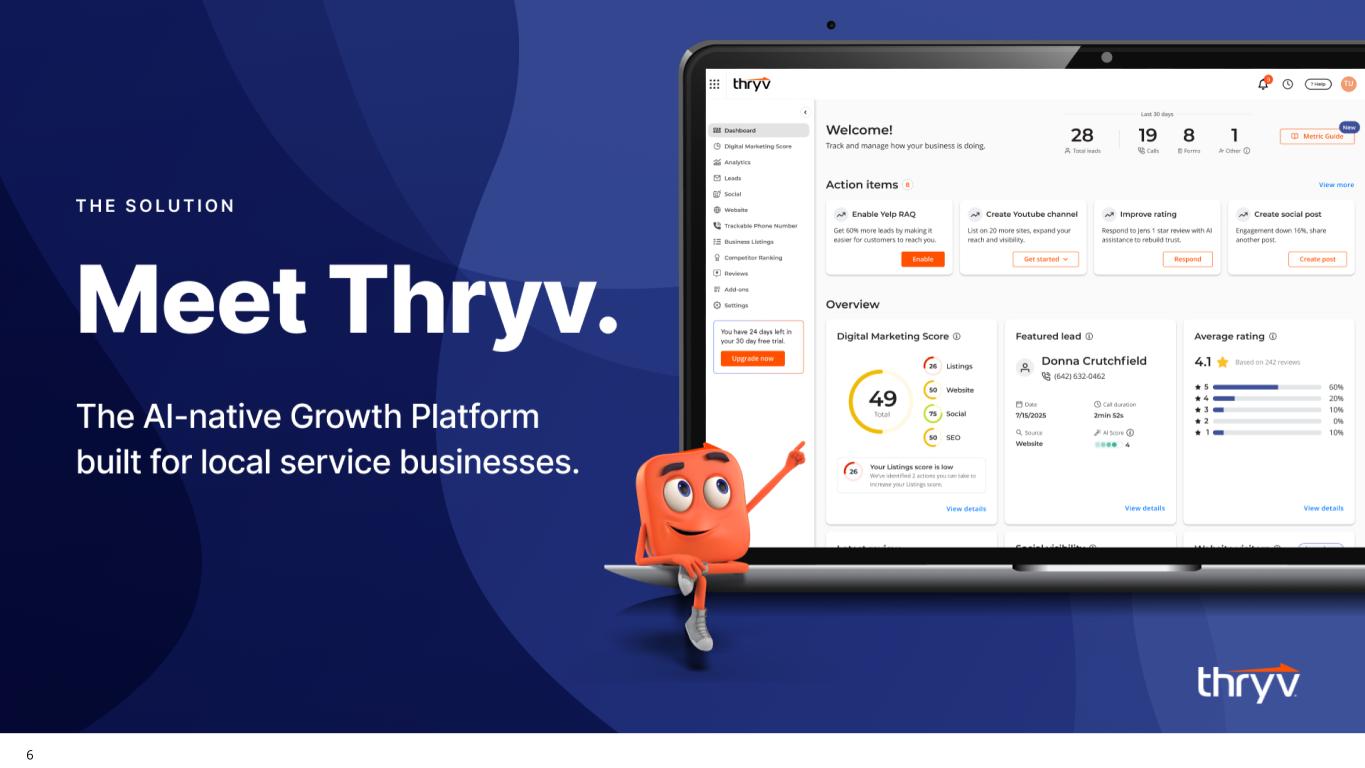
6
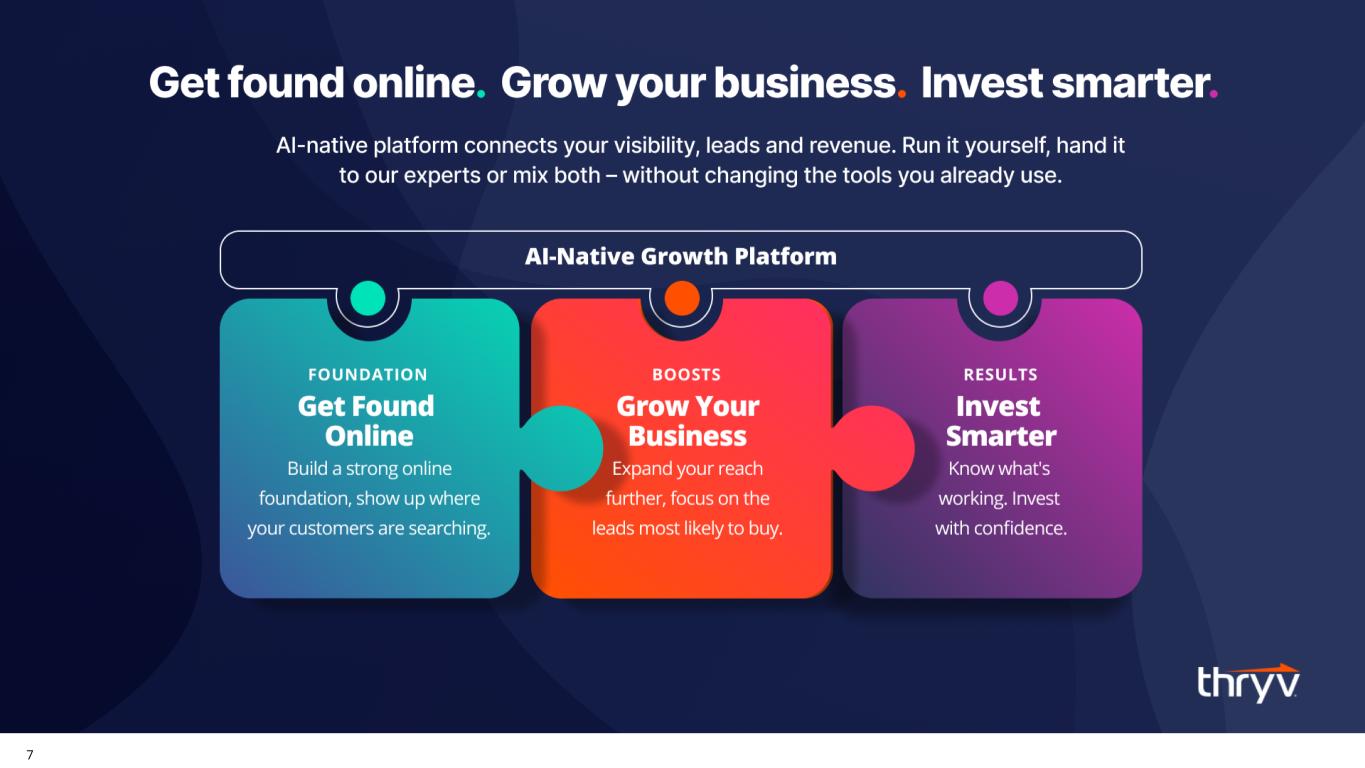
7
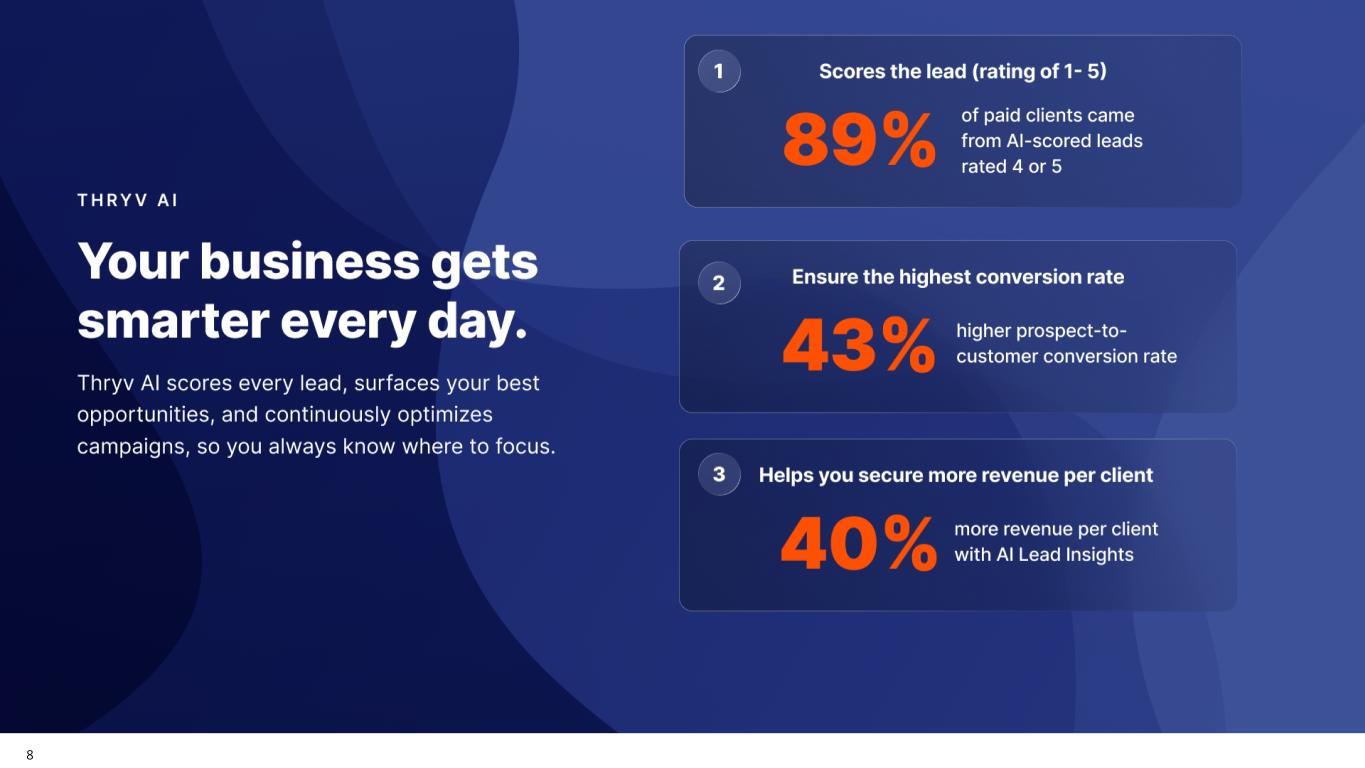
8
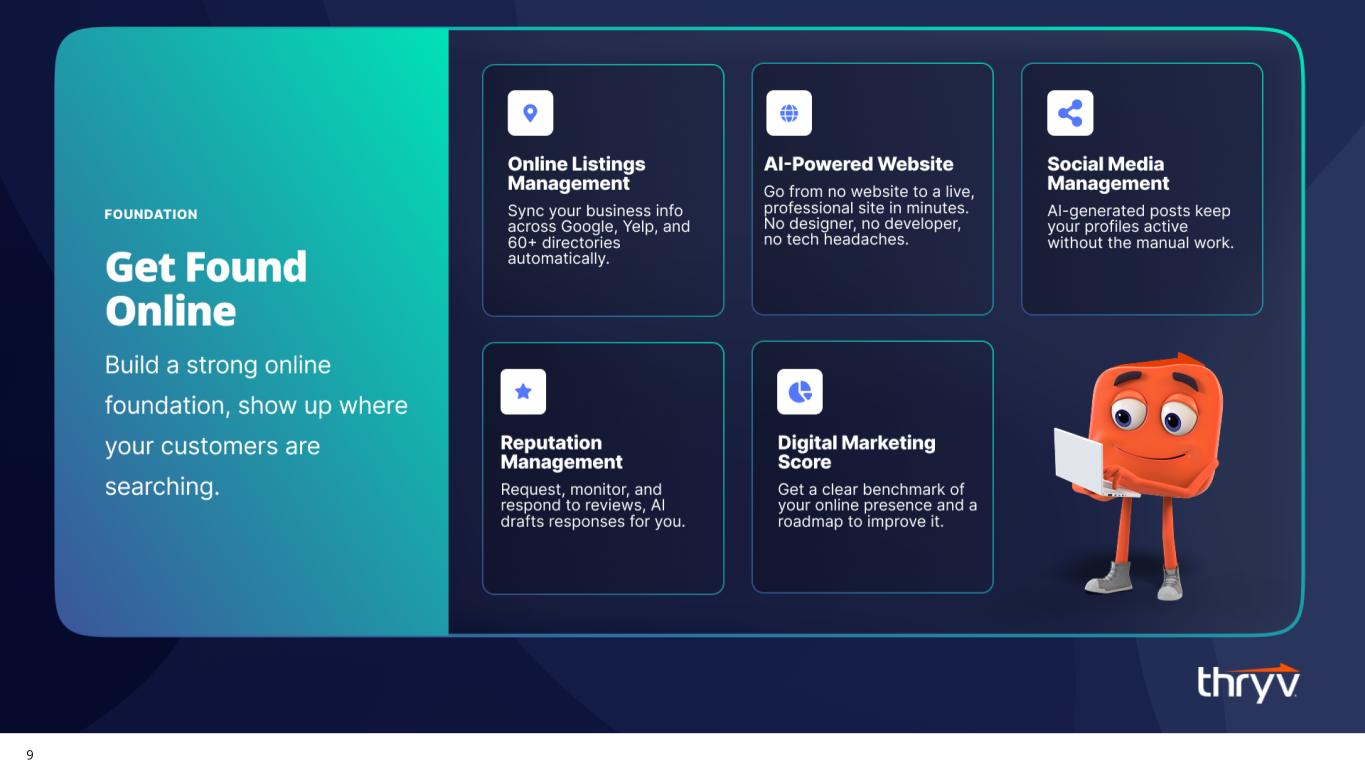
9
10
11
12 Q2 2026
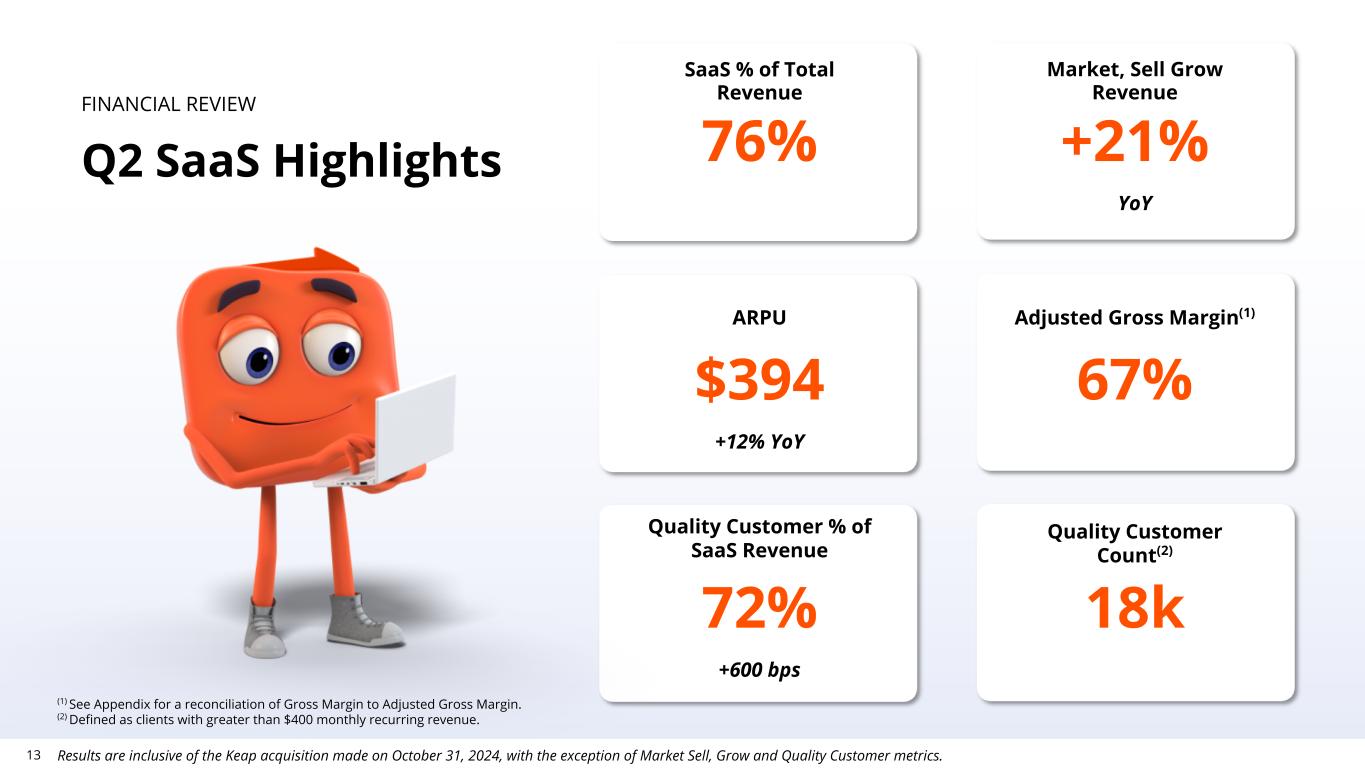
13 FINANCIAL REVIEW Q2 SaaS Highlights 76% +21% YoY $394 +12% YoY SaaS % of Total Revenue Market, Sell Grow Revenue ARPU Quality Customer % of SaaS Revenue 67% 72% +600 bps Adjusted Gross Margin(1) Results are inclusive of the Keap acquisition made on October 31, 2024, with the exception of Market Sell, Grow and Quality Customer metrics. (1) See Appendix for a reconciliation of Gross Margin to Adjusted Gross Margin. (2) Defined as clients with greater than $400 monthly recurring revenue. Quality Customer Count(2) 18k b YoY
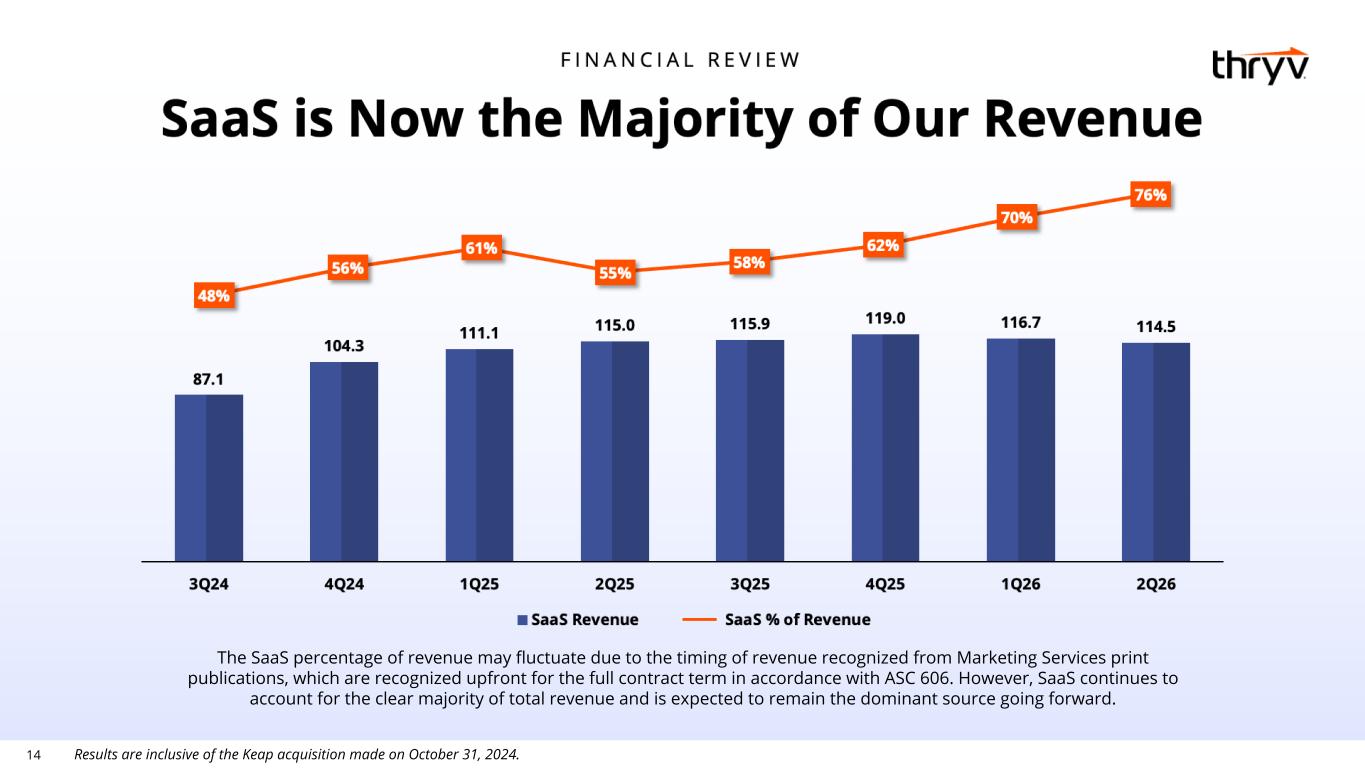
14 Results are inclusive of the Keap acquisition made on October 31, 2024. The SaaS percentage of revenue may fluctuate due to the timing of revenue recognized from Marketing Services print publications, which are recognized upfront for the full contract term in accordance with ASC 606. However, SaaS continues to account for the clear majority of total revenue and is expected to remain the dominant source going forward.
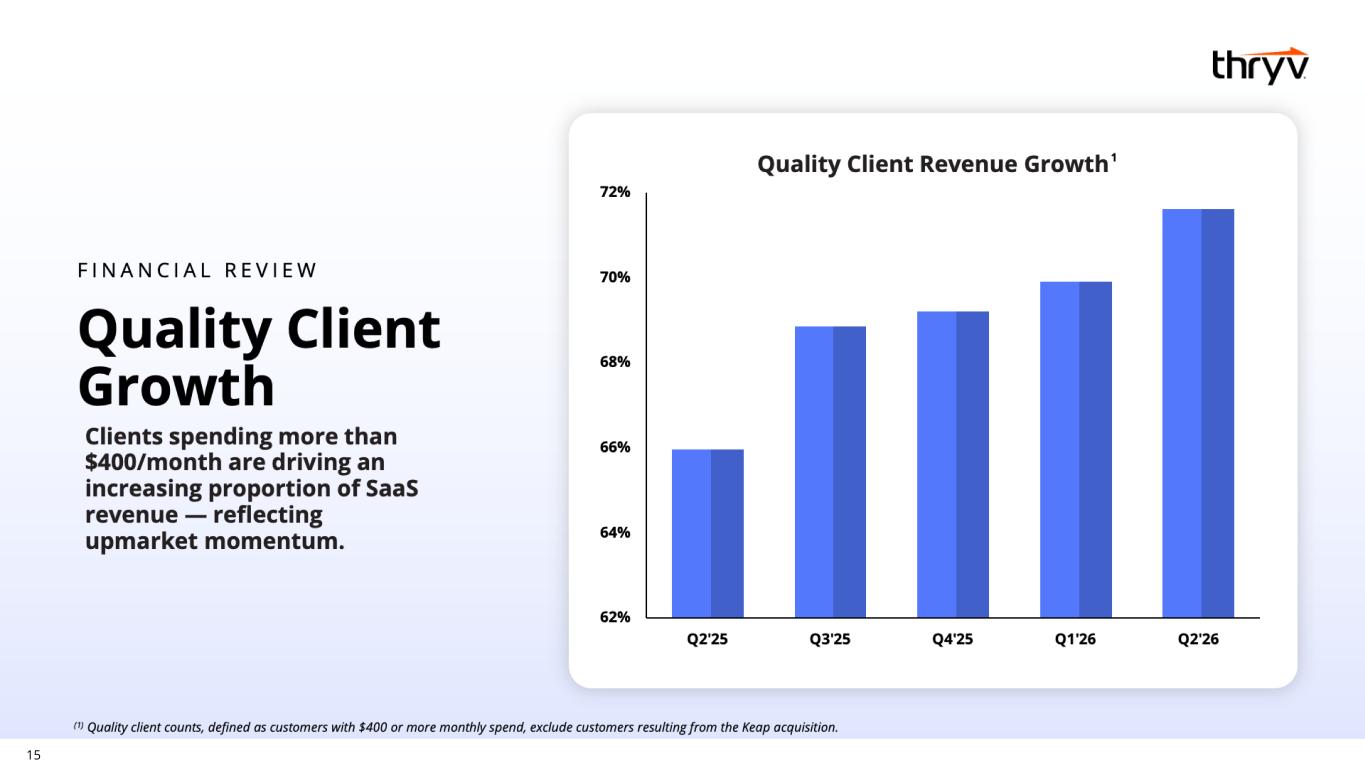
15
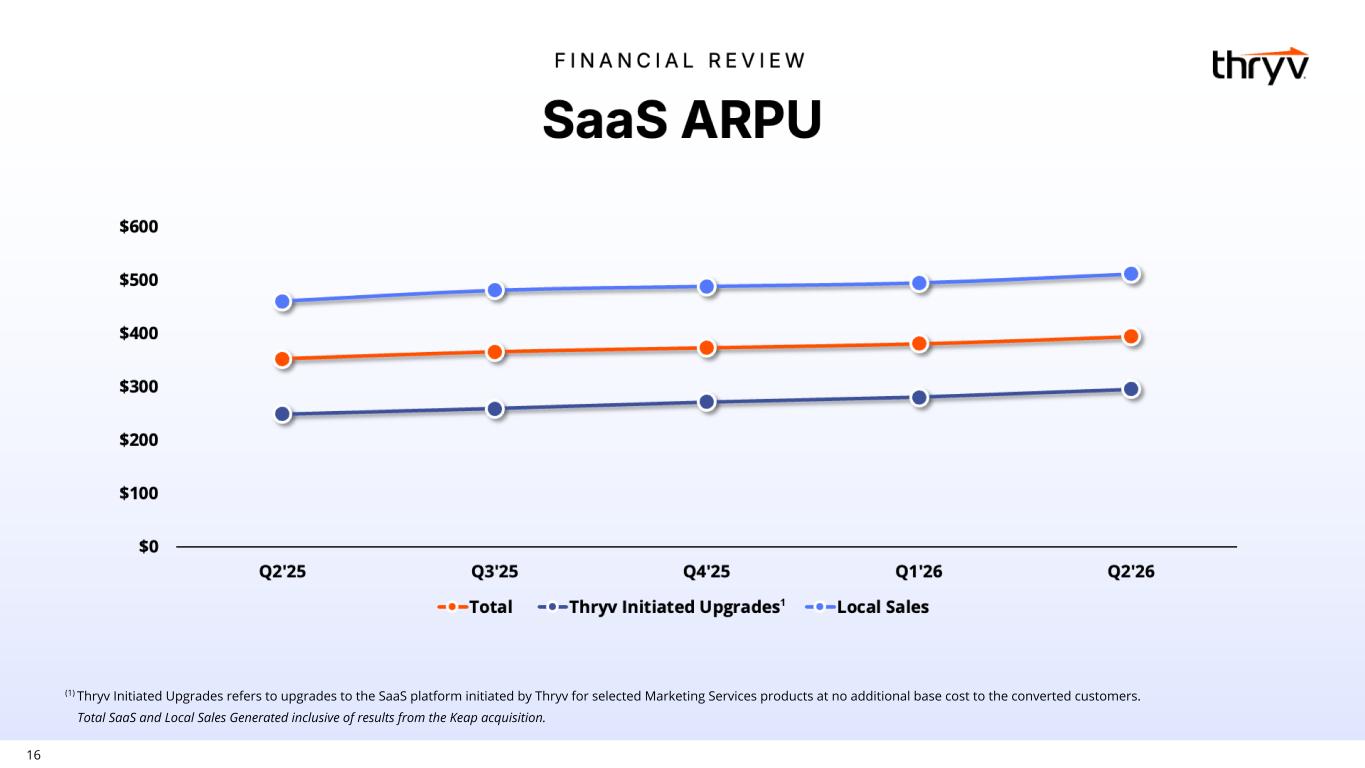
16 Total SaaS and Local Sales Generated inclusive of results from the Keap acquisition. (1) Thryv Initiated Upgrades refers to upgrades to the SaaS platform initiated by Thryv for selected Marketing Services products at no additional base cost to the converted customers.
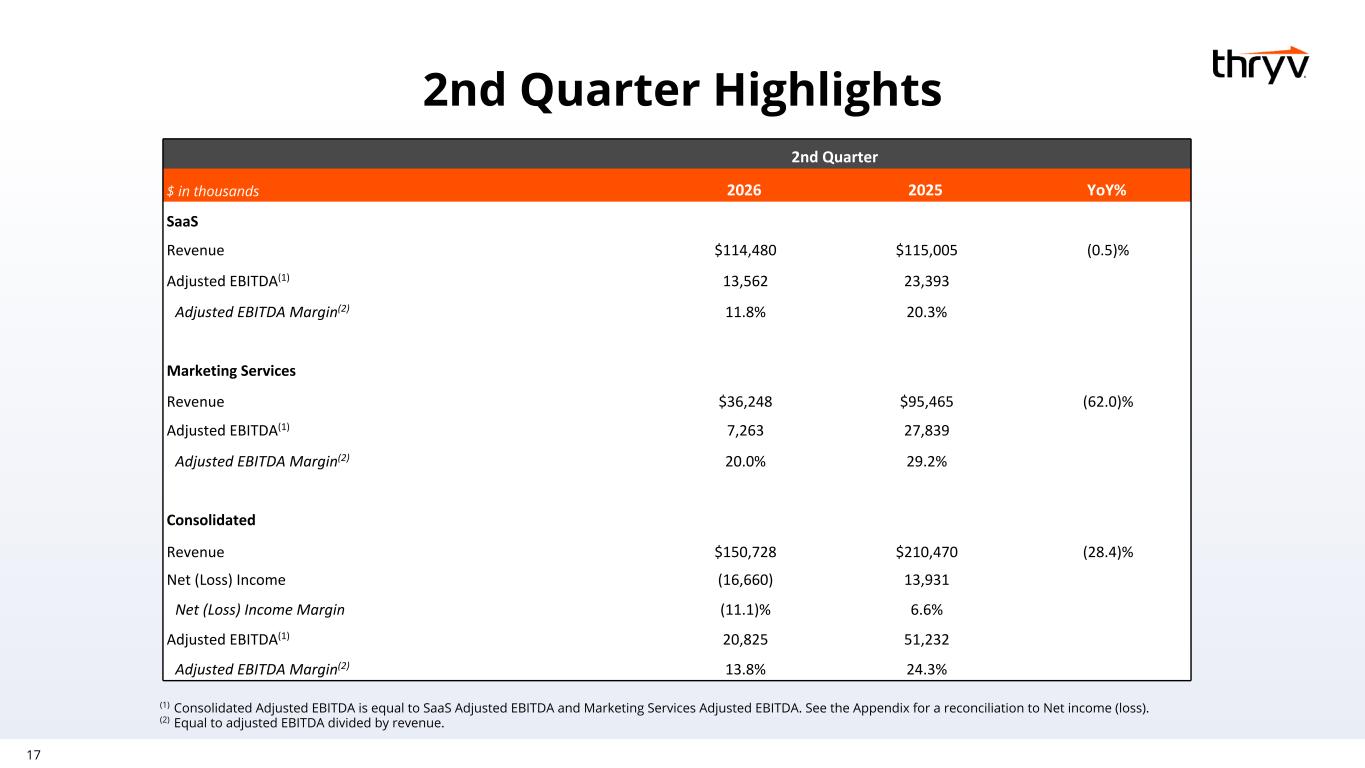
17 2nd Quarter $ in thousands 2026 2025 YoY% SaaS Revenue $114,480 $115,005 (0.5)% Adjusted EBITDA(1) 13,562 23,393 Adjusted EBITDA Margin(2) 11.8% 20.3% Marketing Services Revenue $36,248 $95,465 (62.0)% Adjusted EBITDA(1) 7,263 27,839 Adjusted EBITDA Margin(2) 20.0% 29.2% Consolidated Revenue $150,728 $210,470 (28.4)% Net (Loss) Income (16,660) 13,931 Net (Loss) Income Margin (11.1)% 6.6% Adjusted EBITDA(1) 20,825 51,232 Adjusted EBITDA Margin(2) 13.8% 24.3% 2nd Quarter Highlights (1) Consolidated Adjusted EBITDA is equal to SaaS Adjusted EBITDA and Marketing Services Adjusted EBITDA. See the Appendix for a reconciliation to Net income (loss). (2) Equal to adjusted EBITDA divided by revenue.
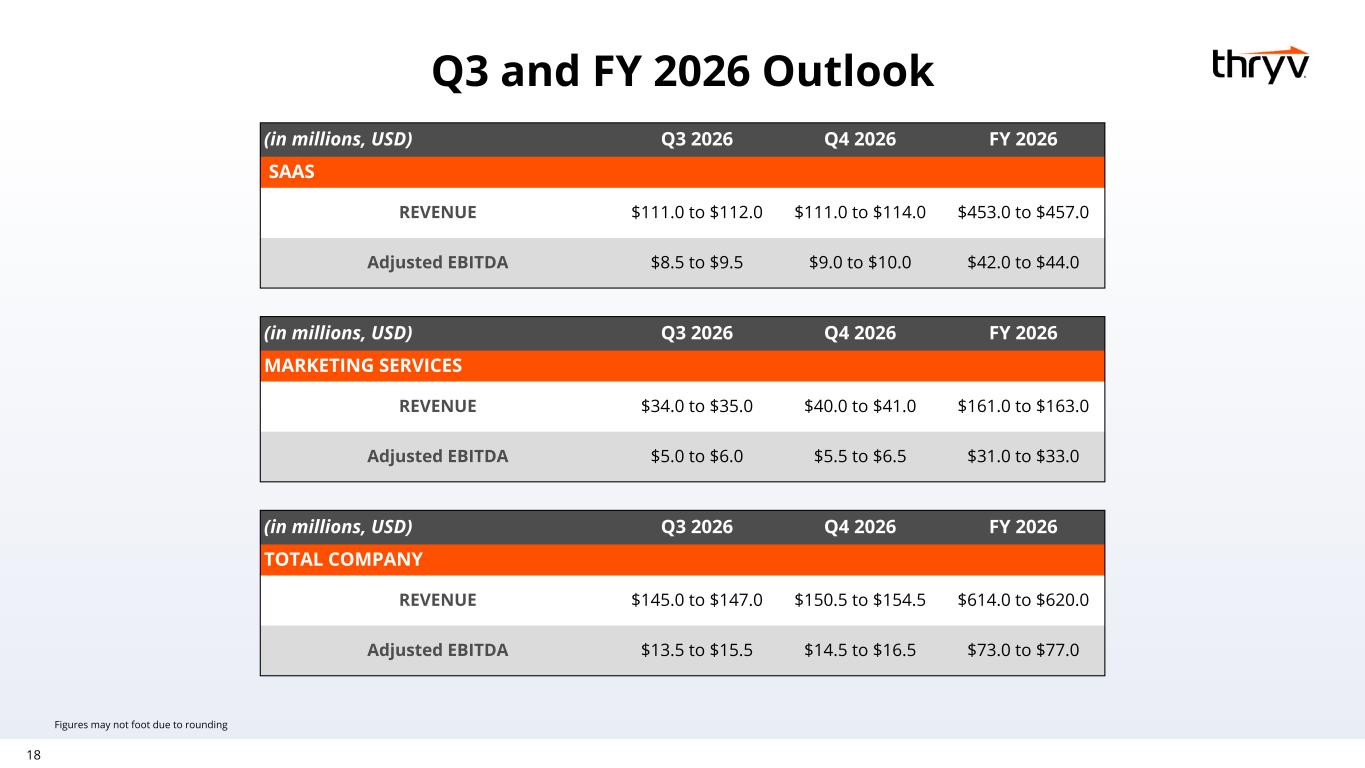
18 (in millions, USD) Q3 2026 Q4 2026 FY 2026 MARKETING SERVICES REVENUE $34.0 to $35.0 $40.0 to $41.0 $161.0 to $163.0 Adjusted EBITDA $5.0 to $6.0 $5.5 to $6.5 $31.0 to $33.0 (in millions, USD) Q3 2026 Q4 2026 FY 2026 SAAS REVENUE $111.0 to $112.0 $111.0 to $114.0 $453.0 to $457.0 Adjusted EBITDA $8.5 to $9.5 $9.0 to $10.0 $42.0 to $44.0 (in millions, USD) Q3 2026 Q4 2026 FY 2026 TOTAL COMPANY REVENUE $145.0 to $147.0 $150.5 to $154.5 $614.0 to $620.0 Adjusted EBITDA $13.5 to $15.5 $14.5 to $16.5 $73.0 to $77.0 Figures may not foot due to rounding Q3 and FY 2026 Outlook

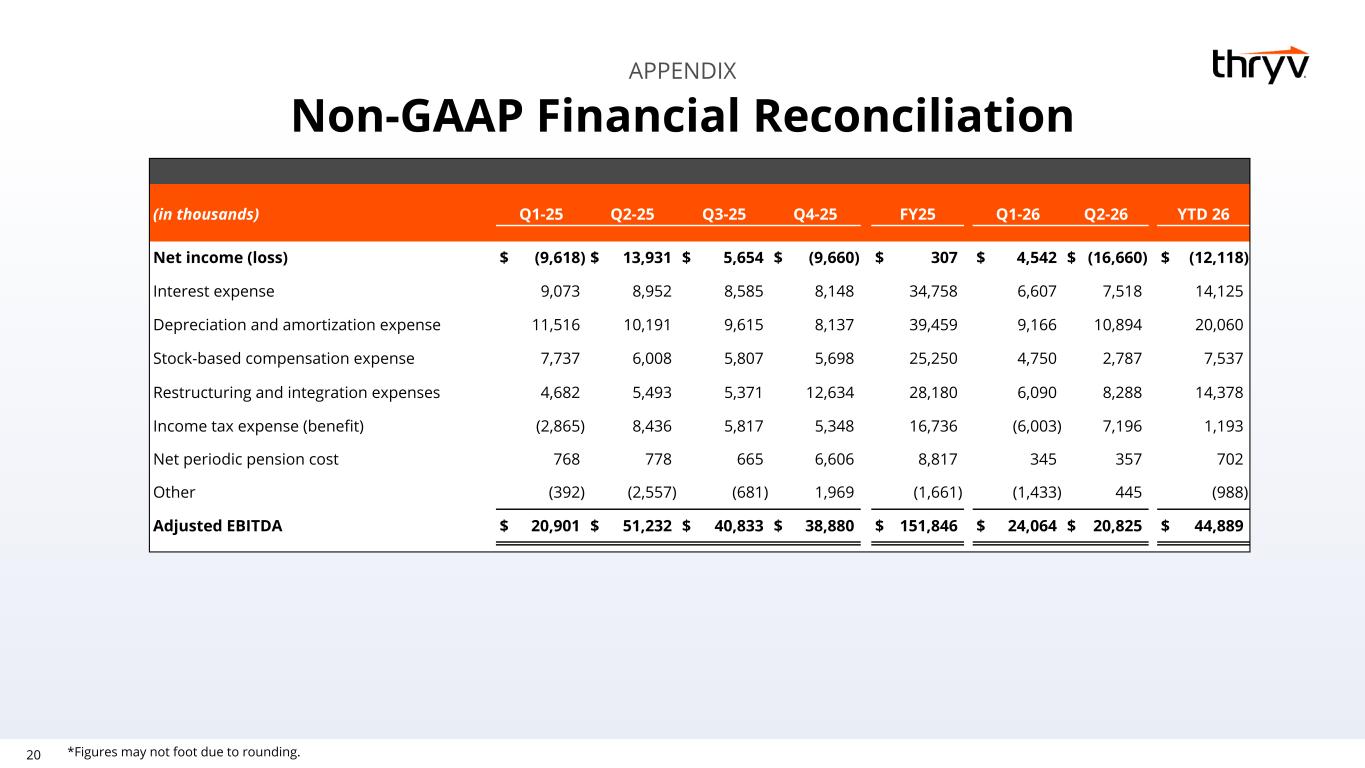
20 APPENDIX Non-GAAP Financial Reconciliation *Figures may not foot due to rounding. (in thousands) Q1-25 Q2-25 Q3-25 Q4-25 FY25 Q1-26 Q2-26 YTD 26 Net income (loss) $ (9,618) $ 13,931 $ 5,654 $ (9,660) $ 307 $ 4,542 $ (16,660) $ (12,118) Interest expense 9,073 8,952 8,585 8,148 34,758 6,607 7,518 14,125 Depreciation and amortization expense 11,516 10,191 9,615 8,137 39,459 9,166 10,894 20,060 Stock-based compensation expense 7,737 6,008 5,807 5,698 25,250 4,750 2,787 7,537 Restructuring and integration expenses 4,682 5,493 5,371 12,634 28,180 6,090 8,288 14,378 Income tax expense (benefit) (2,865) 8,436 5,817 5,348 16,736 (6,003) 7,196 1,193 Net periodic pension cost 768 778 665 6,606 8,817 345 357 702 Other (392) (2,557) (681) 1,969 (1,661) (1,433) 445 (988) Adjusted EBITDA $ 20,901 $ 51,232 $ 40,833 $ 38,880 $ 151,846 $ 24,064 $ 20,825 $ 44,889
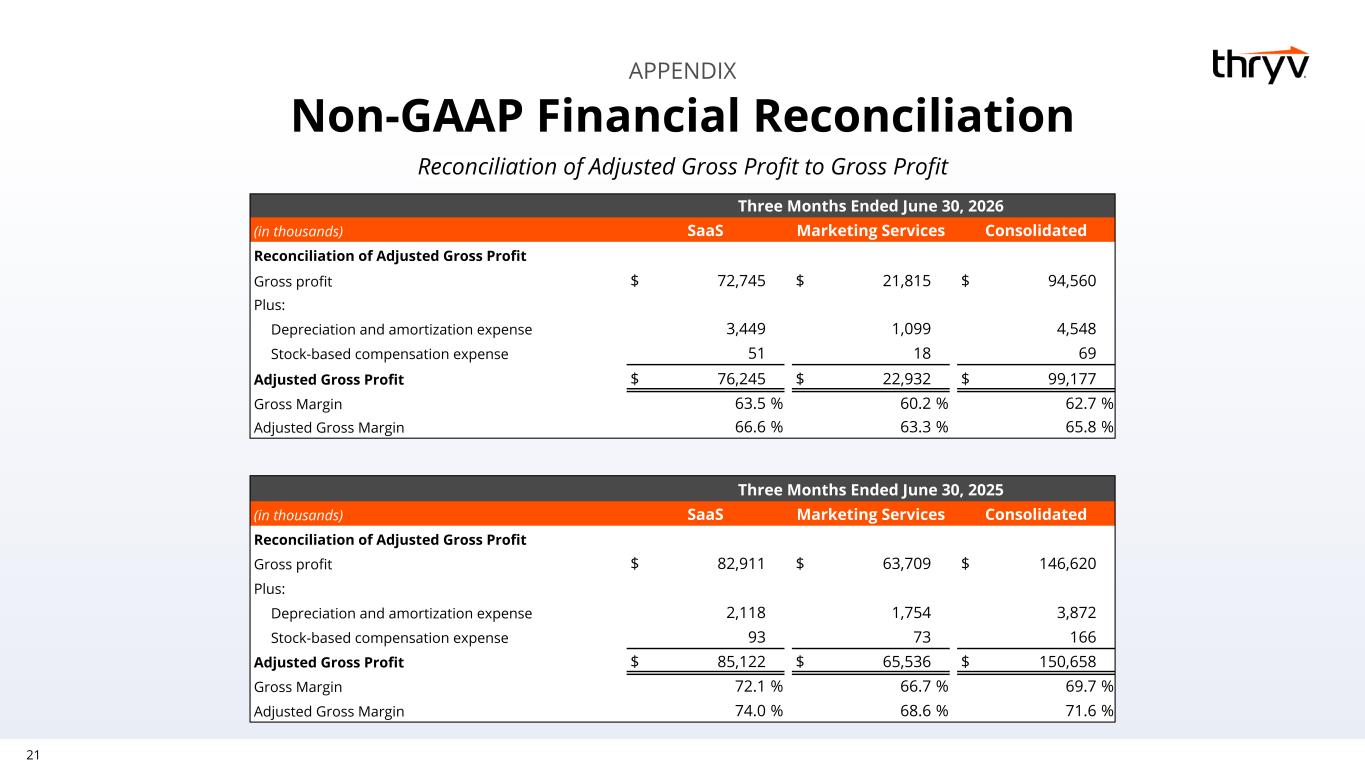
21 Reconciliation of Adjusted Gross Profit to Gross Profit APPENDIX Three Months Ended June 30, 2026 (in thousands) SaaS Marketing Services Consolidated Reconciliation of Adjusted Gross Profit Gross profit $ 72,745 $ 21,815 $ 94,560 Plus: Depreciation and amortization expense 3,449 1,099 4,548 Stock-based compensation expense 51 18 69 Adjusted Gross Profit $ 76,245 $ 22,932 $ 99,177 Gross Margin 63.5 % 60.2 % 62.7 % Adjusted Gross Margin 66.6 % 63.3 % 65.8 % Three Months Ended June 30, 2025 (in thousands) SaaS Marketing Services Consolidated Reconciliation of Adjusted Gross Profit Gross profit $ 82,911 $ 63,709 $ 146,620 Plus: Depreciation and amortization expense 2,118 1,754 3,872 Stock-based compensation expense 93 73 166 Adjusted Gross Profit $ 85,122 $ 65,536 $ 150,658 Gross Margin 72.1 % 66.7 % 69.7 % Adjusted Gross Margin 74.0 % 68.6 % 71.6 % Non-GAAP Financial Reconciliation
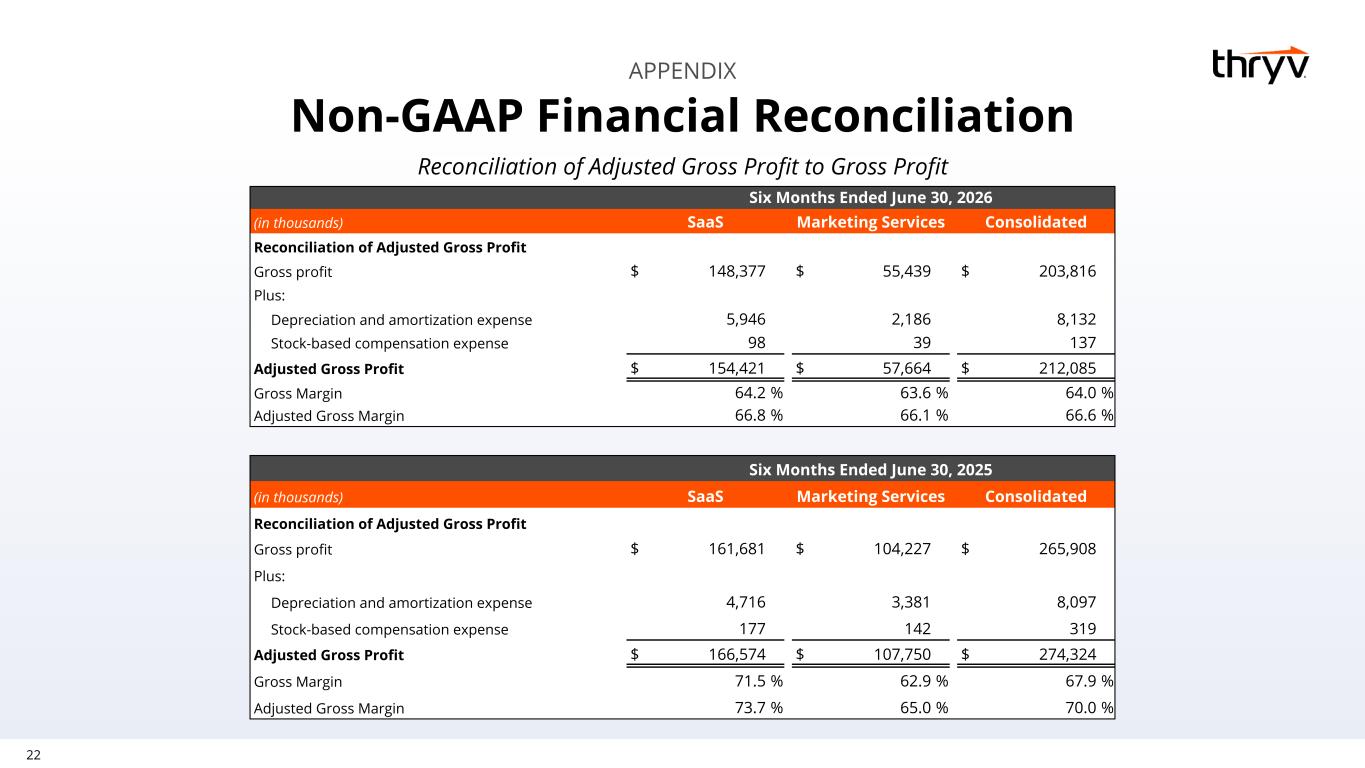
22 Reconciliation of Adjusted Gross Profit to Gross Profit APPENDIX Non-GAAP Financial Reconciliation Six Months Ended June 30, 2026 (in thousands) SaaS Marketing Services Consolidated Reconciliation of Adjusted Gross Profit Gross profit $ 148,377 $ 55,439 $ 203,816 Plus: Depreciation and amortization expense 5,946 2,186 8,132 Stock-based compensation expense 98 39 137 Adjusted Gross Profit $ 154,421 $ 57,664 $ 212,085 Gross Margin 64.2 % 63.6 % 64.0 % Adjusted Gross Margin 66.8 % 66.1 % 66.6 % Six Months Ended June 30, 2025 (in thousands) SaaS Marketing Services Consolidated Reconciliation of Adjusted Gross Profit Gross profit $ 161,681 $ 104,227 $ 265,908 Plus: Depreciation and amortization expense 4,716 3,381 8,097 Stock-based compensation expense 177 142 319 Adjusted Gross Profit $ 166,574 $ 107,750 $ 274,324 Gross Margin 71.5 % 62.9 % 67.9 % Adjusted Gross Margin 73.7 % 65.0 % 70.0 %
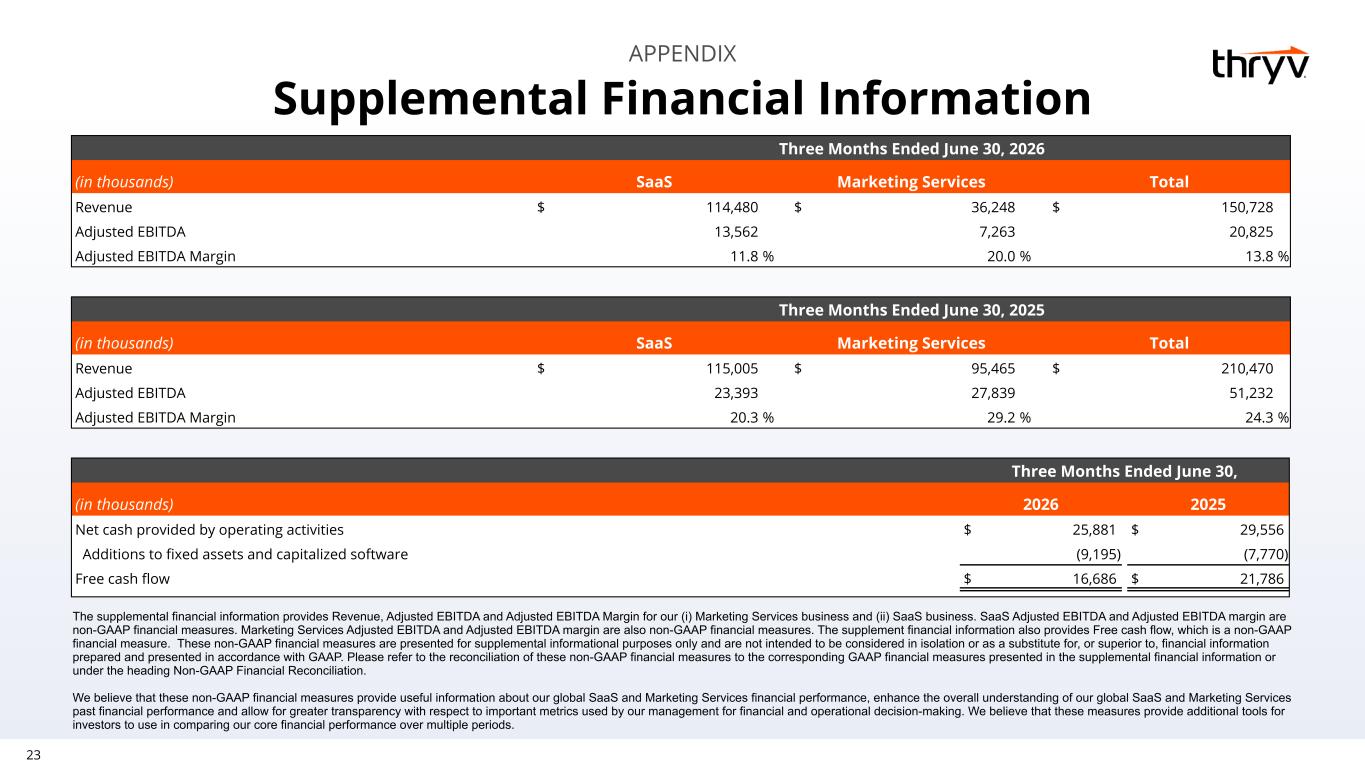
23 APPENDIX Supplemental Financial Information The supplemental financial information provides Revenue, Adjusted EBITDA and Adjusted EBITDA Margin for our (i) Marketing Services business and (ii) SaaS business. SaaS Adjusted EBITDA and Adjusted EBITDA margin are non-GAAP financial measures. Marketing Services Adjusted EBITDA and Adjusted EBITDA margin are also non-GAAP financial measures. The supplement financial information also provides Free cash flow, which is a non-GAAP financial measure. These non-GAAP financial measures are presented for supplemental informational purposes only and are not intended to be considered in isolation or as a substitute for, or superior to, financial information prepared and presented in accordance with GAAP. Please refer to the reconciliation of these non-GAAP financial measures to the corresponding GAAP financial measures presented in the supplemental financial information or under the heading Non-GAAP Financial Reconciliation. We believe that these non-GAAP financial measures provide useful information about our global SaaS and Marketing Services financial performance, enhance the overall understanding of our global SaaS and Marketing Services past financial performance and allow for greater transparency with respect to important metrics used by our management for financial and operational decision-making. We believe that these measures provide additional tools for investors to use in comparing our core financial performance over multiple periods. Three Months Ended June 30, 2026 (in thousands) SaaS Marketing Services Total Revenue $ 114,480 $ 36,248 $ 150,728 Adjusted EBITDA 13,562 7,263 20,825 Adjusted EBITDA Margin 11.8 % 20.0 % 13.8 % Three Months Ended June 30, (in thousands) 2026 2025 Net cash provided by operating activities $ 25,881 $ 29,556 Additions to fixed assets and capitalized software (9,195) (7,770) Free cash flow $ 16,686 $ 21,786 Three Months Ended June 30, 2025 (in thousands) SaaS Marketing Services Total Revenue $ 115,005 $ 95,465 $ 210,470 Adjusted EBITDA 23,393 27,839 51,232 Adjusted EBITDA Margin 20.3 % 29.2 % 24.3 %
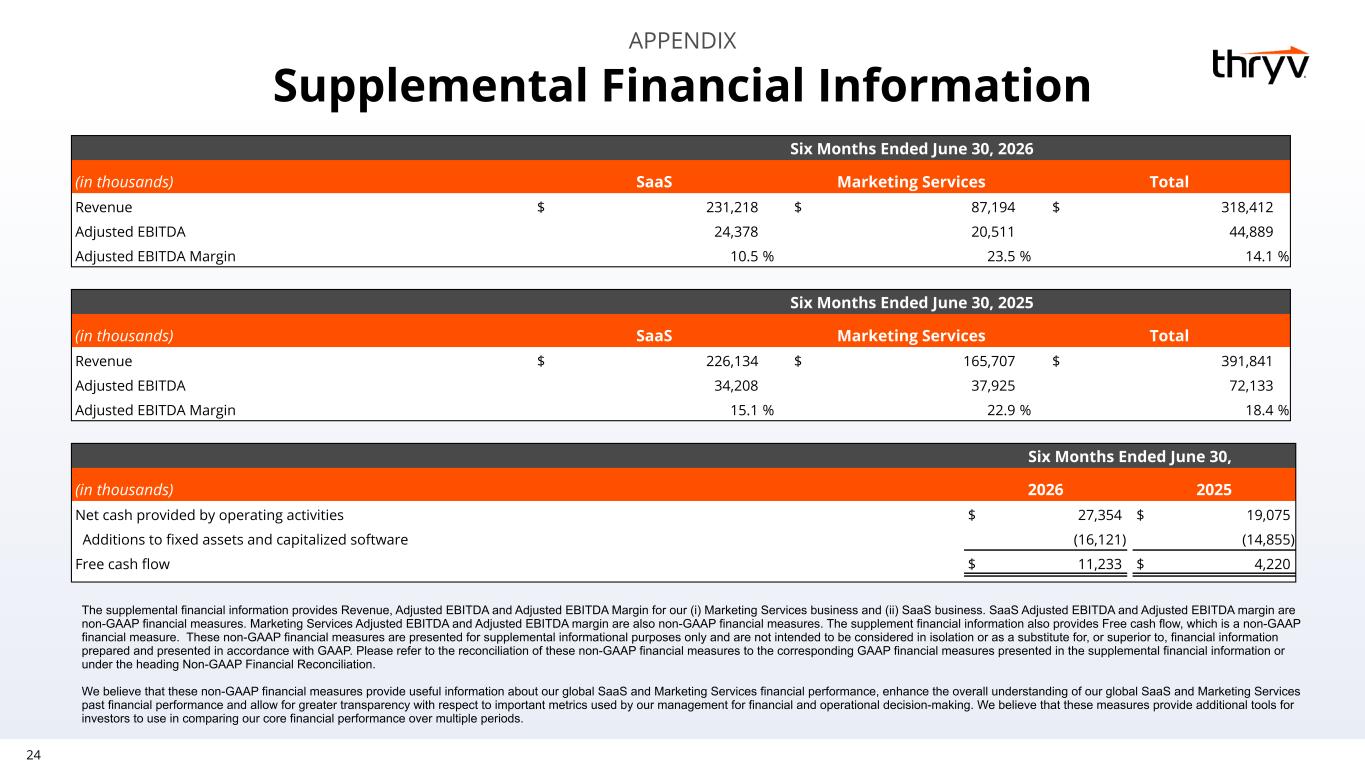
24 APPENDIX Six Months Ended June 30, (in thousands) 2026 2025 Net cash provided by operating activities $ 27,354 $ 19,075 Additions to fixed assets and capitalized software (16,121) (14,855) Free cash flow $ 11,233 $ 4,220 Supplemental Financial Information Six Months Ended June 30, 2026 (in thousands) SaaS Marketing Services Total Revenue $ 231,218 $ 87,194 $ 318,412 Adjusted EBITDA 24,378 20,511 44,889 Adjusted EBITDA Margin 10.5 % 23.5 % 14.1 % Six Months Ended June 30, 2025 (in thousands) SaaS Marketing Services Total Revenue $ 226,134 $ 165,707 $ 391,841 Adjusted EBITDA 34,208 37,925 72,133 Adjusted EBITDA Margin 15.1 % 22.9 % 18.4 % The supplemental financial information provides Revenue, Adjusted EBITDA and Adjusted EBITDA Margin for our (i) Marketing Services business and (ii) SaaS business. SaaS Adjusted EBITDA and Adjusted EBITDA margin are non-GAAP financial measures. Marketing Services Adjusted EBITDA and Adjusted EBITDA margin are also non-GAAP financial measures. The supplement financial information also provides Free cash flow, which is a non-GAAP financial measure. These non-GAAP financial measures are presented for supplemental informational purposes only and are not intended to be considered in isolation or as a substitute for, or superior to, financial information prepared and presented in accordance with GAAP. Please refer to the reconciliation of these non-GAAP financial measures to the corresponding GAAP financial measures presented in the supplemental financial information or under the heading Non-GAAP Financial Reconciliation. We believe that these non-GAAP financial measures provide useful information about our global SaaS and Marketing Services financial performance, enhance the overall understanding of our global SaaS and Marketing Services past financial performance and allow for greater transparency with respect to important metrics used by our management for financial and operational decision-making. We believe that these measures provide additional tools for investors to use in comparing our core financial performance over multiple periods.
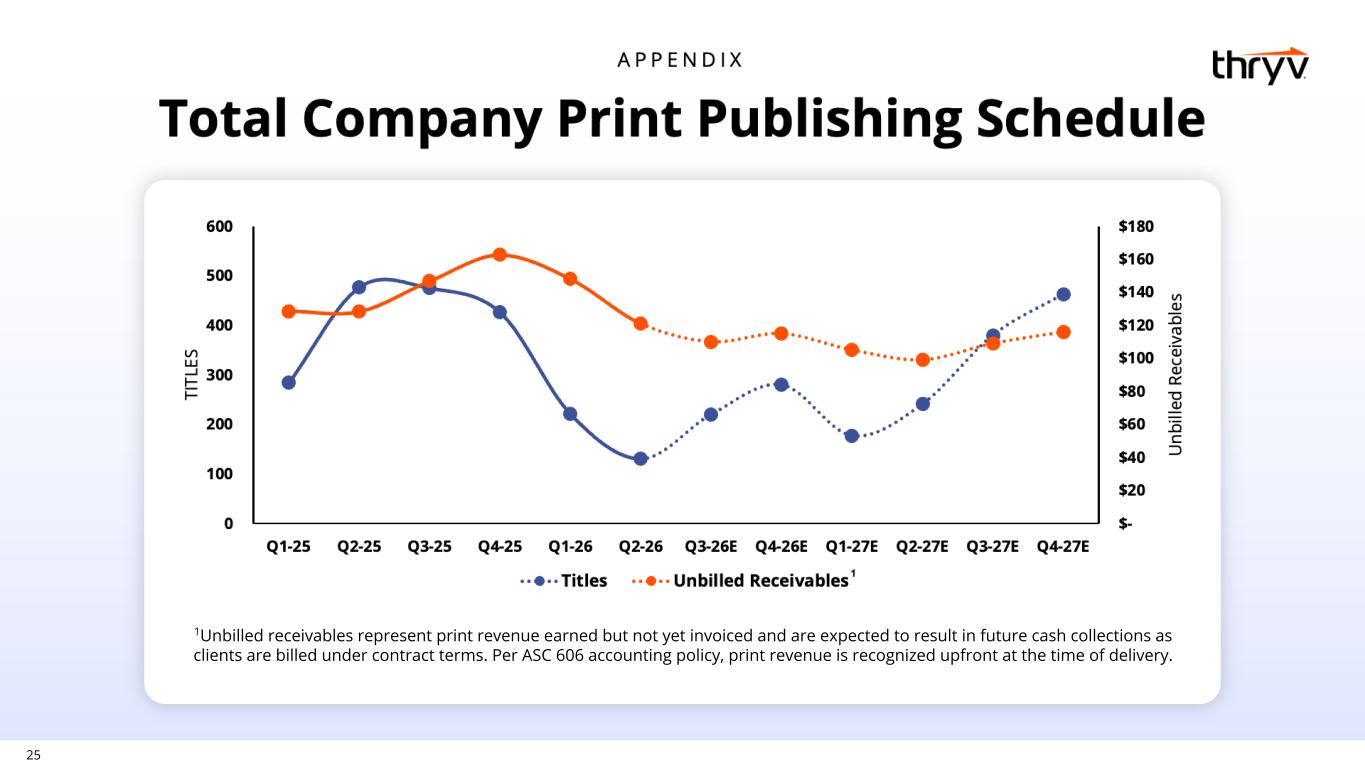
25 1Unbilled receivables represent print revenue earned but not yet invoiced and are expected to result in future cash collections as clients are billed under contract terms. Per ASC 606 accounting policy, print revenue is recognized upfront at the time of delivery.
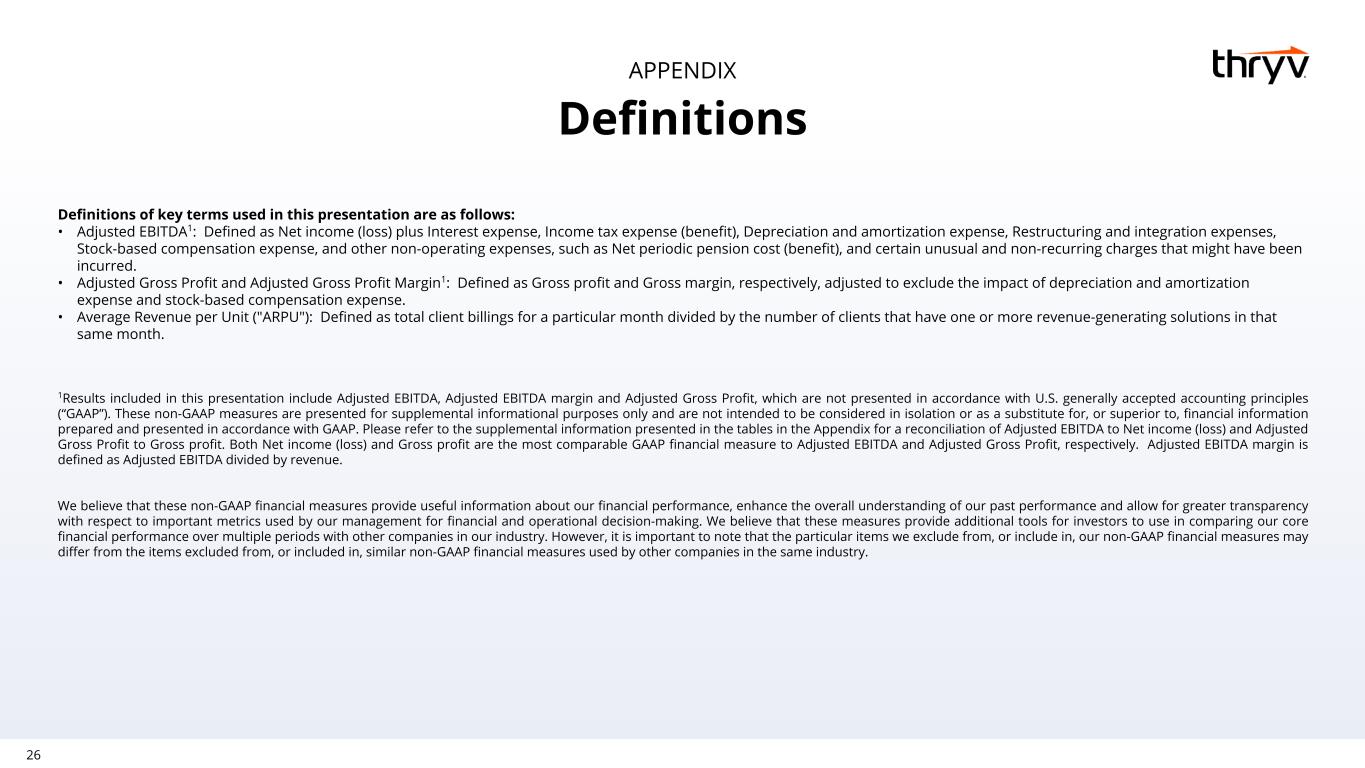
26 APPENDIX Definitions Definitions of key terms used in this presentation are as follows: • Adjusted EBITDA1: Defined as Net income (loss) plus Interest expense, Income tax expense (benefit), Depreciation and amortization expense, Restructuring and integration expenses, Stock-based compensation expense, and other non-operating expenses, such as Net periodic pension cost (benefit), and certain unusual and non-recurring charges that might have been incurred. • Adjusted Gross Profit and Adjusted Gross Profit Margin1: Defined as Gross profit and Gross margin, respectively, adjusted to exclude the impact of depreciation and amortization expense and stock-based compensation expense. • Average Revenue per Unit ("ARPU"): Defined as total client billings for a particular month divided by the number of clients that have one or more revenue-generating solutions in that same month. 1Results included in this presentation include Adjusted EBITDA, Adjusted EBITDA margin and Adjusted Gross Profit, which are not presented in accordance with U.S. generally accepted accounting principles (“GAAP”). These non-GAAP measures are presented for supplemental informational purposes only and are not intended to be considered in isolation or as a substitute for, or superior to, financial information prepared and presented in accordance with GAAP. Please refer to the supplemental information presented in the tables in the Appendix for a reconciliation of Adjusted EBITDA to Net income (loss) and Adjusted Gross Profit to Gross profit. Both Net income (loss) and Gross profit are the most comparable GAAP financial measure to Adjusted EBITDA and Adjusted Gross Profit, respectively. Adjusted EBITDA margin is defined as Adjusted EBITDA divided by revenue. We believe that these non-GAAP financial measures provide useful information about our financial performance, enhance the overall understanding of our past performance and allow for greater transparency with respect to important metrics used by our management for financial and operational decision-making. We believe that these measures provide additional tools for investors to use in comparing our core financial performance over multiple periods with other companies in our industry. However, it is important to note that the particular items we exclude from, or include in, our non-GAAP financial measures may differ from the items excluded from, or included in, similar non-GAAP financial measures used by other companies in the same industry.