
Exhibit 99.1 Public Service Enterprise Group SECOND QUARTER 2026 NYSE: PEG Financial Results Presentation August 4, 2026
PSEG Second Quarter 2026 Forward-Looking Statements Certain of the matters discussed in this report about our and our subsidiaries’ future performance, • development, adoption and use of Artificial Intelligence by us and our third-party vendors; • fluctuations in, or third-party default risk in wholesale power and natural gas markets, including, without limitation, future revenues, earnings, strategies, prospects, consequences, and including the potential impacts on the economic viability of our generation units; all other statements that are not purely historical constitute “forward-looking statements” within • the ability to obtain adequate nuclear fuel supply; the meaning of the Private Securities Litigation Reform Act of 1995. Such forward-looking • changes in technology related to energy generation, distribution and consumption and statements are subject to risks and uncertainties, which could cause actual results to differ changes in customer usage patterns; • third-party credit risk relating to our sale of nuclear generation output and purchase of materially from those anticipated. Such statements are based on management’s beliefs as well as nuclear fuel; assumptions made by and information currently available to management. When used herein, the • any inability to meet our commitments under forward sale obligations and Regional words “anticipate,” “intend,” “estimate,” “believe,” “expect,” “plan,” “should,” “hypothetical,” Transmission Organization rules; “potential,” “forecast,” “project,” variations of such words and similar expressions are intended to • risks associated with generation activities at, and operation of, the Peach Bottom plants, which are similar to those to which nuclear generation plants that we operate are subject; identify forward-looking statements. Factors that may cause actual results to differ are often • the impact of changes in state and federal legislation and regulations on our business, presented with the forward-looking statements themselves. Other factors that could cause actual including PSE&G’s ability to recover costs and earn returns on authorized investments; results to differ materially from those contemplated in any forward-looking statements made by us • PSE&G’s proposed investment projects or programs may not be fully approved by regulators herein are discussed in filings we make with the United States Securities and Exchange and its capital investment may be lower than planned; • our ability to receive sufficient financial support for our New Jersey nuclear plants from the Commission (SEC), including our Annual Report on Form 10-K and subsequent reports on Form markets, and/or production tax credits; 10-Q and Form 8-K. These factors include, but are not limited to: • adverse changes in and non-compliance with energy industry laws, policies, regulations and • any inability to successfully develop, obtain regulatory approval for, or construct transmission standards, including market structures and transmission planning and transmission returns; and distribution, and our nuclear generation projects; • risks associated with our ownership and operation of nuclear facilities, including increased • significant resource adequacy challenges that present affordability and reliability concerns nuclear fuel storage costs, regulatory risks, such as compliance with the Atomic Energy Act and that could cause policymakers to implement responsive measures that could have a and trade control, environmental and other regulations, as well as operational, financial, material, adverse impact on our business, strategy, growth rates, cash flows, results of environmental and health and safety risks; operations, and financial condition and increase regulatory uncertainty for utility investment • changes in or violation of federal, state and local environmental laws and regulations and initiatives and programs; enforcement; • the physical, financial and transition risks related to climate change, including risks relating to • delays in receipt of, or an inability to receive, necessary licenses and permits and siting potentially increased legislative and regulatory burdens, changing customer preferences and approvals; and lawsuits; • changes in tax laws and regulations. • any equipment failures, gas explosions, accidents, critical operating technology or business system failures, natural disasters, severe weather events, acts of war, terrorism or other acts All of the forward-looking statements made in this report are qualified by these cautionary of violence, sabotage, physical attacks or security breaches, cyberattacks or other incidents statements and we cannot assure you that the results or developments anticipated by that may impact our ability to provide safe and reliable service to our customers; management will be realized or even if realized, will have the expected consequences to, or • any inability to recover the carrying amount of our long-lived assets; • disruptions or cost increases in our supply chain, including labor shortages; effects on, us or our business, prospects, financial condition, results of operations or cash flows. • any inability to maintain sufficient liquidity or access sufficient capital on commercially Readers are cautioned not to place undue reliance on these forward-looking statements in reasonable terms; making any investment decision. Forward-looking statements made in this report apply only as • the impact of cybersecurity attacks or intrusions or other disruptions to our information of the date of this report. While we may elect to update forward-looking statements from time to technology, operational or other systems; • failure to attract and retain a qualified workforce; time, we specifically disclaim any obligation to do so, even in light of new information or future • increases in the costs of equipment, materials, fuel, services and labor; events, unless otherwise required by applicable securities laws. • the impact of our covenants in our debt instruments and credit agreements on our business; • adverse performance of our defined benefit plan trust funds and Nuclear Decommissioning The forward-looking statements contained in this report are intended to qualify for the safe Trust Fund and increases in funding requirements; harbor provisions of Section 27A of the Securities Act of 1933, as amended, and Section 21E of • any inability to enter into or extend certain significant contracts; the Securities Exchange Act of 1934, as amended. 2 2
PSEG Second Quarter 2026 GAAP Disclaimer PSEG presents Operating Earnings in addition to its Net Income/(Loss) reported in Non-GAAP FFO reflects cash from operations excluding working capital and accordance with accounting principles generally accepted in the United States adjusts for certain items including taxes on asset sales, cost of removal and energy (GAAP). Operating Earnings is a non-GAAP financial measure that differs from Net efficiency investments. Non-GAAP Debt consists of long-term debt, short-term debt Income/(Loss). Non-GAAP Operating Earnings exclude the impact of gains (losses) and other imputed debt primarily related to an unfunded pension obligation. Non- associated with the Nuclear Decommissioning Trust (NDT), Mark-to-Market (MTM) GAAP FFO, as referenced in this presentation, may not be comparable to similarly accounting and other material infrequent items. The last two slides in this titled measures used by other companies. Given the forward-looking nature of non- presentation (Slides A and B) include a list of items excluded from Net GAAP Operating Earnings and non-GAAP FFO estimates and our inability to Income/(Loss) to reconcile to non-GAAP Operating Earnings. project certain reconciling items that would be excluded from the most directly comparable GAAP measures – such as MTM and NDT gains (losses), with respect Management uses non-GAAP Operating Earnings in its internal analysis, and in non-GAAP Operating Earnings; working capital (including accounts communications with investors and analysts, as a consistent measure for receivable/payable, cash collateral), adjustments to Net Income/(Loss) (including comparing PSEG’s financial performance to previous financial results. The changes in regulatory assets/liabilities, deferred taxes) with respect to non-GAAP presentation of non-GAAP Operating Earnings is intended to complement, and FFO and non-GAAP debt and imputed debt (including unfunded pension obligation) should not be considered an alternative to, the presentation of Net Income/(Loss), with respect to non-GAAP debt - due to the volatility, complexity and low visibility of which is an indicator of financial performance determined in accordance with these items, PSEG is unable to reconcile these non-GAAP financial measures to GAAP. In addition, non-GAAP Operating Earnings as presented in this release may the most directly comparable GAAP financial measure. These items are uncertain, not be comparable to similarly titled measures used by other companies. depend on various factors, and may have a material impact on our future GAAP PSEG also includes forward-looking estimates of non-GAAP Operating Earnings results. Guidance included herein is as of August 4, 2026. and non-GAAP Funds From Operations (FFO), including the forward-looking non- GAAP FFO/Debt ratio target, in its presentations. From time to time, PSEG and PSE&G release important information via postings on their corporate Investor Relations website at https://investor.pseg.com. Investors and other interested parties are encouraged to visit the Investor Relations website to review new postings. You can sign up for automatic email alerts regarding new postings at the bottom of the webpage at https://investor.pseg.com or by navigating to the Email Alerts webpage here. The information on https://investor.pseg.com and https://investor.pseg.com/resources/email-alerts/default.aspx is not incorporated herein and is not part of this communication. 3 3
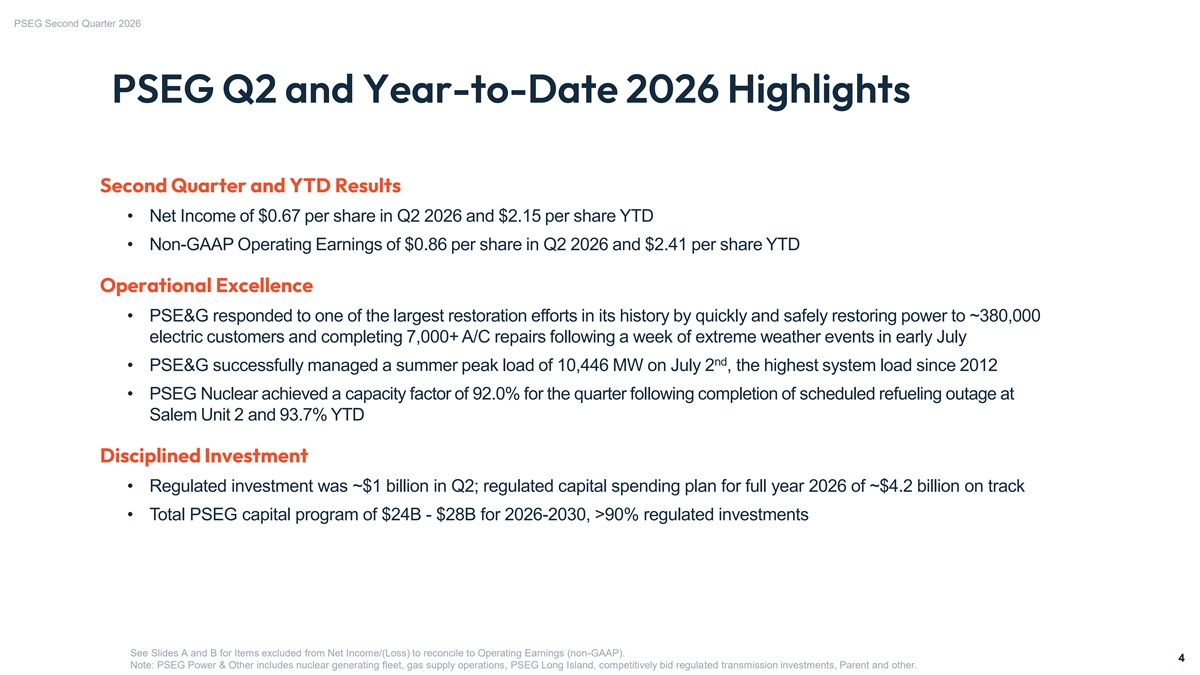
PSEG Second Quarter 2026 PSEG Q2 and Year-to-Date 2026 Highlights Second Quarter and YTD Results • Net Income of $0.67 per share in Q2 2026 and $2.15 per share YTD • Non-GAAP Operating Earnings of $0.86 per share in Q2 2026 and $2.41 per share YTD Operational Excellence • PSE&G responded to one of the largest restoration efforts in its history by quickly and safely restoring power to ~380,000 electric customers and completing 7,000+ A/C repairs following a week of extreme weather events in early July nd • PSE&G successfully managed a summer peak load of 10,446 MW on July 2 , the highest system load since 2012 • PSEG Nuclear achieved a capacity factor of 92.0% for the quarter following completion of scheduled refueling outage at Salem Unit 2 and 93.7% YTD Disciplined Investment • Regulated investment was ~$1 billion in Q2; regulated capital spending plan for full year 2026 of ~$4.2 billion on track • Total PSEG capital program of $24B - $28B for 2026-2030, >90% regulated investments See Slides A and B for Items excluded from Net Income/(Loss) to reconcile to Operating Earnings (non-GAAP). 4 4 Note: PSEG Power & Other includes nuclear generating fleet, gas supply operations, PSEG Long Island, competitively bid regulated transmission investments, Parent and other.
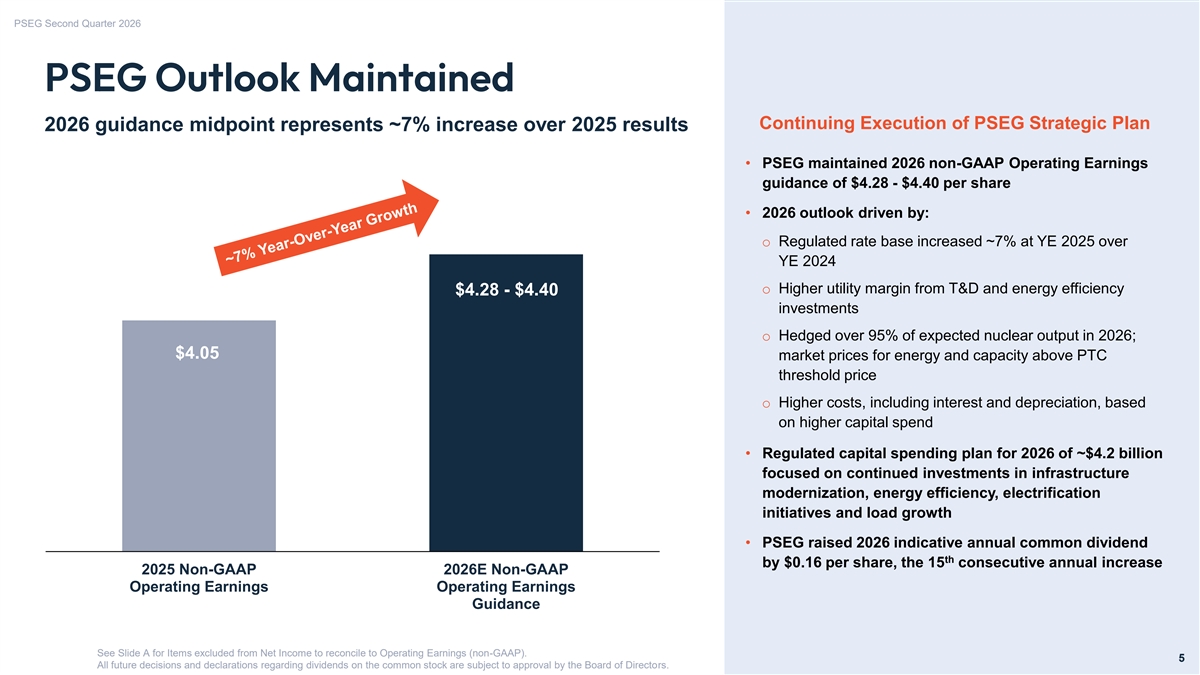
PSEG Second Quarter 2026 PSEG Outlook Maintained Continuing Execution of PSEG Strategic Plan 2026 guidance midpoint represents ~7% increase over 2025 results • PSEG maintained 2026 non-GAAP Operating Earnings guidance of $4.28 - $4.40 per share • 2026 outlook driven by: o Regulated rate base increased ~7% at YE 2025 over YE 2024 o Higher utility margin from T&D and energy efficiency $4.28 - $4.40 investments o Hedged over 95% of expected nuclear output in 2026; $4.05 market prices for energy and capacity above PTC threshold price o Higher costs, including interest and depreciation, based on higher capital spend • Regulated capital spending plan for 2026 of ~$4.2 billion focused on continued investments in infrastructure modernization, energy efficiency, electrification initiatives and load growth • PSEG raised 2026 indicative annual common dividend th by $0.16 per share, the 15 consecutive annual increase 2025 Non-GAAP 2026E Non-GAAP Operating Earnings Operating Earnings Guidance See Slide A for Items excluded from Net Income to reconcile to Operating Earnings (non-GAAP). 5 All future decisions and declarations regarding dividends on the common stock are subject to approval by the Board of Directors.
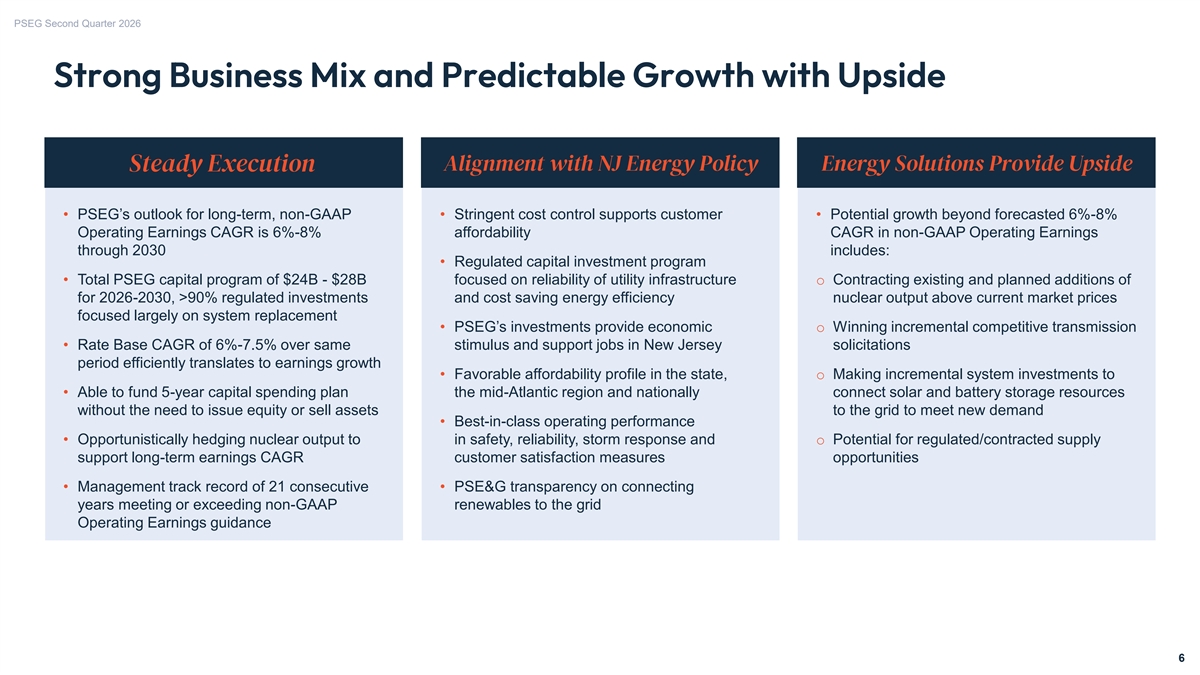
PSEG Second Quarter 2026 Strong Business Mix and Predictable Growth with Upside grams for Residential and C&I Customers grams for Residential and C&I Customers grams for Residential and C&I Customers Steady Execution Alignment with NJ Energy Policy Energy Solutions Provide Upside • PSEG’s outlook for long-term, non-GAAP • Stringent cost control supports customer • Potential growth beyond forecasted 6%-8% Operating Earnings CAGR is 6%-8% affordability CAGR in non-GAAP Operating Earnings through 2030 includes: • Regulated capital investment program • Total PSEG capital program of $24B - $28B focused on reliability of utility infrastructure o Contracting existing and planned additions of for 2026-2030, >90% regulated investments and cost saving energy efficiency nuclear output above current market prices focused largely on system replacement • PSEG’s investments provide economic o Winning incremental competitive transmission • Rate Base CAGR of 6%-7.5% over same stimulus and support jobs in New Jersey solicitations period efficiently translates to earnings growth • Favorable affordability profile in the state, o Making incremental system investments to • Able to fund 5-year capital spending plan the mid-Atlantic region and nationally connect solar and battery storage resources without the need to issue equity or sell assets to the grid to meet new demand • Best-in-class operating performance • Opportunistically hedging nuclear output to in safety, reliability, storm response and o Potential for regulated/contracted supply support long-term earnings CAGR customer satisfaction measures opportunities • Management track record of 21 consecutive • PSE&G transparency on connecting years meeting or exceeding non-GAAP renewables to the grid Operating Earnings guidance 6
PSEG Second Quarter 2026 Q2 2026 Review 7
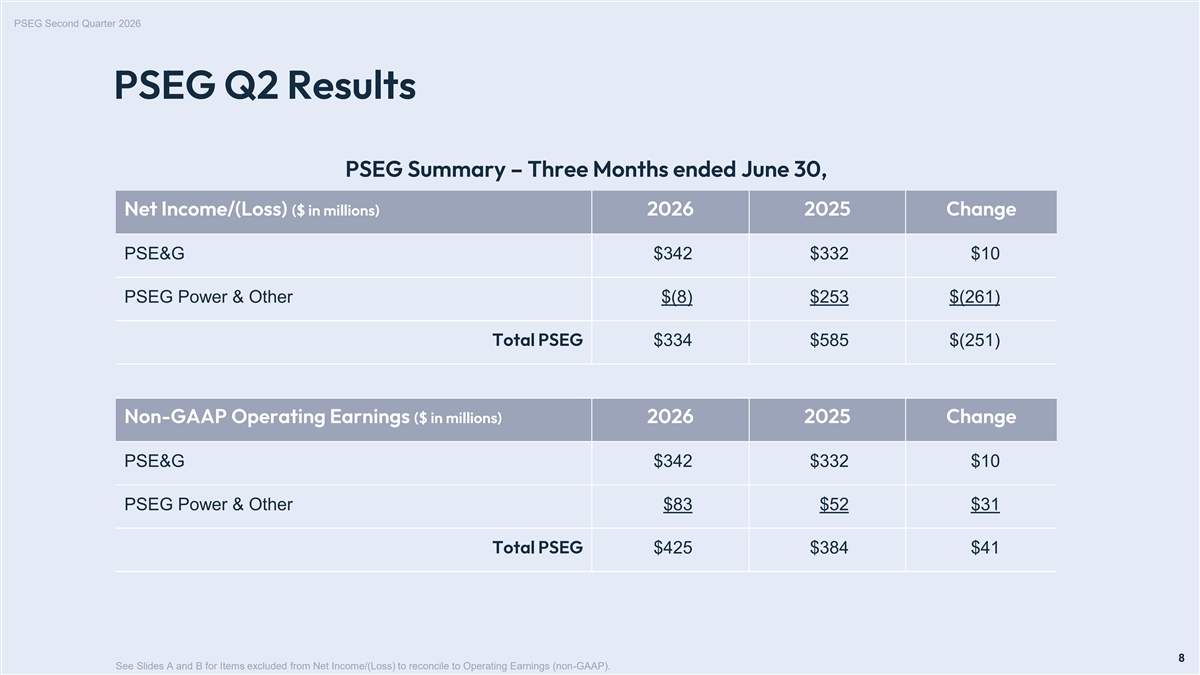
PSEG Second Quarter 2026 PSEG Q2 Results PSEG Summary – Three Months ended June 30, Net Income/(Loss) ($ in millions) 2026 2025 Change PSE&G $342 $332 $10 PSEG Power & Other $(8) $253 $(261) Total PSEG $334 $585 $(251) Non-GAAP Operating Earnings ($ in millions) 2026 2025 Change PSE&G $342 $332 $10 PSEG Power & Other $83 $52 $31 Total PSEG $425 $384 $41 8 8 See Slides A and B for Items excluded from Net Income/(Loss) to reconcile to Operating Earnings (non-GAAP).
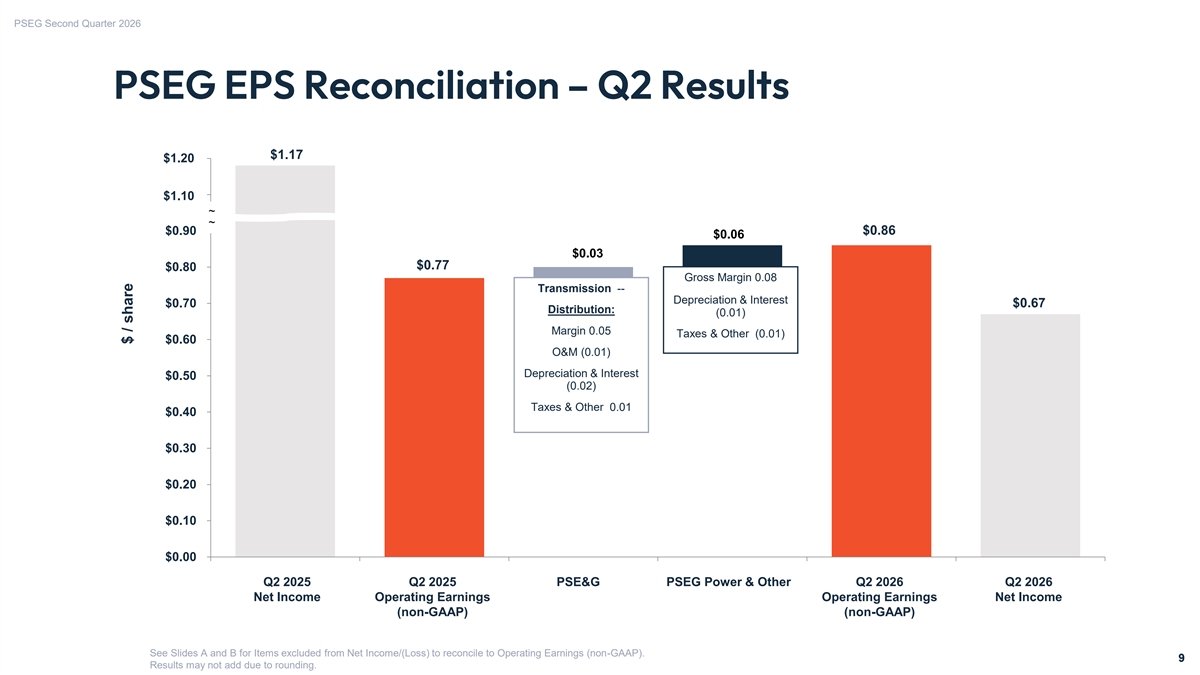
PSEG Second Quarter 2026 PSEG EPS Reconciliation – Q2 Results $1.17 $1.20 $1.10 $1.00 $1.10 ~ ~ $0.90 $0.86 $0.06 $0.03 $0.77 $0.80 Gross Margin 0.08 Transmission -- Depreciation & Interest $0.70 $0.67 Distribution: (0.01) Margin 0.05 Taxes & Other (0.01) $0.60 O&M (0.01) Depreciation & Interest $0.50 (0.02) Taxes & Other 0.01 $0.40 $0.30 $0.20 $0.10 $0.00 Q2 2025 Q2 2025 PSE&G PSEG Power & Other Q2 2026 Q2 2026 Net Income Operating Earnings Operating Earnings Net Income (non-GAAP) (non-GAAP) See Slides A and B for Items excluded from Net Income/(Loss) to reconcile to Operating Earnings (non-GAAP). 9 9 Results may not add due to rounding. $ / share
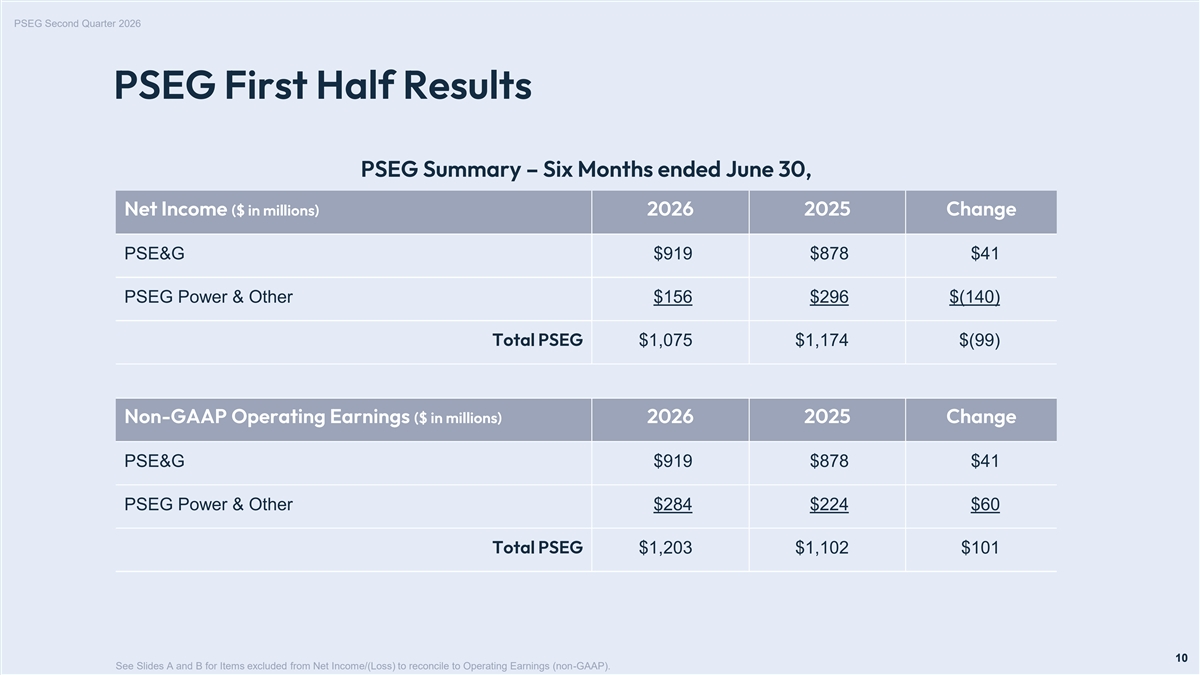
PSEG Second Quarter 2026 PSEG First Half Results PSEG Summary – Six Months ended June 30, Net Income ($ in millions) 2026 2025 Change PSE&G $919 $878 $41 PSEG Power & Other $156 $296 $(140) Total PSEG $1,075 $1,174 $(99) Non-GAAP Operating Earnings ($ in millions) 2026 2025 Change PSE&G $919 $878 $41 PSEG Power & Other $284 $224 $60 Total PSEG $1,203 $1,102 $101 10 10 See Slides A and B for Items excluded from Net Income/(Loss) to reconcile to Operating Earnings (non-GAAP).
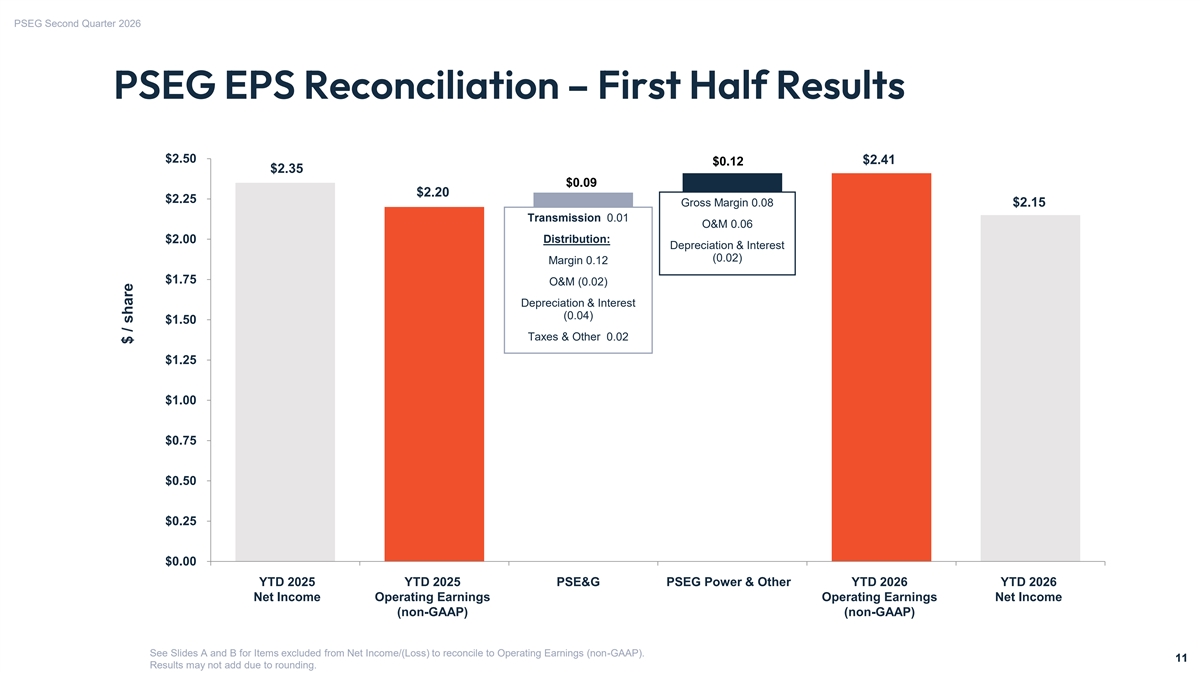
PSEG Second Quarter 2026 PSEG EPS Reconciliation – First Half Results $2.50 $2.41 $0.12 $2.35 $0.09 $2.20 $2.25 Gross Margin 0.08 $2.15 Transmission 0.01 O&M 0.06 $2.00 Distribution: Depreciation & Interest (0.02) Margin 0.12 $1.75 O&M (0.02) Depreciation & Interest (0.04) $1.50 Taxes & Other 0.02 $1.25 $1.00 $0.75 $0.50 $0.25 $0.00 YTD 2025 YTD 2025 PSE&G PSEG Power & Other YTD 2026 YTD 2026 Net Income Operating Earnings Operating Earnings Net Income (non-GAAP) (non-GAAP) See Slides A and B for Items excluded from Net Income/(Loss) to reconcile to Operating Earnings (non-GAAP). 11 11 Results may not add due to rounding. $ / share
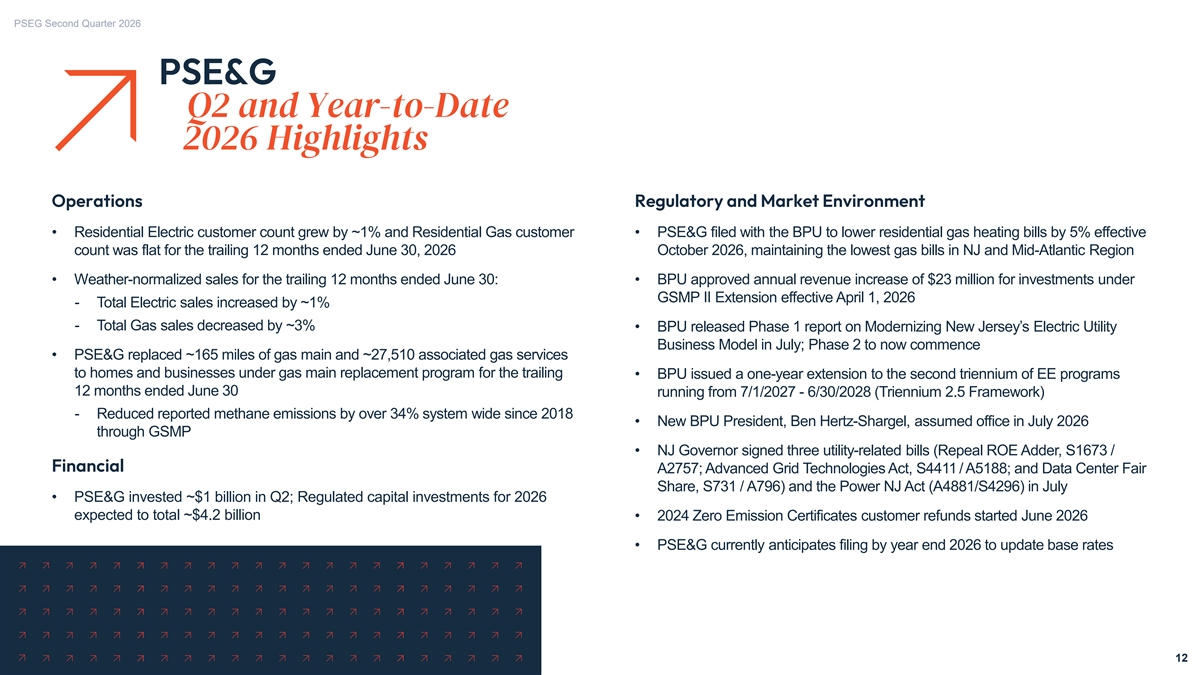
PSEG Second Quarter 2026 PSE&G Q2 and Year-to-Date 2026 Highlights Operations Regulatory and Market Environment • Residential Electric customer count grew by ~1% and Residential Gas customer • PSE&G filed with the BPU to lower residential gas heating bills by 5% effective count was flat for the trailing 12 months ended June 30, 2026 October 2026, maintaining the lowest gas bills in NJ and Mid-Atlantic Region • Weather-normalized sales for the trailing 12 months ended June 30: • BPU approved annual revenue increase of $23 million for investments under GSMP II Extension effective April 1, 2026 - Total Electric sales increased by ~1% - Total Gas sales decreased by ~3% • BPU released Phase 1 report on Modernizing New Jersey’s Electric Utility Business Model in July; Phase 2 to now commence • PSE&G replaced ~165 miles of gas main and ~27,510 associated gas services to homes and businesses under gas main replacement program for the trailing • BPU issued a one-year extension to the second triennium of EE programs 12 months ended June 30 running from 7/1/2027 - 6/30/2028 (Triennium 2.5 Framework) - Reduced reported methane emissions by over 34% system wide since 2018 • New BPU President, Ben Hertz-Shargel, assumed office in July 2026 through GSMP • NJ Governor signed three utility-related bills (Repeal ROE Adder, S1673 / Financial A2757; Advanced Grid Technologies Act, S4411 / A5188; and Data Center Fair Share, S731 / A796) and the Power NJ Act (A4881/S4296) in July • PSE&G invested ~$1 billion in Q2; Regulated capital investments for 2026 expected to total ~$4.2 billion • 2024 Zero Emission Certificates customer refunds started June 2026 • PSE&G currently anticipates filing by year end 2026 to update base rates 12
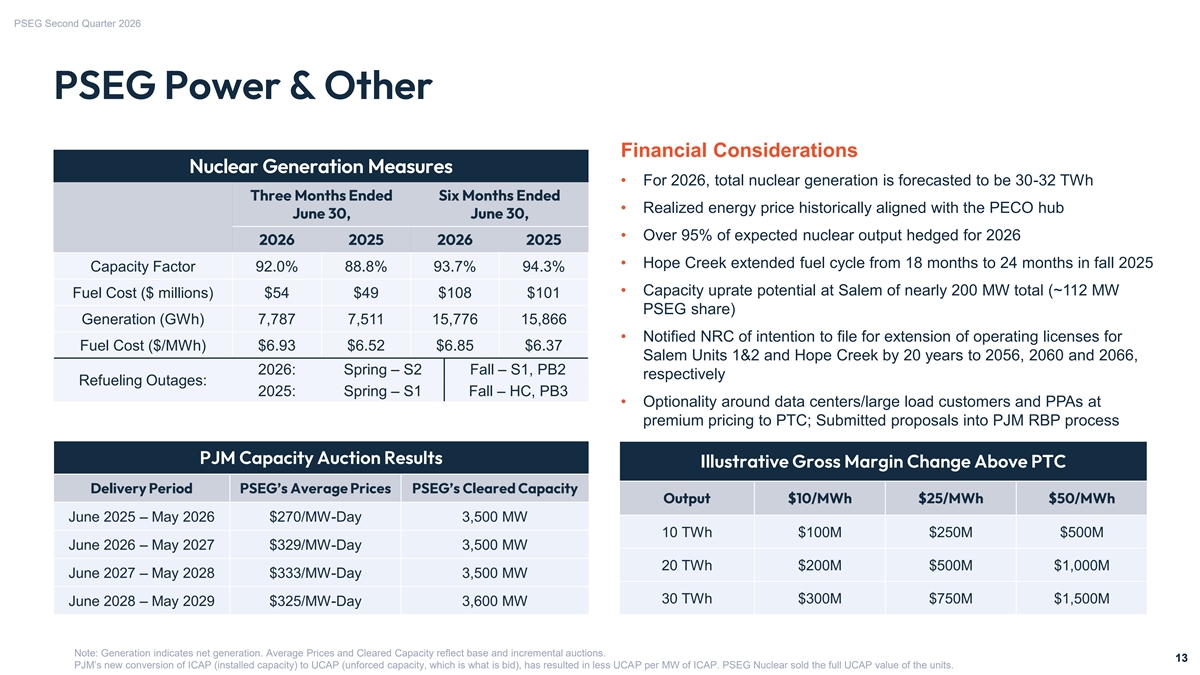
PSEG Second Quarter 2026 PSEG Power & Other Financial Considerations Nuclear Generation Measures • For 2026, total nuclear generation is forecasted to be 30-32 TWh Three Months Ended Six Months Ended • Realized energy price historically aligned with the PECO hub June 30, June 30, • Over 95% of expected nuclear output hedged for 2026 2026 2025 2026 2025 • Hope Creek extended fuel cycle from 18 months to 24 months in fall 2025 Capacity Factor 92.0% 88.8% 93.7% 94.3% • Capacity uprate potential at Salem of nearly 200 MW total (~112 MW Fuel Cost ($ millions) $54 $49 $108 $101 PSEG share) Generation (GWh) 7,787 7,511 15,776 15,866 • Notified NRC of intention to file for extension of operating licenses for Fuel Cost ($/MWh) $6.93 $6.52 $6.85 $6.37 Salem Units 1&2 and Hope Creek by 20 years to 2056, 2060 and 2066, 2026: Spring – S2 Fall – S1, PB2 respectively Refueling Outages: 2025: Spring – S1 Fall – HC, PB3 • Optionality around data centers/large load customers and PPAs at premium pricing to PTC; Submitted proposals into PJM RBP process PJM Capacity Auction Results Illustrative Gross Margin Change Above PTC Delivery Period PSEG’s Average Prices PSEG’s Cleared Capacity Output $10/MWh $25/MWh $50/MWh June 2025 – May 2026 $270/MW-Day 3,500 MW 10 TWh $100M $250M $500M June 2026 – May 2027 $329/MW-Day 3,500 MW 20 TWh $200M $500M $1,000M June 2027 – May 2028 $333/MW-Day 3,500 MW 30 TWh $300M $750M $1,500M June 2028 – May 2029 $325/MW-Day 3,600 MW Note: Generation indicates net generation. Average Prices and Cleared Capacity reflect base and incremental auctions. 13 13 PJM’s new conversion of ICAP (installed capacity) to UCAP (unforced capacity, which is what is bid), has resulted in less UCAP per MW of ICAP. PSEG Nuclear sold the full UCAP value of the units.

PSEG Second Quarter 2026 Appendix 14
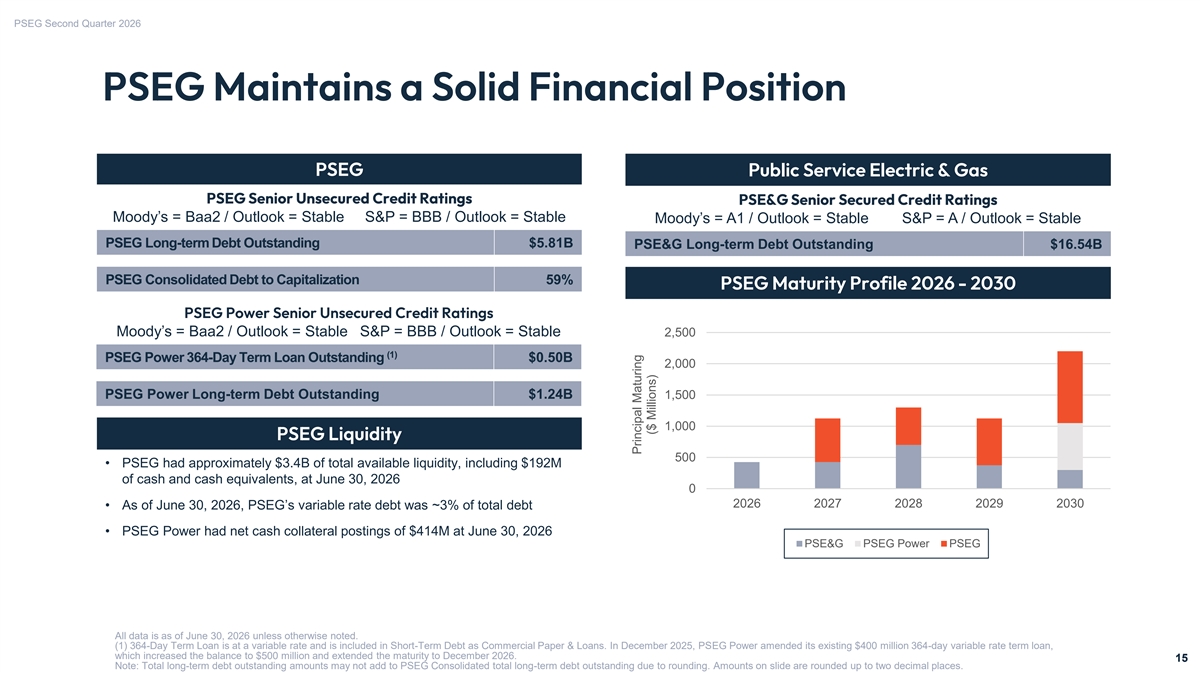
PSEG Second Quarter 2026 PSEG Maintains a Solid Financial Position PSEG Public Service Electric & Gas PSEG Senior Unsecured Credit Ratings PSE&G Senior Secured Credit Ratings Moody’s = Baa2 / Outlook = Stable S&P = BBB / Outlook = Stable Moody’s = A1 / Outlook = Stable S&P = A / Outlook = Stable PSEG Long-term Debt Outstanding $5.81B PSE&G Long-term Debt Outstanding $16.54B PSEG Consolidated Debt to Capitalization 59% PSEG Maturity Profile 2026 - 2030 PSEG Power Senior Unsecured Credit Ratings Moody’s = Baa2 / Outlook = Stable S&P = BBB / Outlook = Stable 2,500 (1) PSEG Power 364-Day Term Loan Outstanding $0.50B 2,000 PSEG Power Long-term Debt Outstanding $1.24B 1,500 1,000 PSEG Liquidity 500 PSEG Liquidity and Net Cash Collateral Postings • PSEG had approximately $3.4B of total available liquidity, including $192M of cash and cash equivalents, at June 30, 2026 0 2026 2027 2028 2029 2030 • As of June 30, 2026, PSEG’s variable rate debt was ~3% of total debt • PSEG Power had net cash collateral postings of $414M at June 30, 2026 PSE&G PSEG Power PSEG All data is as of June 30, 2026 unless otherwise noted. (1) 364-Day Term Loan is at a variable rate and is included in Short-Term Debt as Commercial Paper & Loans. In December 2025, PSEG Power amended its existing $400 million 364-day variable rate term loan, which increased the balance to $500 million and extended the maturity to December 2026. 15 15 Note: Total long-term debt outstanding amounts may not add to PSEG Consolidated total long-term debt outstanding due to rounding. Amounts on slide are rounded up to two decimal places. Principal Maturing ($ Millions)
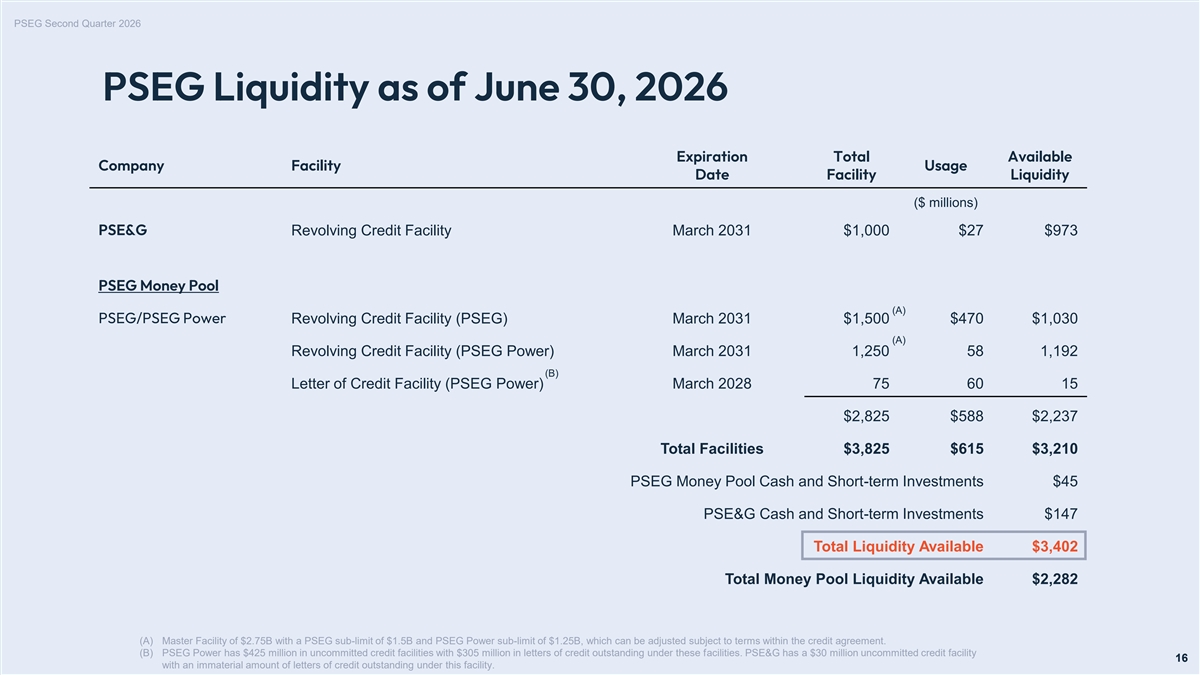
PSEG Second Quarter 2026 PSEG Liquidity as of June 30, 2026 Expiration Total Available Company Facility Usage Date Facility Liquidity ($ millions) PSE&G Revolving Credit Facility March 2031 $1,000 $27 $973 PSEG Money Pool (A) PSEG/PSEG Power Revolving Credit Facility (PSEG) March 2031 $1,500 $470 $1,030 (A) Revolving Credit Facility (PSEG Power) March 2031 1,250 58 1,192 (B) Letter of Credit Facility (PSEG Power) March 2028 75 60 15 $2,825 $588 $2,237 Total Facilities $3,825 $615 $3,210 PSEG Money Pool Cash and Short-term Investments $45 PSE&G Cash and Short-term Investments $147 Total Liquidity Available $3,402 Total Money Pool Liquidity Available $2,282 (A) Master Facility of $2.75B with a PSEG sub-limit of $1.5B and PSEG Power sub-limit of $1.25B, which can be adjusted subject to terms within the credit agreement. (B) PSEG Power has $425 million in uncommitted credit facilities with $305 million in letters of credit outstanding under these facilities. PSE&G has a $30 million uncommitted credit facility 16 16 with an immaterial amount of letters of credit outstanding under this facility.
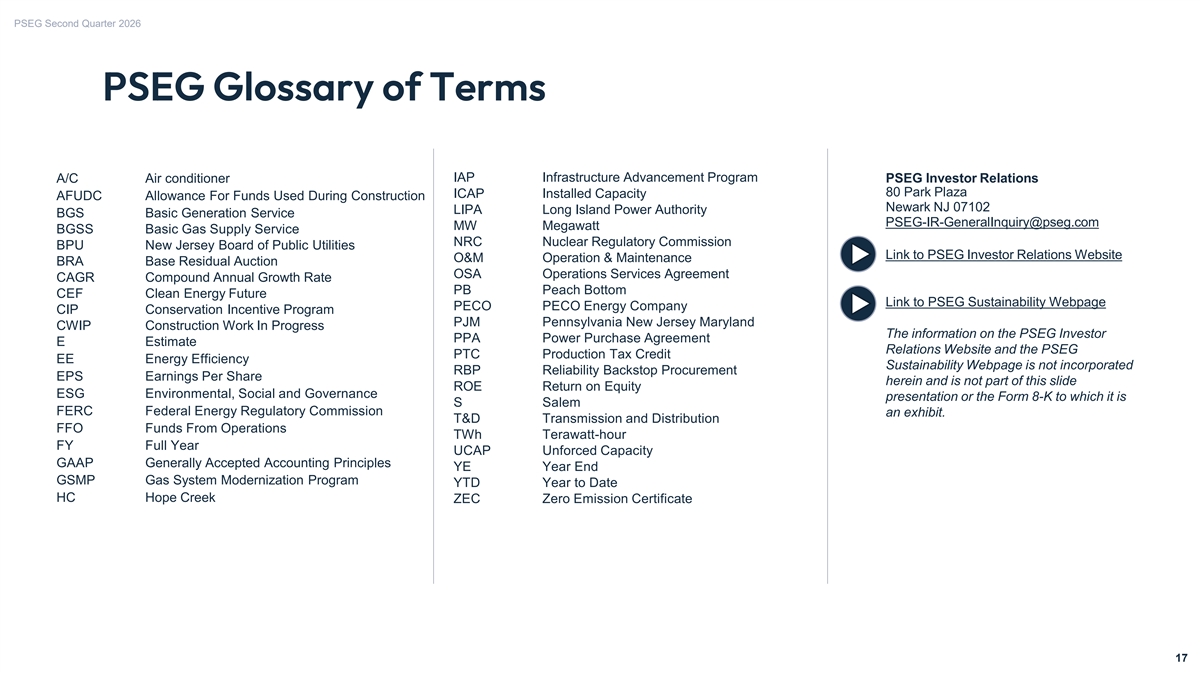
PSEG Second Quarter 2026 PSEG Glossary of Terms A/C Air conditioner IAP Infrastructure Advancement Program PSEG Investor Relations 80 Park Plaza ICAP Installed Capacity AFUDC Allowance For Funds Used During Construction Newark NJ 07102 LIPA Long Island Power Authority BGS Basic Generation Service PSEG-IR-GeneralInquiry@pseg.com MW Megawatt BGSS Basic Gas Supply Service NRC Nuclear Regulatory Commission BPU New Jersey Board of Public Utilities Link to PSEG Investor Relations Website O&M Operation & Maintenance BRA Base Residual Auction OSA Operations Services Agreement CAGR Compound Annual Growth Rate PB Peach Bottom CEF Clean Energy Future Link to PSEG Sustainability Webpage PECO PECO Energy Company CIP Conservation Incentive Program PJM Pennsylvania New Jersey Maryland CWIP Construction Work In Progress The information on the PSEG Investor PPA Power Purchase Agreement E Estimate Relations Website and the PSEG PTC Production Tax Credit EE Energy Efficiency Sustainability Webpage is not incorporated RBP Reliability Backstop Procurement EPS Earnings Per Share herein and is not part of this slide ROE Return on Equity ESG Environmental, Social and Governance presentation or the Form 8-K to which it is S Salem FERC Federal Energy Regulatory Commission an exhibit. T&D Transmission and Distribution FFO Funds From Operations TWh Terawatt-hour FY Full Year UCAP Unforced Capacity GAAP Generally Accepted Accounting Principles YE Year End GSMP Gas System Modernization Program YTD Year to Date HC Hope Creek ZEC Zero Emission Certificate 17 17
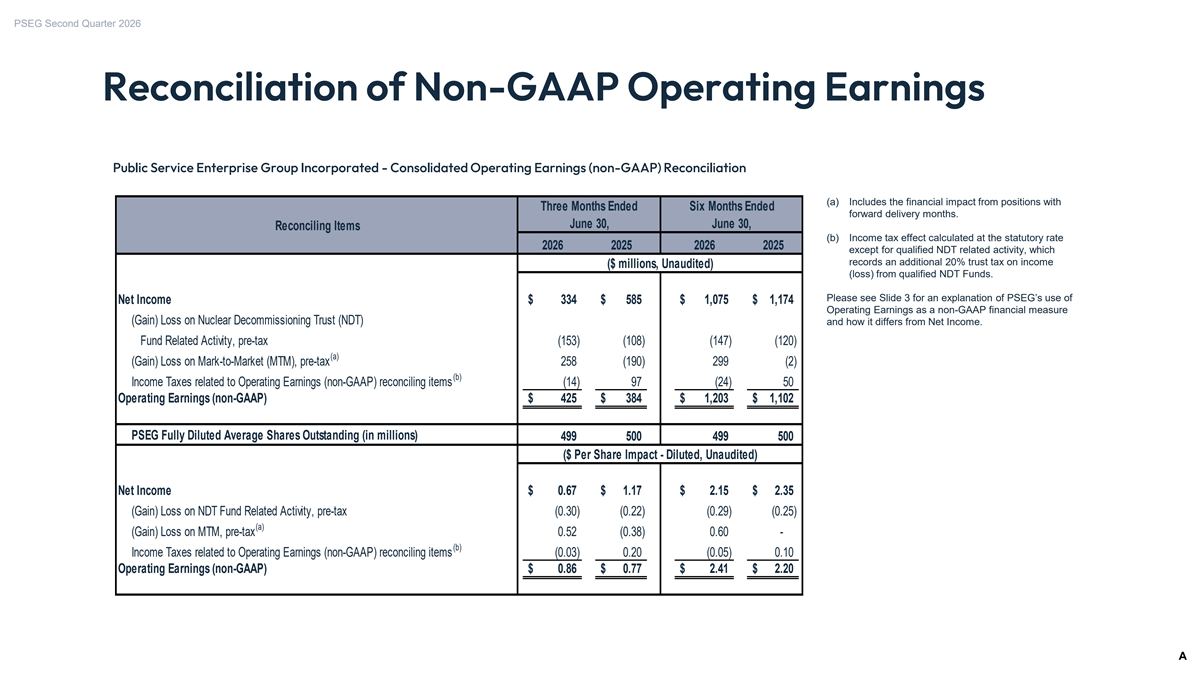
PSEG Second Quarter 2026 Reconciliation of Non-GAAP Operating Earnings Public Service Enterprise Group Incorporated - Consolidated Operating Earnings (non-GAAP) Reconciliation (a) Includes the financial impact from positions with Three Months Ended Six Months Ended forward delivery months. June 30, June 30, Reconciling Items (b) Income tax effect calculated at the statutory rate 2026 2025 2026 2025 except for qualified NDT related activity, which records an additional 20% trust tax on income ($ millions, Unaudited) (loss) from qualified NDT Funds. Please see Slide 3 for an explanation of PSEG’s use of Net Income $ 334 $ 585 $ 1,075 $ 1,174 Operating Earnings as a non-GAAP financial measure (Gain) Loss on Nuclear Decommissioning Trust (NDT) and how it differs from Net Income. Fund Related Activity, pre-tax (153) (108) (147) (120) (a) (Gain) Loss on Mark-to-Market (MTM), pre-tax 258 (190) 299 ( 2) (b) Income Taxes related to Operating Earnings (non-GAAP) reconciling items (14) 97 (24) 50 Operating Earnings (non-GAAP) $ 425 $ 384 $ 1,203 $ 1,102 PSEG Fully Diluted Average Shares Outstanding (in millions) 499 500 499 500 ($ Per Share Impact - Diluted, Unaudited) Net Income $ 0.67 $ 1.17 $ 2.15 $ 2.35 (Gain) Loss on NDT Fund Related Activity, pre-tax ( 0.30) (0.22) (0.29) (0.25) (a) (Gain) Loss on MTM, pre-tax 0 .52 (0.38) 0.60 - (b) Income Taxes related to Operating Earnings (non-GAAP) reconciling items (0.03) 0.20 ( 0.05) 0.10 Operating Earnings (non-GAAP) $ 0.86 $ 0.77 $ 2.41 $ 2.20 A 18 18
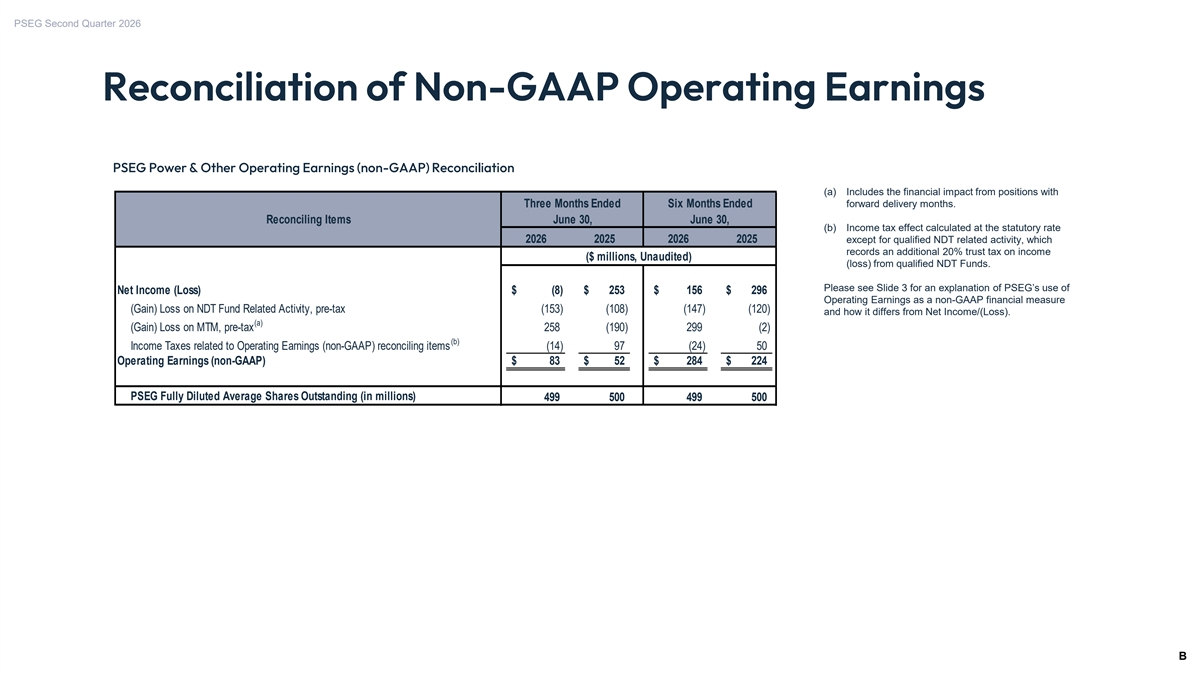
PSEG Second Quarter 2026 Reconciliation of Non-GAAP Operating Earnings PSEG Power & Other Operating Earnings (non-GAAP) Reconciliation (a) Includes the financial impact from positions with Three Months Ended Six Months Ended forward delivery months. Reconciling Items June 30, June 30, (b) Income tax effect calculated at the statutory rate 2026 2025 2026 2025 except for qualified NDT related activity, which records an additional 20% trust tax on income ($ millions, Unaudited) (loss) from qualified NDT Funds. Please see Slide 3 for an explanation of PSEG’s use of Net Income (Loss) $ (8) $ 253 $ 156 $ 296 Operating Earnings as a non-GAAP financial measure (Gain) Loss on NDT Fund Related Activity, pre-tax (153) (108) (147) (120) and how it differs from Net Income/(Loss). (a) (Gain) Loss on MTM, pre-tax 258 (190) 299 ( 2) (b) Income Taxes related to Operating Earnings (non-GAAP) reconciling items (14) 97 (24) 50 Operating Earnings (non-GAAP) $ 83 $ 52 $ 284 $ 224 PSEG Fully Diluted Average Shares Outstanding (in millions) 499 500 499 500 B 19 19