Earnings Presentation Second Quarter 2026 Nasdaq: NAGE | August 4, 2026
2 This presentation and other written or oral statements made from time to time by representatives of Niagen Bioscience contain “forward-looking statements” within the meaning of Section 27A of the Securities Act of 1933, as amended, and Section 21E of the Securities Exchange Act of 1934, as amended. Forward-looking statements reflect the current view about future events. Statements that are not historical in nature, such as 2026 financial outlook, and which may be identified by the use of words like “expects,” “anticipates,” “intends,” “estimates,” “plans,” “potential,” “possible,” “probable,” “believes,” “seeks,” “may,” “will,” “should,” “could,” “predicts,” “projects,” “continue,” “would” or the negative of these terms and other words of similar meaning, are forward-looking statements. Such statements include, but are not limited to, statements contained in this presentation relating to our expected sales, cash flows, planned investments, and financial performance, business, business strategy, expansion, growth, key drivers (including cost savings and increased investments), products and services we offer and their impact on our performance or products and services we may offer in the future and the timing of their development, sales and marketing strategy and capital outlook. Forward-looking statements are based on management’s current expectations and assumptions regarding our business, the economy and other future conditions and are subject to inherent risks, uncertainties and changes of circumstances that are difficult to predict and may cause actual results to differ materially from those contemplated or expressed. We caution you therefore against relying on any of these forward-looking statements. These risks and uncertainties include those risk factors discussed in Part I, “Item 1A. Risk Factors” of our most recent Annual Report on Form 10-K and Quarterly Report on Form 10-Q filed with the Securities and Exchange Commission (the “Commission”), and in subsequent filings with the Commission. Any forward-looking statements are qualified in their entirety by reference to the factors discussed in these filings with the Commission. Should one or more of these risks or uncertainties materialize, or should the underlying assumptions prove incorrect, actual results may differ significantly from those anticipated, believed, estimated, expected, intended or planned. Important factors that could cause actual results to differ materially from those in the forward looking statements include but are not limited to: our relationships with major customers; a decline in general economic conditions nationally and internationally; the market and size of the vitamin, mineral and dietary supplement market and the intravenous market; decreased demand for our products and services; market acceptance of our products; interruptions in our ability to sell products through third-party online marketplaces; the ability to protect our intellectual property rights; impact of any litigation or infringement actions brought against us; competition from other providers and products, including other supplements such as NMN; risks in product development; our ability to develop pharmaceutical business; the Company's therapeutic pipeline, including NB4168, preclinical and IND-enabling studies, and regulatory designations and development plans; inability to raise capital to fund continuing operations or new product development; changes in government regulation or regulatory priorities of government officials; the ability to complete customer transactions and capital raising transactions; inflationary conditions and adverse economic conditions; our history of operating losses; the growth and profitability of our product sales; our ability to maintain and grow sales, marketing and distribution capabilities; changing consumer perceptions of our products; our reliance on a single or limited number of third-party suppliers; risks of conducting business in China; unanticipated developments in and risks related to the Company’s ability to secure adequate quantities of pharmaceutical-grade Niagen in a timely manner; the Company’s ability to obtain appropriate contracts and arrangements with U.S. FDA-registered 503B outsourcing facilities required to compound and distribute pharmaceutical-grade Niagen to clinics; the Company’s ability to remain on the U.S. FDA Bulk Drug Substances Nominated for Use in Compounding Under Section 503B of the Federal Food, Drug, and Cosmetic Act Category 1 list; the Company’s ability to maintain and enforce the Company’s existing intellectual property and obtain new patents; whether the potential benefits of NRC can be further supported; further research and development and the results of clinical trials possibly being unsuccessful or insufficient to meet applicable regulatory standards or warrant continued development; the ability to enroll sufficient numbers of subjects in clinical trials; determinations made by the FDA and other governmental authorities, including with respect to products seeking to compete in our market; mislabeling or other misleading marketing practices by competitors; economic and market instability, including as a result of tariffs or trade conflicts; and the risks and uncertainties associated with our business and financial condition in general. Factors or events that could cause our actual results to differ may emerge from time to time, and it is not possible for us to predict all of them. We cannot guarantee future results, levels of activity, performance or achievements. Except as required by applicable law, including the securities laws of the United States, we do not intend to update any of the forward-looking statements to conform these statements to actual results. About Non-GAAP Financial Measures Niagen Bioscience’s non-GAAP financial measure, Adjusted EBITDA, is defined as net income before interest, provision for income taxes, depreciation, amortization, non-cash share-based compensation costs, severance and restructuring expense and other infrequent items, including gains recognized related to the sale of an operating segment and a royalty settlement. Niagen Bioscience used this non-GAAP measures when evaluating its financial results as well as for internal resource management, planning and forecasting purposes. This non-GAAP measure should not be viewed in isolation from or as a substitute for Niagen Bioscience’s financial results in accordance with GAAP. Reconciliation of this non-GAAP measure to the most directly comparable GAAP measure is attached to this presentation. FDA Disclaimer Statements made in this presentation have not been evaluated by the Food and Drug Administration. Niagen Bioscience products are not intended to diagnose, treat, cure, or prevent any disease. The statements in this presentation are for investor relations and educational purposes only and not intended for consumers or vendors. Safe Harbor Statement
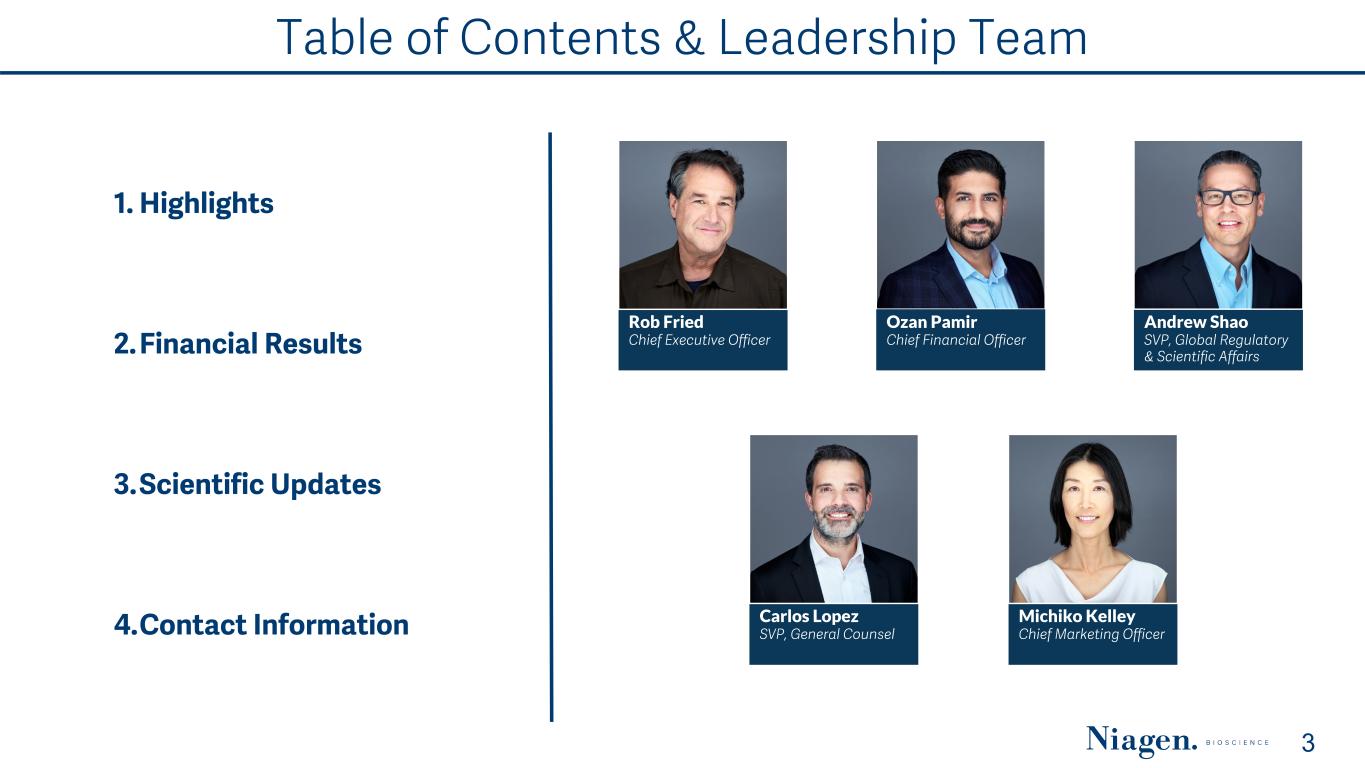
Table of Contents & Leadership Team 3 Rob Fried Chief Executive Officer Carlos Lopez SVP, General Counsel Andrew Shao SVP, Global Regulatory & Scientific Affairs Michiko Kelley Chief Marketing Officer 1. Highlights 2. Financial Results 3.Scientific Updates 4.Contact Information Ozan Pamir Chief Financial Officer
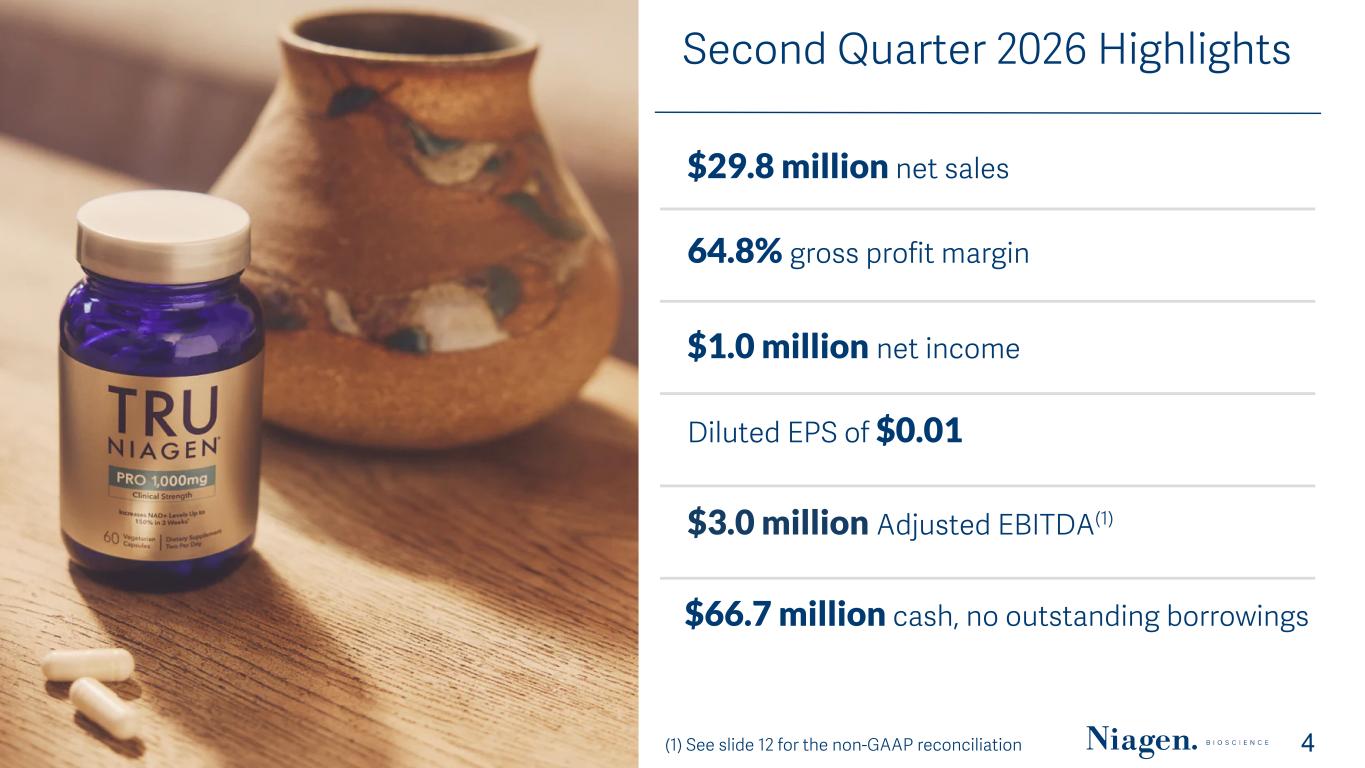
(1) See slide 12 for the non-GAAP reconciliation 4 64.8% gross profit margin Diluted EPS of $0.01 $1.0 million net income $3.0 million Adjusted EBITDA(1) $66.7 million cash, no outstanding borrowings Second Quarter 2026 Highlights $29.8 million net sales
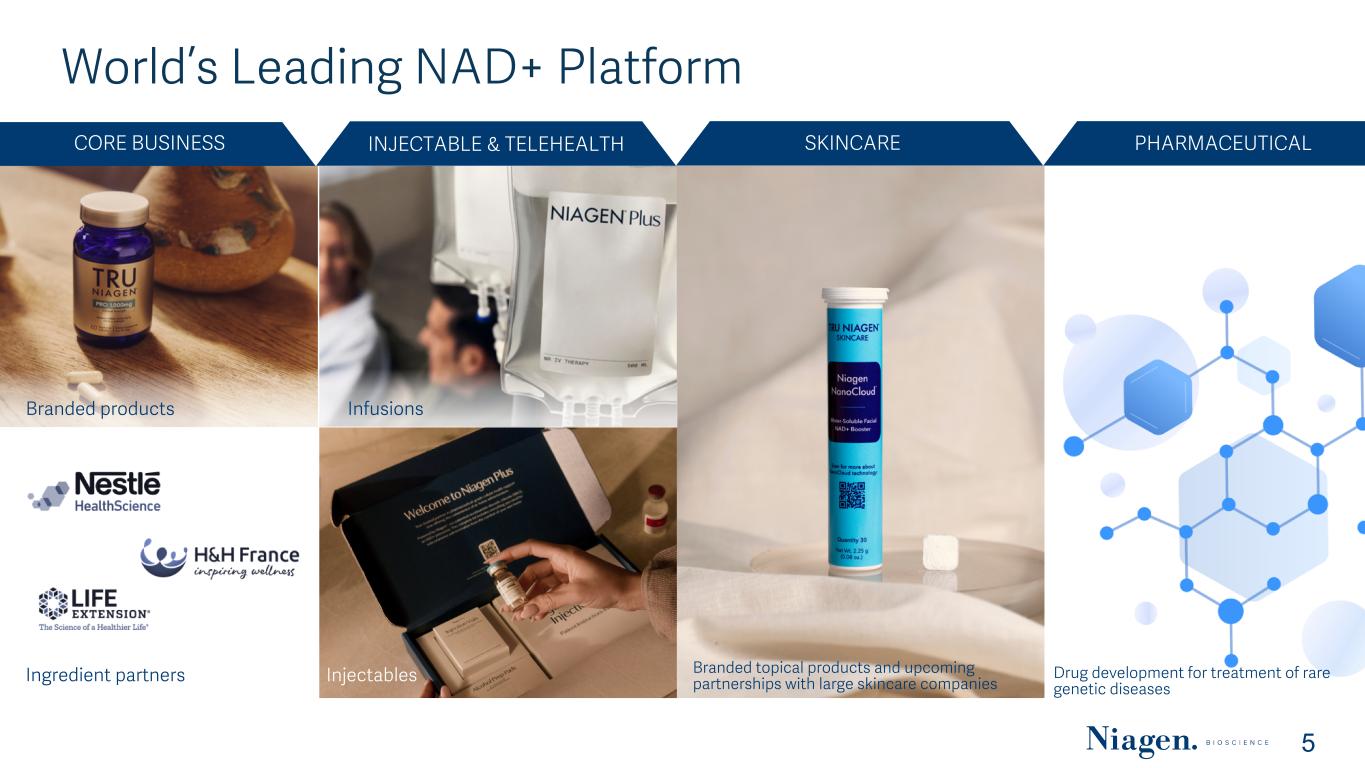
World’s Leading NAD+ Platform 5 CORE BUSINESS INJECTABLE & TELEHEALTH SKINCARE PHARMACEUTICAL Branded products Infusions Branded topical products and upcoming partnerships with large skincare companiesIngredient partners Injectables Drug development for treatment of rare genetic diseases
Executing Long-Term Strategic Growth Initiatives Key strategic initiatives during Q2 2026. 6 Consumer Products • Direct-to-consumer sales on the Company’s website grew by 23% year-over-year. • Completed and sold out of the pilot launch of the first skincare product, Nanocloud™. Niagen Plus • Launched clinician-directed telehealth platform under Niagen Plus, expanding the Niagen Plus clinic channel beyond in-person settings and introducing a direct-to-patient access model. • Received LegitScript certification for Niagen Plus, allowing the company to advertise Niagen Plus at- home injection kits • Added Olympia Pharmaceuticals as a 503B compound pharmacy partner. Therapeutic Development • Introduced a proprietary lead candidate, NB4168, to address rare genetic diseases and aging related disorders, initially targeting Ataxia-Telangiectasia. Scientific Leadership • Rebranded the Niagen Research Program and appointed new scientific leadership to support the Company's expanding external research strategy.
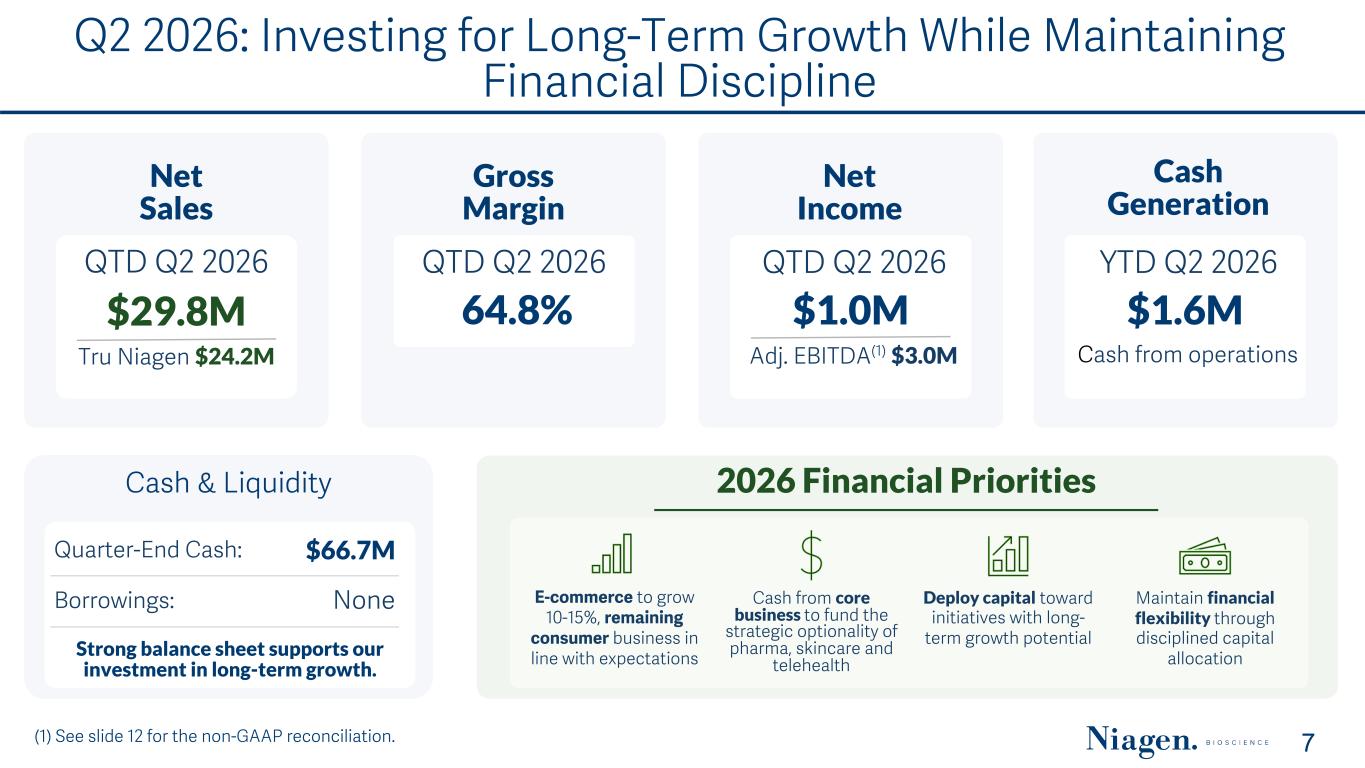
(1) See slide 12 for the non-GAAP reconciliation. 7 Net Sales QTD Q2 2026 $29.8M Tru Niagen $24.2M Gross Margin QTD Q2 2026 64.8% Net Income QTD Q2 2026 $1.0M Adj. EBITDA(1) $3.0M Cash & Liquidity Quarter-End Cash: $66.7M Borrowings: None Strong balance sheet supports our investment in long-term growth. Q2 2026: Investing for Long-Term Growth While Maintaining Financial Discipline 2026 Financial Priorities E-commerce to grow 10-15%, remaining consumer business in line with expectations Cash from core business to fund the strategic optionality of pharma, skincare and telehealth Deploy capital toward initiatives with long- term growth potential Maintain financial flexibility through disciplined capital allocation Cash Generation YTD Q2 2026 $1.6M Cash from operations
The information contained in this documents is confidential, privileged and only for the information of the intended recipient and may not be used, published or redistributed without the prior written consent (2019) Financial Highlights
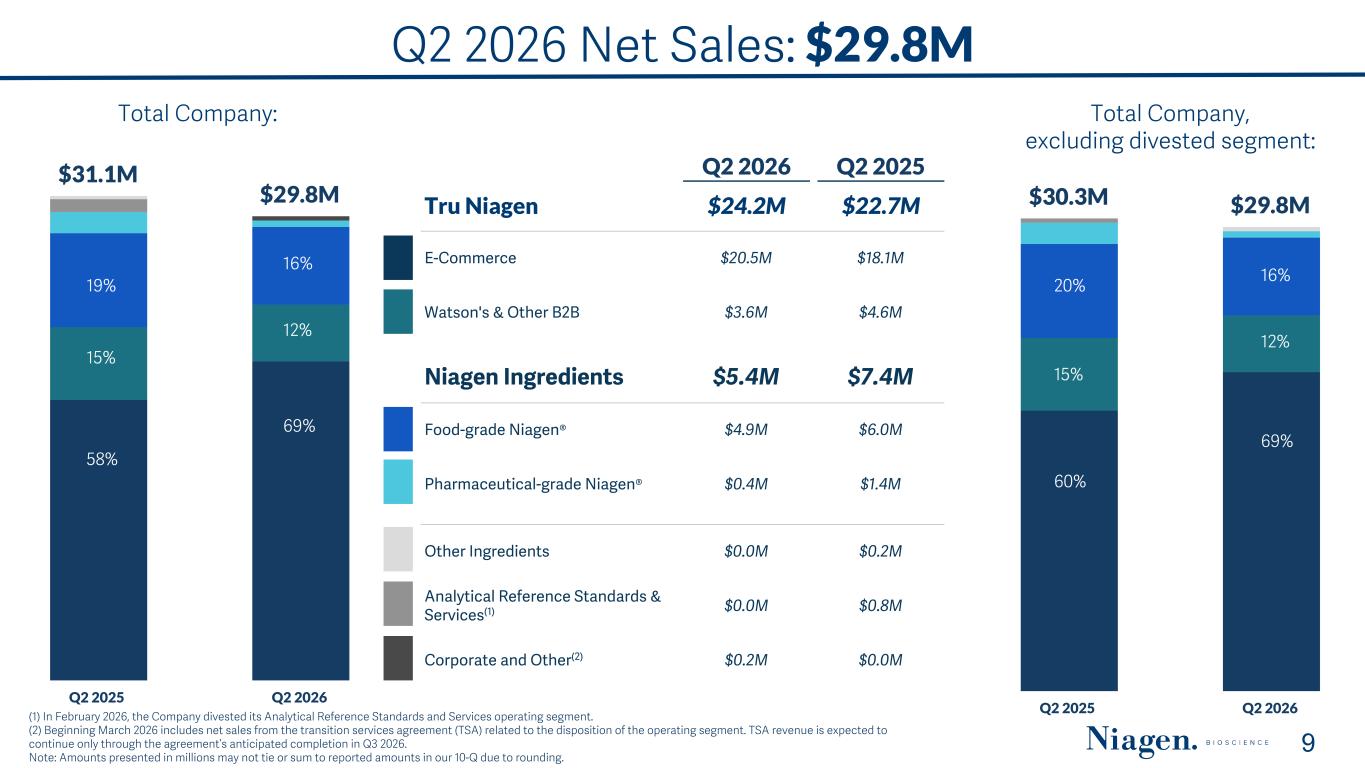
Q2 2026 Net Sales: $29.8M 9 Q2 2026 Q2 2025 Tru Niagen $24.2M $22.7M E-Commerce $20.5M $18.1M Watson's & Other B2B $3.6M $4.6M Niagen Ingredients $5.4M $7.4M Food-grade Niagen® $4.9M $6.0M Pharmaceutical-grade Niagen® $0.4M $1.4M Other Ingredients $0.0M $0.2M Analytical Reference Standards & Services(1) $0.0M $0.8M Corporate and Other(2) $0.2M $0.0M $31.1M $29.8M Q2 2025 Q2 2026 58% 15% 19% 69% 12% 16% (1) In February 2026, the Company divested its Analytical Reference Standards and Services operating segment. (2) Beginning March 2026 includes net sales from the transition services agreement (TSA) related to the disposition of the operating segment. TSA revenue is expected to continue only through the agreement’s anticipated completion in Q3 2026. Note: Amounts presented in millions may not tie or sum to reported amounts in our 10-Q due to rounding. Total Company: $30.3M $29.8M Q2 2025 Q2 2026 60% 15% 20% 69% 12% 16% Total Company, excluding divested segment:
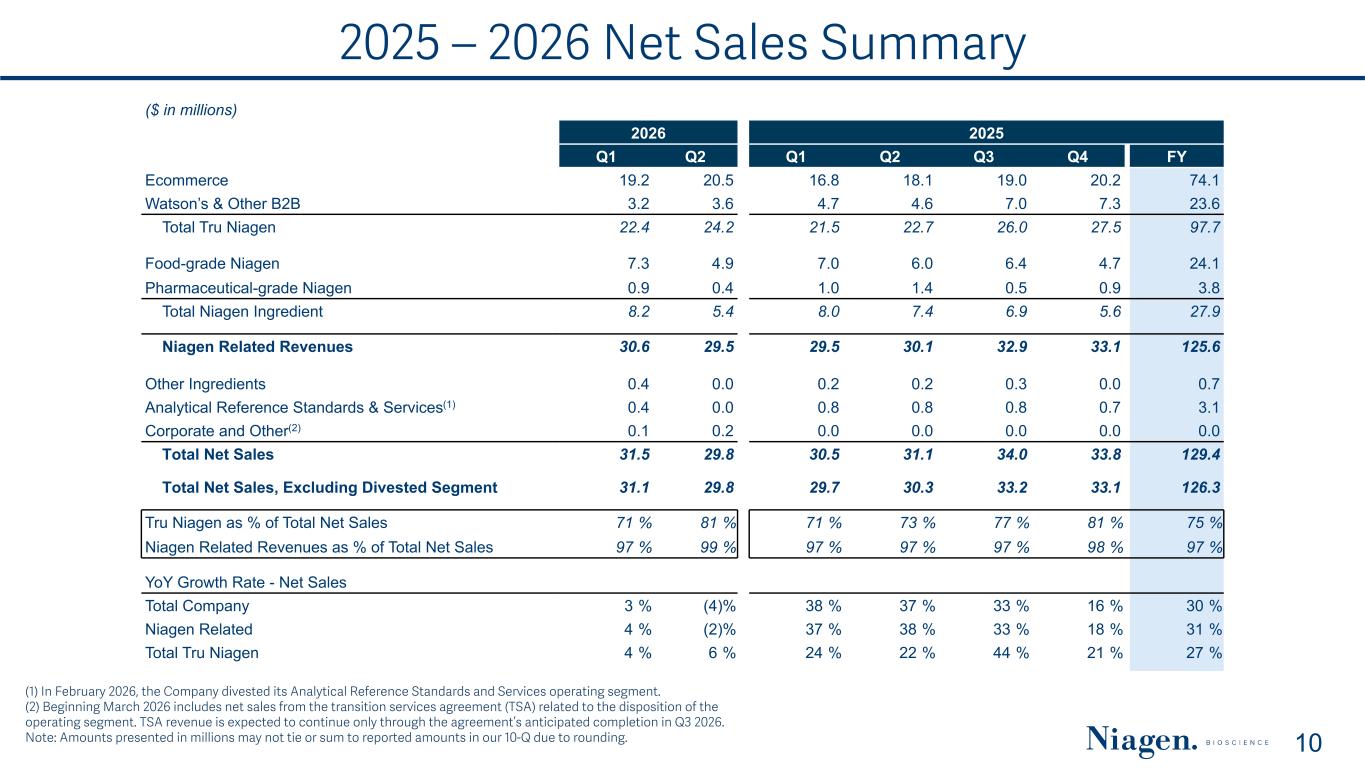
2025 – 2026 Net Sales Summary 10 ($ in millions) 2026 2025 Q1 Q2 Q1 Q2 Q3 Q4 FY Ecommerce 19.2 20.5 16.8 18.1 19.0 20.2 74.1 Watson’s & Other B2B 3.2 3.6 4.7 4.6 7.0 7.3 23.6 Total Tru Niagen 22.4 24.2 21.5 22.7 26.0 27.5 97.7 Food-grade Niagen 7.3 4.9 7.0 6.0 6.4 4.7 24.1 Pharmaceutical-grade Niagen 0.9 0.4 1.0 1.4 0.5 0.9 3.8 Total Niagen Ingredient 8.2 5.4 8.0 7.4 6.9 5.6 27.9 Niagen Related Revenues 30.6 29.5 29.5 30.1 32.9 33.1 125.6 Other Ingredients 0.4 0.0 0.2 0.2 0.3 0.0 0.7 Analytical Reference Standards & Services(1) 0.4 0.0 0.8 0.8 0.8 0.7 3.1 Corporate and Other(2) 0.1 0.2 0.0 0.0 0.0 0.0 0.0 Total Net Sales 31.5 29.8 30.5 31.1 34.0 33.8 129.4 Total Net Sales, Excluding Divested Segment 31.1 29.8 29.7 30.3 33.2 33.1 126.3 Tru Niagen as % of Total Net Sales 71 % 81 % 71 % 73 % 77 % 81 % 75 % Niagen Related Revenues as % of Total Net Sales 97 % 99 % 97 % 97 % 97 % 98 % 97 % YoY Growth Rate - Net Sales Total Company 3 % (4) % 38 % 37 % 33 % 16 % 30 % Niagen Related 4 % (2) % 37 % 38 % 33 % 18 % 31 % Total Tru Niagen 4 % 6 % 24 % 22 % 44 % 21 % 27 % (1) In February 2026, the Company divested its Analytical Reference Standards and Services operating segment. (2) Beginning March 2026 includes net sales from the transition services agreement (TSA) related to the disposition of the operating segment. TSA revenue is expected to continue only through the agreement’s anticipated completion in Q3 2026. Note: Amounts presented in millions may not tie or sum to reported amounts in our 10-Q due to rounding.
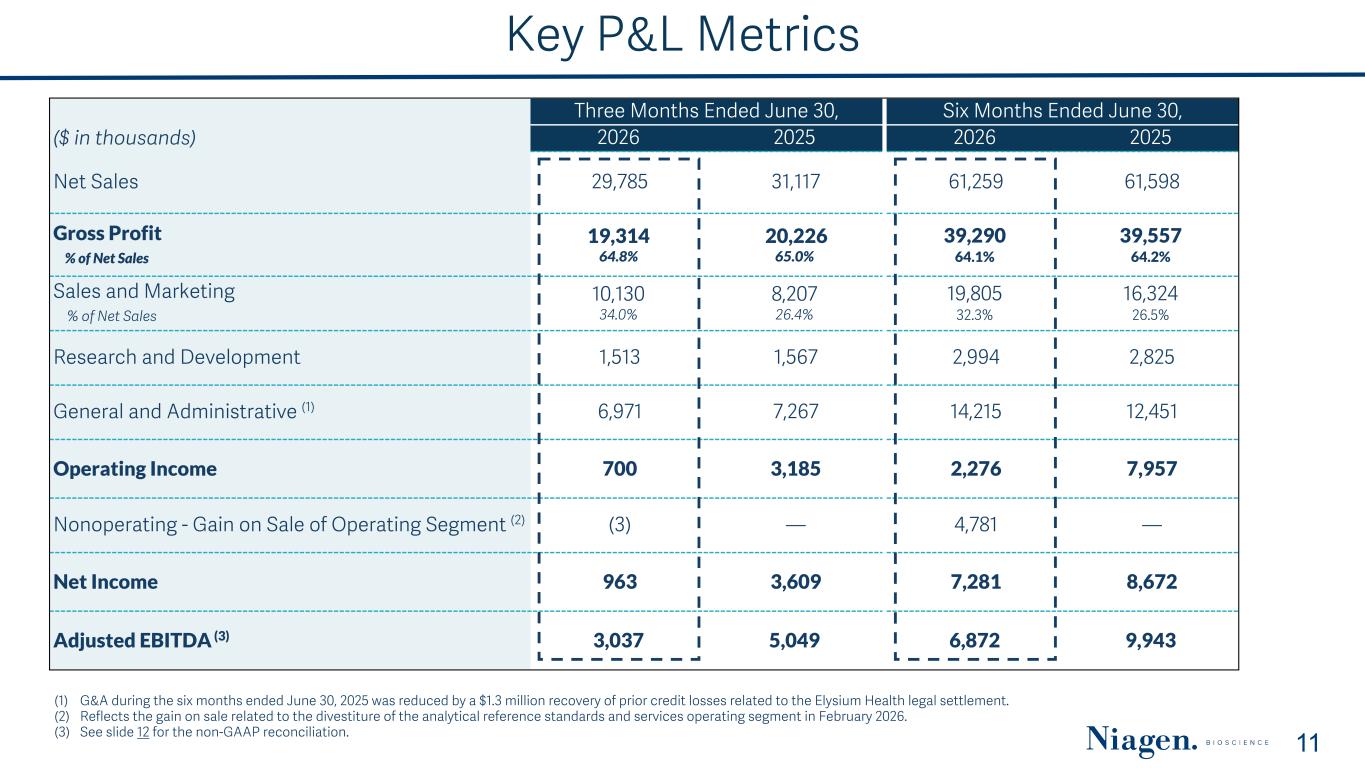
Three Months Ended June 30, Six Months Ended June 30, ($ in thousands) 2026 2025 2026 2025 Net Sales 29,785 31,117 61,259 61,598 Gross Profit % of Net Sales 19,314 64.8% 20,226 65.0% 39,290 64.1% 39,557 64.2% Sales and Marketing % of Net Sales 10,130 34.0% 8,207 26.4% 19,805 32.3% 16,324 26.5% Research and Development 1,513 1,567 2,994 2,825 General and Administrative (1) 6,971 7,267 14,215 12,451 Operating Income 700 3,185 2,276 7,957 Nonoperating - Gain on Sale of Operating Segment (2) (3) — 4,781 — Net Income 963 3,609 7,281 8,672 Adjusted EBITDA (3) 3,037 5,049 6,872 9,943 Key P&L Metrics 11 (1) G&A during the six months ended June 30, 2025 was reduced by a $1.3 million recovery of prior credit losses related to the Elysium Health legal settlement. (2) Reflects the gain on sale related to the divestiture of the analytical reference standards and services operating segment in February 2026. (3) See slide 12 for the non-GAAP reconciliation.
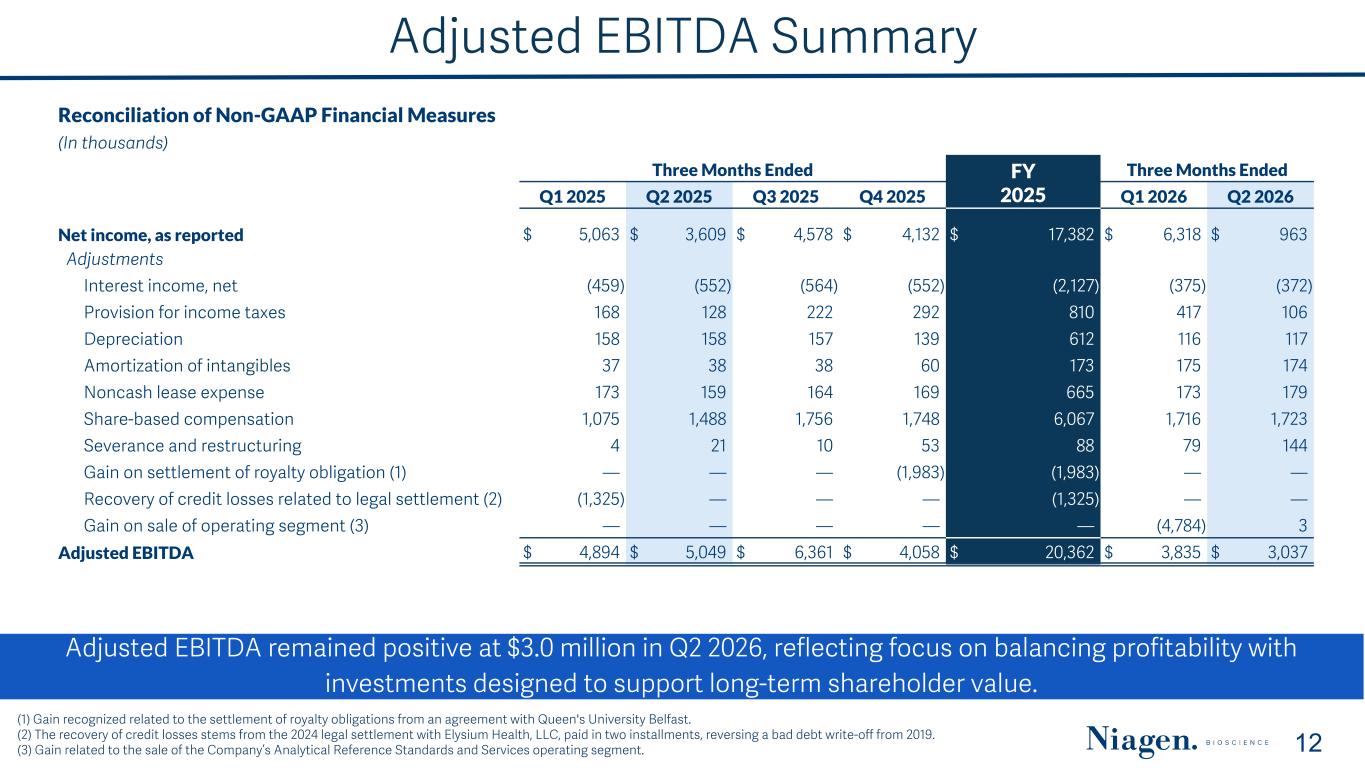
Adjusted EBITDA Summary Adjusted EBITDA remained positive at $3.0 million in Q2 2026, reflecting focus on balancing profitability with investments designed to support long-term shareholder value. 12 Reconciliation of Non-GAAP Financial Measures (In thousands) Three Months Ended FY 2025 Three Months Ended Q1 2025 Q2 2025 Q3 2025 Q4 2025 Q1 2026 Q2 2026 Net income, as reported $ 5,063 $ 3,609 $ 4,578 $ 4,132 $ 17,382 $ 6,318 $ 963 Adjustments Interest income, net (459) (552) (564) (552) (2,127) (375) (372) Provision for income taxes 168 128 222 292 810 417 106 Depreciation 158 158 157 139 612 116 117 Amortization of intangibles 37 38 38 60 173 175 174 Noncash lease expense 173 159 164 169 665 173 179 Share-based compensation 1,075 1,488 1,756 1,748 6,067 1,716 1,723 Severance and restructuring 4 21 10 53 88 79 144 Gain on settlement of royalty obligation (1) — — — (1,983) (1,983) — — Recovery of credit losses related to legal settlement (2) (1,325) — — — (1,325) — — Gain on sale of operating segment (3) — — — — — (4,784) 3 Adjusted EBITDA $ 4,894 $ 5,049 $ 6,361 $ 4,058 $ 20,362 $ 3,835 $ 3,037 (1) Gain recognized related to the settlement of royalty obligations from an agreement with Queen's University Belfast. (2) The recovery of credit losses stems from the 2024 legal settlement with Elysium Health, LLC, paid in two installments, reversing a bad debt write-off from 2019. (3) Gain related to the sale of the Company’s Analytical Reference Standards and Services operating segment.
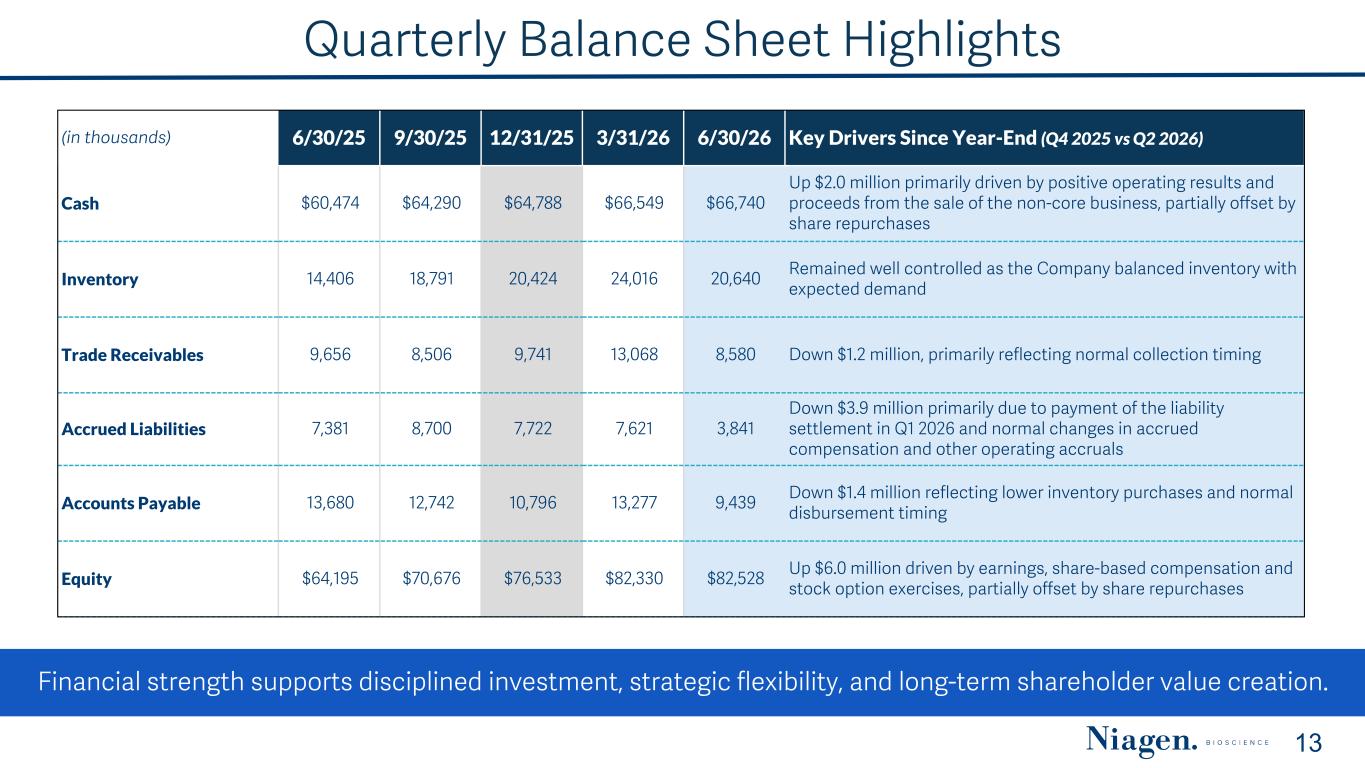
Financial strength supports disciplined investment, strategic flexibility, and long-term shareholder value creation. Quarterly Balance Sheet Highlights (in thousands) 6/30/25 9/30/25 12/31/25 3/31/26 6/30/26 Key Drivers Since Year-End (Q4 2025 vs Q2 2026) Cash $60,474 $64,290 $64,788 $66,549 $66,740 Up $2.0 million primarily driven by positive operating results and proceeds from the sale of the non-core business, partially offset by share repurchases Inventory 14,406 18,791 20,424 24,016 20,640 Remained well controlled as the Company balanced inventory with expected demand Trade Receivables 9,656 8,506 9,741 13,068 8,580 Down $1.2 million, primarily reflecting normal collection timing Accrued Liabilities 7,381 8,700 7,722 7,621 3,841 Down $3.9 million primarily due to payment of the liability settlement in Q1 2026 and normal changes in accrued compensation and other operating accruals Accounts Payable 13,680 12,742 10,796 13,277 9,439 Down $1.4 million reflecting lower inventory purchases and normal disbursement timing Equity $64,195 $70,676 $76,533 $82,330 $82,528 Up $6.0 million driven by earnings, share-based compensation and stock option exercises, partially offset by share repurchases 13
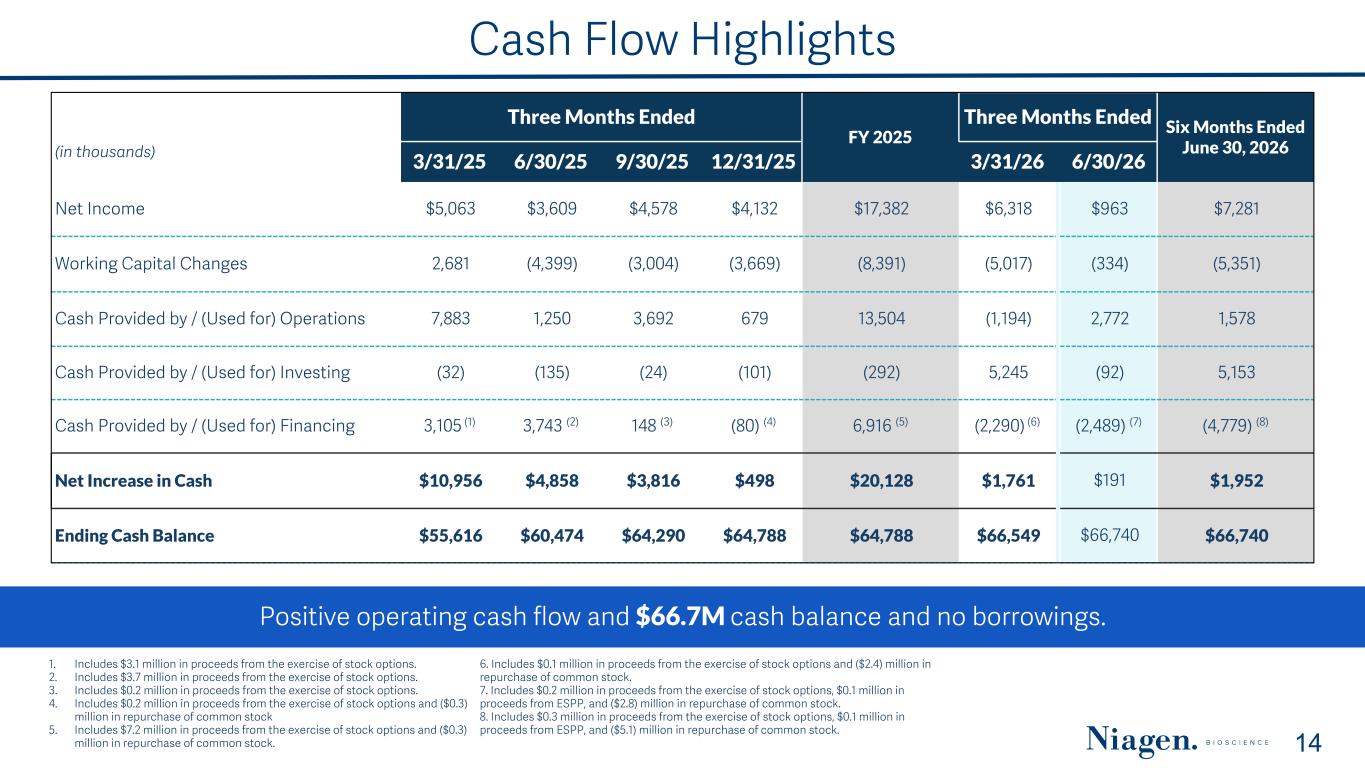
Positive operating cash flow and $66.7M cash balance and no borrowings. 14 Cash Flow Highlights Three Months Ended FY 2025 Three Months Ended Six Months Ended June 30, 2026(in thousands) 3/31/25 6/30/25 9/30/25 12/31/25 3/31/26 6/30/26 Net Income $5,063 $3,609 $4,578 $4,132 $17,382 $6,318 $963 $7,281 Working Capital Changes 2,681 (4,399) (3,004) (3,669) (8,391) (5,017) (334) (5,351) Cash Provided by / (Used for) Operations 7,883 1,250 3,692 679 13,504 (1,194) 2,772 1,578 Cash Provided by / (Used for) Investing (32) (135) (24) (101) (292) 5,245 (92) 5,153 Cash Provided by / (Used for) Financing 3,105 (1) 3,743 (2) 148 (3) (80) (4) 6,916 (5) (2,290) (6) (2,489) (7) (4,779) (8) Net Increase in Cash $10,956 $4,858 $3,816 $498 $20,128 $1,761 $191 $1,952 Ending Cash Balance $55,616 $60,474 $64,290 $64,788 $64,788 $66,549 $66,740 $66,740 1. Includes $3.1 million in proceeds from the exercise of stock options. 2. Includes $3.7 million in proceeds from the exercise of stock options. 3. Includes $0.2 million in proceeds from the exercise of stock options. 4. Includes $0.2 million in proceeds from the exercise of stock options and ($0.3) million in repurchase of common stock 5. Includes $7.2 million in proceeds from the exercise of stock options and ($0.3) million in repurchase of common stock. 6. Includes $0.1 million in proceeds from the exercise of stock options and ($2.4) million in repurchase of common stock. 7. Includes $0.2 million in proceeds from the exercise of stock options, $0.1 million in proceeds from ESPP, and ($2.8) million in repurchase of common stock. 8. Includes $0.3 million in proceeds from the exercise of stock options, $0.1 million in proceeds from ESPP, and ($5.1) million in repurchase of common stock.

The information contained in this documents is confidential, privileged and only for the information of the intended recipient and may not be used, published or redistributed without the prior written consent (2019) 15 The Science
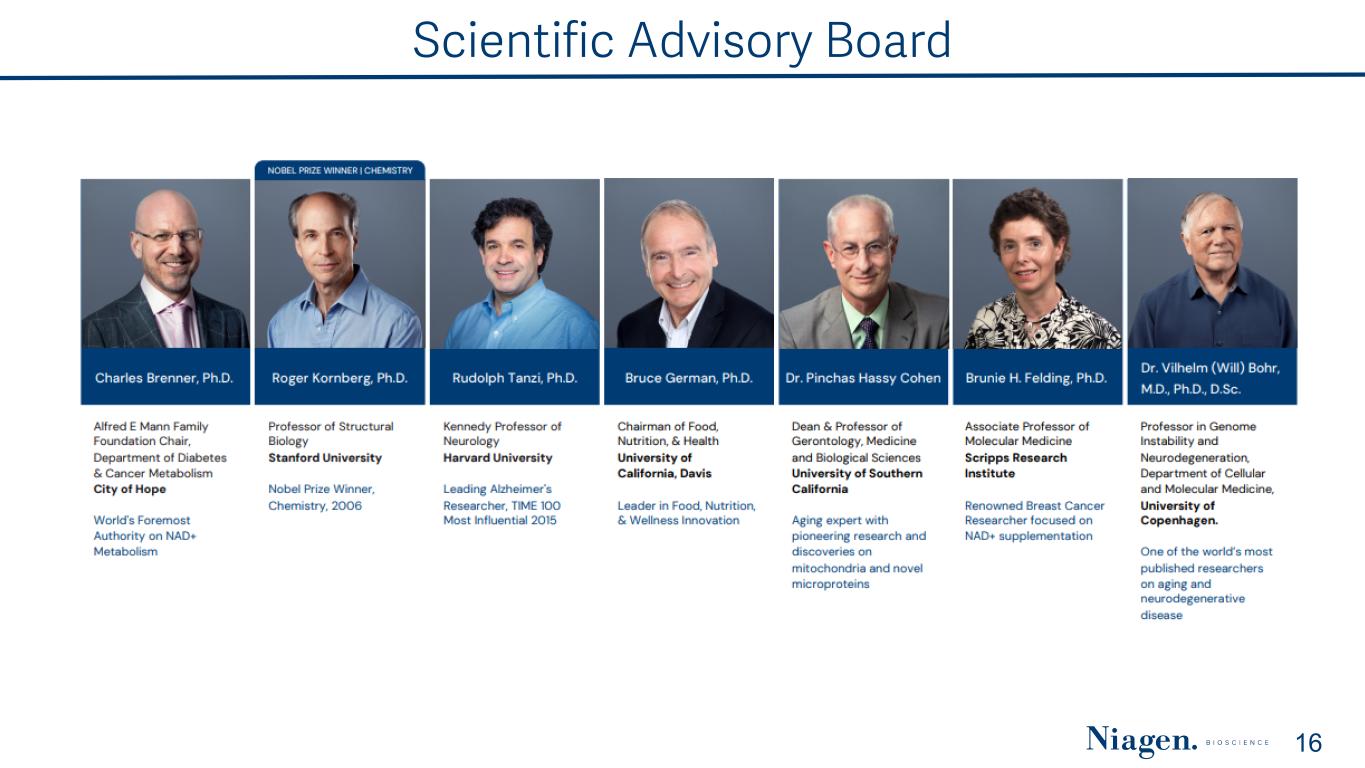
Scientific Advisory Board 16
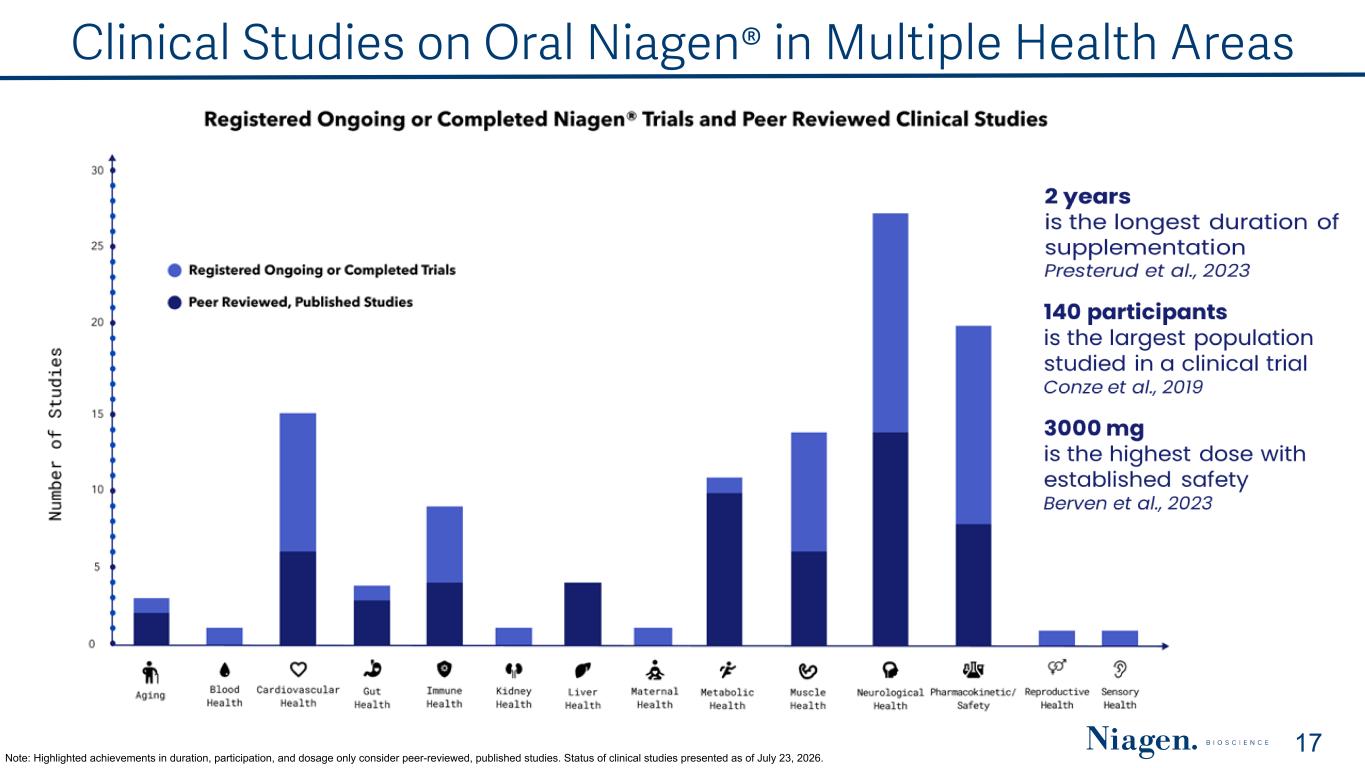
17 Clinical Studies on Oral Niagen® in Multiple Health Areas Note: Highlighted achievements in duration, participation, and dosage only consider peer-reviewed, published studies. Status of clinical studies presented as of July 23, 2026.
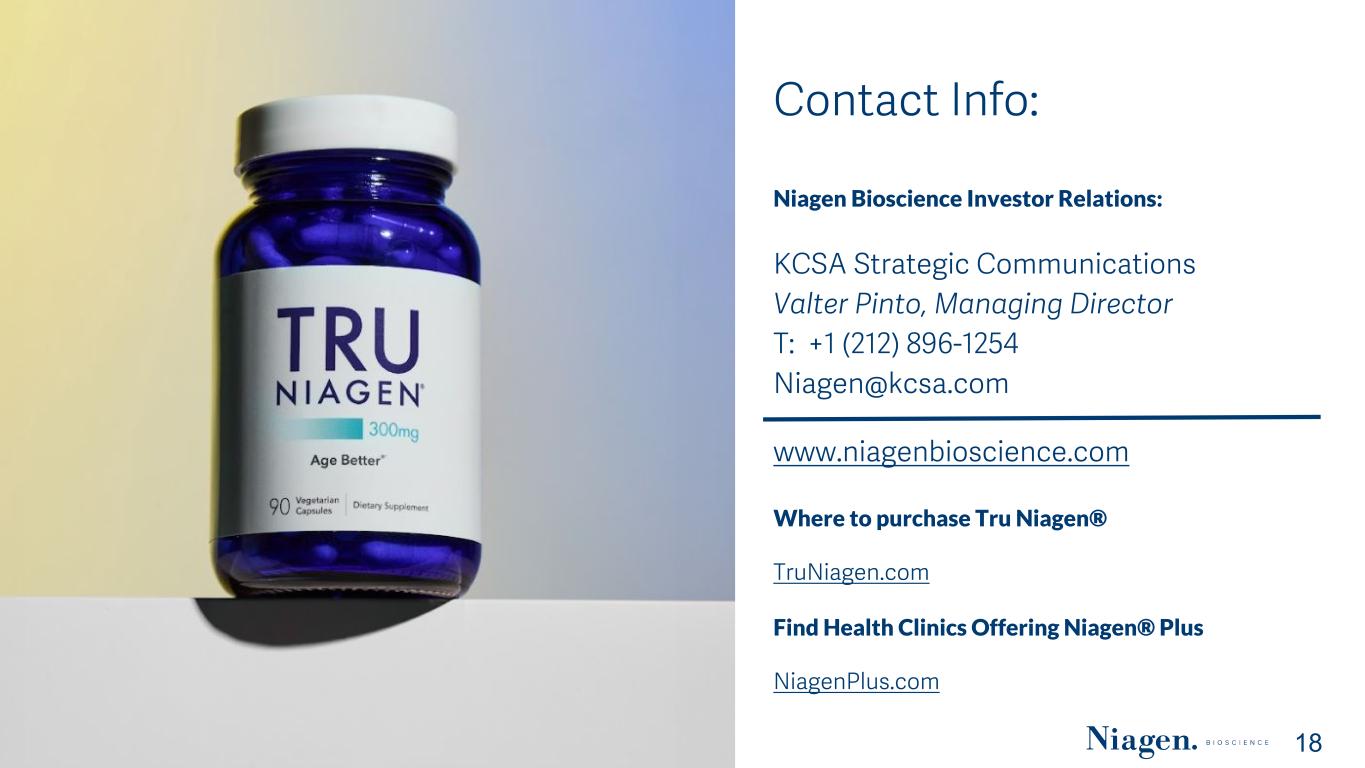
The information contained in this documents is confidential, privileged and only for the information of the intended recipient and may not be used, published or redistributed without the prior written consent (2019) 18 Contact Info: Niagen Bioscience Investor Relations: KCSA Strategic Communications Valter Pinto, Managing Director T: +1 (212) 896-1254 Niagen@kcsa.com www.niagenbioscience.com Where to purchase Tru Niagen® TruNiagen.com Find Health Clinics Offering Niagen® Plus NiagenPlus.com