
+ August 4, 2026 Q3 Fiscal 2026 Earnings Exhibit 99.2
This document contains both historical and forward-looking statements. Forward-looking statements are not based on historical facts but instead reflect our expectations, estimates or projections concerning future results or events, including, without limitation, the future sales, gross margins, costs, earnings, cash flows, tax rates, packaging transition, and performance of the Company. These statements generally can be identified by the use of forward-looking words or phrases such as "believe," "expect," "expectation," "anticipate," "may," "could," "will," "intend," "belief," "estimate," "plan," "target," "predict," "likely," "should," "forecast," "outlook," or other similar words or phrases. These statements are not guarantees of performance and are inherently subject to known and unknown risks, uncertainties and assumptions that are difficult to predict and could cause our actual results to differ materially from those indicated by those statements. We cannot assure you that any of our expectations, estimates or projections will be achieved. The forward-looking statements included in this document are only made as of the date of this document and we disclaim any obligation to publicly update any forward-looking statement to reflect subsequent events or circumstances. All forward-looking statements should be evaluated with the understanding of their inherent uncertainty. Numerous factors could cause our actual results and events to differ materially from those expressed or implied by forward-looking statements, including, without limitation: Global economic and financial market conditions beyond our control might materially and negatively impact us. Competition in our product categories might hinder our ability to execute our business strategy, achieve profitability, or maintain relationships with existing customers. Changes in the retail environment and consumer preferences could adversely affect our business, financial condition and results of operations. Loss or impairment of the reputation of our Company or our leading brands or failure of our marketing plans could have an adverse effect on our business. Loss of any of our principal customers could significantly decrease our sales and profitability. Our ability to meet our growth targets depends on successful product, marketing and operations innovation and successful responses to competitive innovation and changing consumer habits. We are subject to risks related to our international operations, including tariff and currency fluctuations, which could adversely affect our results of operations. We must successfully manage the demand, supply, and operational challenges brought on by any disease outbreak, including epidemics, pandemics, or similar widespread public health concerns. If we fail to protect our intellectual property rights, competitors may manufacture and market similar products, which could adversely affect our market share and results of operations. Changes in production costs, including raw material prices and transportation costs, from tariffs, inflation or otherwise, have adversely affected, and in the future could erode, our profit margins and negatively impact operating results. Our reliance on certain significant suppliers subjects us to numerous risks, including possible interruptions in supply, which could adversely affect our business. Our business is vulnerable to the availability of raw materials, as well as our ability to forecast customer demand and manage production capacity. The manufacturing facilities, supply channels or other business operations of the Company and our suppliers may be subject to disruption from events beyond our control. Our future results may be affected by our operational execution, including our ability to achieve cost savings as a result of any current or future restructuring efforts. If our goodwill and indefinite-lived intangible assets become impaired, we will be required to record impairment charges, which may be significant. Sales of certain of our products are seasonal and adverse weather conditions during our peak selling seasons for certain auto care products could have a material adverse effect. We may use artificial intelligence in our business, which could result in reputational harm, competitive harm, and legal liability, and adversely affect our operations. A failure of a key information technology system could adversely impact our ability to conduct business. We rely significantly on information technology and any inadequacy, interruption, theft or loss of data, malicious attack, integration failure, failure to maintain the security, confidentiality or privacy of sensitive data residing on our systems or other security failure of that technology could harm our ability to effectively operate our business and damage the reputation of our brands. We may not be able to attract, retain and develop key employees, as well as effectively manage human capital resources. We have significant debt obligations that could adversely affect our business. Our credit ratings are important to our cost of capital. We may experience losses or be subject to increased funding and expenses related to our pension plans. The estimates and assumptions on which our financial projections are based may prove to be inaccurate, which may cause our actual results to materially differ from our projections, which may adversely affect our future profitability, cash flows and stock price. If we pursue strategic acquisitions, divestitures or joint ventures, we might experience operating difficulties, dilution, and other consequences that may harm our business, financial condition, and operating results, and we may not be able to successfully consummate favorable transactions or successfully integrate acquired businesses. Our business involves the potential for product liability claims, labeling claims, commercial claims and other legal claims against us, which could affect our results of operations and financial condition and result in product recalls or withdrawals. Our business is subject to increasing government regulations in both the U.S. and abroad that could impose material costs. Section 45X of the Internal Revenue Code contains production tax credits for certain battery components. Our ability to benefit from Section 45X production tax credits is not guaranteed and is dependent upon the federal government's ongoing implementation, guidance, regulations, or rulemakings. Increased focus by governmental and non-governmental organizations, customers, consumers and shareholders on sustainability issues, including those related to climate change, may have an adverse effect on our business, financial condition and results of operations and damage our reputation. We are subject to environmental laws and regulations that may expose us to significant liabilities and have a material adverse effect on our results of operations and financial condit ion. We are subject to uncertainties regarding the IEEPA tariff refunds, including the timing of these refunds. In addition, other risks and uncertainties not presently known to us or that we consider immaterial could affect the accuracy of any such forward-looking statements. The list of factors above is illustrative, but by no means exhaustive. All forward-looking statements should be evaluated with the understanding of their inherent uncertainty. Additional risks and uncertainties include those detailed from time to time in our publicly filed documents, including those described under the heading “Risk Factors” in our Form 10-K filed with the Securities and Exchange Commission on November 18, 2025 and Part II, Item 1A. "Risk Factors" of our subsequent Form 10-Q filings. 2 Forward-Looking Statements
Non-GAAP Financial Measures The Company reports its financial results in accordance with accounting principles generally accepted in the U.S. ("GAAP"). However, management believes that certain non- GAAP financial measures provide users with additional meaningful comparisons to the corresponding historical or future period, and are used for management incentive compensation. These non-GAAP financial measures exclude items that are not reflective of the Company's on-going operating performance, such as restructuring and related costs, network transition costs, FY23 & FY24 production credits, acquisition and integration costs, a litigation matter, impairment of intangible assets, the settlement loss on the U.K. pension plan termination and the loss on extinguishment/modification of debt. In addition, these measures help investors to analyze year over year comparability when excluding currency fluctuations as well as other Company initiatives that are not on-going. We believe these non-GAAP financial measures are an enhancement to assist investors in understanding our business and in performing analysis consistent with financial models developed by research analysts. Investors should consider non-GAAP measures in addition to, not as a substitute for, or superior to, the comparable GAAP measures. In addition, these non-GAAP measures may not be the same as similar measures used by other companies due to possible differences in methods and in the items being adjusted. We provide the following non-GAAP measures and calculations, as well as the corresponding reconciliation to the closest GAAP measure in the following supplemental schedules: Organic. This is the non-GAAP financial measurement of the change in Net sales or segment profit that excludes or otherwise adjusts for the Acquisition impact, Change in highly inflationary markets and Impact of currency from the changes in foreign currency exchange rates as defined below: • Acquisition impact. The Company completed the APS acquisition on May 2, 2025. These adjustments include the impact of the operations associated with the acquired branded battery business, as well as exiting the branded license. The Company sold batteries under an acquired brand license from the acquisition date through December 31, 2025, and then transitioned from the branded businesses to legacy brands. This does not include the impact of acquisition and integration costs associated with this acquisition. • Change in highly inflationary markets. The Company is presenting separately all changes in sales and segment profit from our Egypt and Argentina affiliates due to the designation of the economies as highly inflationary as of October 1, 2024 and July 1, 2018, respectively. • Impact of currency. The Company evaluates the operating performance of our Company on a currency neutral basis. The Impact of Currency is the change in foreign currency exchange rates year-over-year on reported results, which is calculated by comparing the value of current year foreign operations at the current period USD exchange rate versus the value of current year foreign operations at the prior period USD exchange rate. The impact of currency also includes (gains)/losses of currency hedging programs, and it excludes highly inflationary markets. •Adjusted Comparisons. Detail for adjusted gross profit and adjusted gross margin are also supplemental non-GAAP measure disclosures. These measures exclude the impact of restructuring and related costs, network transition costs and the FY23 & FY24 production credits. •Free Cash Flow. Free Cash Flow is defined as net cash provided by operating activities reduced by capital expenditures. •Adjusted Net Earnings and Adjusted Diluted Net Earnings per Common Share (EPS). These measures exclude the impact of restructuring and related costs, network transition costs, FY23 & FY24 production credits, costs related to acquisition and integration, a litigation matter, the settlement loss on the U.K. pension plan termination and the loss on extinguishment/modification of debt. •EBITDA and Adjusted EBITDA. EBITDA is defined as (loss)/earnings before Income tax provision, Interest expense, the Loss on extinguishment/modification of debt, and depreciation and amortization. Adjusted EBITDA further excludes the impact of the costs related to restructuring, network transition costs, acquisition and integration costs, the settlement loss on the U.K. pension plan termination, a litigation matter, FY23 & FY24 production credits, impairment of intangible assets, and share based payments. 3

+ Q3 Fiscal 2026 Financial Results
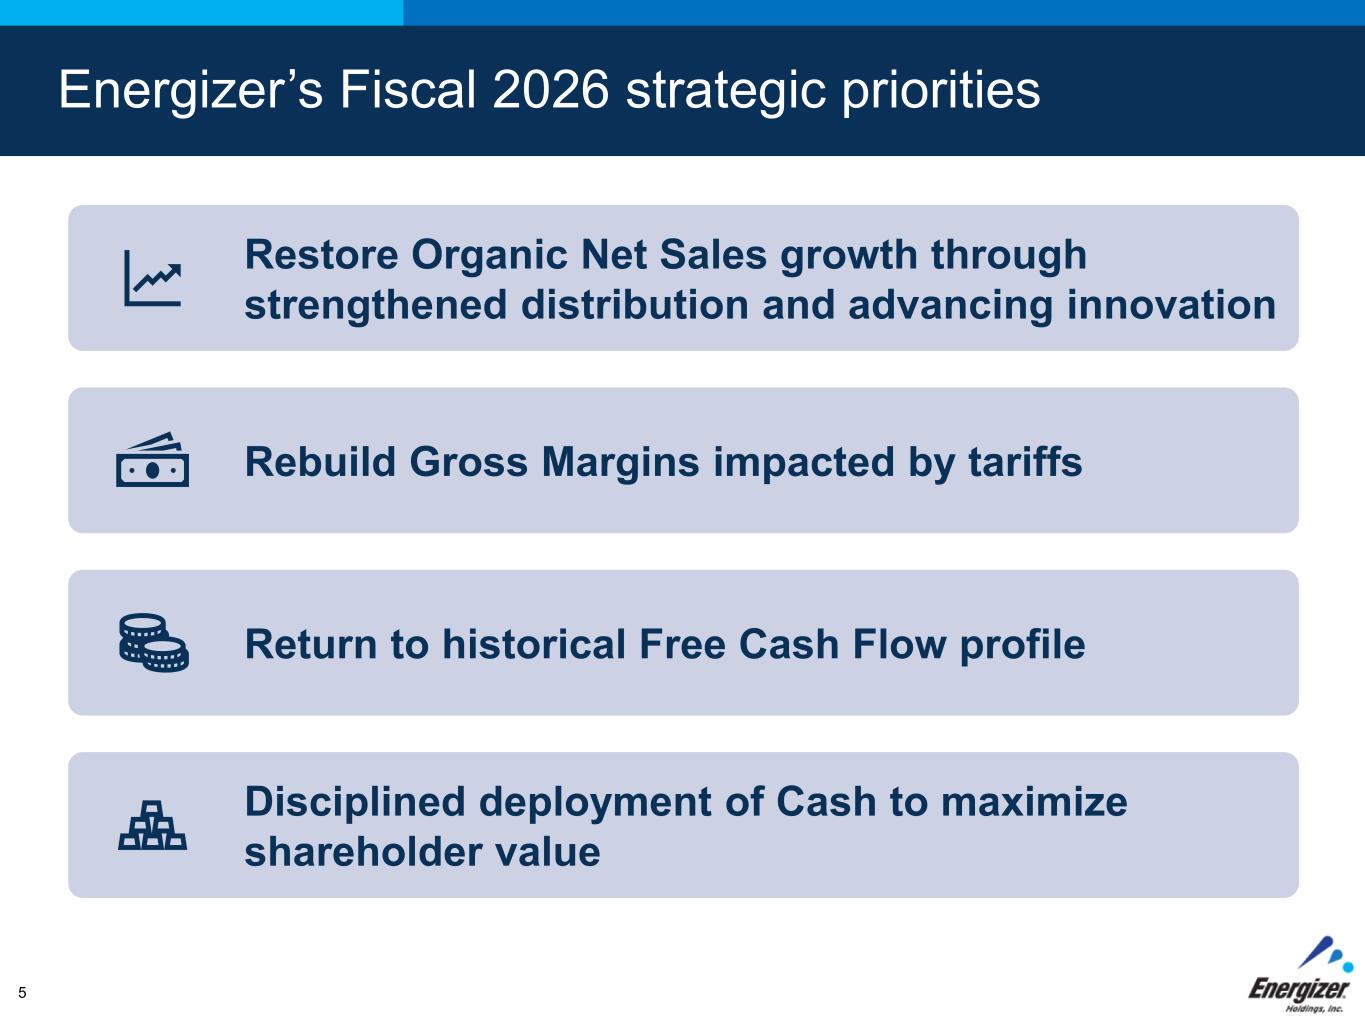
FOR INTERNAL USE ONLY – DO NOT DISTRIBUTE5 Energizer’s Fiscal 2026 strategic priorities Restore Organic Net Sales growth through strengthened distribution and advancing innovation Rebuild Gross Margins impacted by tariffs Return to historical Free Cash Flow profile Disciplined deployment of Cash to maximize shareholder value 5
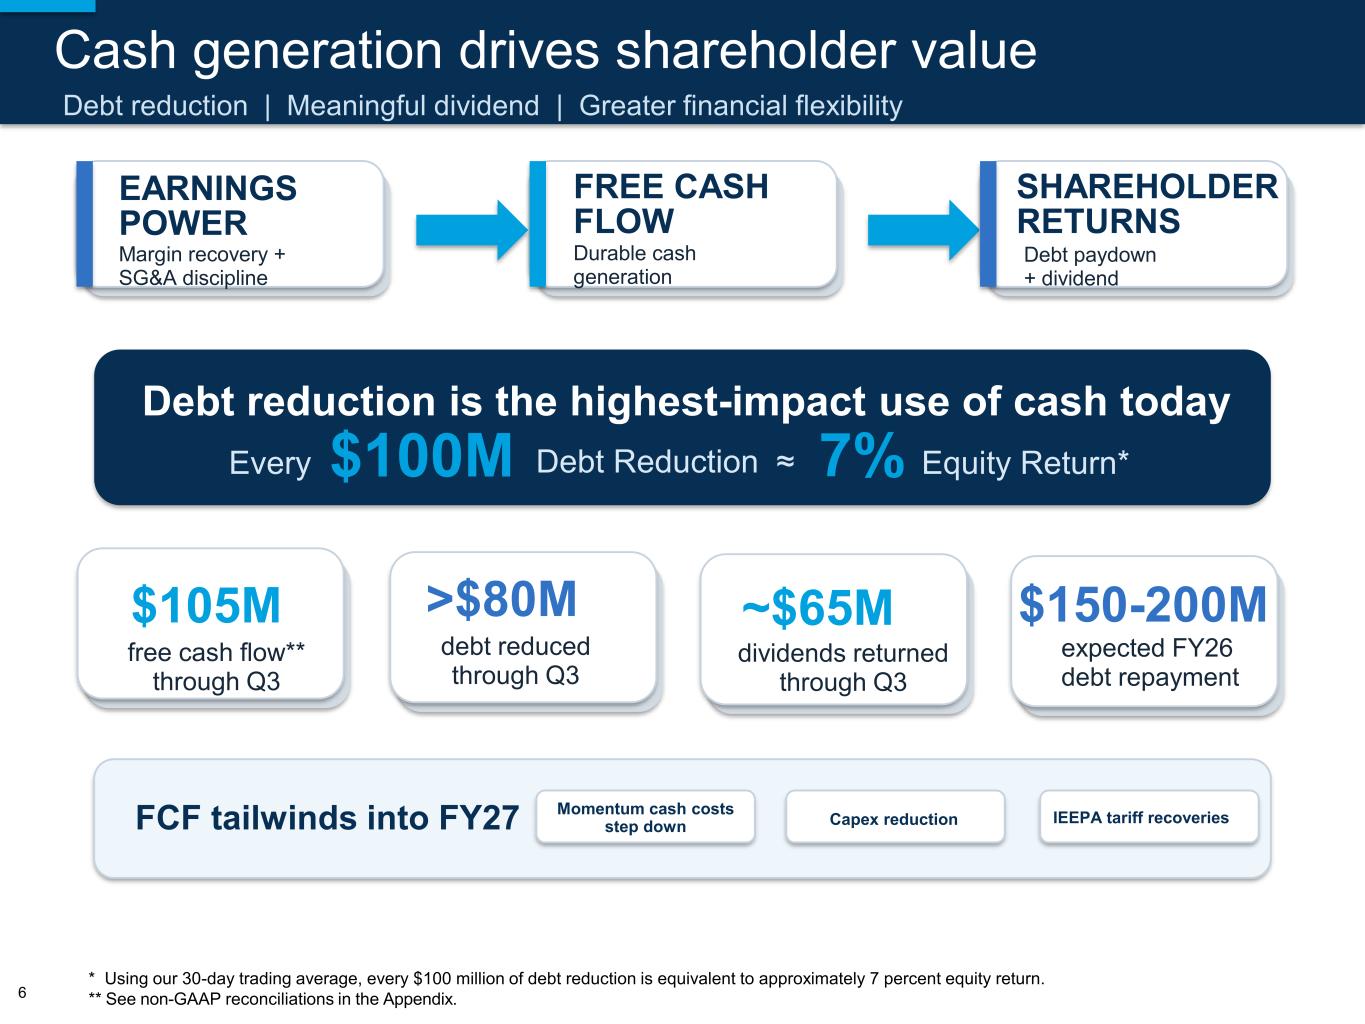
Cash generation drives shareholder value Debt reduction | Meaningful dividend | Greater financial flexibility EARNINGS POWER Margin recovery + SG&A discipline FREE CASH FLOW Durable cash generation SHAREHOLDER RETURNS Debt paydown + dividend Debt reduction is the highest-impact use of cash today Every $100M Debt Reduction ≈ 7% Equity Return* >$80M debt reduced through Q3 $150-200M expected FY26 debt repayment ~$65M dividends returned through Q3 $105M free cash flow** through Q3 FCF tailwinds into FY27 Momentum cash costs step down Capex reduction IEEPA tariff recoveries 6 * Using our 30-day trading average, every $100 million of debt reduction is equivalent to approximately 7 percent equity return. ** See non-GAAP reconciliations in the Appendix.
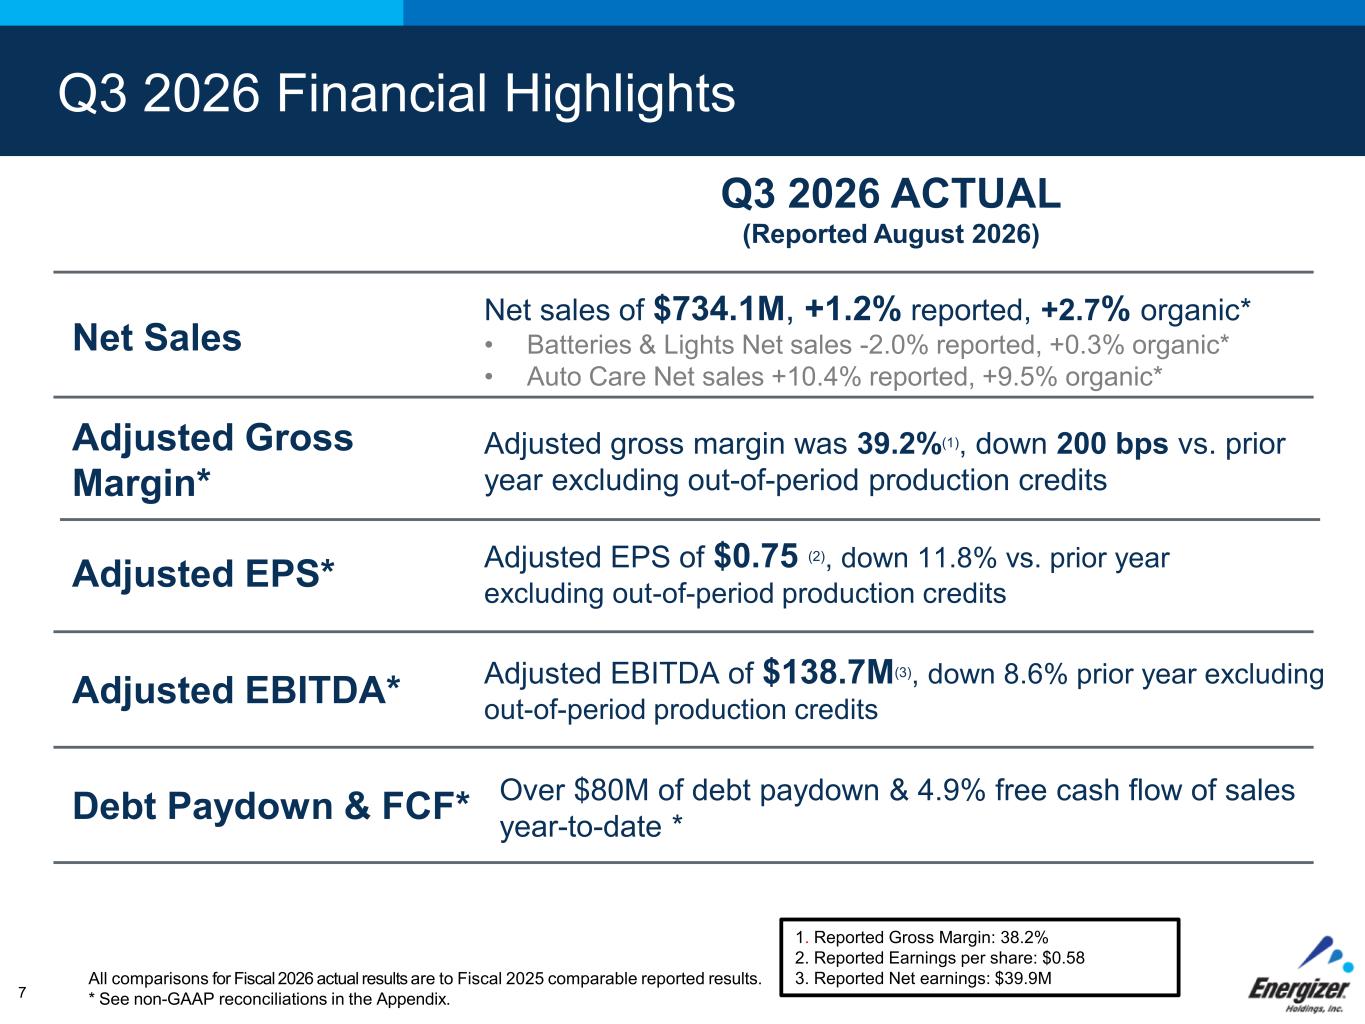
Q3 2026 Financial Highlights Q3 2026 ACTUAL (Reported August 2026) 7 1. Reported Gross Margin: 38.2% 2. Reported Earnings per share: $0.58 3. Reported Net earnings: $39.9M Net sales of $734.1M, +1.2% reported, +2.7% organic* • Batteries & Lights Net sales -2.0% reported, +0.3% organic* • Auto Care Net sales +10.4% reported, +9.5% organic* Adjusted gross margin was 39.2%(1), down 200 bps vs. prior year excluding out-of-period production credits Adjusted EPS of $0.75 (2), down 11.8% vs. prior year excluding out-of-period production credits Adjusted EBITDA of $138.7M(3), down 8.6% prior year excluding out-of-period production credits Net Sales Adjusted Gross Margin* Adjusted EPS* Adjusted EBITDA* Over $80M of debt paydown & 4.9% free cash flow of sales year-to-date * Debt Paydown & FCF* All comparisons for Fiscal 2026 actual results are to Fiscal 2025 comparable reported results. * See non-GAAP reconciliations in the Appendix.
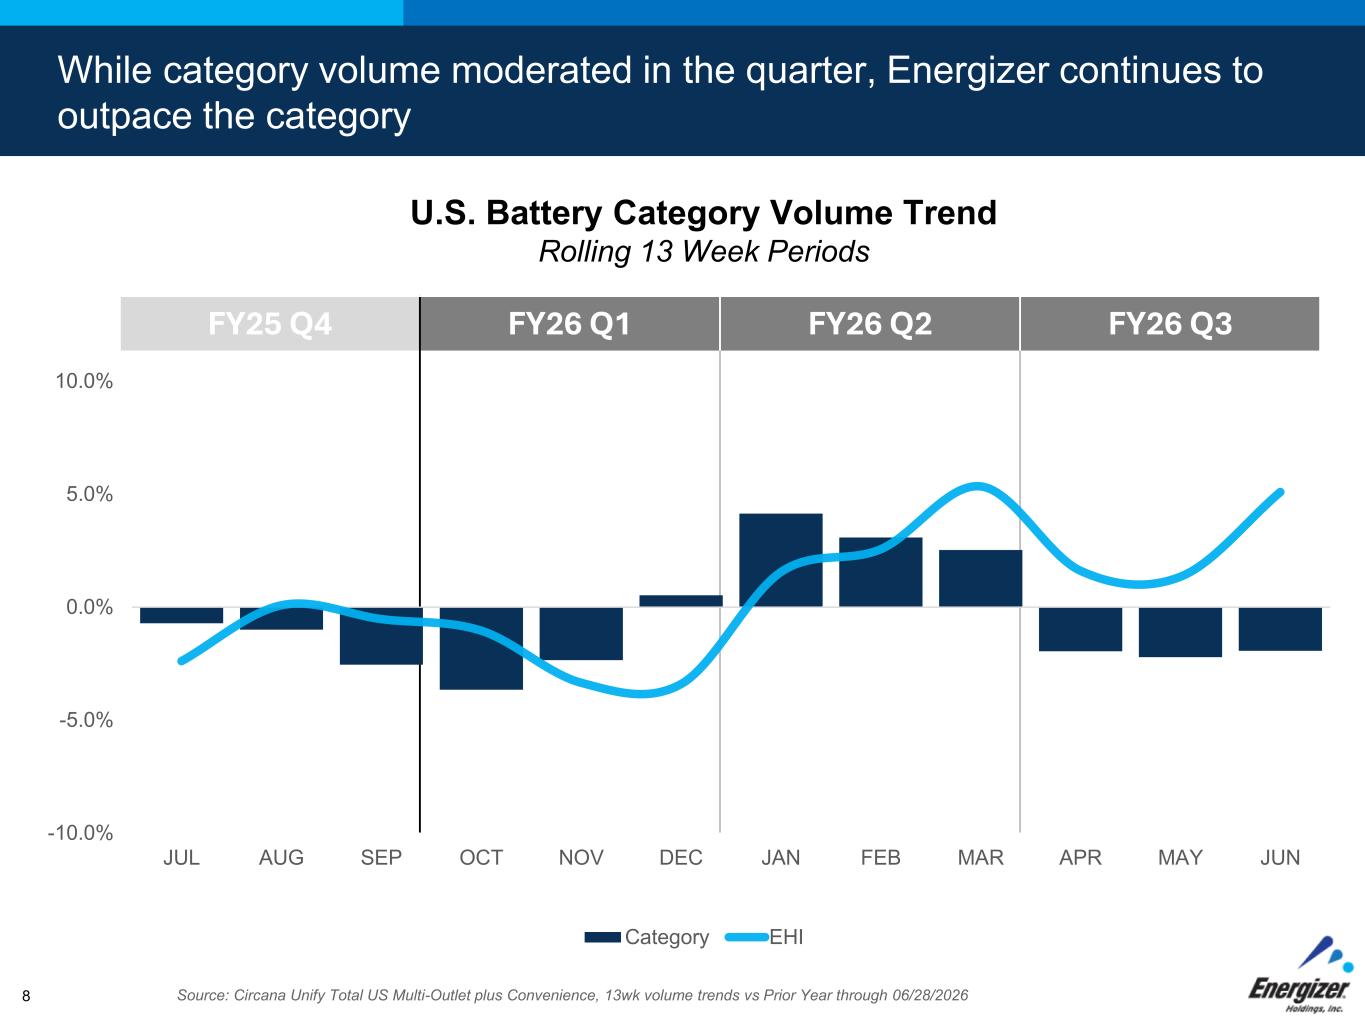
FY25 Q4 FY26 Q1 FY26 Q2 FY26 Q3 8 U.S. Battery Category Volume Trend Rolling 13 Week Periods Source: Circana Unify Total US Multi-Outlet plus Convenience, 13wk volume trends vs Prior Year through 06/28/2026 While category volume moderated in the quarter, Energizer continues to outpace the category -10.0% -5.0% 0.0% 5.0% 10.0% JUL AUG SEP OCT NOV DEC JAN FEB MAR APR MAY JUN Category EHI
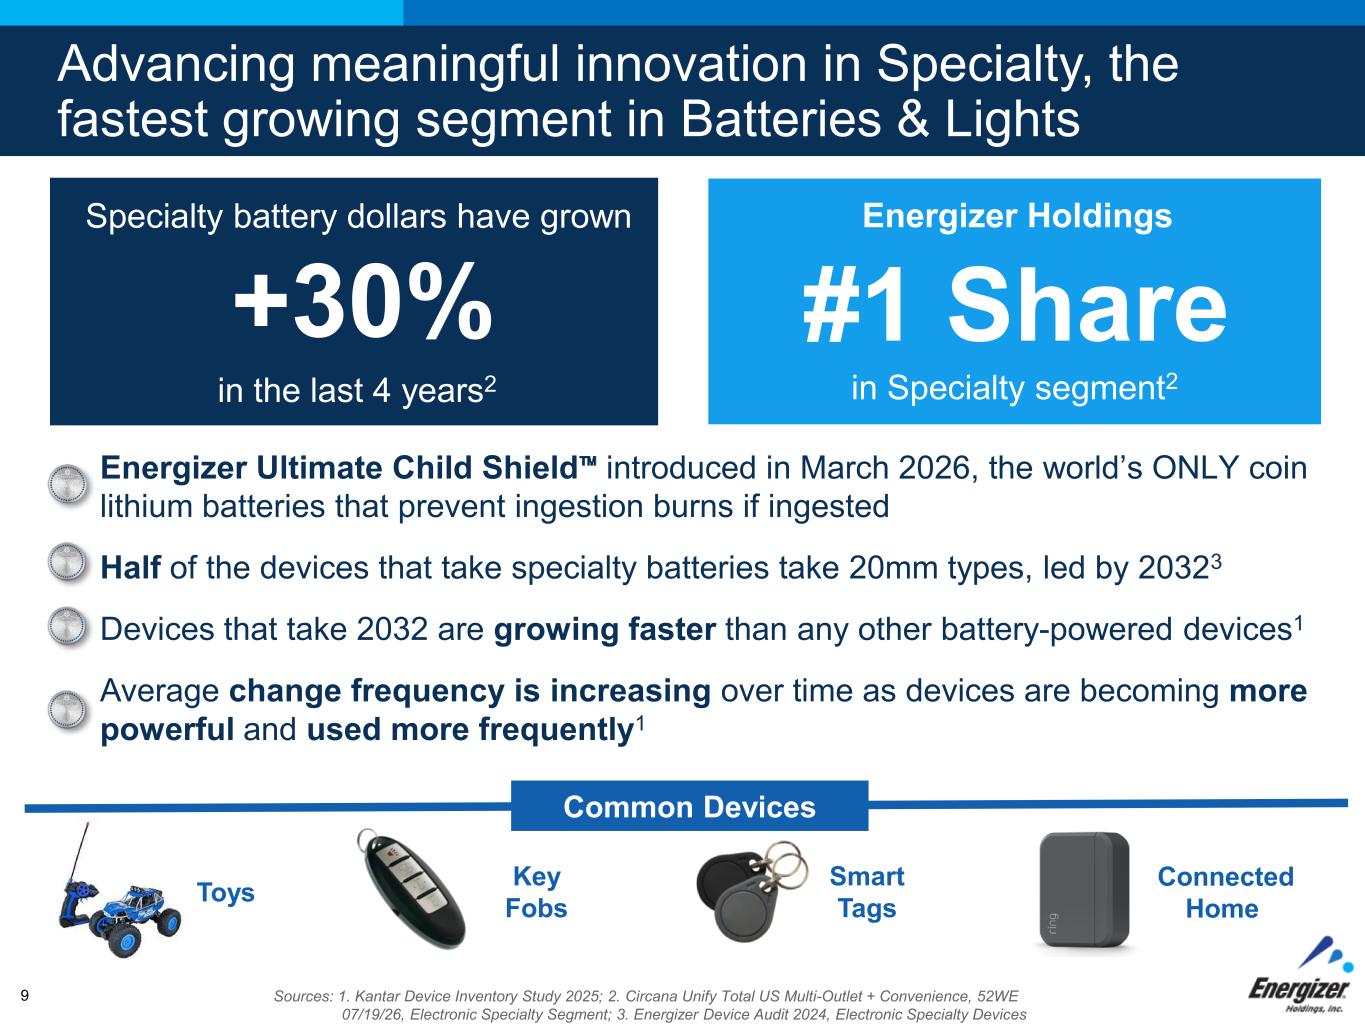
FOR INTERNAL USE ONLY – DO NOT DISTRIBUTE +30% Specialty battery dollars have grown in the last 4 years2 Advancing meaningful innovation in Specialty, the fastest growing segment in Batteries & Lights Energizer Ultimate Child Shield introduced in March 2026, the world’s ONLY coin lithium batteries that prevent ingestion burns if ingested Half of the devices that take specialty batteries take 20mm types, led by 20323 Devices that take 2032 are growing faster than any other battery-powered devices1 Average change frequency is increasing over time as devices are becoming more powerful and used more frequently1 Sources: 1. Kantar Device Inventory Study 2025; 2. Circana Unify Total US Multi-Outlet + Convenience, 52WE 07/19/26, Electronic Specialty Segment; 3. Energizer Device Audit 2024, Electronic Specialty Devices #1 Share Energizer Holdings in Specialty segment2 Smart Tags Connected Home Key Fobs Toys Common Devices 9
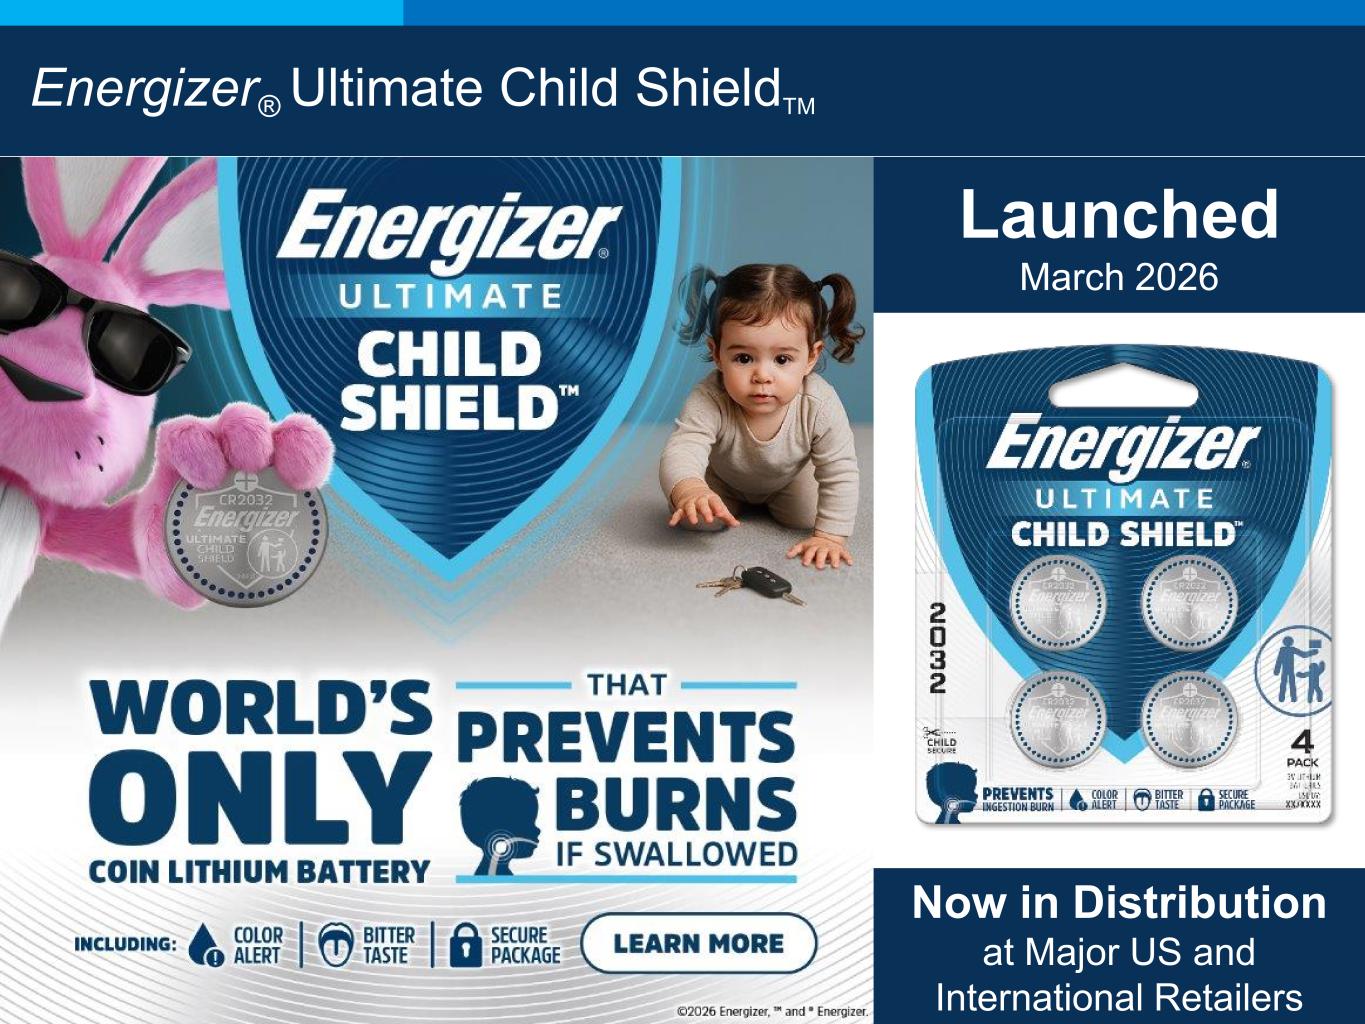
Energizer® Ultimate Child ShieldTM Launched March 2026 Now in Distribution at Major US and International Retailers

+ Fiscal 2026 & Q4 Outlook
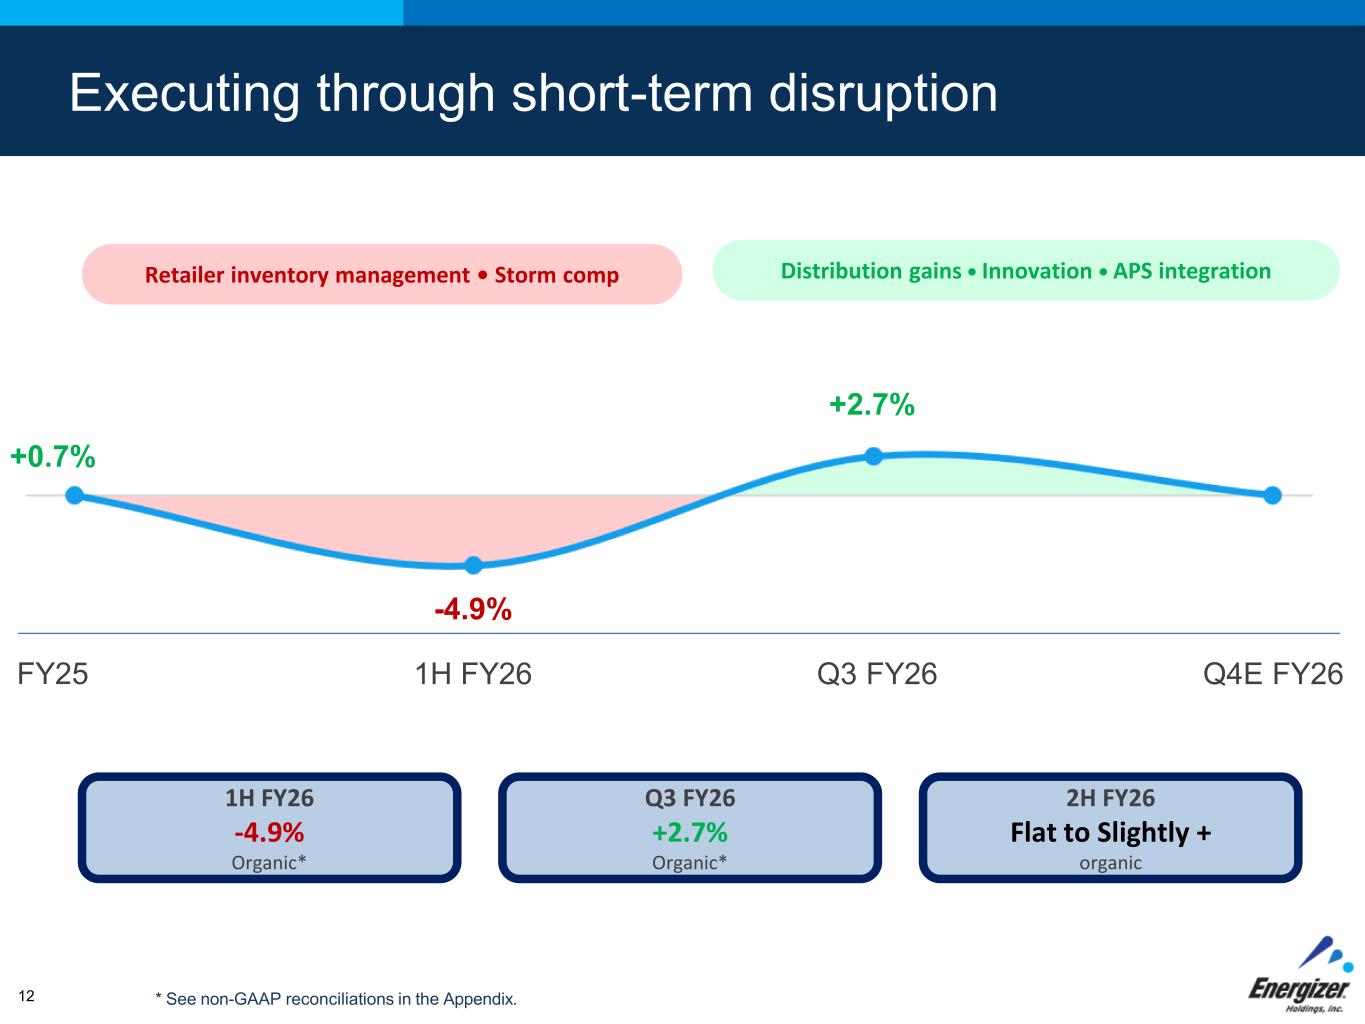
12 Retailer inventory management • Storm comp Distribution gains • Innovation • APS integration 1H FY26 -4.9% Organic* Q3 FY26 +2.7% Organic* 2H FY26 Flat to Slightly + organic FY25 1H FY26 Q3 FY26 Q4E FY26 +2.7% -4.9% Executing through short-term disruption +0.7% * See non-GAAP reconciliations in the Appendix.
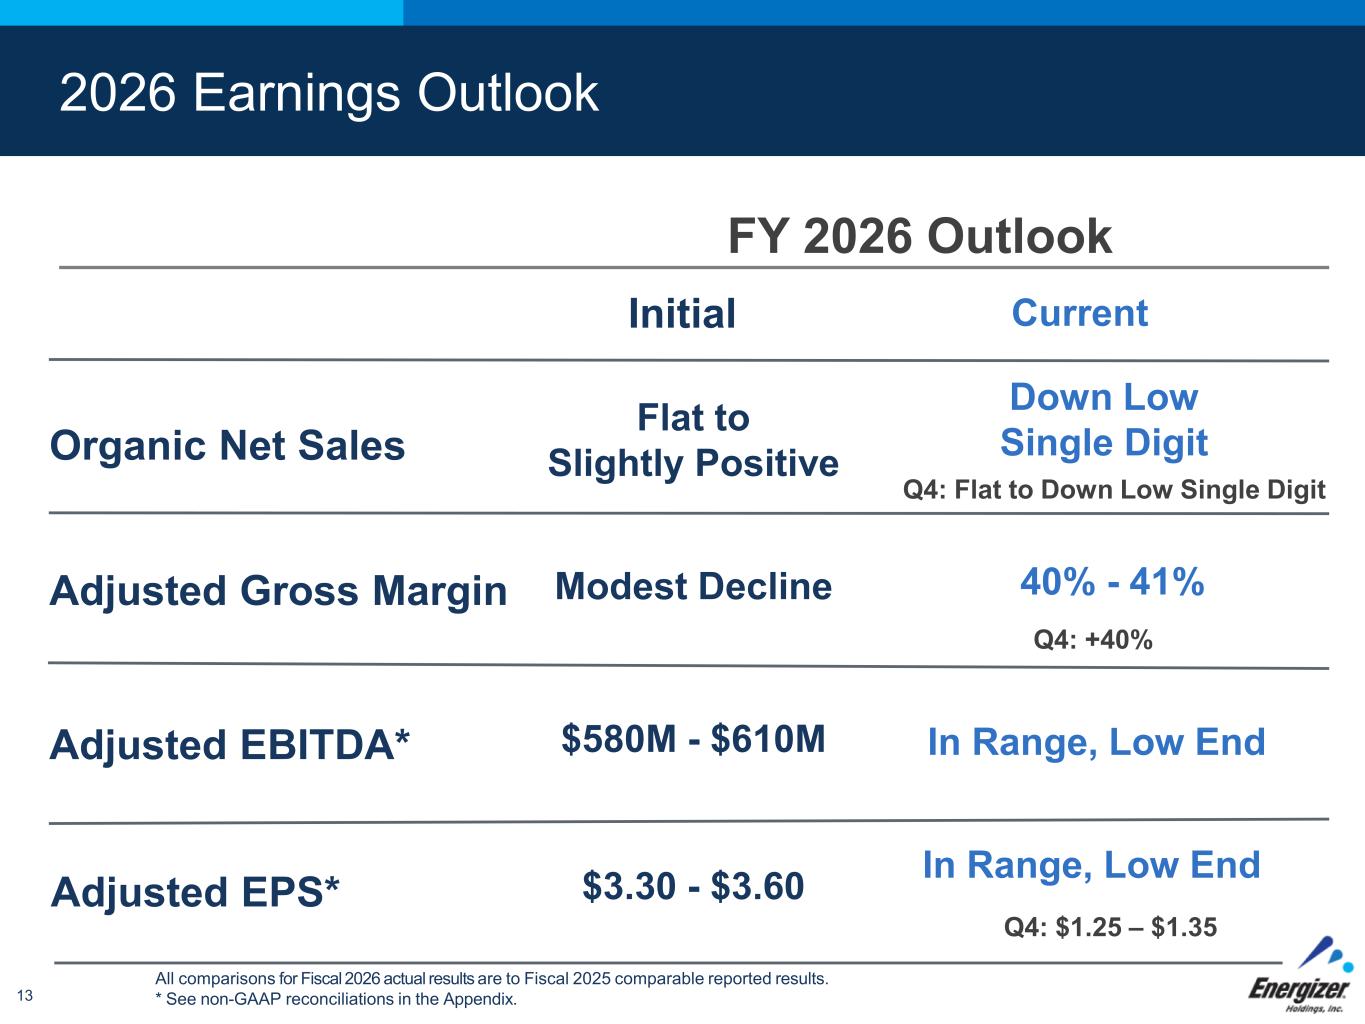
2026 Earnings Outlook 13 All comparisons for Fiscal 2026 actual results are to Fiscal 2025 comparable reported results. * See non-GAAP reconciliations in the Appendix. Organic Net Sales Adjusted Gross Margin Adjusted EBITDA* Adjusted EPS* 40% - 41% In Range, Low End In Range, Low End FY 2026 Outlook Initial Modest Decline Flat to Slightly Positive $580M - $610M $3.30 - $3.60 Current Down Low Single Digit Q4: Flat to Down Low Single Digit Q4: +40% Q4: $1.25 – $1.35
Appendix Materials: Non-GAAP Reconciliations 14
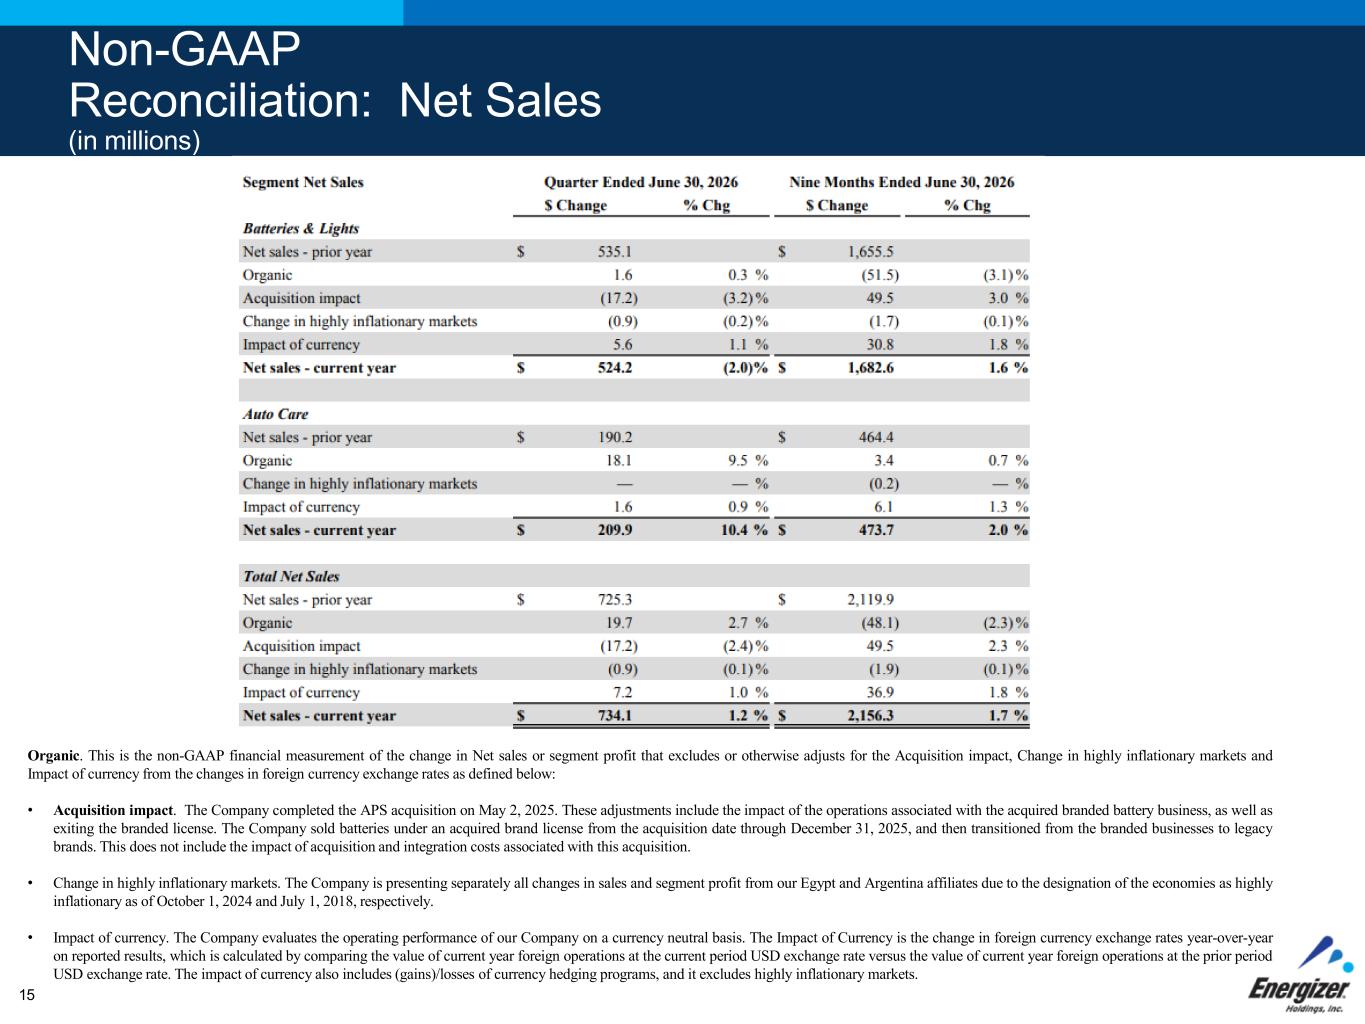
Non-GAAP Reconciliation: Net Sales (in millions) Organic. This is the non-GAAP financial measurement of the change in Net sales or segment profit that excludes or otherwise adjusts for the Acquisition impact, Change in highly inflationary markets and Impact of currency from the changes in foreign currency exchange rates as defined below: • Acquisition impact. The Company completed the APS acquisition on May 2, 2025. These adjustments include the impact of the operations associated with the acquired branded battery business, as well as exiting the branded license. The Company sold batteries under an acquired brand license from the acquisition date through December 31, 2025, and then transitioned from the branded businesses to legacy brands. This does not include the impact of acquisition and integration costs associated with this acquisition. • Change in highly inflationary markets. The Company is presenting separately all changes in sales and segment profit from our Egypt and Argentina affiliates due to the designation of the economies as highly inflationary as of October 1, 2024 and July 1, 2018, respectively. • Impact of currency. The Company evaluates the operating performance of our Company on a currency neutral basis. The Impact of Currency is the change in foreign currency exchange rates year-over-year on reported results, which is calculated by comparing the value of current year foreign operations at the current period USD exchange rate versus the value of current year foreign operations at the prior period USD exchange rate. The impact of currency also includes (gains)/losses of currency hedging programs, and it excludes highly inflationary markets. 15
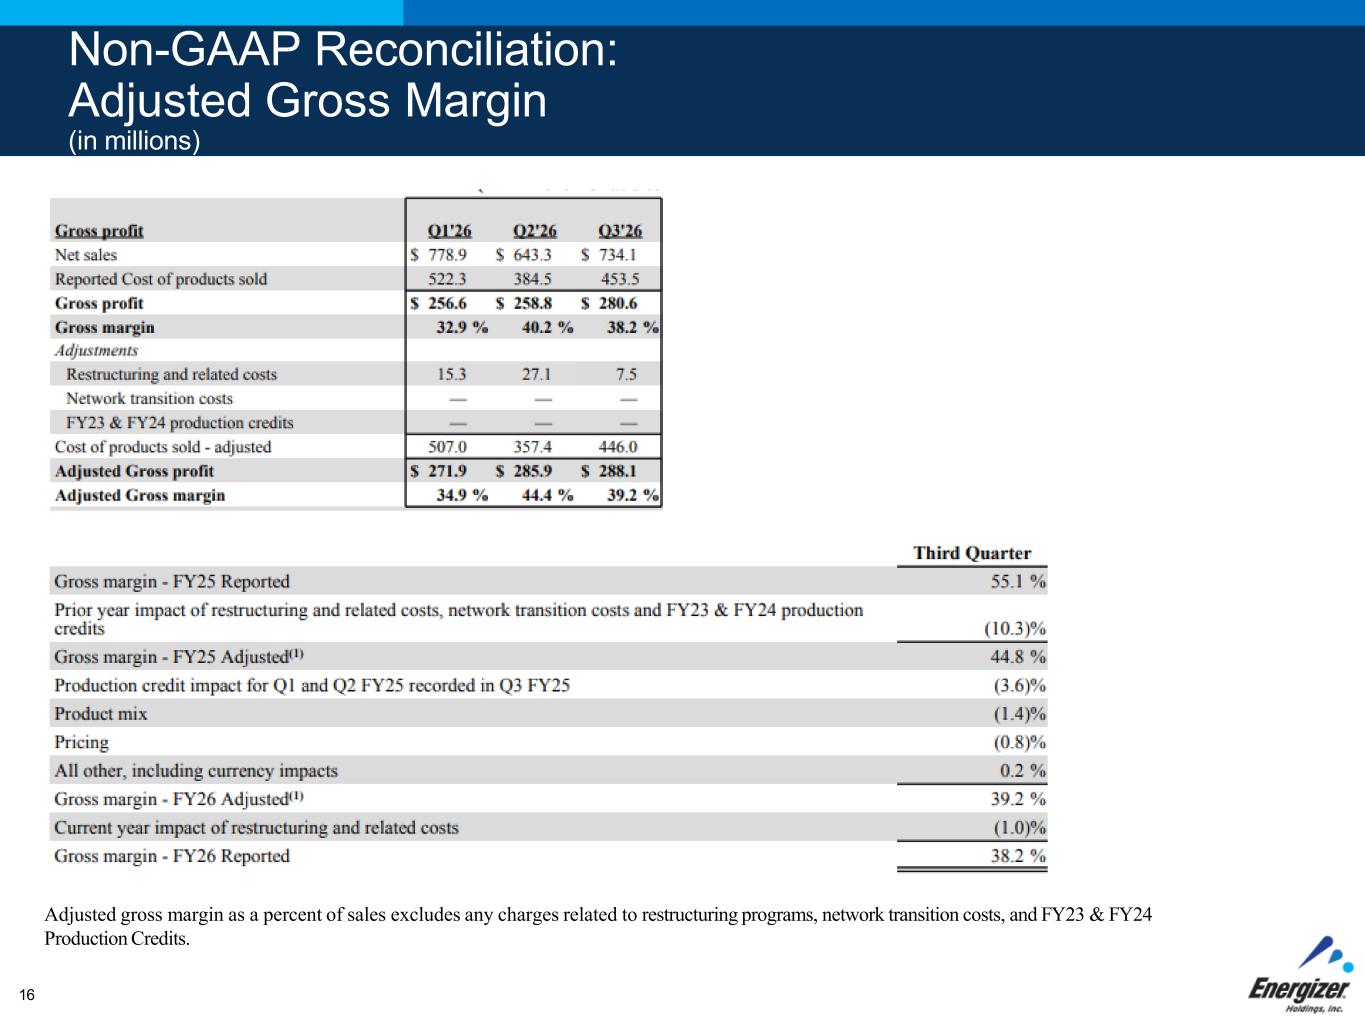
Non-GAAP Reconciliation: Adjusted Gross Margin (in millions) Adjusted gross margin as a percent of sales excludes any charges related to restructuring programs, network transition costs, and FY23 & FY24 Production Credits. 16
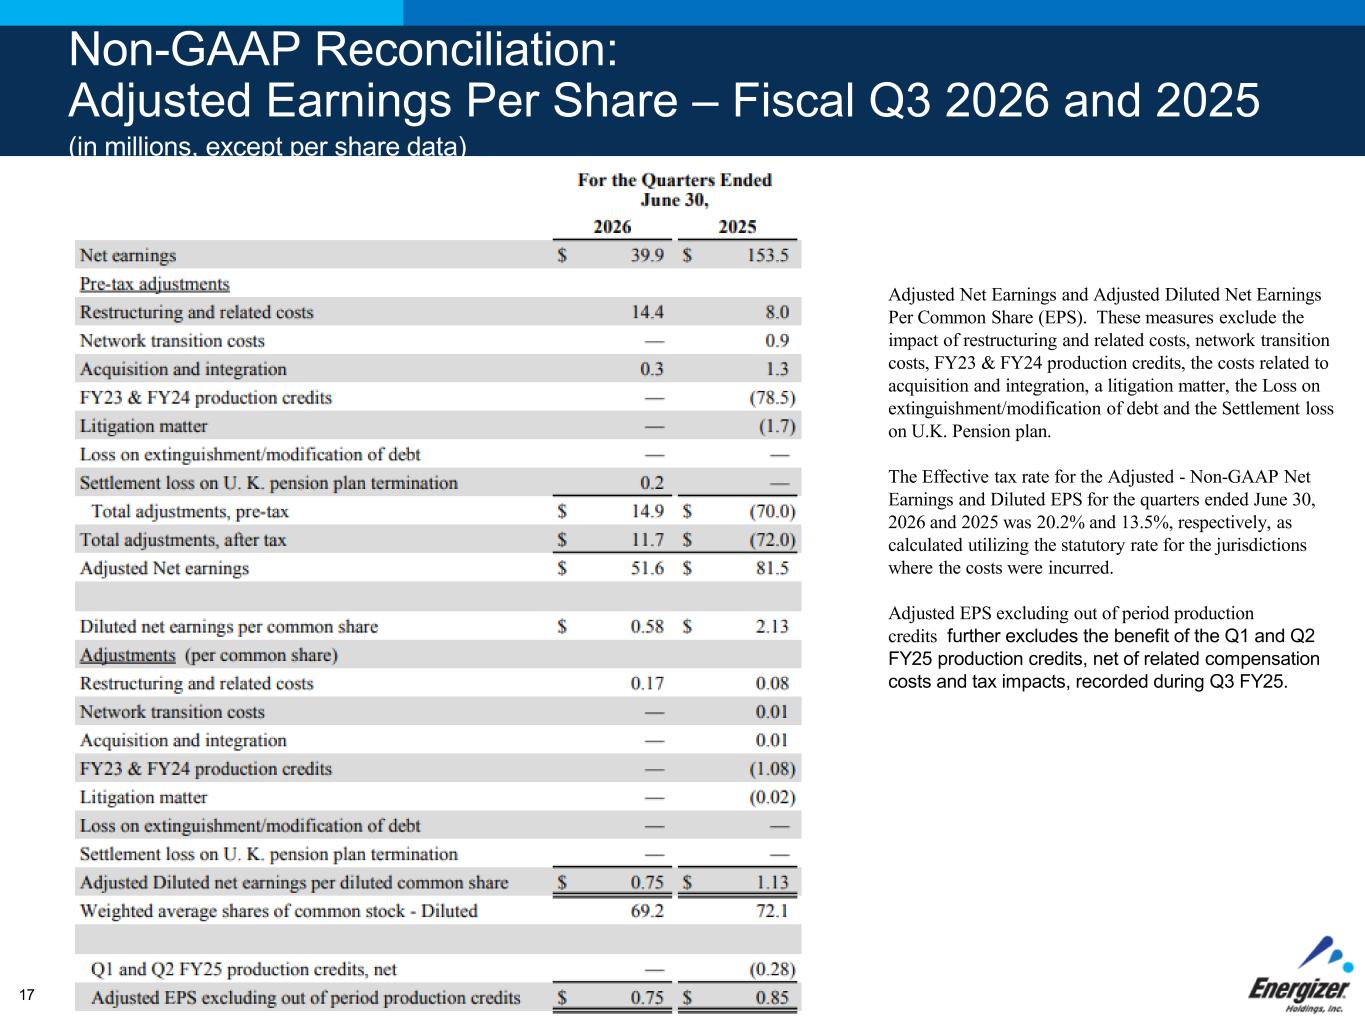
Non-GAAP Reconciliation: Adjusted Earnings Per Share – Fiscal Q3 2026 and 2025 (in millions, except per share data) Adjusted Net Earnings and Adjusted Diluted Net Earnings Per Common Share (EPS). These measures exclude the impact of restructuring and related costs, network transition costs, FY23 & FY24 production credits, the costs related to acquisition and integration, a litigation matter, the Loss on extinguishment/modification of debt and the Settlement loss on U.K. Pension plan. The Effective tax rate for the Adjusted - Non-GAAP Net Earnings and Diluted EPS for the quarters ended June 30, 2026 and 2025 was 20.2% and 13.5%, respectively, as calculated utilizing the statutory rate for the jurisdictions where the costs were incurred. Adjusted EPS excluding out of period production credits further excludes the benefit of the Q1 and Q2 FY25 production credits, net of related compensation costs and tax impacts, recorded during Q3 FY25. 17
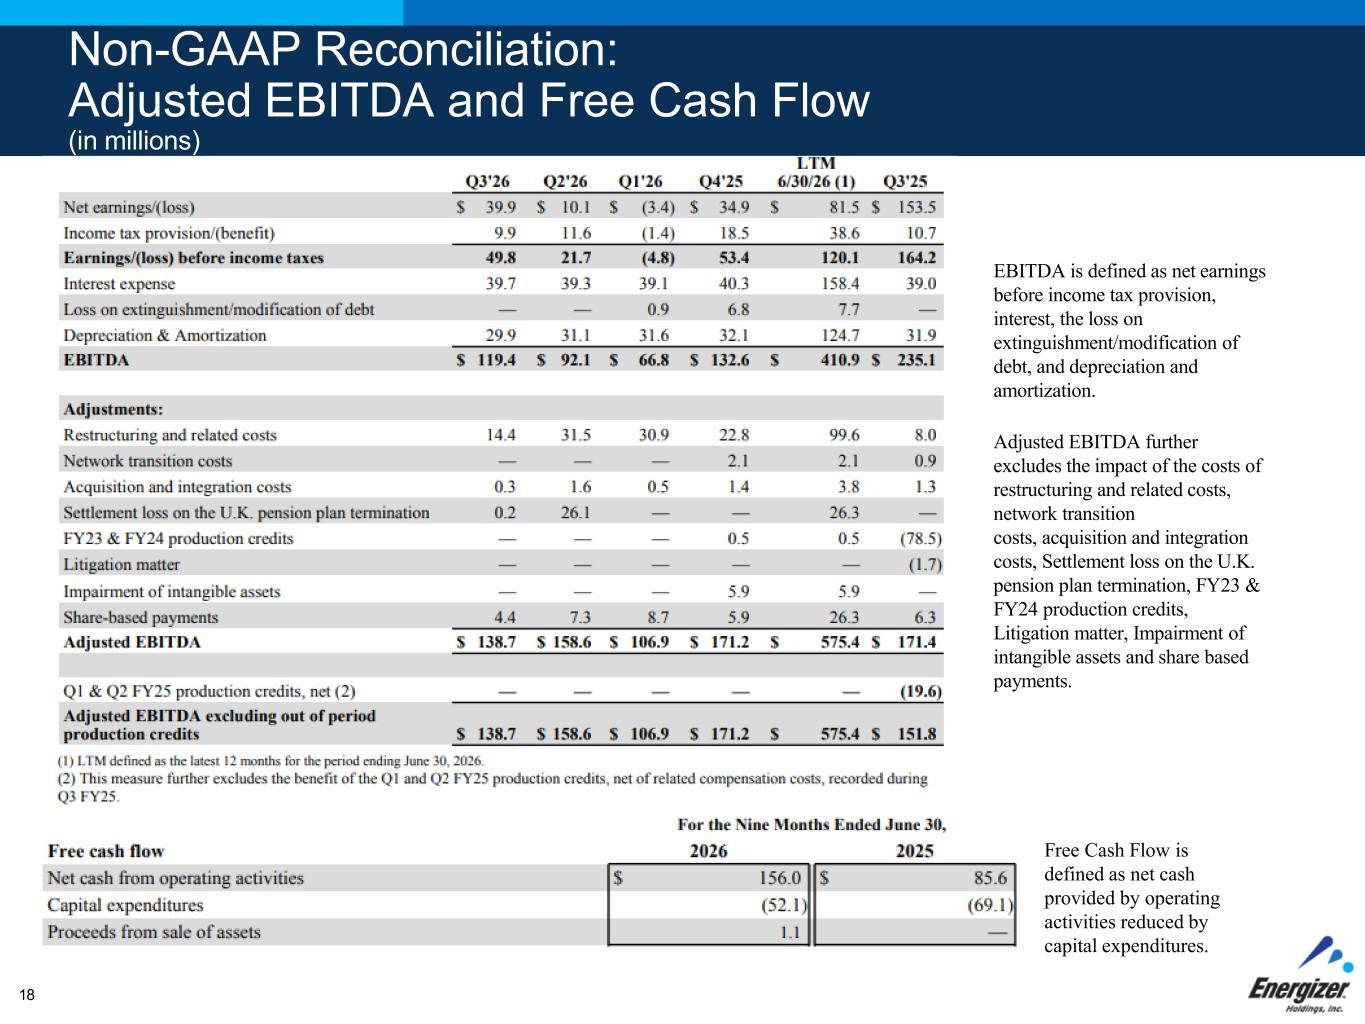
Non-GAAP Reconciliation: Adjusted EBITDA and Free Cash Flow (in millions) EBITDA is defined as net earnings before income tax provision, interest, the loss on extinguishment/modification of debt, and depreciation and amortization. Adjusted EBITDA further excludes the impact of the costs of restructuring and related costs, network transition costs, acquisition and integration costs, Settlement loss on the U.K. pension plan termination, FY23 & FY24 production credits, Litigation matter, Impairment of intangible assets and share based payments. 18 Free Cash Flow is defined as net cash provided by operating activities reduced by capital expenditures.
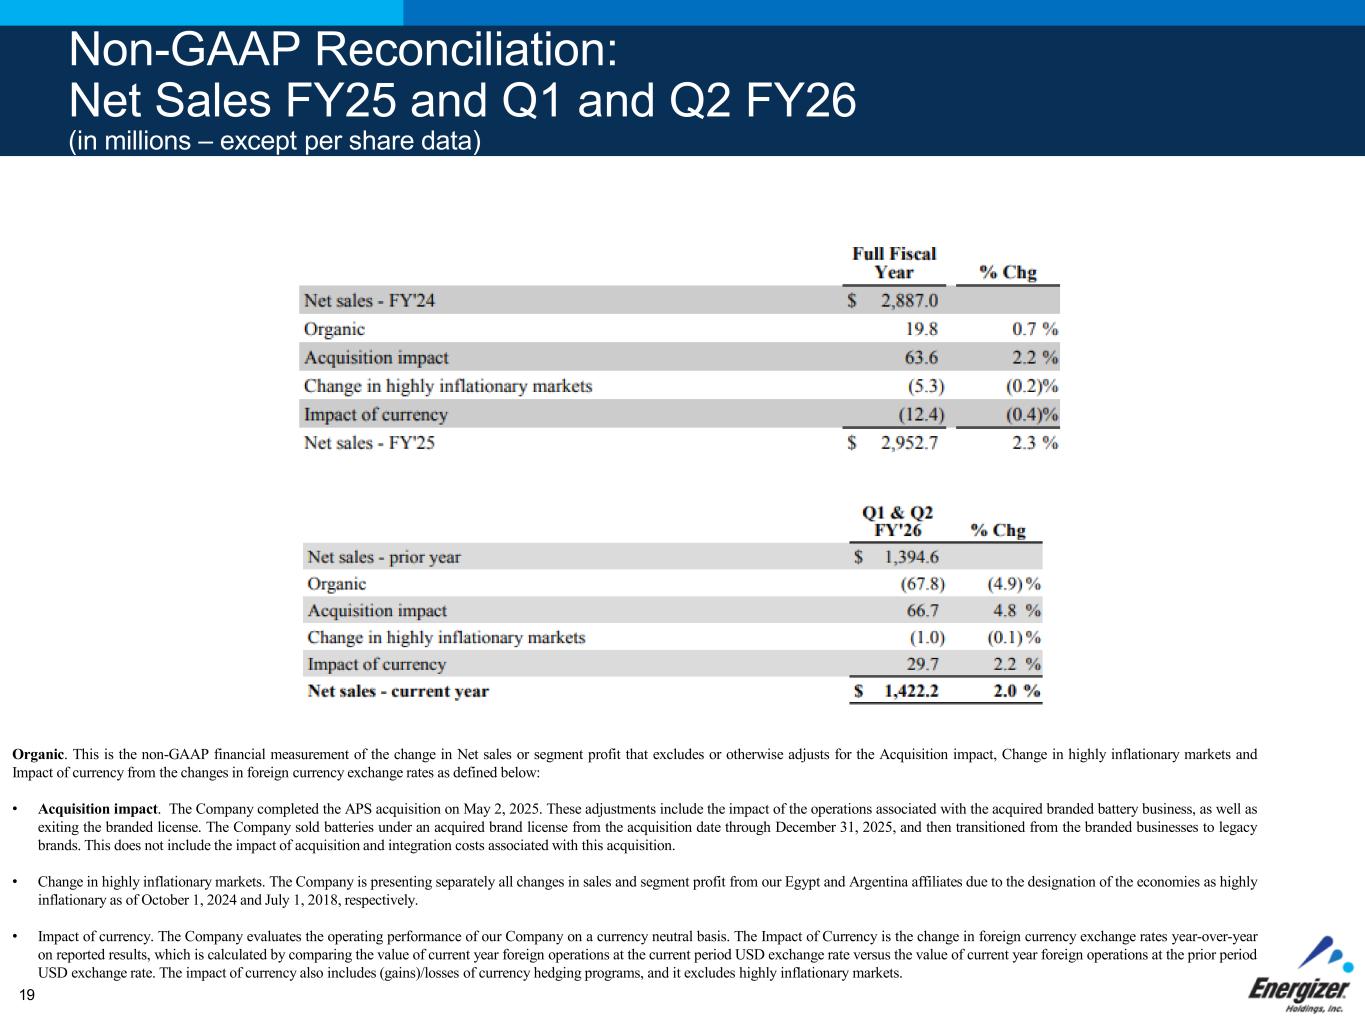
Non-GAAP Reconciliation: Net Sales FY25 and Q1 and Q2 FY26 (in millions – except per share data) 19 Organic. This is the non-GAAP financial measurement of the change in Net sales or segment profit that excludes or otherwise adjusts for the Acquisition impact, Change in highly inflationary markets and Impact of currency from the changes in foreign currency exchange rates as defined below: • Acquisition impact. The Company completed the APS acquisition on May 2, 2025. These adjustments include the impact of the operations associated with the acquired branded battery business, as well as exiting the branded license. The Company sold batteries under an acquired brand license from the acquisition date through December 31, 2025, and then transitioned from the branded businesses to legacy brands. This does not include the impact of acquisition and integration costs associated with this acquisition. • Change in highly inflationary markets. The Company is presenting separately all changes in sales and segment profit from our Egypt and Argentina affiliates due to the designation of the economies as highly inflationary as of October 1, 2024 and July 1, 2018, respectively. • Impact of currency. The Company evaluates the operating performance of our Company on a currency neutral basis. The Impact of Currency is the change in foreign currency exchange rates year-over-year on reported results, which is calculated by comparing the value of current year foreign operations at the current period USD exchange rate versus the value of current year foreign operations at the prior period USD exchange rate. The impact of currency also includes (gains)/losses of currency hedging programs, and it excludes highly inflationary markets.
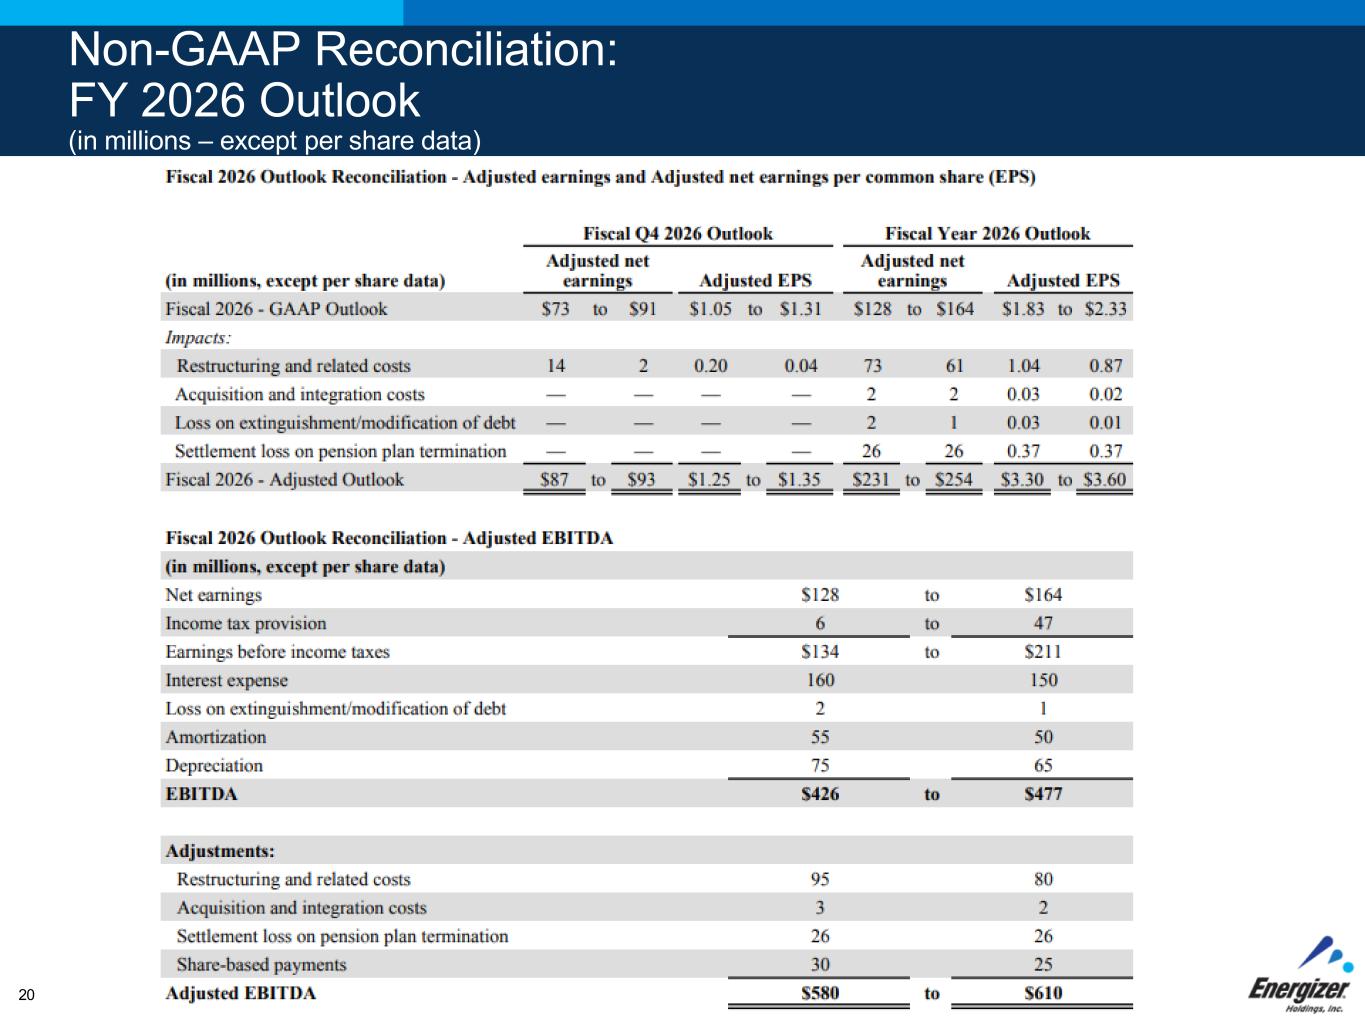
Non-GAAP Reconciliation: FY 2026 Outlook (in millions – except per share data) 20