Shareholder Report
May 31, 2026
USD ($)
$ / shares
This report describes changes to the Fund that occurred during the reporting period.
WHAT WERE THE FUND COSTS FOR THE PAST YEAR? (based on a hypothetical $10,000 investment)
|
Class Name
|
Costs of a $10,000 investment
|
Costs paid as a percentage of a $10,000 investment
|
|
Advisor Class
|
$111
|
0.95%
|
HOW DID THE FUND PERFORM LAST YEAR AND WHAT AFFECTED ITS PERFORMANCE?
The Reinhart Genesis PMV Fund – Advisor Class generated a return of +33.93% for the twelve-month period ended May 31, 2026, outperforming the Russell 3000 Index return of +29.45% over the same period. One of the more notable developments in the prior year was the continued broadening of the market. After a long period in which market leadership was unusually narrow and concentrated in a small number of very large companies, small caps and value-oriented stocks participated more meaningfully. This is a welcome change. Indeed, given our focus on smaller-capitalization companies and Private Market Value valuation discipline, we would highlight these two stylistic tailwinds during the period: 1) most notably smaller-capitalization companies outperformed larger-capitalization companies by over 1420 bps during the period (Russell 2000 Index +43.08% vs. Russell 1000 Index +28.85%) and 2) to a lesser degree Value outperformed Growth by 10 bps (Russell 3000 Value Index +29.21% vs. Russell 3000 Growth Index +29.11%). Within the portfolio, positive selection effect more than offset negative allocation effect. At the sector level, Information Technology and Consumer Staples were the largest relative contributors while Financials was the only notable detractor during the period. Indeed, several holdings have been meaningful beneficiaries of the broader enthusiasm around Artificial Intelligence (AI) infrastructure, semiconductor capital spending, and the recovery in selected technology end markets. Finally, given continued market volatility with macro uncertainty and AI disruption, portfolio activity remained elevated with nine new purchases and seven complete sales during the trailing fiscal year.
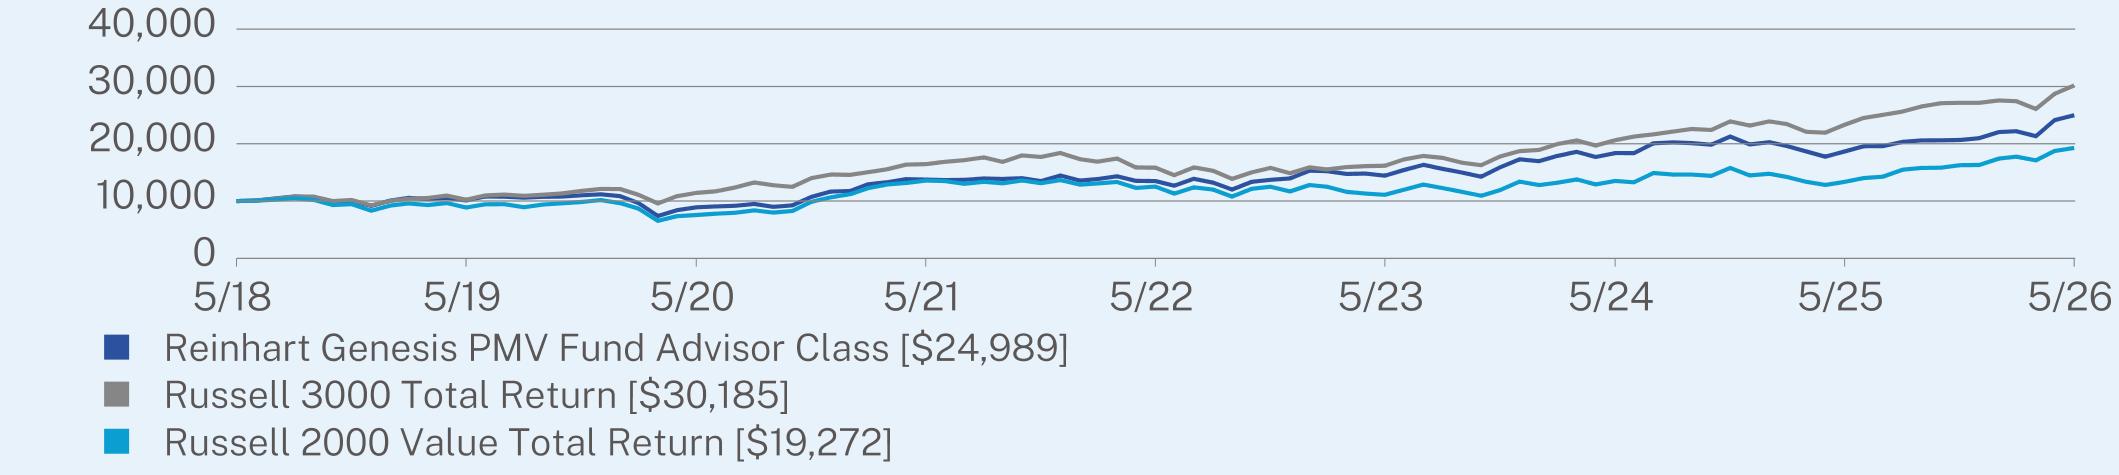
ANNUAL AVERAGE TOTAL RETURN (%)
|
|
1 Year
|
5 Year
|
Since Inception
(05/31/2018) |
|
Advisor Class (without sales charge)
|
33.93
|
12.70
|
12.13
|
|
Russell 3000 Total Return
|
29.45
|
12.92
|
14.81
|
|
Russell 2000 Value Total Return
|
44.36
|
7.27
|
8.55
|
Visit https://www.reinhartfunds.com for more recent performance information.
KEY FUND STATISTICS (as of May 31, 2026)
|
Net Assets
|
$713,804,642
|
|
Number of Holdings
|
37
|
|
Net Advisory Fee
|
$4,182,407
|
|
Portfolio Turnover
|
47%
|
WHAT DID THE FUND INVEST IN? (as of May 31, 2026)
|
Industry*
|
(%)**
|
|
Industrials
|
26.2%
|
|
Financials
|
22.7%
|
|
Information Technology
|
18.2%
|
|
Consumer Discretionary
|
13.6%
|
|
Health Care
|
8.3%
|
|
Real Estate
|
3.4%
|
|
Communication Services
|
2.0%
|
|
Energy
|
1.6%
|
|
Cash & Other
|
4.0%
|
|
Top 10 Issuers
|
(%)**
|
|
Silicon Motion Technology
|
6.7%
|
|
Paycom Software, Inc.
|
4.3%
|
|
First Citizens BancShares
|
4.2%
|
|
YETI Holdings, Inc.
|
4.1%
|
|
Axcelis Technologies, Inc.
|
4.0%
|
|
Modine Manufacturing
|
3.8%
|
|
Lantheus Holdings
|
3.6%
|
|
Landstar System, Inc.
|
3.3%
|
|
Skyward Specialty Insurance Group, Inc.
|
3.2%
|
|
Euronet Worldwide
|
3.2%
|
This report describes changes to the Fund that occurred during the reporting period.
WHAT WERE THE FUND COSTS FOR THE PAST YEAR? (based on a hypothetical $10,000 investment)
|
Class Name
|
Costs of a $10,000 investment
|
Costs paid as a percentage of a $10,000 investment
|
|
Investor Class
|
$140
|
1.20%
|
HOW DID THE FUND PERFORM LAST YEAR AND WHAT AFFECTED ITS PERFORMANCE?
The Reinhart Genesis PMV Fund – Investor Class generated a return of +33.67% for the twelve-month period ended May 31, 2026, outperforming the Russell 3000 Index return of +29.45% over the same period. One of the more notable developments in the prior year was the continued broadening of the market. After a long period in which market leadership was unusually narrow and concentrated in a small number of very large companies, small caps and value-oriented stocks participated more meaningfully. This is a welcome change. Indeed, given our focus on smaller-capitalization companies and Private Market Value valuation discipline, we would highlight these two stylistic tailwinds during the period: 1) most notably smaller-capitalization companies outperformed larger-capitalization companies by over 1420 bps during the period (Russell 2000 Index +43.08% vs. Russell 1000 Index +28.85%) and 2) to a lesser degree Value outperformed Growth by 10 bps (Russell 3000 Value Index +29.21% vs. Russell 3000 Growth Index +29.11%). Within the portfolio, positive selection effect more than offset negative allocation effect. At the sector level, Information Technology and Consumer Staples were the largest relative contributors while Financials was the only notable detractor during the period. Indeed, several holdings have been meaningful beneficiaries of the broader enthusiasm around Artificial Intelligence (AI) infrastructure, semiconductor capital spending, and the recovery in selected technology end markets. Finally, given continued market volatility with macro uncertainty and AI disruption, portfolio activity remained elevated with nine new purchases and seven complete sales during the trailing fiscal year.
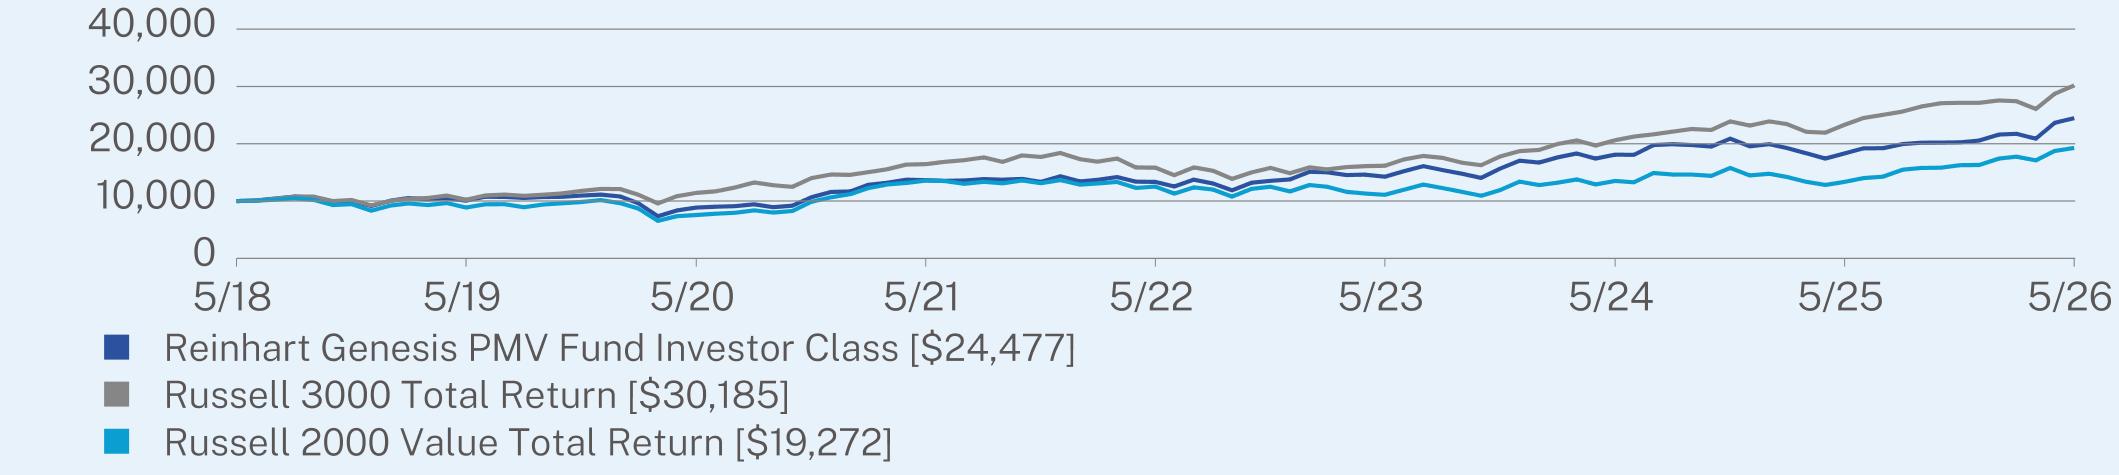
ANNUAL AVERAGE TOTAL RETURN (%)
|
|
1 Year
|
5 Year
|
Since Inception
(05/31/2018) |
|
Investor Class (without sales charge)
|
33.67
|
12.42
|
11.84
|
|
Russell 3000 Total Return
|
29.45
|
12.92
|
14.81
|
|
Russell 2000 Value Total Return
|
44.36
|
7.27
|
8.55
|
Visit https://www.reinhartfunds.com for more recent performance information.
KEY FUND STATISTICS (as of May 31, 2026)
|
Net Assets
|
$713,804,642
|
|
Number of Holdings
|
37
|
|
Net Advisory Fee
|
$4,182,407
|
|
Portfolio Turnover
|
47%
|
WHAT DID THE FUND INVEST IN? (as of May 31, 2026)
|
Industry*
|
(%)**
|
|
Industrials
|
26.2%
|
|
Financials
|
22.7%
|
|
Information Technology
|
18.2%
|
|
Consumer Discretionary
|
13.6%
|
|
Health Care
|
8.3%
|
|
Real Estate
|
3.4%
|
|
Communication Services
|
2.0%
|
|
Energy
|
1.6%
|
|
Cash & Other
|
4.0%
|
|
Top 10 Issuers
|
(%)**
|
|
Silicon Motion Technology
|
6.7%
|
|
Paycom Software, Inc.
|
4.3%
|
|
First Citizens BancShares
|
4.2%
|
|
YETI Holdings, Inc.
|
4.1%
|
|
Axcelis Technologies, Inc.
|
4.0%
|
|
Modine Manufacturing
|
3.8%
|
|
Lantheus Holdings
|
3.6%
|
|
Landstar System, Inc.
|
3.3%
|
|
Skyward Specialty Insurance Group, Inc.
|
3.2%
|
|
Euronet Worldwide
|
3.2%
|
This report describes changes to the Fund that occurred during the reporting period.
WHAT WERE THE FUND COSTS FOR THE PAST YEAR? (based on a hypothetical $10,000 investment)
|
Class Name
|
Costs of a $10,000 investment
|
Costs paid as a percentage of a $10,000 investment
|
|
Advisor Class
|
$107
|
0.95%
|
HOW DID THE FUND PERFORM LAST YEAR AND WHAT AFFECTED ITS PERFORMANCE?
The Reinhart International PMV Fund – Advisor Class generated a return of +24.82% for the twelve-month period ended May 31, 2026, lagging the MSCI ACWI ex-US Index return of +32.77% over the same period. We are pleased with solid absolute and relative performance for the period as we have surpassed a three-year track record for the fund, a meaningful achievement. Within the portfolio, selection effect and allocation effect were both negative. At the sector level, Consumer Discretionary, Financials, and Industrials were the largest relative detractors while Information Technology, Health Care, and Communication Services were contributors. Similar to our domestic portfolios, several holdings have been meaningful beneficiaries of the broader enthusiasm around Artificial Intelligence (AI) infrastructure, semiconductor capital spending, and the recovery in selected technology end markets, including Silicon Motion Technology and Taiwan Semiconductor. However, this was more than offset by negative callouts including B&M European Value Retail, Euronet Worldwide, Jeronimo Martins and ConvaTec Group.
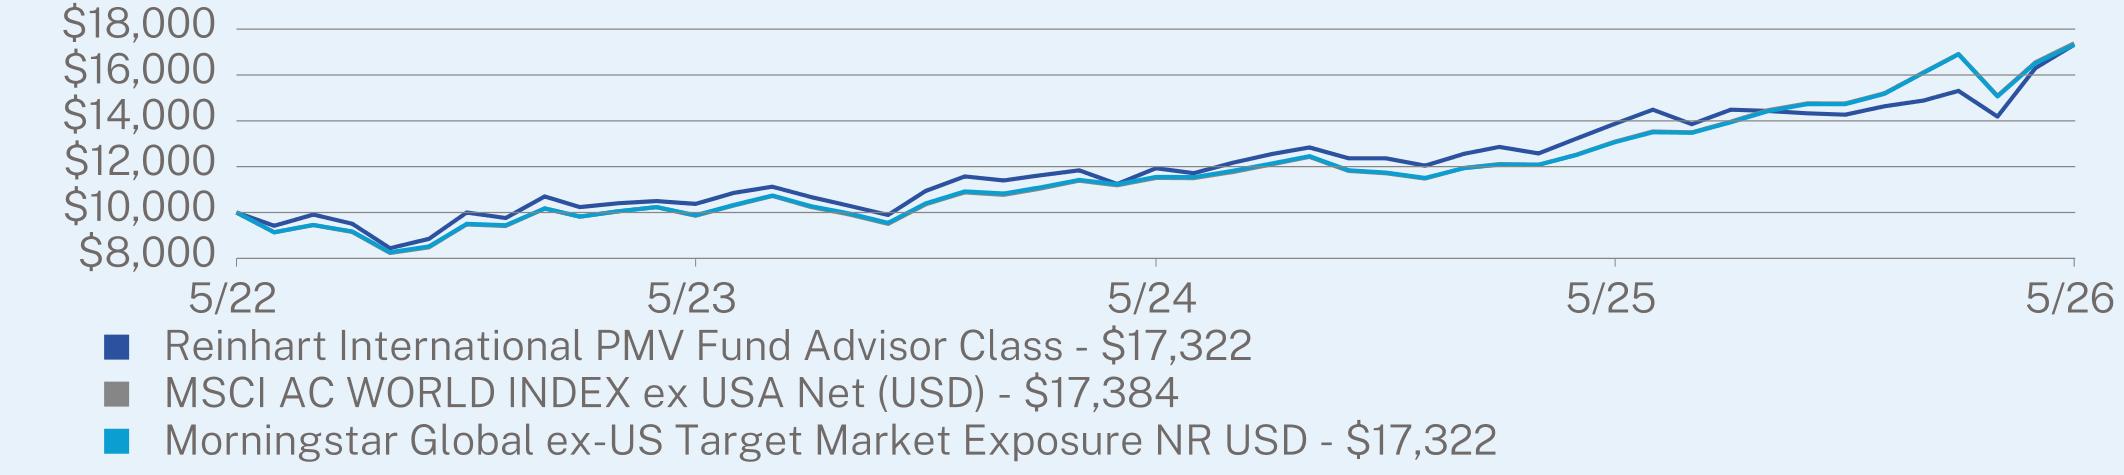
ANNUAL AVERAGE TOTAL RETURN (%)
|
|
1 Year
|
Since Inception
(05/31/2022) |
|
Advisor Class (without sales charge)
|
24.82
|
14.72
|
|
MSCI AC WORLD INDEX ex USA Net (USD)
|
32.77
|
14.82
|
|
Morningstar Global ex-US Target Market Exposure NR USD
|
32.51
|
14.72
|
Visit https://www.reinhartfunds.com for more recent performance information.
KEY FUND STATISTICS (as of May 31, 2026)
|
Net Assets
|
$2,279,856
|
|
Number of Holdings
|
29
|
|
Net Advisory Fee
|
$0
|
|
Portfolio Turnover
|
32%
|
WHAT DID THE FUND INVEST IN? (as of May 31, 2026)
|
Industry*
|
(%)**
|
|
Information Technology
|
19.7%
|
|
Consumer Discretionary
|
18.2%
|
|
Financials
|
17.5%
|
|
Industrials
|
13.5%
|
|
Health Care
|
10.0%
|
|
Communication Services
|
9.6%
|
|
Consumer Staples
|
8.9%
|
|
Cash & Other
|
2.6%
|
|
Top 10 Issuers
|
(%)**
|
|
Silicon Motion Technology
|
9.7%
|
|
ICON PLC
|
4.8%
|
|
Mercari
|
4.7%
|
|
Jeronimo Martins SGPS SA
|
4.6%
|
|
Taiwan Semiconductor Manufacturing
|
4.6%
|
|
Edenred
|
4.3%
|
|
Arca Continental SAB de CV
|
4.3%
|
|
JD Logistics
|
4.0%
|
|
Accor SA
|
3.8%
|
|
Horiba Ltd.
|
3.6%
|
|
Top 10 Countries
|
(%)**
|
|
Taiwan
|
14.3%
|
|
Japan
|
12.4%
|
|
France
|
10.7%
|
|
United Kingdom
|
10.7%
|
|
Ireland
|
7.5%
|
|
China
|
6.7%
|
|
Mexico
|
6.4%
|
|
United States
|
5.0%
|
|
Portugal
|
4.6%
|
|
Canada
|
4.5%
|
This report describes changes to the Fund that occurred during the reporting period.
WHAT WERE THE FUND COSTS FOR THE PAST YEAR? (based on a hypothetical $10,000 investment)
|
Class Name
|
Costs of a $10,000 investment
|
Costs paid as a percentage of a $10,000 investment
|
|
Advisor Class
|
$108
|
1.05%
|
HOW DID THE FUND PERFORM LAST YEAR AND WHAT AFFECTED ITS PERFORMANCE?
The Reinhart Mid Cap PMV Fund – Advisor Class generated a return of +5.94% for the twelve-month period ended May 31, 2026, underperforming the Russell 3000 Index return of +29.45% over the same period. Much of what drove the period’s underperformance is not enough portfolio exposure to direct Artificial Intelligence (AI) beneficiaries on those binary trading days when it seems that thematic trade is all that matters. Indeed, the Technology sector within the Russell 3000 Index increased an eye-popping 55.52% during the trailing-twelve-months. Hindsight is 20/20 and being underweight AI-exposed stocks has been a mistake and a massive performance headwind. Our reluctance has not been because we do not “believe in AI.” We are daily users of the technology within our research process here and continue aggressively exploring how to harness it more effectively. The barrier was more our rigid adherence to a bottom-up fundamental philosophy that eschews top-down sector focus on thematic trading. We underestimated the degree to which the narrative of AI winners and losers would become the most important factor in the market, and we should have been quicker to adjust our process to incorporate the transformative nature of this new technology in our portfolio positioning, without relinquishing our focus on competitive advantage and free cash flow generation. Within the portfolio, allocation and selection were negative. At the sector level, Industrials, Information Technology, and Financials were the largest relative detractors while Consumer Staples, Consumer Discretionary, and Energy were modest contributors. Regarding stock selection, several detractors – including Paycom, Insperity, Transunion, SS&C Technologies, Cognizant, LPL Financial, FIS and Intercontinental Exchange – are all viewed to be on the wrong side of AI.
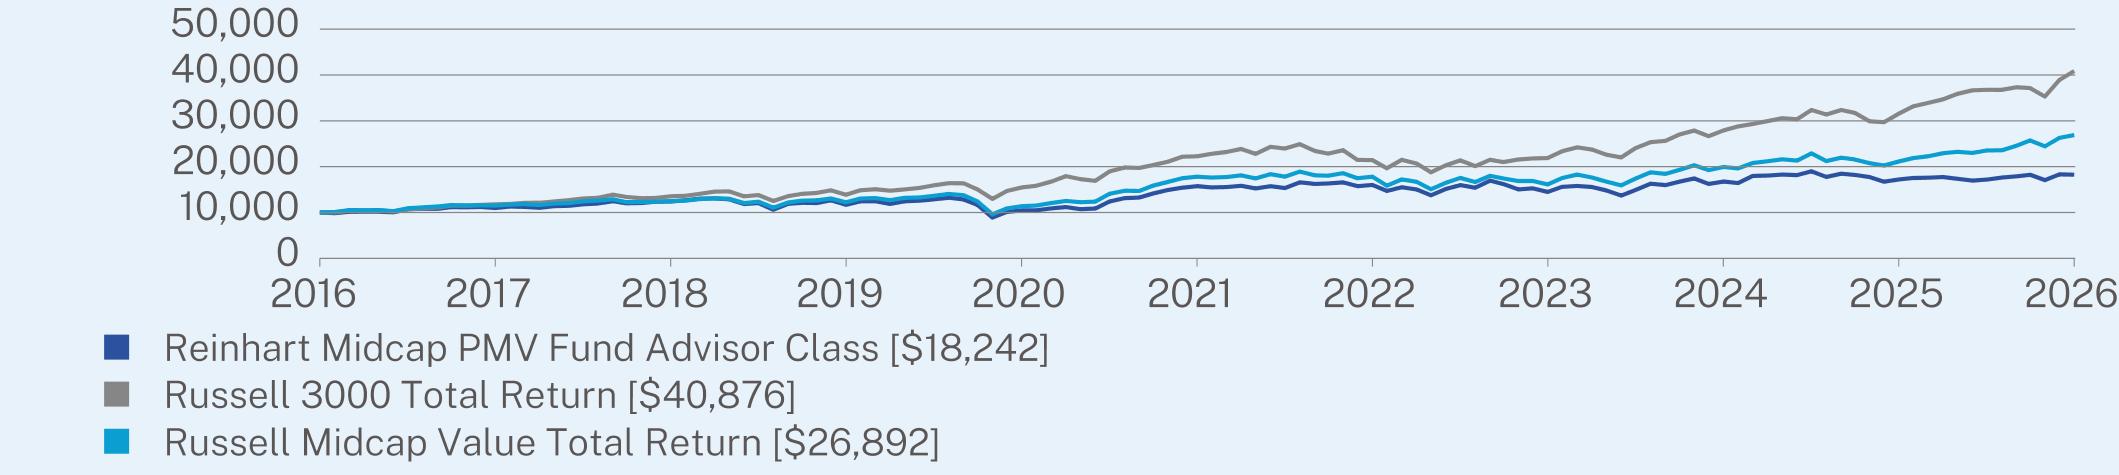
ANNUAL AVERAGE TOTAL RETURN (%)
|
|
1 Year
|
5 Year
|
10 Year
|
|
Advisor Class (without sales charge)
|
5.94
|
2.98
|
6.20
|
|
Russell 3000 Total Return
|
29.45
|
12.92
|
15.12
|
|
Russell Midcap Value Total Return
|
27.21
|
8.57
|
10.40
|
Visit https://reinhartfunds.com for more recent performance information.
KEY FUND STATISTICS (as of May 31, 2026)
|
Net Assets
|
$88,021,966
|
|
Number of Holdings
|
42
|
|
Net Advisory Fee
|
$666,898
|
|
Portfolio Turnover
|
21%
|
WHAT DID THE FUND INVEST IN? (as of May 31, 2026)
|
Industry*
|
(%)**
|
|
Industrials
|
29.0%
|
|
Financials
|
22.3%
|
|
Consumer Staples
|
9.5%
|
|
Real Estate
|
7.9%
|
|
Information Technology
|
7.5%
|
|
Consumer Discretionary
|
6.9%
|
|
Health Care
|
5.8%
|
|
Utilities
|
2.7%
|
|
Materials
|
2.2%
|
|
Cash & Other
|
6.2%
|
|
Top 10 Issuers
|
(%)**
|
|
Paycom Software, Inc.
|
4.1%
|
|
Sensata Technologies Holding
|
3.6%
|
|
Affiliated Managers Group
|
3.3%
|
|
Microchip Technology, Inc.
|
3.3%
|
|
Lantheus Holdings
|
3.1%
|
|
Coca-Cola Consolidated, Inc.
|
3.1%
|
|
TransUnion
|
3.0%
|
|
Camden Property Trust - REIT
|
2.9%
|
|
Keysight Technologies, Inc.
|
2.9%
|
|
Tapestry, Inc.
|
2.8%
|
This report describes changes to the Fund that occurred during the reporting period.
WHAT WERE THE FUND COSTS FOR THE PAST YEAR? (based on a hypothetical $10,000 investment)
|
Class Name
|
Costs of a $10,000 investment
|
Costs paid as a percentage of a $10,000 investment
|
|
Institutional Class
|
$93
|
0.90%
|
HOW DID THE FUND PERFORM LAST YEAR AND WHAT AFFECTED ITS PERFORMANCE?
The Reinhart Mid Cap PMV Fund – Institutional Class generated a return of +6.12% for the twelve-month period ended May 31, 2026, underperforming the Russell 3000 Index return of +29.45% over the same period. Much of what drove the period’s underperformance is not enough portfolio exposure to direct Artificial Intelligence (AI) beneficiaries on those binary trading days when it seems that thematic trade is all that matters. Indeed, the Technology sector within the Russell 3000 Index increased an eye-popping 55.52% during the trailing-twelve-months. Hindsight is 20/20 and being underweight AI-exposed stocks has been a mistake and a massive performance headwind. Our reluctance has not been because we do not “believe in AI.” We are daily users of the technology within our research process here and continue aggressively exploring how to harness it more effectively. The barrier was more our rigid adherence to a bottom-up fundamental philosophy that eschews top-down sector focus on thematic trading. We underestimated the degree to which the narrative of AI winners and losers would become the most important factor in the market, and we should have been quicker to adjust our process to incorporate the transformative nature of this new technology in our portfolio positioning, without relinquishing our focus on competitive advantage and free cash flow generation. Within the portfolio, allocation and selection were negative. At the sector level, Industrials, Information Technology, and Financials were the largest relative detractors while Consumer Staples, Consumer Discretionary, and Energy were modest contributors. Regarding stock selection, several detractors – including Paycom, Insperity, Transunion, SS&C Technologies, Cognizant, LPL Financial, FIS and Intercontinental Exchange – are all viewed to be on the wrong side of AI.
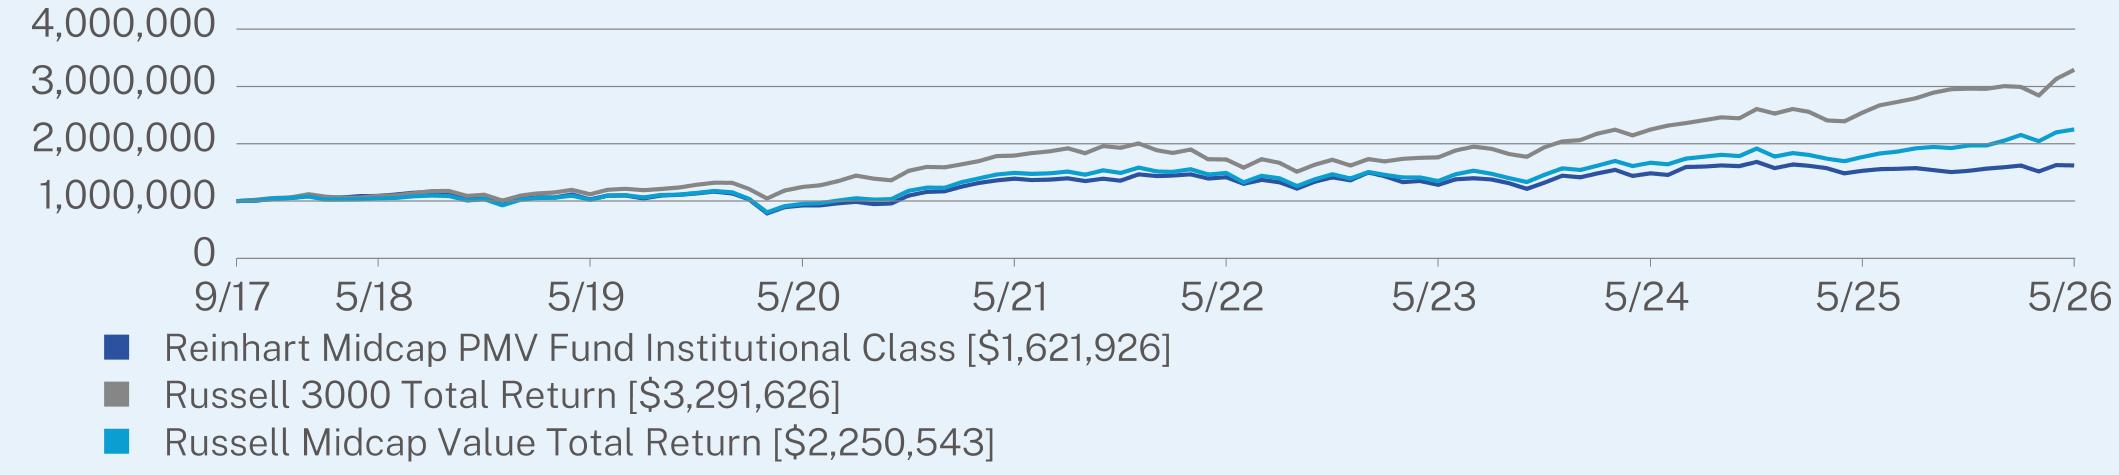
ANNUAL AVERAGE TOTAL RETURN (%)
|
|
1 Year
|
5 Year
|
Since Inception
(09/29/2017) |
|
Institutional Class (without sales charge)
|
6.12
|
3.12
|
5.74
|
|
Russell 3000 Total Return
|
29.45
|
12.92
|
14.73
|
|
Russell Midcap Value Total Return
|
27.21
|
8.57
|
9.81
|
Visit https://reinhartfunds.com for more recent performance information.
KEY FUND STATISTICS (as of May 31, 2026)
|
Net Assets
|
$88,021,966
|
|
Number of Holdings
|
42
|
|
Net Advisory Fee
|
$666,898
|
|
Portfolio Turnover
|
21%
|
WHAT DID THE FUND INVEST IN? (as of May 31, 2026)
|
Industry*
|
(%)**
|
|
Industrials
|
29.0%
|
|
Financials
|
22.3%
|
|
Consumer Staples
|
9.5%
|
|
Real Estate
|
7.9%
|
|
Information Technology
|
7.5%
|
|
Consumer Discretionary
|
6.9%
|
|
Health Care
|
5.8%
|
|
Utilities
|
2.7%
|
|
Materials
|
2.2%
|
|
Cash & Other
|
6.2%
|
|
Top 10 Issuers
|
(%)**
|
|
Paycom Software, Inc.
|
4.1%
|
|
Sensata Technologies Holding
|
3.6%
|
|
Affiliated Managers Group
|
3.3%
|
|
Microchip Technology, Inc.
|
3.3%
|
|
Lantheus Holdings
|
3.1%
|
|
Coca-Cola Consolidated, Inc.
|
3.1%
|
|
TransUnion
|
3.0%
|
|
Camden Property Trust - REIT
|
2.9%
|
|
Keysight Technologies, Inc.
|
2.9%
|
|
Tapestry, Inc.
|
2.8%
|
This report describes changes to the Fund that occurred during the reporting period.
WHAT WERE THE FUND COSTS FOR THE PAST YEAR? (based on a hypothetical $10,000 investment)
|
Class Name
|
Costs of a $10,000 investment
|
Costs paid as a percentage of a $10,000 investment
|
|
Investor Class
|
$134
|
1.30%
|
HOW DID THE FUND PERFORM LAST YEAR AND WHAT AFFECTED ITS PERFORMANCE?
The Reinhart Mid Cap PMV Fund – Investor Class generated a return of +5.69% for the twelve-month period ended May 31, 2026, underperforming the Russell 3000 Index return of +29.45% over the same period. Much of what drove the period’s underperformance is not enough portfolio exposure to direct Artificial Intelligence (AI) beneficiaries on those binary trading days when it seems that thematic trade is all that matters. Indeed, the Technology sector within the Russell 3000 Index increased an eye-popping 55.52% during the trailing-twelve-months. Hindsight is 20/20 and being underweight AI-exposed stocks has been a mistake and a massive performance headwind. Our reluctance has not been because we do not “believe in AI.” We are daily users of the technology within our research process here and continue aggressively exploring how to harness it more effectively. The barrier was more our rigid adherence to a bottom-up fundamental philosophy that eschews top-down sector focus on thematic trading. We underestimated the degree to which the narrative of AI winners and losers would become the most important factor in the market, and we should have been quicker to adjust our process to incorporate the transformative nature of this new technology in our portfolio positioning, without relinquishing our focus on competitive advantage and free cash flow generation. Within the portfolio, allocation and selection were negative. At the sector level, Industrials, Information Technology, and Financials were the largest relative detractors while Consumer Staples, Consumer Discretionary, and Energy were modest contributors. Regarding stock selection, several detractors – including Paycom, Insperity, Transunion, SS&C Technologies, Cognizant, LPL Financial, FIS and Intercontinental Exchange – are all viewed to be on the wrong side of AI.
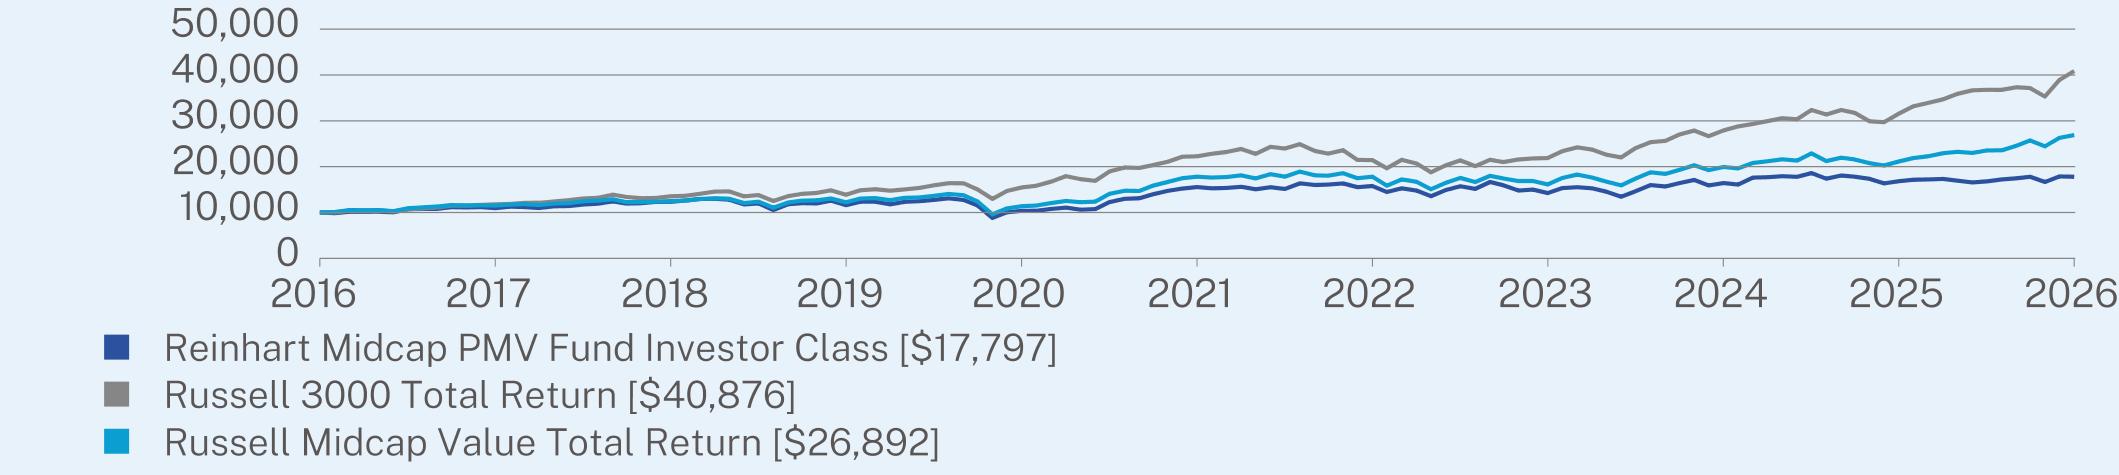
ANNUAL AVERAGE TOTAL RETURN (%)
|
|
1 Year
|
5 Year
|
10 Year
|
|
Investor Class (without sales charge)
|
5.69
|
2.72
|
5.93
|
|
Russell 3000 Total Return
|
29.45
|
12.92
|
15.12
|
|
Russell Midcap Value Total Return
|
27.21
|
8.57
|
10.40
|
Visit https://reinhartfunds.com for more recent performance information.
KEY FUND STATISTICS (as of May 31, 2026)
|
Net Assets
|
$88,021,966
|
|
Number of Holdings
|
42
|
|
Net Advisory Fee
|
$666,898
|
|
Portfolio Turnover
|
21%
|
WHAT DID THE FUND INVEST IN? (as of May 31, 2026)
|
Industry*
|
(%)**
|
|
Industrials
|
29.0%
|
|
Financials
|
22.3%
|
|
Consumer Staples
|
9.5%
|
|
Real Estate
|
7.9%
|
|
Information Technology
|
7.5%
|
|
Consumer Discretionary
|
6.9%
|
|
Health Care
|
5.8%
|
|
Utilities
|
2.7%
|
|
Materials
|
2.2%
|
|
Cash & Other
|
6.2%
|
|
Top 10 Issuers
|
(%)**
|
|
Paycom Software, Inc.
|
4.1%
|
|
Sensata Technologies Holding
|
3.6%
|
|
Affiliated Managers Group
|
3.3%
|
|
Microchip Technology, Inc.
|
3.3%
|
|
Lantheus Holdings
|
3.1%
|
|
Coca-Cola Consolidated, Inc.
|
3.1%
|
|
TransUnion
|
3.0%
|
|
Camden Property Trust - REIT
|
2.9%
|
|
Keysight Technologies, Inc.
|
2.9%
|
|
Tapestry, Inc.
|
2.8%
|
| [1] |
|
||
| [2] |
|
||
| [3] |
|
||
| [4] |
|
||
| [5] |
|
||
| [6] |
|
||
| [7] |
|
||
| [8] |
|
||
| [9] |
|
||
| [10] |
|
||
| [11] |
|
||
| [12] |
|