
1 EARNINGS PRESENTATION 2Q 2026 August 4, 2026
2 This presentation may contain forward-looking statements within the meaning of the federal securities laws, including statements relating to (i) our strategy, outlook and growth prospects, (ii) our operational and financial targets and (iii) general economic trends and trends in our industry and markets. Forward-looking statements relate to expectations, beliefs, projections, future plans and strategies, anticipated events or trends and similar expressions concerning matters that are not historical facts. In some cases, you can identify forward-looking statements by the use of forward-looking terminology such as “may,” “will,” “should,” “expects,” “intends,” “plans,” “anticipates,” “believes,” “estimates,” “predicts,” or “potential” or the negative of these words and phrases or similar words or phrases which are predictions of or indicate future events or trends and which do not relate solely to historical matters. You can also identify forward-looking statements by discussions of strategy, plans or intentions. Forward-looking statements involve known and unknown risks, uncertainties, assumptions and contingencies, many of which are beyond the control of DigitalBridge Group, Inc. (the “Company”) and may cause the Company’s actual results to differ significantly from those expressed in any forward-looking statement. Factors that might cause such a difference include, without limitation, uncertainties as to the timing of the merger contemplated by the Agreement and Plan of Merger (the “Merger Agreement”) by and among the Company, DigitalBridge Operating Company, LLC (the “Operating Company”), and indirect subsidiaries of SoftBank Group Corp. (TSE: 9984, “SoftBank”) (the “Merger”); the risk that the Merger may not be completed on the anticipated terms in a timely manner or at all; the failure to satisfy any of the conditions to the consummation of the Merger; the effect of the announcement or pendency of the transactions contemplated by the Merger Agreement on the Company’s ability to retain and hire key personnel, its ability to maintain relationships with its customers, suppliers and others with whom it does business, or its operating results and business generally; risks related to diverting management’s attention from the Company’s ongoing business operations as a result of the Merger; certain restrictions during the pendency of the Merger that may impact the Company’s ability to pursue certain business opportunities or strategic transactions; risks that the benefits of the Merger are not realized when and as expected; difficult market and political conditions, including those resulting from inflation, high interest rates, trade barriers, a general economic slowdown or a recession; our ability to raise capital from investors for our Company, our funds and the companies that we manage; the performance of our funds and investments relative to our expectations and the highly variable nature of our revenues, earnings and cash flow; our exposure to risks inherent in the ownership and operation of infrastructure and digital infrastructure assets, including our reliance on third-party suppliers to provide power, network connectivity and certain other services to our managed companies; our exposure to business risks in Europe, Asia, Latin America and other foreign markets; our ability to increase assets under management and expand our existing and new investment strategies while maintaining consistent standards and controls; our ability to appropriately manage conflicts of interest; our ability to expand into new investment strategies, geographic markets and businesses, including through acquisitions in the infrastructure and investment management industries; the impact of climate change and regulatory or societal efforts associated with environmental, social and governance matters; our ability to maintain effective information and cybersecurity policies, procedures and capabilities and the impact of any cybersecurity incident affecting our systems or network or the system and network of any of our managed companies or service providers; uncertainty around, and disruption from, new and emerging technologies, including the adoption and utilization of artificial intelligence; the ability of our portfolio companies to attract and retain key customers and to provide reliable services without disruption; any litigation and contractual claims against us and our affiliates, including potential settlement and litigation of such claims; our ability to obtain and maintain financing arrangements, including securitizations, on favorable or comparable terms or at all; the general volatility of the securities markets in which we participate; the market value of our assets and effects of hedging instruments on our assets; the impact of legislative, regulatory and competitive changes, including those related to privacy and data protection and new Securities and Exchange Commission (“SEC”) rules governing investment advisers; whether we will be able to utilize existing tax attributes to offset taxable income to the extent contemplated; our ability to maintain our exemption from registration as an investment company under the Investment Company Act of 1940, as amended; changes in our board of directors or management team, and availability of qualified personnel; our ability to make or maintain distributions to our stockholders; our understanding of and ability to successfully navigate the competitive landscape in which we and our managed companies operate; and other risks and uncertainties, including those detailed in the Company’s Annual Report on Form 10-K for the fiscal year ended December 31, 2025 under the heading “Risk Factors,” as such factors may be updated from time to time in the Company’s subsequent periodic filings with the SEC. All forward-looking statements reflect the Company’s good faith beliefs, assumptions and expectations, but they are not guarantees of future performance. Additional information about these and other factors can be found in the Company’s reports filed from time to time with the SEC. The Company cautions investors not to unduly rely on any forward-looking statements. The forward-looking statements speak only as of the date of this presentation. The Company is under no duty to update any of these forward-looking statements after the date of this presentation, nor to conform prior statements to actual results or revised expectations, and the Company does not intend to do so. This presentation is for informational purposes only and does not constitute an offer to sell or a solicitation of an offer to buy any securities of the Company or any investment vehicle managed or advised thereby. This information is not intended to be indicative of future results. Actual performance of the Company may vary materially. The appendices herein contain important information that is material to an understanding of this presentation, including information regarding certain non-GAAP financial measures, and you should read this presentation only with and in context of the appendices. CAUTIONARY STATEMENT REGARDING FORWARD-LOOKING STATEMENTS
3 DBRG REPORTS SECOND QUARTER 2026 RESULTS Boca Raton, August 4th, 2026 - DigitalBridge Group, Inc. (NYSE: DBRG) and subsidiaries (collectively, "DigitalBridge," or the "Company") today announced financial results for the second quarter ended June 30, 2026. The Company reported second quarter 2026 GAAP net income attributable to common stockholders of $212.7 million, or $1.15 per share, and Distributable Earnings of $17.8 million, or $0.09 per share. In light of the proposed transaction with SoftBank Group Corp., and as is customary during the pendency of an acquisition, DigitalBridge will not be hosting a conference call or providing detailed financial guidance in conjunction with its second quarter 2026 earnings release. This condensed investor presentation summarizing the quarter's results is available on the Shareholders section of the Company's website at ir.digitalbridge.com. Common and Preferred Dividends On August 3, 2026, the Company's Board of Directors declared a cash dividend of $0.01 per common share to be paid on October 15, 2026 to shareholders of record at the close of business on September 30, 2026; and declared cash dividends with respect to each series of the Company's cumulative redeemable perpetual preferred stock in accordance with the terms of such series, as follows: Series H preferred stock: $0.4453125 per share; Series I preferred stock: $0.446875 per share; and Series J preferred stock: $0.4453125 per share, which will be paid on October 15, 2026 to the respective stockholders of record on October 9, 2026. Proposed Transaction with SoftBank Group Corp. On December 29, 2025, the Company entered into a definitive agreement pursuant to which SoftBank Group Corp. will acquire all outstanding shares of DigitalBridge common stock for $16.00 per share in an all-cash transaction. The transaction has been approved by DBRG’s common stockholders, and remains subject to certain other closing conditions. For further detail and discussion of the Company's financial performance, please refer to DigitalBridge's Annual Report on Form 10-K for the year ended December 31, 2025, filed with the Securities and Exchange Commission, and the Company’s Quarterly Report on Form 10-Q for the quarter ended June 30, 2026.
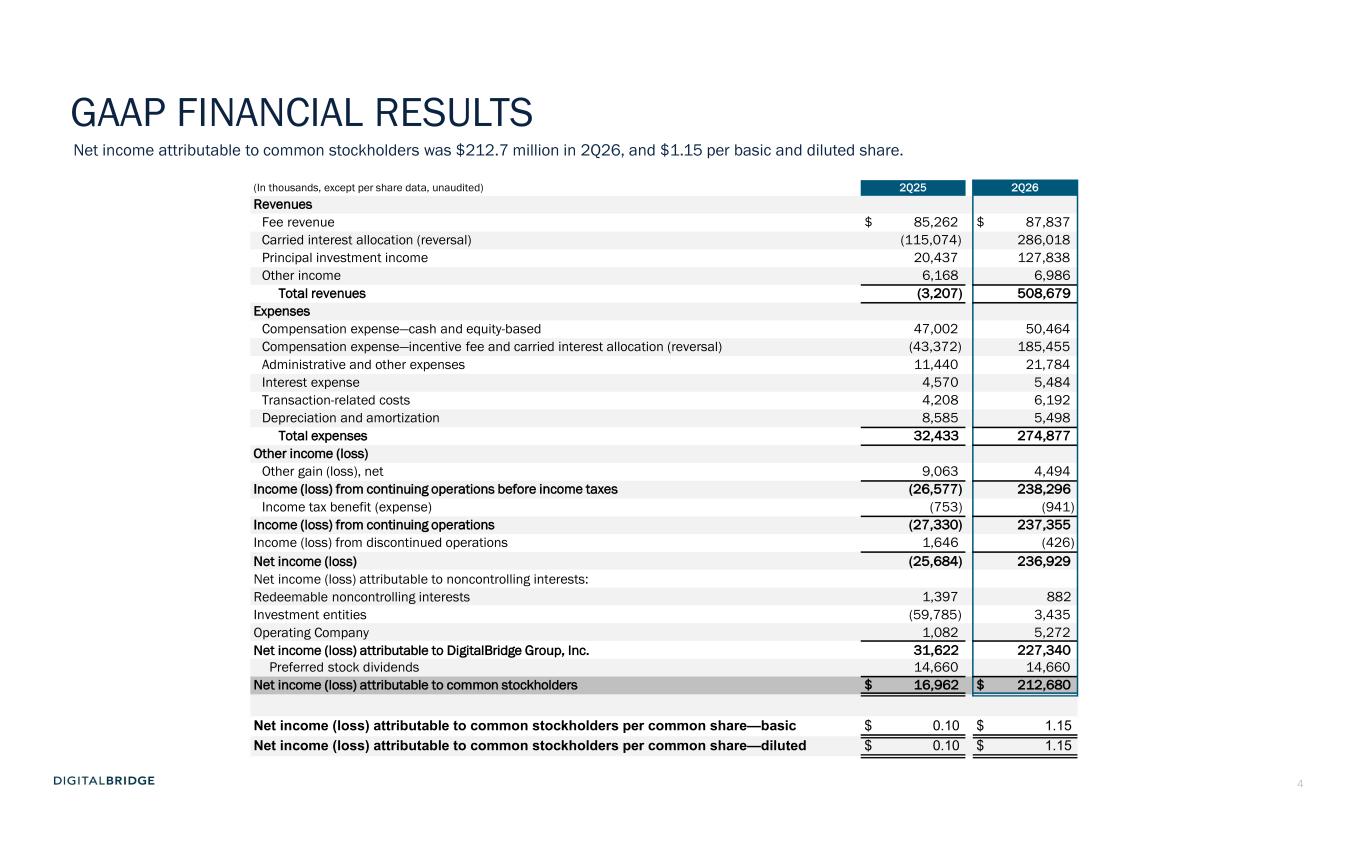
4 (In thousands, except per share data, unaudited) 2Q25 2Q26 Revenues Fee revenue $ 85,262 $ 87,837 Carried interest allocation (reversal) (115,074) 286,018 Principal investment income 20,437 127,838 Other income 6,168 6,986 Total revenues (3,207) 508,679 Expenses Compensation expense—cash and equity-based 47,002 50,464 Compensation expense—incentive fee and carried interest allocation (reversal) (43,372) 185,455 Administrative and other expenses 11,440 21,784 Interest expense 4,570 5,484 Transaction-related costs 4,208 6,192 Depreciation and amortization 8,585 5,498 Total expenses 32,433 274,877 Other income (loss) Other gain (loss), net 9,063 4,494 Income (loss) from continuing operations before income taxes (26,577) 238,296 Income tax benefit (expense) (753) (941) Income (loss) from continuing operations (27,330) 237,355 Income (loss) from discontinued operations 1,646 (426) Net income (loss) (25,684) 236,929 Net income (loss) attributable to noncontrolling interests: Redeemable noncontrolling interests 1,397 882 Investment entities (59,785) 3,435 Operating Company 1,082 5,272 Net income (loss) attributable to DigitalBridge Group, Inc. 31,622 227,340 Preferred stock dividends 14,660 14,660 Net income (loss) attributable to common stockholders $ 16,962 $ 212,680 Net income (loss) attributable to common stockholders per common share—basic $ 0.10 $ 1.15 Net income (loss) attributable to common stockholders per common share—diluted $ 0.10 $ 1.15 GAAP FINANCIAL RESULTS Net income attributable to common stockholders was $212.7 million in 2Q26, and $1.15 per basic and diluted share.
5 FINANCIAL UPDATE
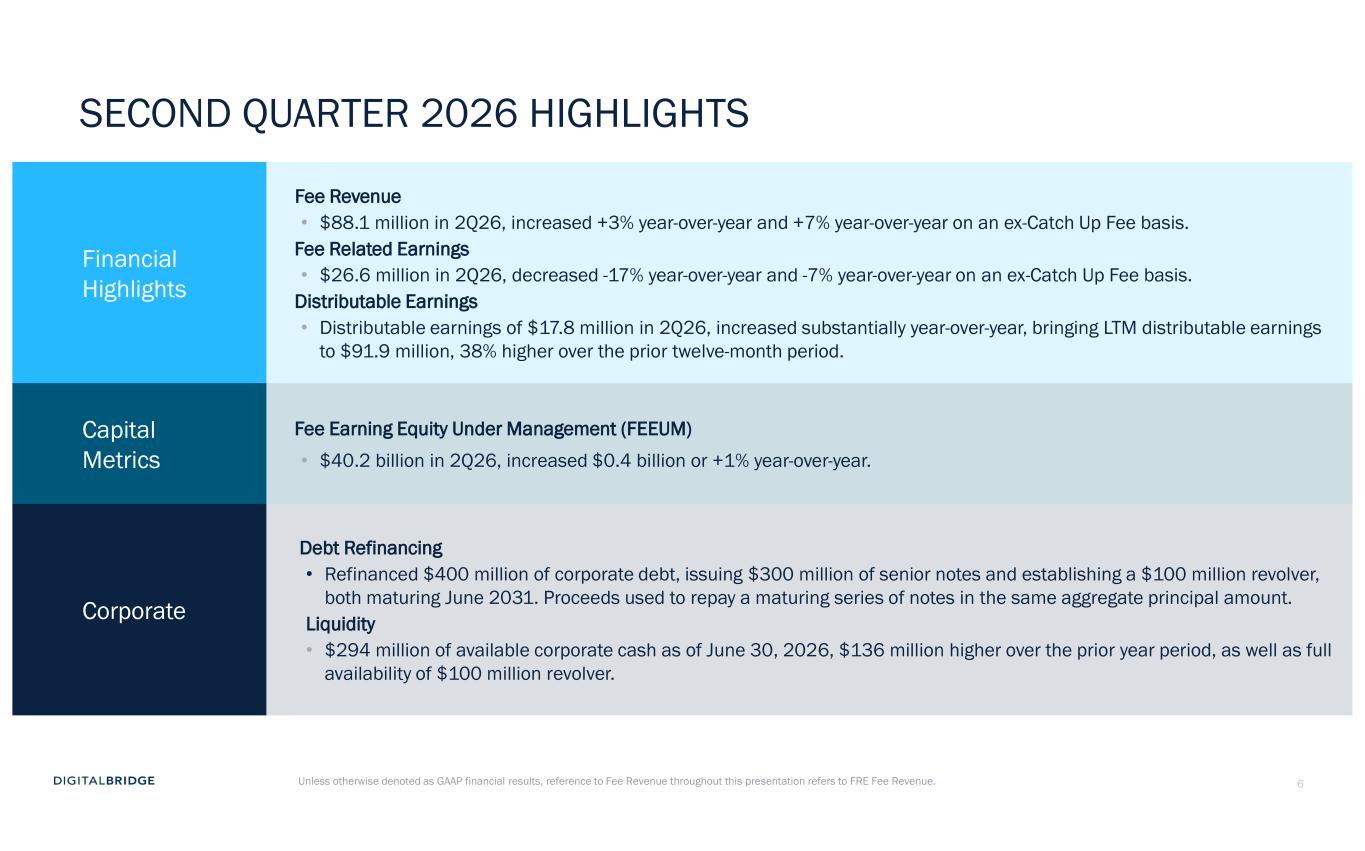
6 SECOND QUARTER 2026 HIGHLIGHTS Financial Highlights Fee Revenue • $88.1 million in 2Q26, increased +3% year-over-year and +7% year-over-year on an ex-Catch Up Fee basis. Fee Related Earnings • $26.6 million in 2Q26, decreased -17% year-over-year and -7% year-over-year on an ex-Catch Up Fee basis. Distributable Earnings • Distributable earnings of $17.8 million in 2Q26, increased substantially year-over-year, bringing LTM distributable earnings to $91.9 million, 38% higher over the prior twelve-month period. Capital Metrics Fee Earning Equity Under Management (FEEUM) • $40.2 billion in 2Q26, increased $0.4 billion or +1% year-over-year. Corporate Debt Refinancing • Refinanced $400 million of corporate debt, issuing $300 million of senior notes and establishing a $100 million revolver, both maturing June 2031. Proceeds used to repay a maturing series of notes in the same aggregate principal amount. Liquidity • $294 million of available corporate cash as of June 30, 2026, $136 million higher over the prior year period, as well as full availability of $100 million revolver. Unless otherwise denoted as GAAP financial results, reference to Fee Revenue throughout this presentation refers to FRE Fee Revenue.
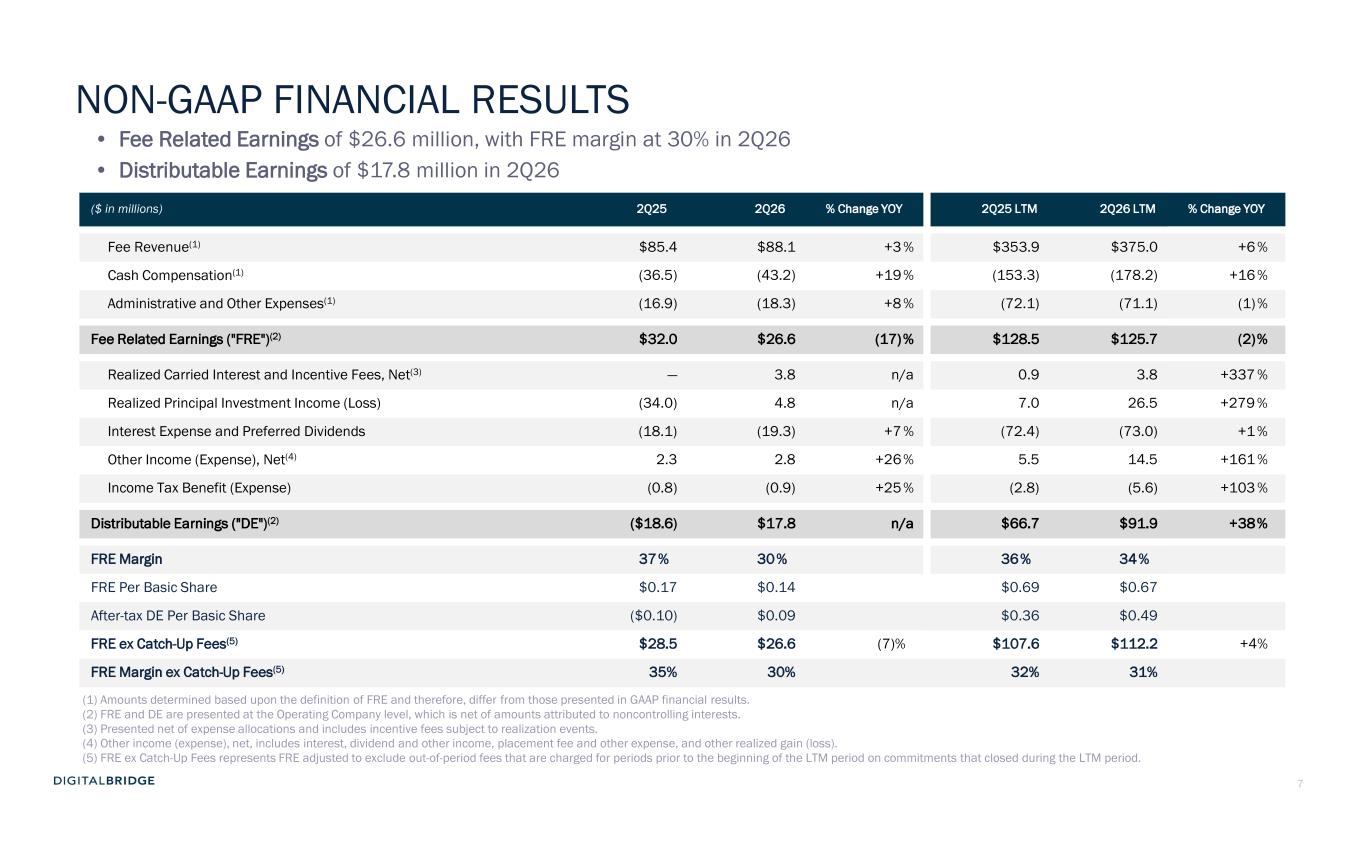
7 NON-GAAP FINANCIAL RESULTS • Fee Related Earnings of $26.6 million, with FRE margin at 30% in 2Q26 • Distributable Earnings of $17.8 million in 2Q26 ($ in millions) 2Q25 2Q26 % Change YOY 2Q25 LTM 2Q26 LTM % Change YOY Fee Revenue(1) $85.4 $88.1 +3 % $353.9 $375.0 +6 % Cash Compensation(1) (36.5) (43.2) +19% (153.3) (178.2) +16 % Administrative and Other Expenses(1) (16.9) (18.3) +8 % (72.1) (71.1) (1)% Fee Related Earnings ("FRE")(2) $32.0 $26.6 (17)% $128.5 $125.7 (2)% Realized Carried Interest and Incentive Fees, Net(3) — 3.8 n/a 0.9 3.8 +337 % Realized Principal Investment Income (Loss) (34.0) 4.8 n/a 7.0 26.5 +279 % Interest Expense and Preferred Dividends (18.1) (19.3) +7 % (72.4) (73.0) +1 % Other Income (Expense), Net(4) 2.3 2.8 +26% 5.5 14.5 +161 % Income Tax Benefit (Expense) (0.8) (0.9) +25% (2.8) (5.6) +103 % Distributable Earnings ("DE")(2) ($18.6) $17.8 n/a $66.7 $91.9 +38% FRE Margin 37% 30% 36% 34% FRE Per Basic Share $0.17 $0.14 $0.69 $0.67 After-tax DE Per Basic Share ($0.10) $0.09 $0.36 $0.49 FRE ex Catch-Up Fees(5) $28.5 $26.6 (7)% $107.6 $112.2 +4% FRE Margin ex Catch-Up Fees(5) 35% 30% 32% 31% (1) Amounts determined based upon the definition of FRE and therefore, differ from those presented in GAAP financial results. (2) FRE and DE are presented at the Operating Company level, which is net of amounts attributed to noncontrolling interests. (3) Presented net of expense allocations and includes incentive fees subject to realization events. (4) Other income (expense), net, includes interest, dividend and other income, placement fee and other expense, and other realized gain (loss). (5) FRE ex Catch-Up Fees represents FRE adjusted to exclude out-of-period fees that are charged for periods prior to the beginning of the LTM period on commitments that closed during the LTM period.
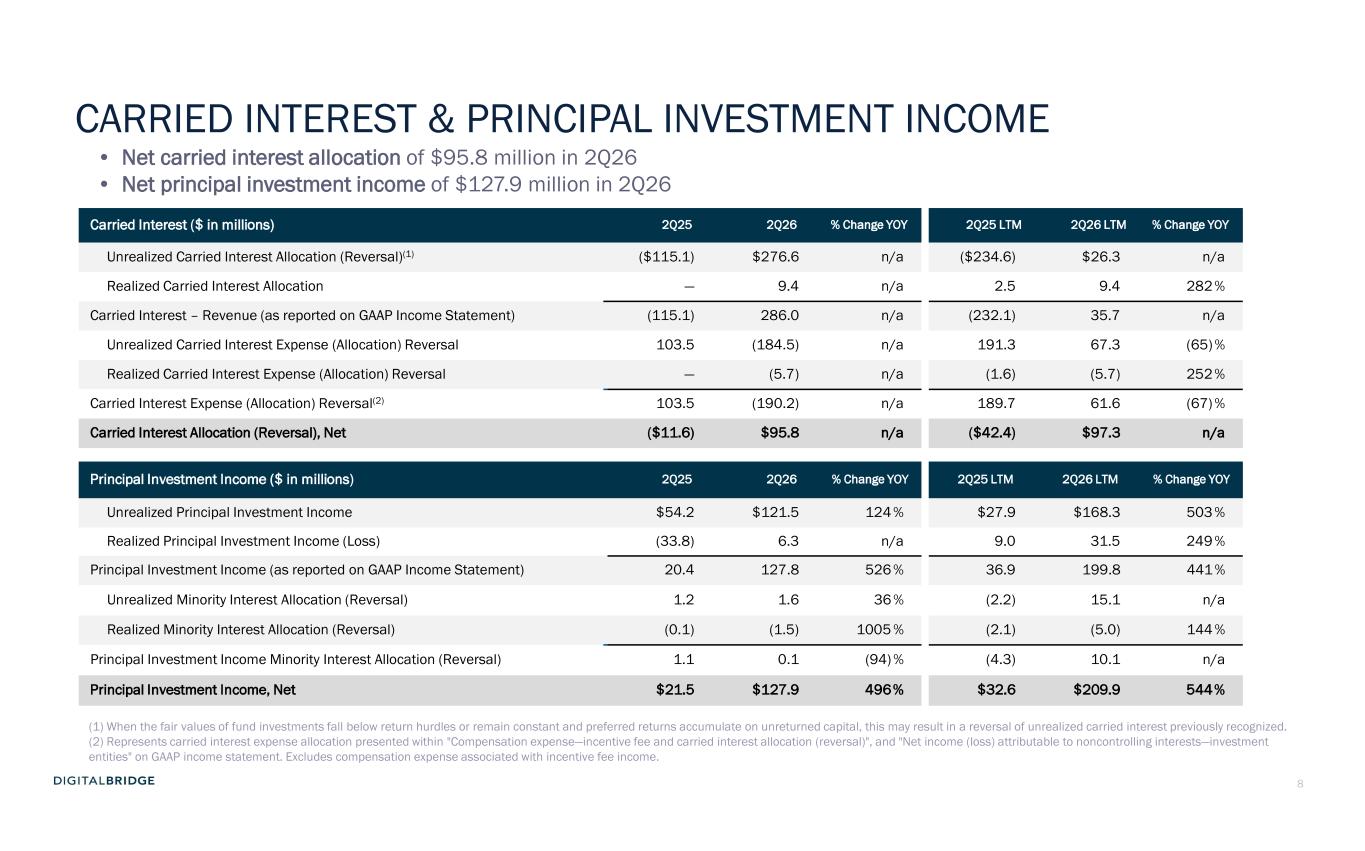
8 Carried Interest ($ in millions) 2Q25 2Q26 % Change YOY 2Q25 LTM 2Q26 LTM % Change YOY Unrealized Carried Interest Allocation (Reversal)(1) ($115.1) $276.6 n/a ($234.6) $26.3 n/a Realized Carried Interest Allocation — 9.4 n/a 2.5 9.4 282% Carried Interest – Revenue (as reported on GAAP Income Statement) (115.1) 286.0 n/a (232.1) 35.7 n/a Unrealized Carried Interest Expense (Allocation) Reversal 103.5 (184.5) n/a 191.3 67.3 (65) % Realized Carried Interest Expense (Allocation) Reversal — (5.7) n/a (1.6) (5.7) 252% Carried Interest Expense (Allocation) Reversal(2) 103.5 (190.2) n/a 189.7 61.6 (67) % Carried Interest Allocation (Reversal), Net ($11.6) $95.8 n/a ($42.4) $97.3 n/a Principal Investment Income ($ in millions) 2Q25 2Q26 % Change YOY 2Q25 LTM 2Q26 LTM % Change YOY Unrealized Principal Investment Income $54.2 $121.5 124% $27.9 $168.3 503 % Realized Principal Investment Income (Loss) (33.8) 6.3 n/a 9.0 31.5 249 % Principal Investment Income (as reported on GAAP Income Statement) 20.4 127.8 526 % 36.9 199.8 441 % Unrealized Minority Interest Allocation (Reversal) 1.2 1.6 36 % (2.2) 15.1 n/a Realized Minority Interest Allocation (Reversal) (0.1) (1.5) 1005 % (2.1) (5.0) 144 % Principal Investment Income Minority Interest Allocation (Reversal) 1.1 0.1 (94) % (4.3) 10.1 n/a Principal Investment Income, Net $21.5 $127.9 496% $32.6 $209.9 544% (1) When the fair values of fund investments fall below return hurdles or remain constant and preferred returns accumulate on unreturned capital, this may result in a reversal of unrealized carried interest previously recognized. (2) Represents carried interest expense allocation presented within "Compensation expense—incentive fee and carried interest allocation (reversal)", and "Net income (loss) attributable to noncontrolling interests—investment entities" on GAAP income statement. Excludes compensation expense associated with incentive fee income. • Net carried interest allocation of $95.8 million in 2Q26 • Net principal investment income of $127.9 million in 2Q26 CARRIED INTEREST & PRINCIPAL INVESTMENT INCOME
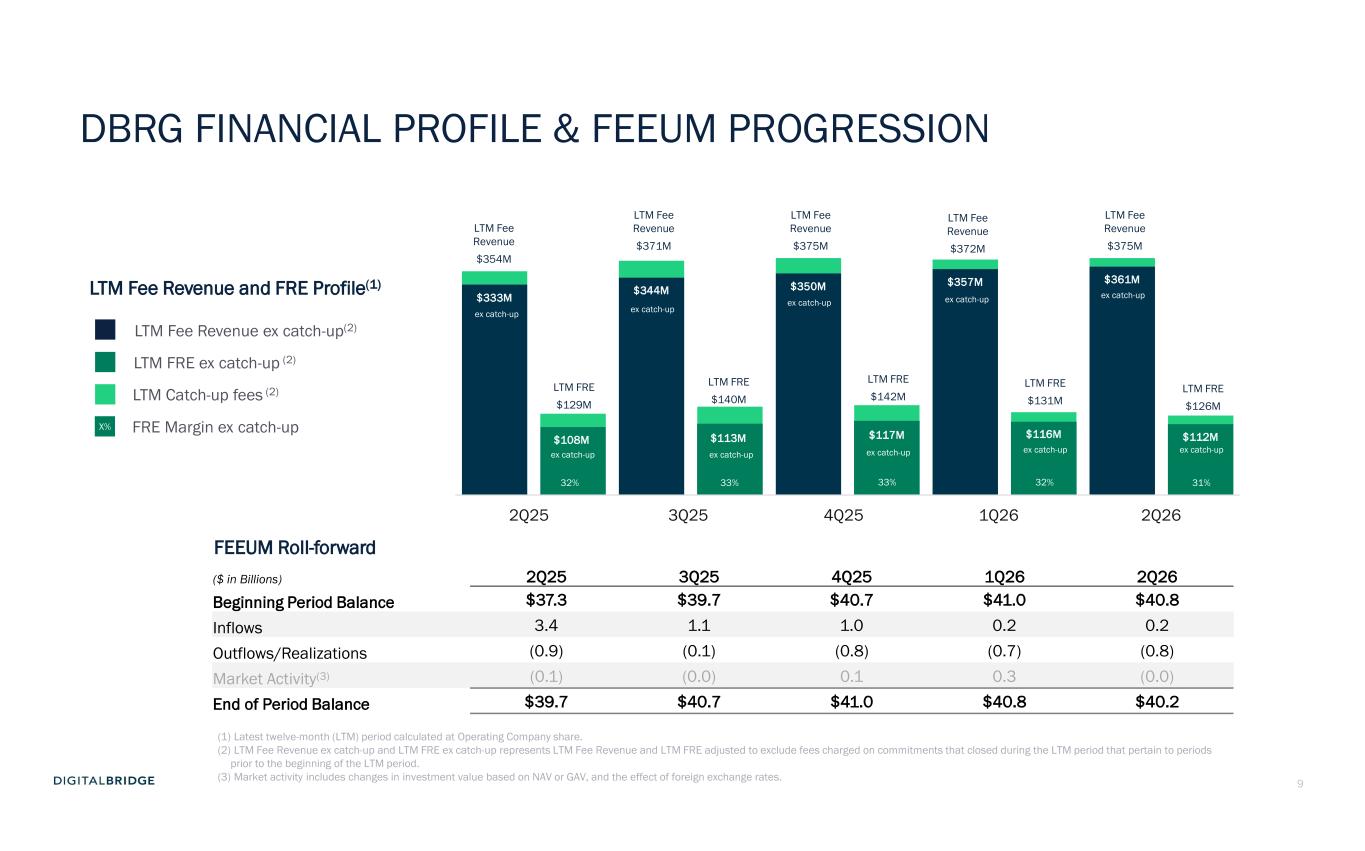
9 LTM Fee Revenue ex catch-up(2) LTM FRE ex catch-up (2) LTM Fee Revenue and FRE Profile(1) $333M $108M $344M $113M $350M $117M $357M $116M $361M $112M 2Q261Q264Q253Q252Q25 LTM Catch-up fees (2) FRE Margin ex catch-up 31% X% 32% 33% 33% 32% DBRG FINANCIAL PROFILE & FEEUM PROGRESSION ($ in Billions) 2Q25 3Q25 4Q25 1Q26 2Q26 Beginning Period Balance $37.3 $39.7 $40.7 $41.0 $40.8 Inflows 3.4 1.1 1.0 0.2 0.2 Outflows/Realizations (0.9) (0.1) (0.8) (0.7) (0.8) Market Activity(3) (0.1) (0.0) 0.1 0.3 (0.0) End of Period Balance $39.7 $40.7 $41.0 $40.8 $40.2 FEEUM Roll-forward (1) Latest twelve-month (LTM) period calculated at Operating Company share. (2) LTM Fee Revenue ex catch-up and LTM FRE ex catch-up represents LTM Fee Revenue and LTM FRE adjusted to exclude fees charged on commitments that closed during the LTM period that pertain to periods prior to the beginning of the LTM period. (3) Market activity includes changes in investment value based on NAV or GAV, and the effect of foreign exchange rates. ex catch-up ex catch-up LTM Fee Revenue $354M LTM FRE $129M ex catch-up ex catch-up ex catch-up ex catch-up ex catch-up ex catch-up ex catch-up ex catch-up LTM Fee Revenue $371M LTM Fee Revenue $375M LTM Fee Revenue $372M LTM Fee Revenue $375M LTM FRE $140M LTM FRE $142M LTM FRE $131M LTM FRE $126M
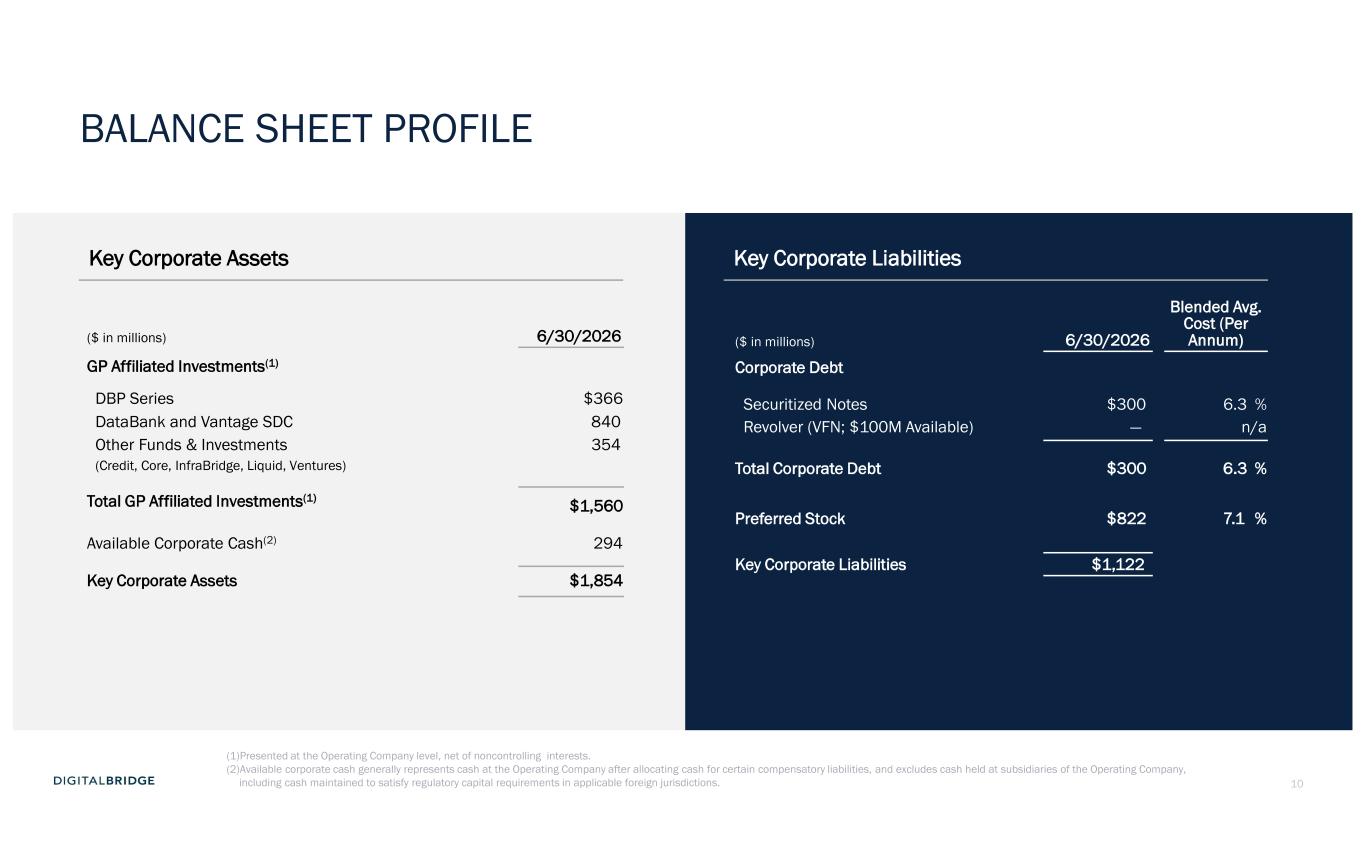
10 Key Corporate Assets Key Corporate Liabilities ($ in millions) 6/30/2026 GP Affiliated Investments(1) DBP Series $366 DataBank and Vantage SDC 840 Other Funds & Investments 354 (Credit, Core, InfraBridge, Liquid, Ventures) Total GP Affiliated Investments(1) $1,560 Available Corporate Cash(2) 294 Key Corporate Assets $1,854 ($ in millions) 6/30/2026 Blended Avg. Cost (Per Annum) Corporate Debt Securitized Notes $300 6.3 % Revolver (VFN; $100M Available) — n/a Total Corporate Debt $300 6.3 % Preferred Stock $822 7.1 % Key Corporate Liabilities $1,122 (1)Presented at the Operating Company level, net of noncontrolling interests. (2)Available corporate cash generally represents cash at the Operating Company after allocating cash for certain compensatory liabilities, and excludes cash held at subsidiaries of the Operating Company, including cash maintained to satisfy regulatory capital requirements in applicable foreign jurisdictions. BALANCE SHEET PROFILE

11 SUPPLEMENTAL FINANCIAL DATA
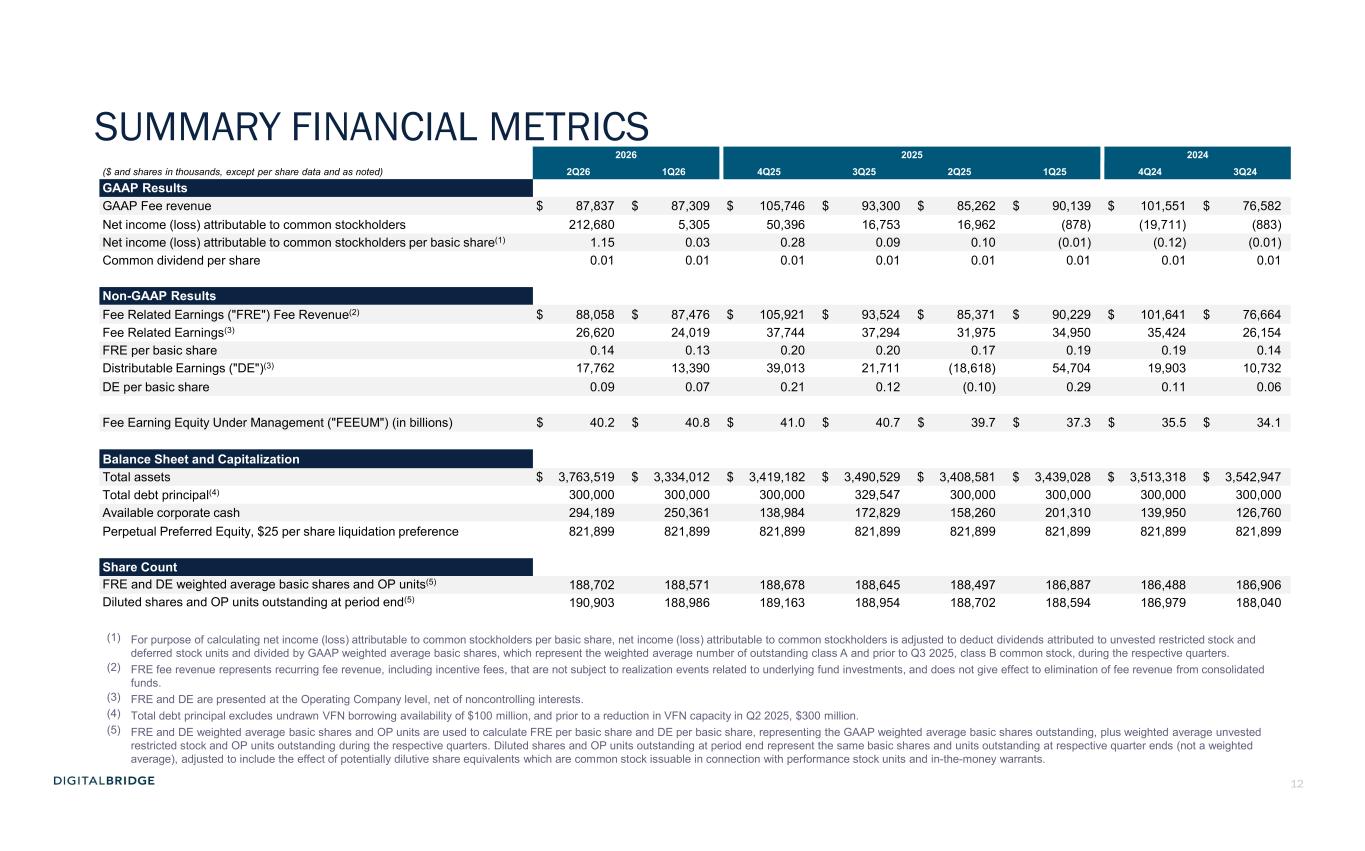
12 SUMMARY FINANCIAL METRICS 2026 2025 2024 ($ and shares in thousands, except per share data and as noted) 2Q26 1Q26 4Q25 3Q25 2Q25 1Q25 4Q24 3Q24 GAAP Results GAAP Fee revenue $ 87,837 $ 87,309 $ 105,746 $ 93,300 $ 85,262 $ 90,139 $ 101,551 $ 76,582 Net income (loss) attributable to common stockholders 212,680 5,305 50,396 16,753 16,962 (878) (19,711) (883) Net income (loss) attributable to common stockholders per basic share(1) 1.15 0.03 0.28 0.09 0.10 (0.01) (0.12) (0.01) Common dividend per share 0.01 0.01 0.01 0.01 0.01 0.01 0.01 0.01 Non-GAAP Results Fee Related Earnings ("FRE") Fee Revenue(2) $ 88,058 $ 87,476 $ 105,921 $ 93,524 $ 85,371 $ 90,229 $ 101,641 $ 76,664 Fee Related Earnings(3) 26,620 24,019 37,744 37,294 31,975 34,950 35,424 26,154 FRE per basic share 0.14 0.13 0.20 0.20 0.17 0.19 0.19 0.14 Distributable Earnings ("DE")(3) 17,762 13,390 39,013 21,711 (18,618) 54,704 19,903 10,732 DE per basic share 0.09 0.07 0.21 0.12 (0.10) 0.29 0.11 0.06 Fee Earning Equity Under Management ("FEEUM") (in billions) $ 40.2 $ 40.8 $ 41.0 $ 40.7 $ 39.7 $ 37.3 $ 35.5 $ 34.1 Balance Sheet and Capitalization Total assets $ 3,763,519 $ 3,334,012 $ 3,419,182 $ 3,490,529 $ 3,408,581 $ 3,439,028 $ 3,513,318 $ 3,542,947 Total debt principal(4) 300,000 300,000 300,000 329,547 300,000 300,000 300,000 300,000 Available corporate cash 294,189 250,361 138,984 172,829 158,260 201,310 139,950 126,760 Perpetual Preferred Equity, $25 per share liquidation preference 821,899 821,899 821,899 821,899 821,899 821,899 821,899 821,899 Share Count FRE and DE weighted average basic shares and OP units(5) 188,702 188,571 188,678 188,645 188,497 186,887 186,488 186,906 Diluted shares and OP units outstanding at period end(5) 190,903 188,986 189,163 188,954 188,702 188,594 186,979 188,040 (1) For purpose of calculating net income (loss) attributable to common stockholders per basic share, net income (loss) attributable to common stockholders is adjusted to deduct dividends attributed to unvested restricted stock and deferred stock units and divided by GAAP weighted average basic shares, which represent the weighted average number of outstanding class A and prior to Q3 2025, class B common stock, during the respective quarters. (2) FRE fee revenue represents recurring fee revenue, including incentive fees, that are not subject to realization events related to underlying fund investments, and does not give effect to elimination of fee revenue from consolidated funds. (3) FRE and DE are presented at the Operating Company level, net of noncontrolling interests. (4) Total debt principal excludes undrawn VFN borrowing availability of $100 million, and prior to a reduction in VFN capacity in Q2 2025, $300 million. (5) FRE and DE weighted average basic shares and OP units are used to calculate FRE per basic share and DE per basic share, representing the GAAP weighted average basic shares outstanding, plus weighted average unvested restricted stock and OP units outstanding during the respective quarters. Diluted shares and OP units outstanding at period end represent the same basic shares and units outstanding at respective quarter ends (not a weighted average), adjusted to include the effect of potentially dilutive share equivalents which are common stock issuable in connection with performance stock units and in-the-money warrants.
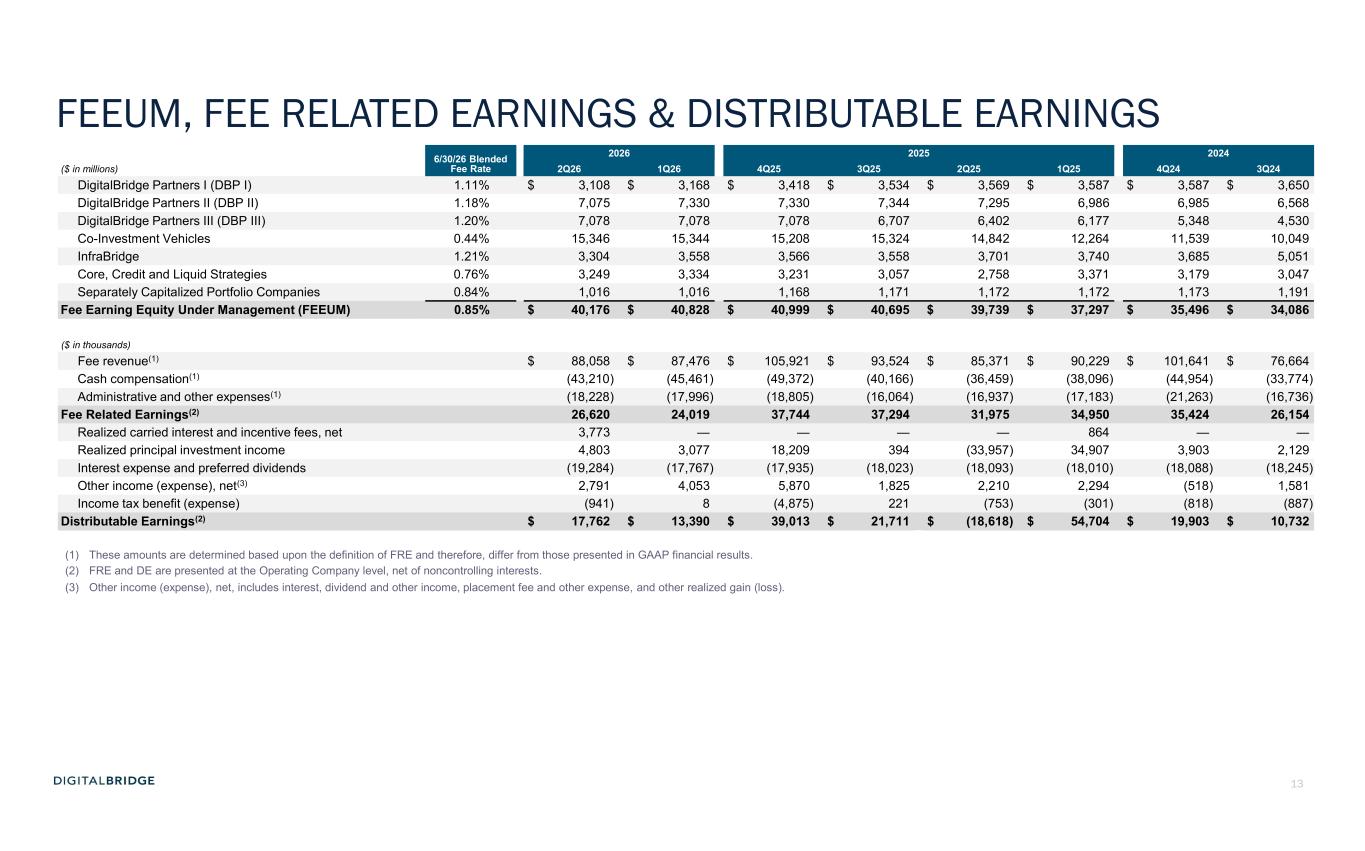
13 FEEUM, FEE RELATED EARNINGS & DISTRIBUTABLE EARNINGS 6/30/26 Blended Fee Rate 2026 2025 2024 ($ in millions) 2Q26 1Q26 4Q25 3Q25 2Q25 1Q25 4Q24 3Q24 DigitalBridge Partners I (DBP I) 1.11% $ 3,108 $ 3,168 $ 3,418 $ 3,534 $ 3,569 $ 3,587 $ 3,587 $ 3,650 DigitalBridge Partners II (DBP II) 1.18% 7,075 7,330 7,330 7,344 7,295 6,986 6,985 6,568 DigitalBridge Partners III (DBP III) 1.20% 7,078 7,078 7,078 6,707 6,402 6,177 5,348 4,530 Co-Investment Vehicles 0.44% 15,346 15,344 15,208 15,324 14,842 12,264 11,539 10,049 InfraBridge 1.21% 3,304 3,558 3,566 3,558 3,701 3,740 3,685 5,051 Core, Credit and Liquid Strategies 0.76% 3,249 3,334 3,231 3,057 2,758 3,371 3,179 3,047 Separately Capitalized Portfolio Companies 0.84% 1,016 1,016 1,168 1,171 1,172 1,172 1,173 1,191 Fee Earning Equity Under Management (FEEUM) 0.85% $ 40,176 $ 40,828 $ 40,999 $ 40,695 $ 39,739 $ 37,297 $ 35,496 $ 34,086 ($ in thousands) Fee revenue(1) $ 88,058 $ 87,476 $ 105,921 $ 93,524 $ 85,371 $ 90,229 $ 101,641 $ 76,664 Cash compensation(1) (43,210) (45,461) (49,372) (40,166) (36,459) (38,096) (44,954) (33,774) Administrative and other expenses(1) (18,228) (17,996) (18,805) (16,064) (16,937) (17,183) (21,263) (16,736) Fee Related Earnings(2) 26,620 24,019 37,744 37,294 31,975 34,950 35,424 26,154 Realized carried interest and incentive fees, net 3,773 — — — — 864 — — Realized principal investment income 4,803 3,077 18,209 394 (33,957) 34,907 3,903 2,129 Interest expense and preferred dividends (19,284) (17,767) (17,935) (18,023) (18,093) (18,010) (18,088) (18,245) Other income (expense), net(3) 2,791 4,053 5,870 1,825 2,210 2,294 (518) 1,581 Income tax benefit (expense) (941) 8 (4,875) 221 (753) (301) (818) (887) Distributable Earnings(2) $ 17,762 $ 13,390 $ 39,013 $ 21,711 $ (18,618) $ 54,704 $ 19,903 $ 10,732 (1) These amounts are determined based upon the definition of FRE and therefore, differ from those presented in GAAP financial results. (2) FRE and DE are presented at the Operating Company level, net of noncontrolling interests. (3) Other income (expense), net, includes interest, dividend and other income, placement fee and other expense, and other realized gain (loss).
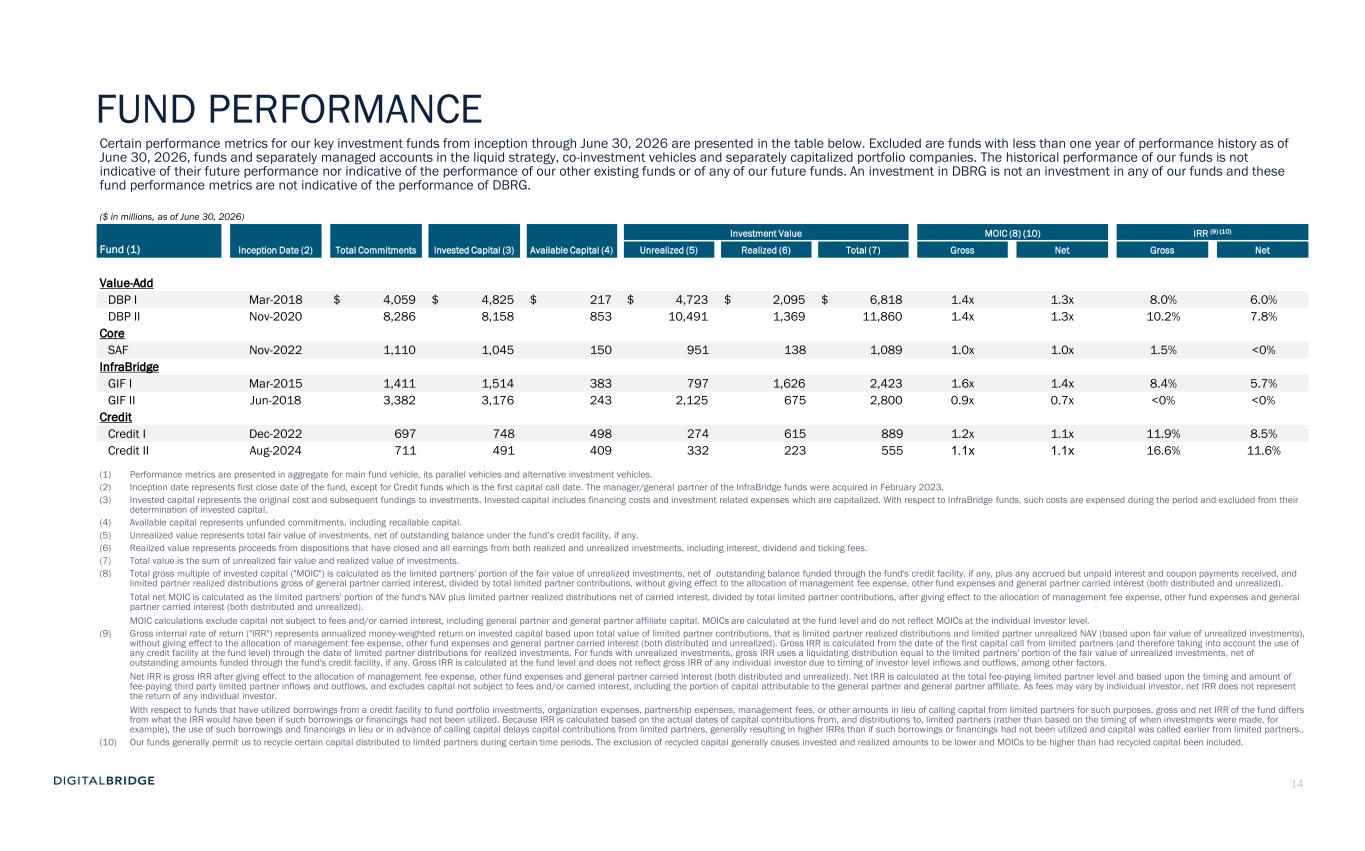
14 Certain performance metrics for our key investment funds from inception through June 30, 2026 are presented in the table below. Excluded are funds with less than one year of performance history as of June 30, 2026, funds and separately managed accounts in the liquid strategy, co-investment vehicles and separately capitalized portfolio companies. The historical performance of our funds is not indicative of their future performance nor indicative of the performance of our other existing funds or of any of our future funds. An investment in DBRG is not an investment in any of our funds and these fund performance metrics are not indicative of the performance of DBRG. ($ in millions, as of June 30, 2026) Inception Date (2) Total Commitments Invested Capital (3) Available Capital (4) Investment Value MOIC (8) (10) IRR (9) (10) Fund (1) Unrealized (5) Realized (6) Total (7) Gross Net Gross Net Value-Add DBP I Mar-2018 $ 4,059 $ 4,825 $ 217 $ 4,723 $ 2,095 $ 6,818 1.4x 1.3x 8.0% 6.0% DBP II Nov-2020 8,286 8,158 853 10,491 1,369 11,860 1.4x 1.3x 10.2% 7.8% Core SAF Nov-2022 1,110 1,045 150 951 138 1,089 1.0x 1.0x 1.5% <0% InfraBridge GIF I Mar-2015 1,411 1,514 383 797 1,626 2,423 1.6x 1.4x 8.4% 5.7% GIF II Jun-2018 3,382 3,176 243 2,125 675 2,800 0.9x 0.7x <0% <0% Credit Credit I Dec-2022 697 748 498 274 615 889 1.2x 1.1x 11.9% 8.5% Credit II Aug-2024 711 491 409 332 223 555 1.1x 1.1x 16.6% 11.6% (1) Performance metrics are presented in aggregate for main fund vehicle, its parallel vehicles and alternative investment vehicles. (2) Inception date represents first close date of the fund, except for Credit funds which is the first capital call date. The manager/general partner of the InfraBridge funds were acquired in February 2023. (3) Invested capital represents the original cost and subsequent fundings to investments. Invested capital includes financing costs and investment related expenses which are capitalized. With respect to InfraBridge funds, such costs are expensed during the period and excluded from their determination of invested capital. (4) Available capital represents unfunded commitments, including recallable capital. (5) Unrealized value represents total fair value of investments, net of outstanding balance under the fund’s credit facility, if any. (6) Realized value represents proceeds from dispositions that have closed and all earnings from both realized and unrealized investments, including interest, dividend and ticking fees. (7) Total value is the sum of unrealized fair value and realized value of investments. (8) Total gross multiple of invested capital ("MOIC") is calculated as the limited partners' portion of the fair value of unrealized investments, net of outstanding balance funded through the fund's credit facility, if any, plus any accrued but unpaid interest and coupon payments received, and limited partner realized distributions gross of general partner carried interest, divided by total limited partner contributions, without giving effect to the allocation of management fee expense, other fund expenses and general partner carried interest (both distributed and unrealized). Total net MOIC is calculated as the limited partners' portion of the fund's NAV plus limited partner realized distributions net of carried interest, divided by total limited partner contributions, after giving effect to the allocation of management fee expense, other fund expenses and general partner carried interest (both distributed and unrealized). MOIC calculations exclude capital not subject to fees and/or carried interest, including general partner and general partner affiliate capital. MOICs are calculated at the fund level and do not reflect MOICs at the individual investor level. (9) Gross internal rate of return ("IRR") represents annualized money-weighted return on invested capital based upon total value of limited partner contributions, that is limited partner realized distributions and limited partner unrealized NAV (based upon fair value of unrealized investments), without giving effect to the allocation of management fee expense, other fund expenses and general partner carried interest (both distributed and unrealized). Gross IRR is calculated from the date of the first capital call from limited partners (and therefore taking into account the use of any credit facility at the fund level) through the date of limited partner distributions for realized investments. For funds with unrealized investments, gross IRR uses a liquidating distribution equal to the limited partners' portion of the fair value of unrealized investments, net of outstanding amounts funded through the fund's credit facility, if any. Gross IRR is calculated at the fund level and does not reflect gross IRR of any individual investor due to timing of investor level inflows and outflows, among other factors. Net IRR is gross IRR after giving effect to the allocation of management fee expense, other fund expenses and general partner carried interest (both distributed and unrealized). Net IRR is calculated at the total fee-paying limited partner level and based upon the timing and amount of fee-paying third party limited partner inflows and outflows, and excludes capital not subject to fees and/or carried interest, including the portion of capital attributable to the general partner and general partner affiliate. As fees may vary by individual investor, net IRR does not represent the return of any individual investor. With respect to funds that have utilized borrowings from a credit facility to fund portfolio investments, organization expenses, partnership expenses, management fees, or other amounts in lieu of calling capital from limited partners for such purposes, gross and net IRR of the fund differs from what the IRR would have been if such borrowings or financings had not been utilized. Because IRR is calculated based on the actual dates of capital contributions from, and distributions to, limited partners (rather than based on the timing of when investments were made, for example), the use of such borrowings and financings in lieu or in advance of calling capital delays capital contributions from limited partners, generally resulting in higher IRRs than if such borrowings or financings had not been utilized and capital was called earlier from limited partners.. (10) Our funds generally permit us to recycle certain capital distributed to limited partners during certain time periods. The exclusion of recycled capital generally causes invested and realized amounts to be lower and MOICs to be higher than had recycled capital been included. FUND PERFORMANCE
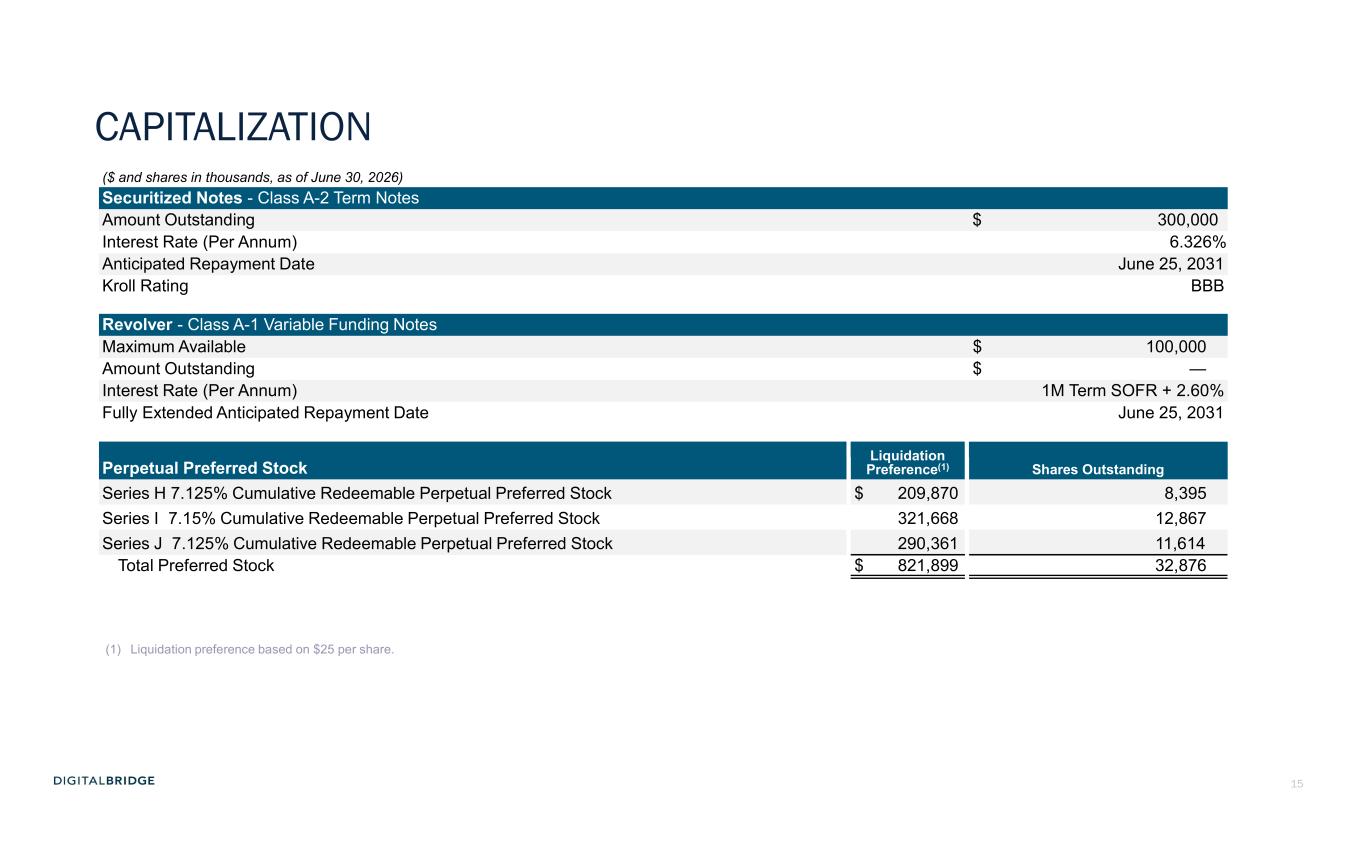
15 ($ and shares in thousands, as of June 30, 2026) Securitized Notes - Class A-2 Term Notes Amount Outstanding $ 300,000 Interest Rate (Per Annum) 6.326% Anticipated Repayment Date June 25, 2031 Kroll Rating BBB Revolver - Class A-1 Variable Funding Notes Maximum Available $ 100,000 Amount Outstanding $ — Interest Rate (Per Annum) 1M Term SOFR + 2.60% Fully Extended Anticipated Repayment Date June 25, 2031 Liquidation Preference(1) Shares OutstandingPerpetual Preferred Stock Series H 7.125% Cumulative Redeemable Perpetual Preferred Stock $ 209,870 8,395 Series I 7.15% Cumulative Redeemable Perpetual Preferred Stock 321,668 12,867 Series J 7.125% Cumulative Redeemable Perpetual Preferred Stock 290,361 11,614 Total Preferred Stock $ 821,899 32,876 (1) Liquidation preference based on $25 per share. CAPITALIZATION
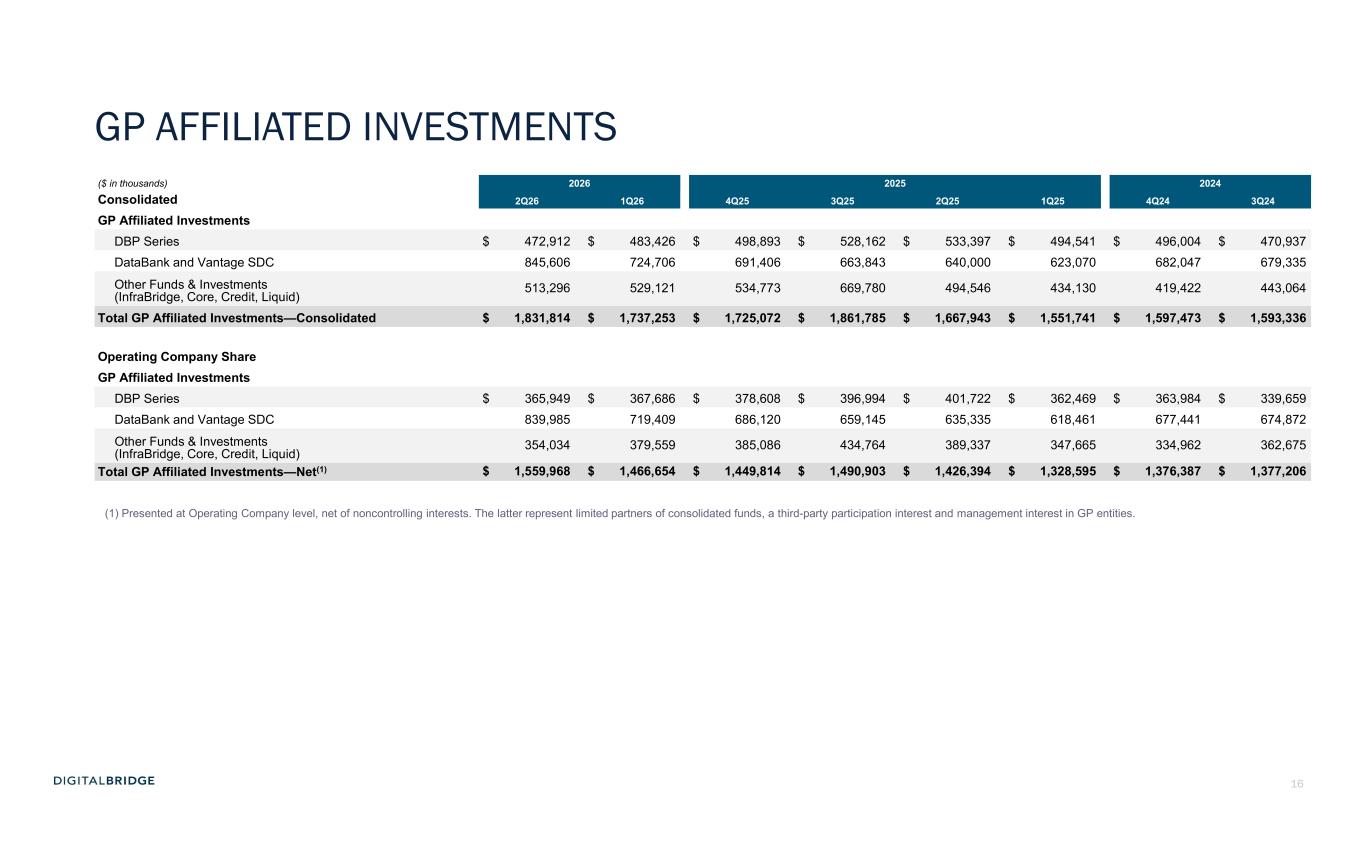
16 ($ in thousands) 2026 2025 2024 Consolidated 2Q26 1Q26 4Q25 3Q25 2Q25 1Q25 4Q24 3Q24 GP Affiliated Investments DBP Series $ 472,912 $ 483,426 $ 498,893 $ 528,162 $ 533,397 $ 494,541 $ 496,004 $ 470,937 DataBank and Vantage SDC 845,606 724,706 691,406 663,843 640,000 623,070 682,047 679,335 Other Funds & Investments (InfraBridge, Core, Credit, Liquid) 513,296 529,121 534,773 669,780 494,546 434,130 419,422 443,064 Total GP Affiliated Investments—Consolidated $ 1,831,814 $ 1,737,253 $ 1,725,072 $ 1,861,785 $ 1,667,943 $ 1,551,741 $ 1,597,473 $ 1,593,336 Operating Company Share GP Affiliated Investments DBP Series $ 365,949 $ 367,686 $ 378,608 $ 396,994 $ 401,722 $ 362,469 $ 363,984 $ 339,659 DataBank and Vantage SDC 839,985 719,409 686,120 659,145 635,335 618,461 677,441 674,872 Other Funds & Investments (InfraBridge, Core, Credit, Liquid) 354,034 379,559 385,086 434,764 389,337 347,665 334,962 362,675 Total GP Affiliated Investments—Net(1) $ 1,559,968 $ 1,466,654 $ 1,449,814 $ 1,490,903 $ 1,426,394 $ 1,328,595 $ 1,376,387 $ 1,377,206 GP AFFILIATED INVESTMENTS (1) Presented at Operating Company level, net of noncontrolling interests. The latter represent limited partners of consolidated funds, a third-party participation interest and management interest in GP entities.
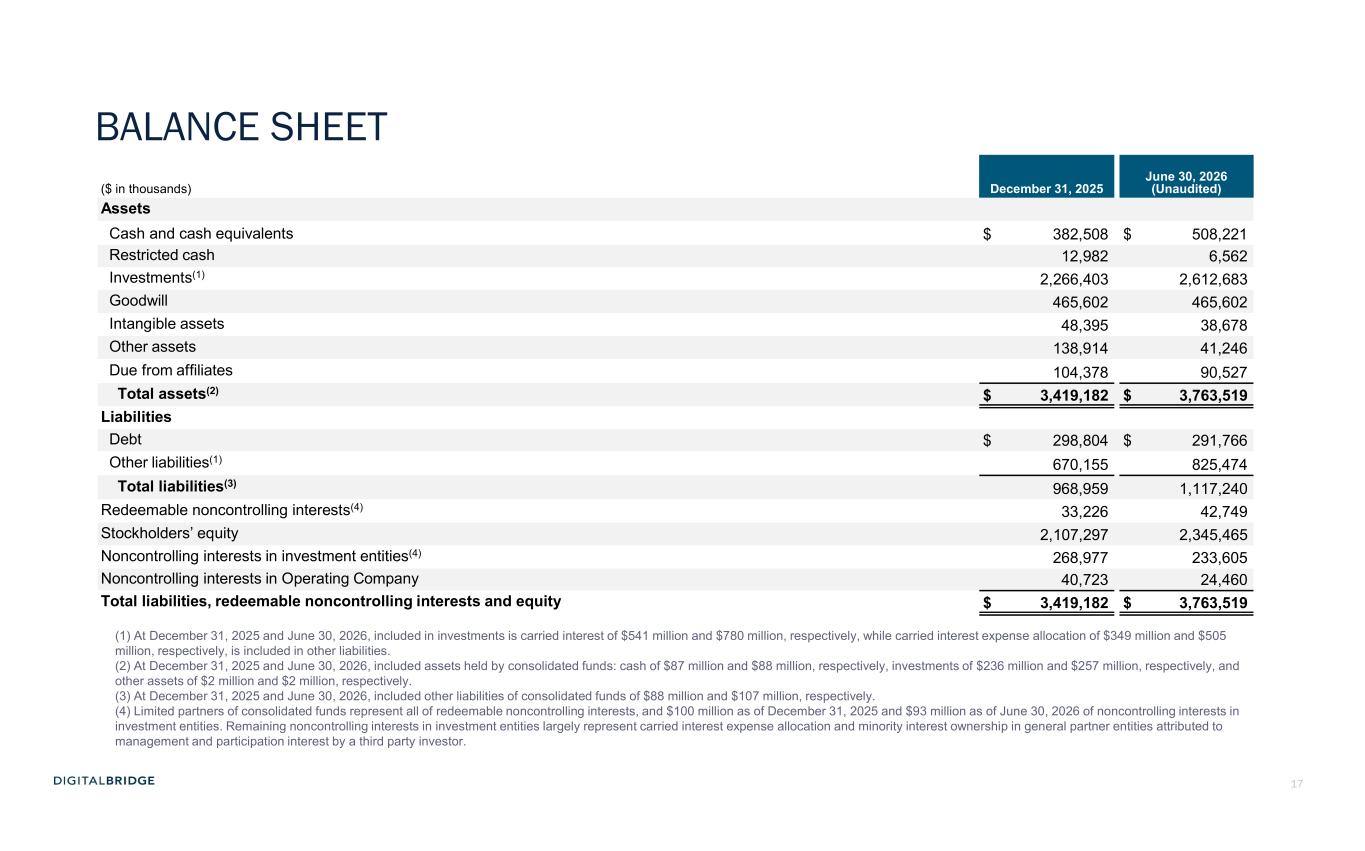
17 ($ in thousands) December 31, 2025 June 30, 2026 (Unaudited) Assets Cash and cash equivalents $ 382,508 $ 508,221 Restricted cash 12,982 6,562 Investments(1) 2,266,403 2,612,683 Goodwill 465,602 465,602 Intangible assets 48,395 38,678 Other assets 138,914 41,246 Due from affiliates 104,378 90,527 Total assets(2) $ 3,419,182 $ 3,763,519 Liabilities Debt $ 298,804 $ 291,766 Other liabilities(1) 670,155 825,474 Total liabilities(3) 968,959 1,117,240 Redeemable noncontrolling interests(4) 33,226 42,749 Stockholders’ equity 2,107,297 2,345,465 Noncontrolling interests in investment entities(4) 268,977 233,605 Noncontrolling interests in Operating Company 40,723 24,460 Total liabilities, redeemable noncontrolling interests and equity $ 3,419,182 $ 3,763,519 (1) At December 31, 2025 and June 30, 2026, included in investments is carried interest of $541 million and $780 million, respectively, while carried interest expense allocation of $349 million and $505 million, respectively, is included in other liabilities. (2) At December 31, 2025 and June 30, 2026, included assets held by consolidated funds: cash of $87 million and $88 million, respectively, investments of $236 million and $257 million, respectively, and other assets of $2 million and $2 million, respectively. (3) At December 31, 2025 and June 30, 2026, included other liabilities of consolidated funds of $88 million and $107 million, respectively. (4) Limited partners of consolidated funds represent all of redeemable noncontrolling interests, and $100 million as of December 31, 2025 and $93 million as of June 30, 2026 of noncontrolling interests in investment entities. Remaining noncontrolling interests in investment entities largely represent carried interest expense allocation and minority interest ownership in general partner entities attributed to management and participation interest by a third party investor. BALANCE SHEET
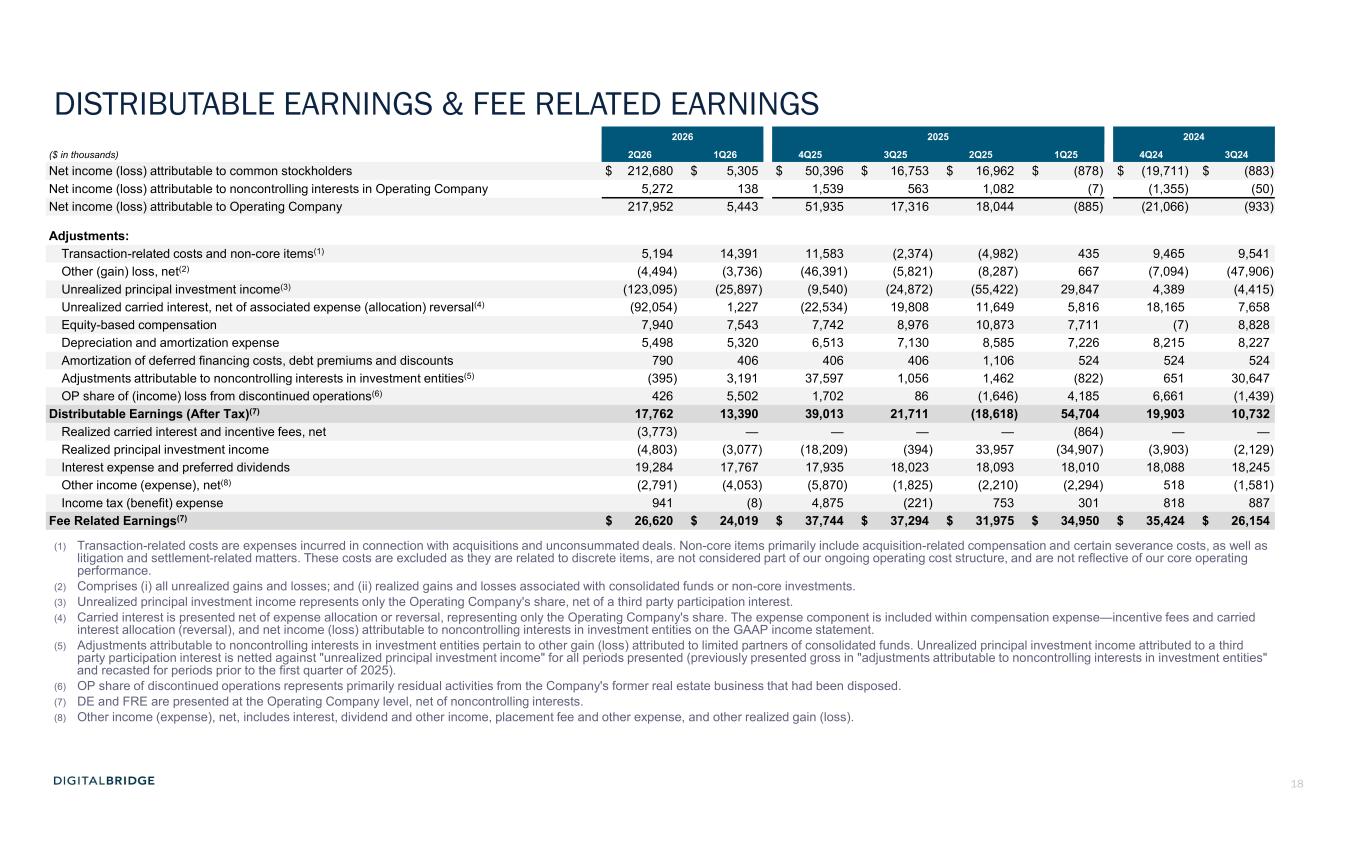
18 DISTRIBUTABLE EARNINGS & FEE RELATED EARNINGS 2026 2025 2024 ($ in thousands) 2Q26 1Q26 4Q25 3Q25 2Q25 1Q25 4Q24 3Q24 Net income (loss) attributable to common stockholders $ 212,680 $ 5,305 $ 50,396 $ 16,753 $ 16,962 $ (878) $ (19,711) $ (883) Net income (loss) attributable to noncontrolling interests in Operating Company 5,272 138 1,539 563 1,082 (7) (1,355) (50) Net income (loss) attributable to Operating Company 217,952 5,443 51,935 17,316 18,044 (885) (21,066) (933) Adjustments: Transaction-related costs and non-core items(1) 5,194 14,391 11,583 (2,374) (4,982) 435 9,465 9,541 Other (gain) loss, net(2) (4,494) (3,736) (46,391) (5,821) (8,287) 667 (7,094) (47,906) Unrealized principal investment income(3) (123,095) (25,897) (9,540) (24,872) (55,422) 29,847 4,389 (4,415) Unrealized carried interest, net of associated expense (allocation) reversal(4) (92,054) 1,227 (22,534) 19,808 11,649 5,816 18,165 7,658 Equity-based compensation 7,940 7,543 7,742 8,976 10,873 7,711 (7) 8,828 Depreciation and amortization expense 5,498 5,320 6,513 7,130 8,585 7,226 8,215 8,227 Amortization of deferred financing costs, debt premiums and discounts 790 406 406 406 1,106 524 524 524 Adjustments attributable to noncontrolling interests in investment entities(5) (395) 3,191 37,597 1,056 1,462 (822) 651 30,647 OP share of (income) loss from discontinued operations(6) 426 5,502 1,702 86 (1,646) 4,185 6,661 (1,439) Distributable Earnings (After Tax)(7) 17,762 13,390 39,013 21,711 (18,618) 54,704 19,903 10,732 Realized carried interest and incentive fees, net (3,773) — — — — (864) — — Realized principal investment income (4,803) (3,077) (18,209) (394) 33,957 (34,907) (3,903) (2,129) Interest expense and preferred dividends 19,284 17,767 17,935 18,023 18,093 18,010 18,088 18,245 Other income (expense), net(8) (2,791) (4,053) (5,870) (1,825) (2,210) (2,294) 518 (1,581) Income tax (benefit) expense 941 (8) 4,875 (221) 753 301 818 887 Fee Related Earnings(7) $ 26,620 $ 24,019 $ 37,744 $ 37,294 $ 31,975 $ 34,950 $ 35,424 $ 26,154 (1) Transaction-related costs are expenses incurred in connection with acquisitions and unconsummated deals. Non-core items primarily include acquisition-related compensation and certain severance costs, as well as litigation and settlement-related matters. These costs are excluded as they are related to discrete items, are not considered part of our ongoing operating cost structure, and are not reflective of our core operating performance. (2) Comprises (i) all unrealized gains and losses; and (ii) realized gains and losses associated with consolidated funds or non-core investments. (3) Unrealized principal investment income represents only the Operating Company's share, net of a third party participation interest. (4) Carried interest is presented net of expense allocation or reversal, representing only the Operating Company's share. The expense component is included within compensation expense—incentive fees and carried interest allocation (reversal), and net income (loss) attributable to noncontrolling interests in investment entities on the GAAP income statement. (5) Adjustments attributable to noncontrolling interests in investment entities pertain to other gain (loss) attributed to limited partners of consolidated funds. Unrealized principal investment income attributed to a third party participation interest is netted against "unrealized principal investment income" for all periods presented (previously presented gross in "adjustments attributable to noncontrolling interests in investment entities" and recasted for periods prior to the first quarter of 2025). (6) OP share of discontinued operations represents primarily residual activities from the Company's former real estate business that had been disposed. (7) DE and FRE are presented at the Operating Company level, net of noncontrolling interests. (8) Other income (expense), net, includes interest, dividend and other income, placement fee and other expense, and other realized gain (loss).
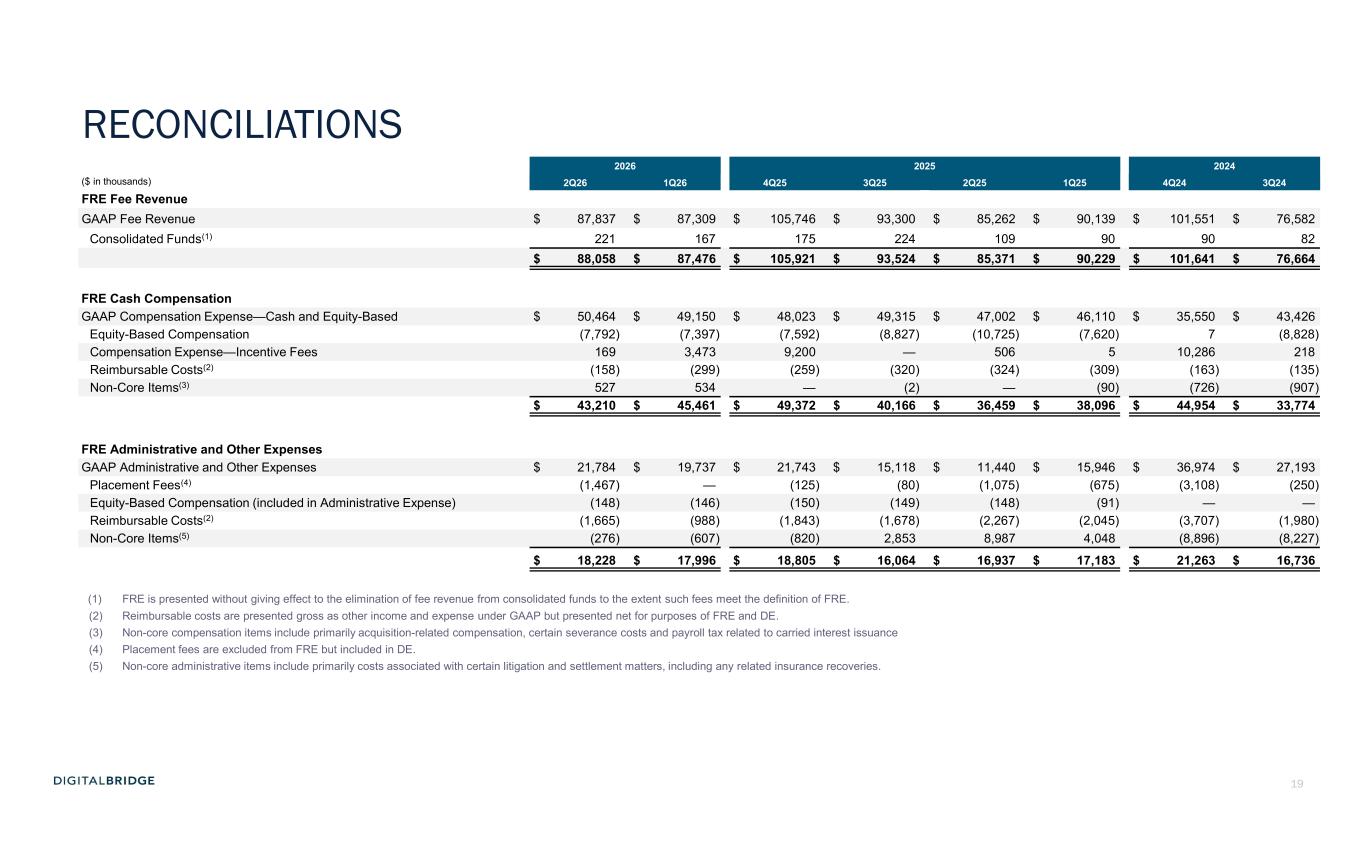
19 2026 2025 2024 ($ in thousands) 2Q26 1Q26 4Q25 3Q25 2Q25 1Q25 4Q24 3Q24 FRE Fee Revenue GAAP Fee Revenue $ 87,837 $ 87,309 $ 105,746 $ 93,300 $ 85,262 $ 90,139 $ 101,551 $ 76,582 Consolidated Funds(1) 221 167 175 224 109 90 90 82 $ 88,058 $ 87,476 $ 105,921 $ 93,524 $ 85,371 $ 90,229 $ 101,641 $ 76,664 FRE Cash Compensation GAAP Compensation Expense—Cash and Equity-Based $ 50,464 $ 49,150 $ 48,023 $ 49,315 $ 47,002 $ 46,110 $ 35,550 $ 43,426 Equity-Based Compensation (7,792) (7,397) (7,592) (8,827) (10,725) (7,620) 7 (8,828) Compensation Expense—Incentive Fees 169 3,473 9,200 — 506 5 10,286 218 Reimbursable Costs(2) (158) (299) (259) (320) (324) (309) (163) (135) Non-Core Items(3) 527 534 — (2) — (90) (726) (907) $ 43,210 $ 45,461 $ 49,372 $ 40,166 $ 36,459 $ 38,096 $ 44,954 $ 33,774 FRE Administrative and Other Expenses GAAP Administrative and Other Expenses $ 21,784 $ 19,737 $ 21,743 $ 15,118 $ 11,440 $ 15,946 $ 36,974 $ 27,193 Placement Fees(4) (1,467) — (125) (80) (1,075) (675) (3,108) (250) Equity-Based Compensation (included in Administrative Expense) (148) (146) (150) (149) (148) (91) — — Reimbursable Costs(2) (1,665) (988) (1,843) (1,678) (2,267) (2,045) (3,707) (1,980) Non-Core Items(5) (276) (607) (820) 2,853 8,987 4,048 (8,896) (8,227) $ 18,228 $ 17,996 $ 18,805 $ 16,064 $ 16,937 $ 17,183 $ 21,263 $ 16,736 (1) FRE is presented without giving effect to the elimination of fee revenue from consolidated funds to the extent such fees meet the definition of FRE. (2) Reimbursable costs are presented gross as other income and expense under GAAP but presented net for purposes of FRE and DE. (3) Non-core compensation items include primarily acquisition-related compensation, certain severance costs and payroll tax related to carried interest issuance (4) Placement fees are excluded from FRE but included in DE. (5) Non-core administrative items include primarily costs associated with certain litigation and settlement matters, including any related insurance recoveries. RECONCILIATIONS
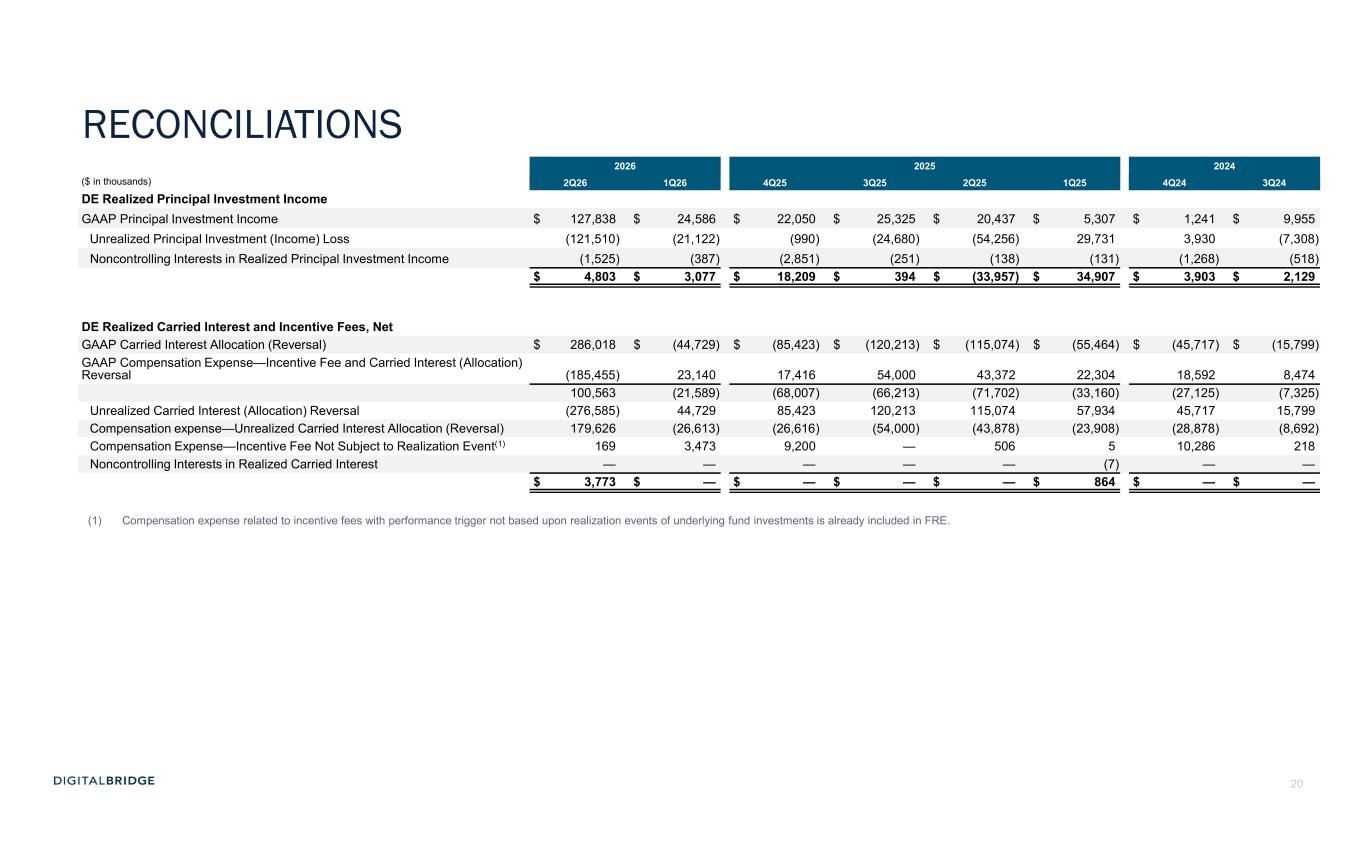
20 2026 2025 2024 ($ in thousands) 2Q26 1Q26 4Q25 3Q25 2Q25 1Q25 4Q24 3Q24 DE Realized Principal Investment Income GAAP Principal Investment Income $ 127,838 $ 24,586 $ 22,050 $ 25,325 $ 20,437 $ 5,307 $ 1,241 $ 9,955 Unrealized Principal Investment (Income) Loss (121,510) (21,122) (990) (24,680) (54,256) 29,731 3,930 (7,308) Noncontrolling Interests in Realized Principal Investment Income (1,525) (387) (2,851) (251) (138) (131) (1,268) (518) $ 4,803 $ 3,077 $ 18,209 $ 394 $ (33,957) $ 34,907 $ 3,903 $ 2,129 DE Realized Carried Interest and Incentive Fees, Net GAAP Carried Interest Allocation (Reversal) $ 286,018 $ (44,729) $ (85,423) $ (120,213) $ (115,074) $ (55,464) $ (45,717) $ (15,799) GAAP Compensation Expense—Incentive Fee and Carried Interest (Allocation) Reversal (185,455) 23,140 17,416 54,000 43,372 22,304 18,592 8,474 100,563 (21,589) (68,007) (66,213) (71,702) (33,160) (27,125) (7,325) Unrealized Carried Interest (Allocation) Reversal (276,585) 44,729 85,423 120,213 115,074 57,934 45,717 15,799 Compensation expense—Unrealized Carried Interest Allocation (Reversal) 179,626 (26,613) (26,616) (54,000) (43,878) (23,908) (28,878) (8,692) Compensation Expense—Incentive Fee Not Subject to Realization Event(1) 169 3,473 9,200 — 506 5 10,286 218 Noncontrolling Interests in Realized Carried Interest — — — — — (7) — — $ 3,773 $ — $ — $ — $ — $ 864 $ — $ — (1) Compensation expense related to incentive fees with performance trigger not based upon realization events of underlying fund investments is already included in FRE. RECONCILIATIONS
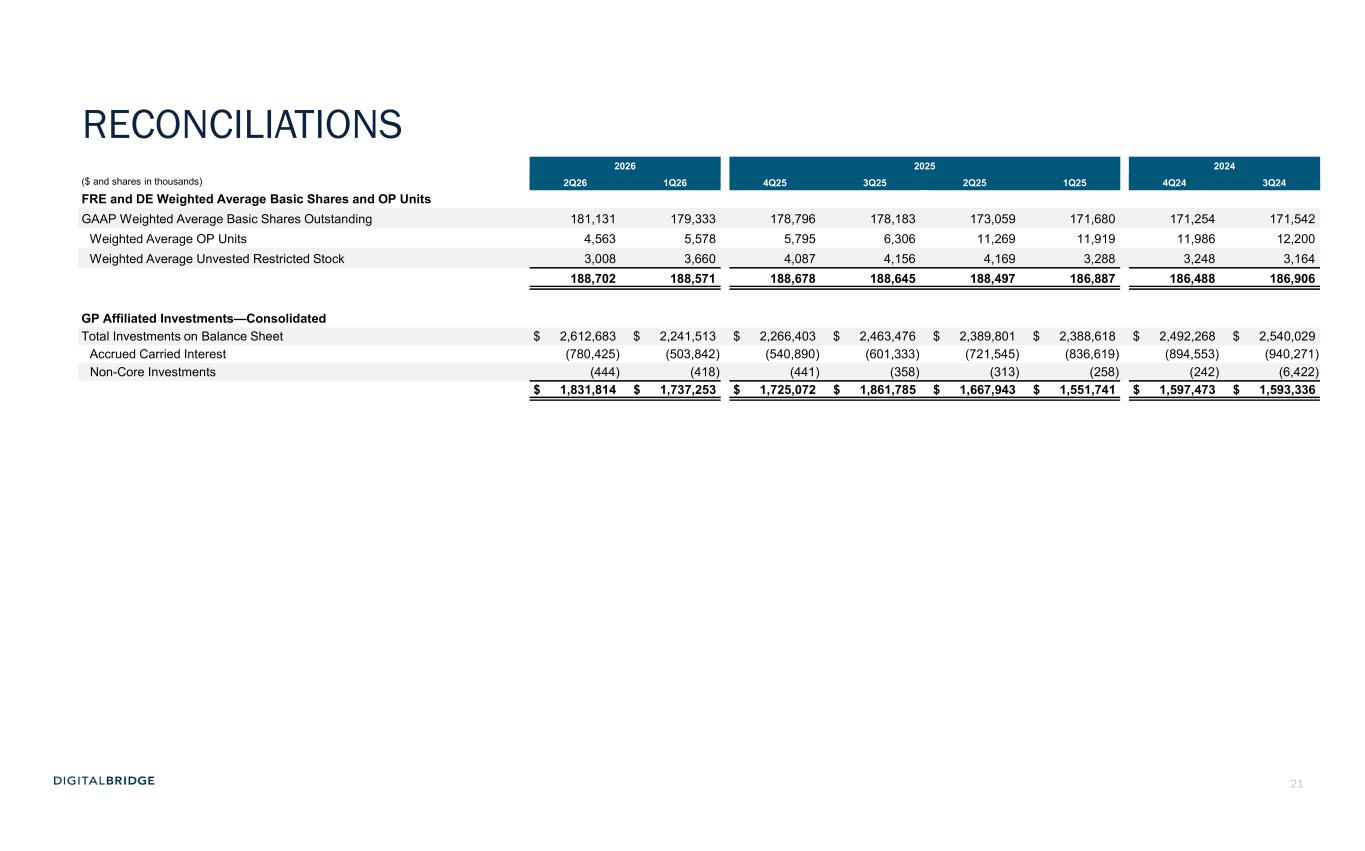
21 2026 2025 2024 ($ and shares in thousands) 2Q26 1Q26 4Q25 3Q25 2Q25 1Q25 4Q24 3Q24 FRE and DE Weighted Average Basic Shares and OP Units GAAP Weighted Average Basic Shares Outstanding 181,131 179,333 178,796 178,183 173,059 171,680 171,254 171,542 Weighted Average OP Units 4,563 5,578 5,795 6,306 11,269 11,919 11,986 12,200 Weighted Average Unvested Restricted Stock 3,008 3,660 4,087 4,156 4,169 3,288 3,248 3,164 188,702 188,571 188,678 188,645 188,497 186,887 186,488 186,906 GP Affiliated Investments—Consolidated Total Investments on Balance Sheet $ 2,612,683 $ 2,241,513 $ 2,266,403 $ 2,463,476 $ 2,389,801 $ 2,388,618 $ 2,492,268 $ 2,540,029 Accrued Carried Interest (780,425) (503,842) (540,890) (601,333) (721,545) (836,619) (894,553) (940,271) Non-Core Investments (444) (418) (441) (358) (313) (258) (242) (6,422) $ 1,831,814 $ 1,737,253 $ 1,725,072 $ 1,861,785 $ 1,667,943 $ 1,551,741 $ 1,597,473 $ 1,593,336 RECONCILIATIONS

22 APPENDIX
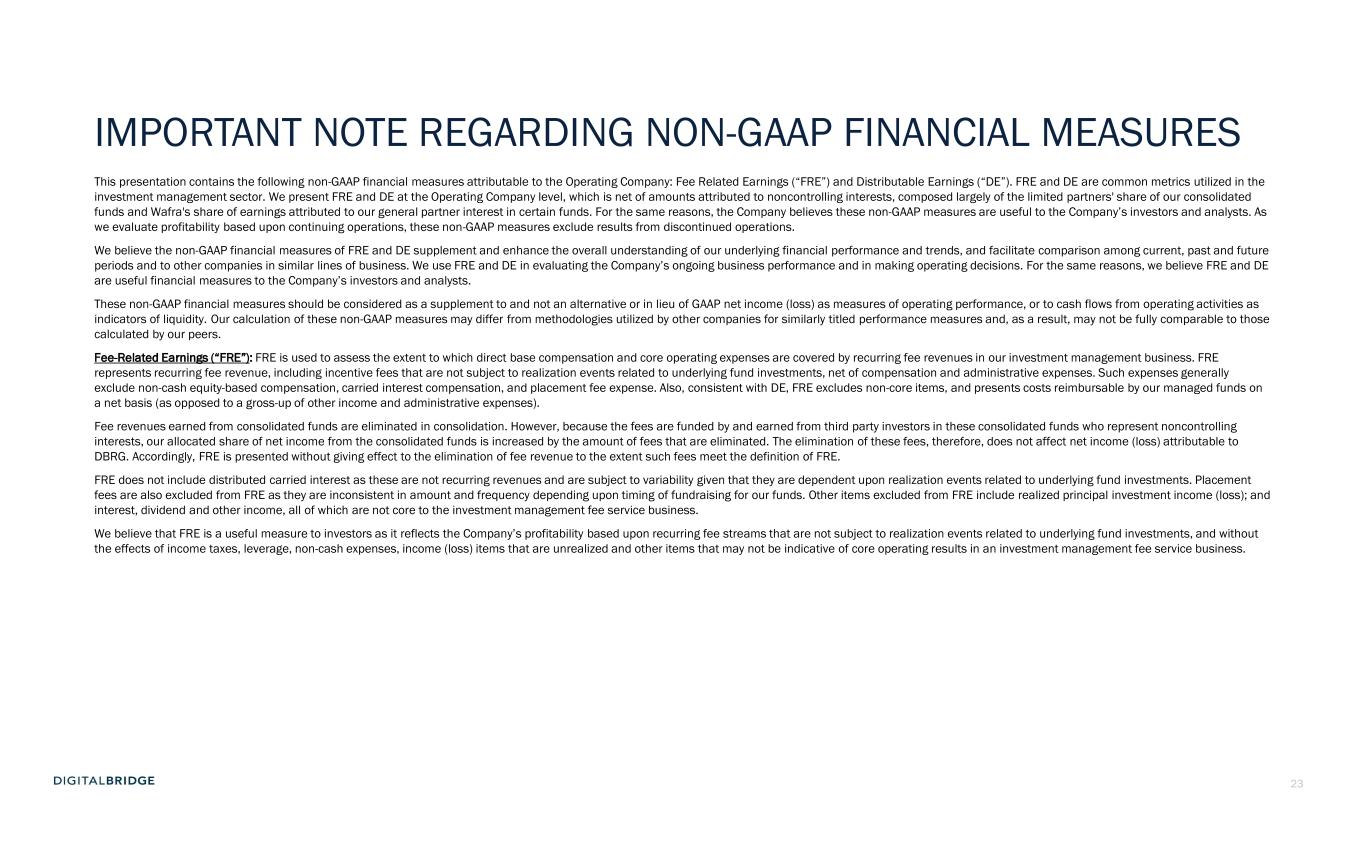
23 IMPORTANT NOTE REGARDING NON-GAAP FINANCIAL MEASURES This presentation contains the following non-GAAP financial measures attributable to the Operating Company: Fee Related Earnings (“FRE”) and Distributable Earnings (“DE”). FRE and DE are common metrics utilized in the investment management sector. We present FRE and DE at the Operating Company level, which is net of amounts attributed to noncontrolling interests, composed largely of the limited partners' share of our consolidated funds and Wafra's share of earnings attributed to our general partner interest in certain funds. For the same reasons, the Company believes these non-GAAP measures are useful to the Company’s investors and analysts. As we evaluate profitability based upon continuing operations, these non-GAAP measures exclude results from discontinued operations. We believe the non-GAAP financial measures of FRE and DE supplement and enhance the overall understanding of our underlying financial performance and trends, and facilitate comparison among current, past and future periods and to other companies in similar lines of business. We use FRE and DE in evaluating the Company’s ongoing business performance and in making operating decisions. For the same reasons, we believe FRE and DE are useful financial measures to the Company’s investors and analysts. These non-GAAP financial measures should be considered as a supplement to and not an alternative or in lieu of GAAP net income (loss) as measures of operating performance, or to cash flows from operating activities as indicators of liquidity. Our calculation of these non-GAAP measures may differ from methodologies utilized by other companies for similarly titled performance measures and, as a result, may not be fully comparable to those calculated by our peers. Fee-Related Earnings (“FRE”): FRE is used to assess the extent to which direct base compensation and core operating expenses are covered by recurring fee revenues in our investment management business. FRE represents recurring fee revenue, including incentive fees that are not subject to realization events related to underlying fund investments, net of compensation and administrative expenses. Such expenses generally exclude non-cash equity-based compensation, carried interest compensation, and placement fee expense. Also, consistent with DE, FRE excludes non-core items, and presents costs reimbursable by our managed funds on a net basis (as opposed to a gross-up of other income and administrative expenses). Fee revenues earned from consolidated funds are eliminated in consolidation. However, because the fees are funded by and earned from third party investors in these consolidated funds who represent noncontrolling interests, our allocated share of net income from the consolidated funds is increased by the amount of fees that are eliminated. The elimination of these fees, therefore, does not affect net income (loss) attributable to DBRG. Accordingly, FRE is presented without giving effect to the elimination of fee revenue to the extent such fees meet the definition of FRE. FRE does not include distributed carried interest as these are not recurring revenues and are subject to variability given that they are dependent upon realization events related to underlying fund investments. Placement fees are also excluded from FRE as they are inconsistent in amount and frequency depending upon timing of fundraising for our funds. Other items excluded from FRE include realized principal investment income (loss); and interest, dividend and other income, all of which are not core to the investment management fee service business. We believe that FRE is a useful measure to investors as it reflects the Company’s profitability based upon recurring fee streams that are not subject to realization events related to underlying fund investments, and without the effects of income taxes, leverage, non-cash expenses, income (loss) items that are unrealized and other items that may not be indicative of core operating results in an investment management fee service business.
24 IMPORTANT NOTE REGARDING NON-GAAP FINANCIAL MEASURES (CONTINUED) Distributable Earnings (“DE”): DE generally represents net realized earnings of the Company and is an indicative measure used by the Company to assess ongoing operating performance and in making decisions related to distributions and reinvestments. Accordingly, we believe DE provides investors and analysts transparency into the measure of performance used by the Company in its decision making. DE is an after-tax measure that reflects the ongoing operating performance of the Company’s core business by including earnings that are realized and generally excluding non-cash expenses, other income (loss) items that are unrealized and items that may not be indicative of core operating results. Realized earnings included in DE are generally comprised of fee revenue, including all incentive fees, realized principal investment income (loss), distributed carried interest, interest and dividend income. Income (loss) on principal investments is realized generally when all or a portion of an investment is disposed, redeemed or repaid or if the Company no longer retains control, or when the Company receives income such as dividends, interest or other distributions of earnings. The following items are excluded from DE: transaction-related costs; non-core items; other gain (loss); unrealized principal investment income (loss); non-cash depreciation and amortization expense, non-cash impairment charges (if any); amortization of deferred financing costs, debt premiums and discounts; our share of unrealized carried interest allocation, net of associated expense; non-cash equity-based compensation costs; and preferred stock redemption gain (loss). Transaction-related costs are incurred in connection with acquisitions and costs of unconsummated transactions. Non-core items primarily include acquisition-related compensation and certain severance costs, as well as litigation and settlement-related matters, which are presented within compensation expense—cash and equity-based, administrative and other expenses, and other gain (loss), net on the GAAP income statement. These costs, along with certain other gain (loss) amounts, are excluded from DE as they are related to discrete items, are not considered part of our ongoing operating cost structure, and are not reflective of our core operating performance. Other items excluded from DE are generally non-cash in nature, including income (loss) items that are unrealized, or otherwise do not represent current or future cash obligations. These items are excluded from DE as they do not contribute to the measurement of DE as a net realized earnings measure that is used in decision making related to distributions and reinvestments. Income taxes applied in the determination of DE generally represents GAAP income tax related to continued operations, and includes the benefit of deductions available to the Company on certain expense items excluded from DE (for example, equity-based compensation). As the income tax benefit arising from these excluded expense items do affect actual income tax paid or payable by the Company in any one period, the Company believes their inclusion in DE is appropriate to more accurately reflect amounts available for distribution.
25 DEFINITIONS Catch-up Fees Catch-up fees are management fees charged in any given period that pertain to prior periods. With respect to subsequent closing of commitments during the fundraising period, management fees based upon commitments are charged retroactively to the fee activation date at initial closing of the fund through the subsequent close date. Fee-Earning Equity Under Management (“FEEUM”) FEEUM represents the total capital managed by the Company and its affiliates that earns management fees and/or incentive fees or carried interest. FEEUM is generally based upon committed capital, invested capital, net asset value (“NAV”) or gross asset value (“GAV”), pursuant to the terms of each underlying investment management agreement. Fee Related Earnings Margin ("FRE Margin") FRE Margin % represents FRE divided by FRE fee revenue. GP Affiliated Investments GP Affiliated Investments represent principal investments in DBRG’s sponsored funds as general partner and as an affiliate of the general partner, and to a lesser extent, other investments associated with DBRG’s investment management business, including CLO subordinated notes, but excluding carried interest allocation. Investments that are considered to be non-core to DBRG’s investment management business are excluded. Operating Company or OP DigitalBridge Operating Company, LLC, the operating partnership through which DBRG conducts all of its activities and holds substantially all of its assets and liabilities. OP share Represents the Company’s interest through the Operating Company and excludes redeemable noncontrolling interests and noncontrolling interests in investment entities.

26