
1 Q2 | 2026 Q2 2026 Earnings August 4, 2026
2 Q2 | 2026 Forward-Looking Statements Certain statements contained in this presentation include, and OPENLANE may make related oral, "forward-looking statements" within the meaning of the Private Securities Litigation Reform Act of 1995. In particular, statements made that are not historical facts (including but not limited to expectations, estimates, assumptions, projections and/or financial guidance) may be forward-looking statements. Words such as "should," "may," "will," "would," "anticipate," "expect," "project," "intend,“ “contemplate,” "plan," "believe," "seek," "estimate," "assume," “can,” "could," "continue,” "outlook," “target” and similar expressions identify forward-looking statements. Such statements are based on management's current assumptions, expectations and/or beliefs, are not guarantees of future performance and are subject to substantial risks, uncertainties and changes that could cause actual results to differ materially from the results projected, expressed or implied by these forward-looking statements. Factors that could cause or contribute to such differences include, but are not limited to, those discussed in the section entitled "Risk Factors" in OPENLANE’s annual and quarterly periodic reports, and in OPENLANE’s other filings and reports filed with the Securities and Exchange Commission. Many of these risk factors are outside of our control, and as such, they involve risks which are not currently known that could cause actual results to differ materially from those discussed or implied herein. The forward-looking statements are made as of the date of this presentation. OPENLANE undertakes no obligation to update any forward-looking statements. Non-GAAP Financial Measures In addition to the financial measures contained in this presentation that are prepared in accordance with U.S. Generally Accepted Accounting Principles (“GAAP”), this presentation also includes certain non-GAAP financial measures. EBITDA, Adjusted EBITDA, Adjusted EBITDA Margin, Free Cash Flow, Adjusted Free Cash Flow, Adjusted Free Cash Flow Conversion, Operating adjusted income, and Operating adjusted income per diluted share (or “Operating Adjusted EPS”) as presented herein are supplemental measures of our performance and liquidity that are not required by, or presented in accordance with GAAP. The presentation of these non-GAAP financial measures is not intended to be considered in isolation or as a substitute for, or superior to, financial information prepared and presented in accordance with GAAP. Management believes that these measures provide investors additional meaningful methods to evaluate certain aspects of OPENLANE’s results period over period and for the other reasons set forth below. These non-GAAP financial measures may not be comparable to similarly titled measures reported by other companies. Reconciliations of each non-GAAP financial measure to its most comparable GAAP financial measure are provided in the Reconciliations section of the presentation. EBITDA is defined as net income (loss), plus interest expense net of interest income, income tax provision (benefit), depreciation and amortization. Adjusted EBITDA is EBITDA adjusted for the items of income and expense and expected incremental revenue and cost savings as described in our senior secured credit agreement covenant calculations. Management believes that the inclusion of supplementary adjustments to EBITDA applied in presenting Adjusted EBITDA is appropriate to provide additional information to investors about one of the principal measures of performance used by our creditors. In addition, management uses EBITDA and Adjusted EBITDA to evaluate our performance. Adjusted EBITDA Margin represents Adjusted EBITDA divided by revenue. Free Cash Flow (or “FCF”) is defined as net cash provided by operating activities, less purchases of property, equipment and computer software. Adjusted Free Cash Flow is Free Cash Flow adjusted for the cash portion of EBITDA addbacks to calculate Adjusted EBITDA, the net change in finance receivables held for investment and the net change in obligations collateralized by finance receivables. Management uses Adjusted Free Cash Flow to measure the funds generated in a given period that are available for capital allocation. Adjusted Free Cash Flow Conversion represents Adjusted Free Cash Flow divided by Adjusted EBITDA. Operating adjusted income is defined as net income adjusted for acquired amortization expense, gains/losses on sale of property or businesses, impairments to goodwill or other intangible assets and certain other non-recurring items. Amortization expense associated with acquired intangible assets is not representative of ongoing capital expenditures but has a continuing effect on our reported results. Management believes Operating adjusted income provides comparability to other companies that may not have incurred these types of non-cash expenses or that report a similar measure. Operating Adjusted EPS represents Operating adjusted income divided by weighted average diluted shares, with preferred shares treated as converted for the entire period.
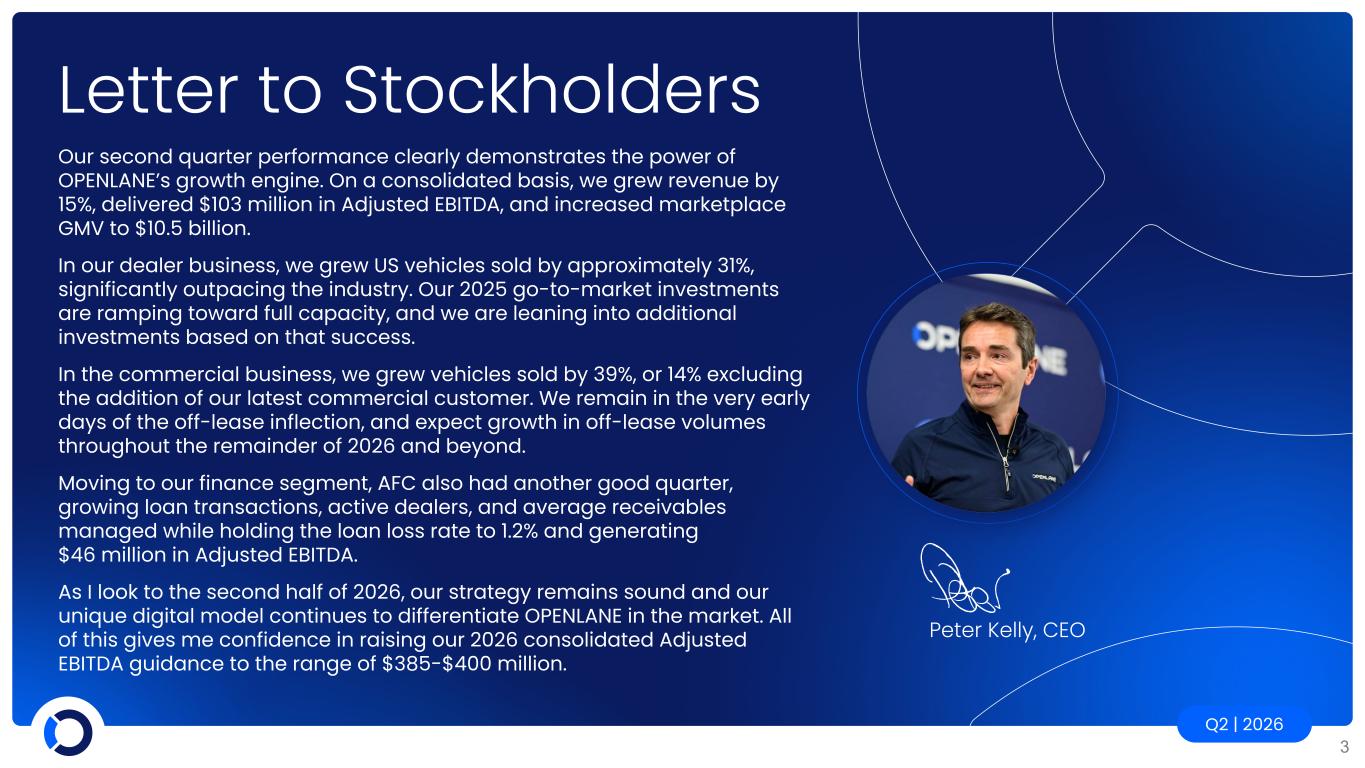
3 Q2 | 2026 Letter to Stockholders Peter Kelly, CEO Our second quarter performance clearly demonstrates the power of OPENLANE’s growth engine. On a consolidated basis, we grew revenue by 15%, delivered $103 million in Adjusted EBITDA, and increased marketplace GMV to $10.5 billion. In our dealer business, we grew US vehicles sold by approximately 31%, significantly outpacing the industry. Our 2025 go-to-market investments are ramping toward full capacity, and we are leaning into additional investments based on that success. In the commercial business, we grew vehicles sold by 39%, or 14% excluding the addition of our latest commercial customer. We remain in the very early days of the off-lease inflection, and expect growth in off-lease volumes throughout the remainder of 2026 and beyond. Moving to our finance segment, AFC also had another good quarter, growing loan transactions, active dealers, and average receivables managed while holding the loan loss rate to 1.2% and generating $46 million in Adjusted EBITDA. As I look to the second half of 2026, our strategy remains sound and our unique digital model continues to differentiate OPENLANE in the market. All of this gives me confidence in raising our 2026 consolidated Adjusted EBITDA guidance to the range of $385-$400 million.
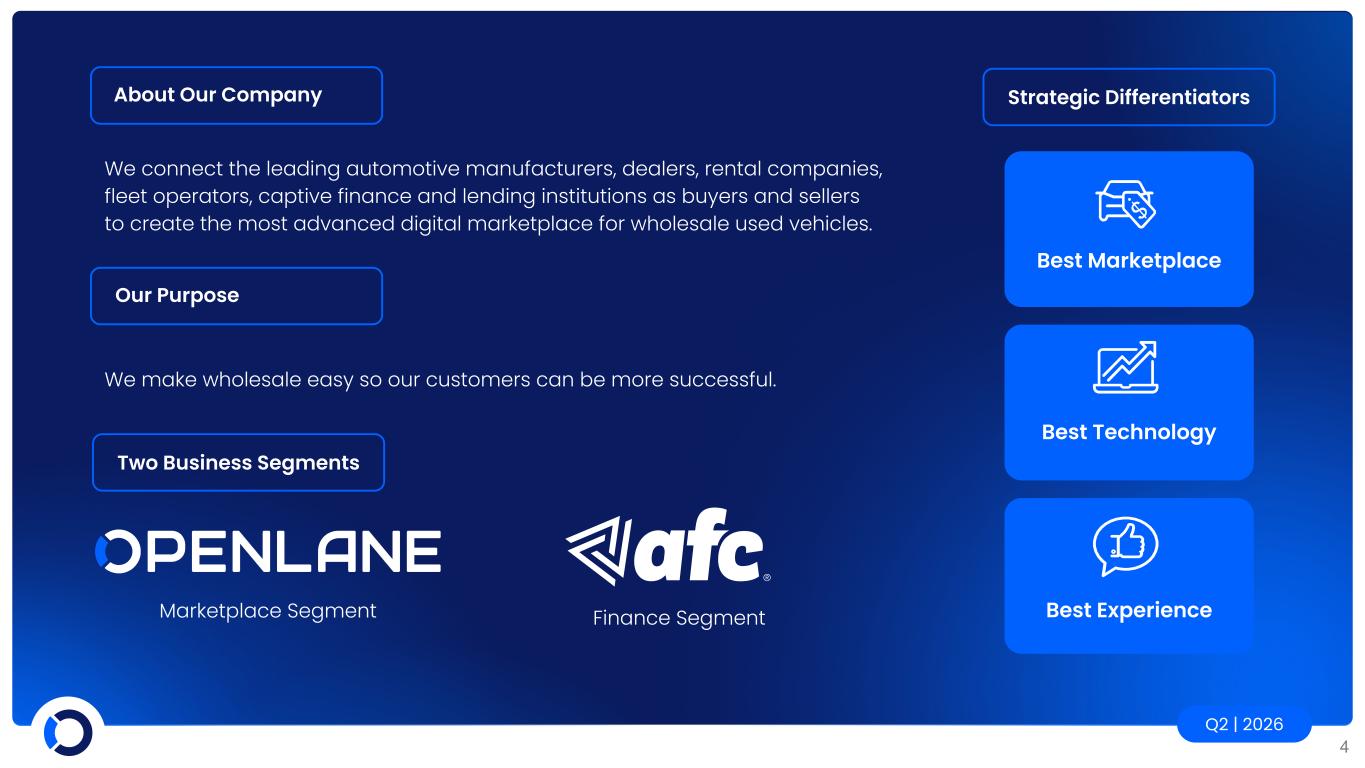
Q2 | 2026 4 We connect the leading automotive manufacturers, dealers, rental companies, fleet operators, captive finance and lending institutions as buyers and sellers to create the most advanced digital marketplace for wholesale used vehicles. Marketplace Segment About Our Company Two Business Segments Finance Segment Best Marketplace Best Experience Best Technology Strategic Differentiators Our Purpose We make wholesale easy so our customers can be more successful.
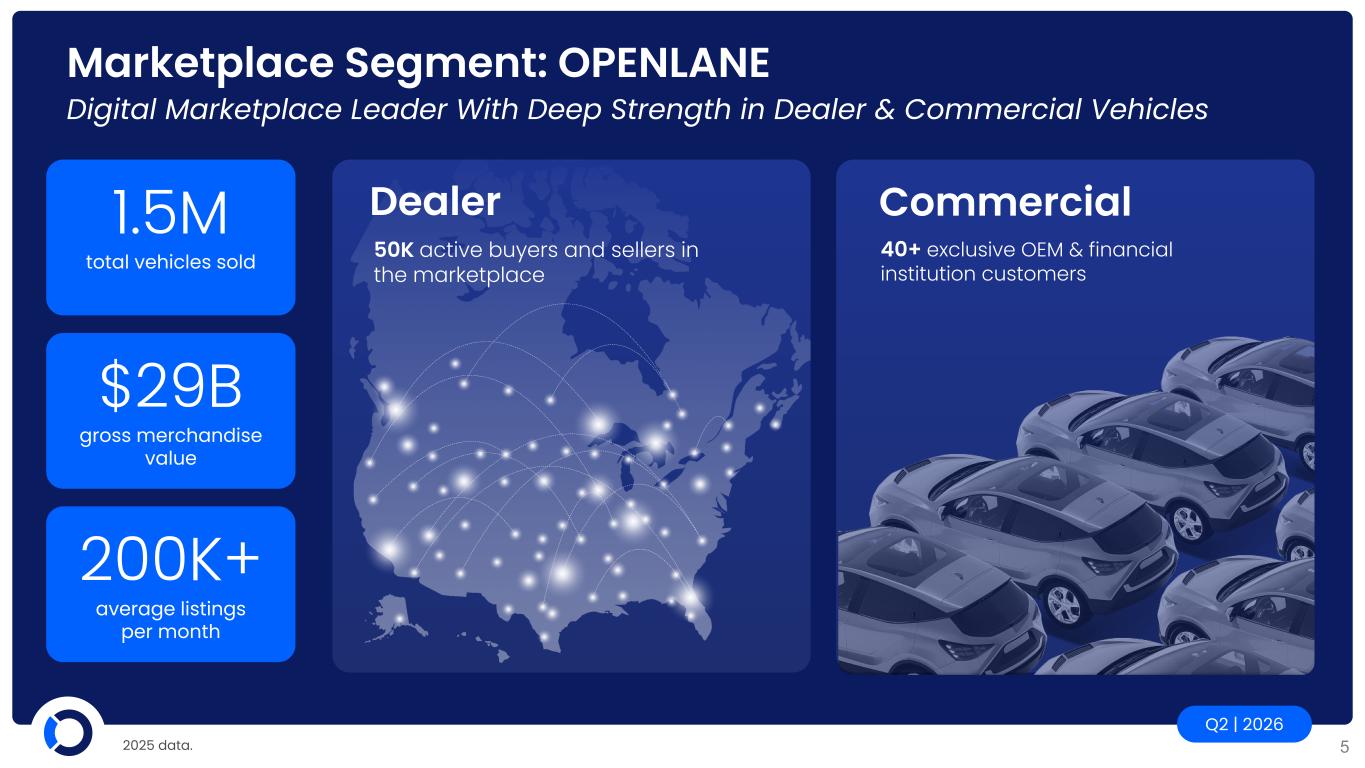
Q2 | 2026 5 total vehicles sold average listings per month gross merchandise value 1.5M 200K+ $29B Commercial 40+ exclusive OEM & financial institution customers Marketplace Segment: OPENLANE Digital Marketplace Leader With Deep Strength in Dealer & Commercial Vehicles Dealer 50K active buyers and sellers in the marketplace 2025 data.
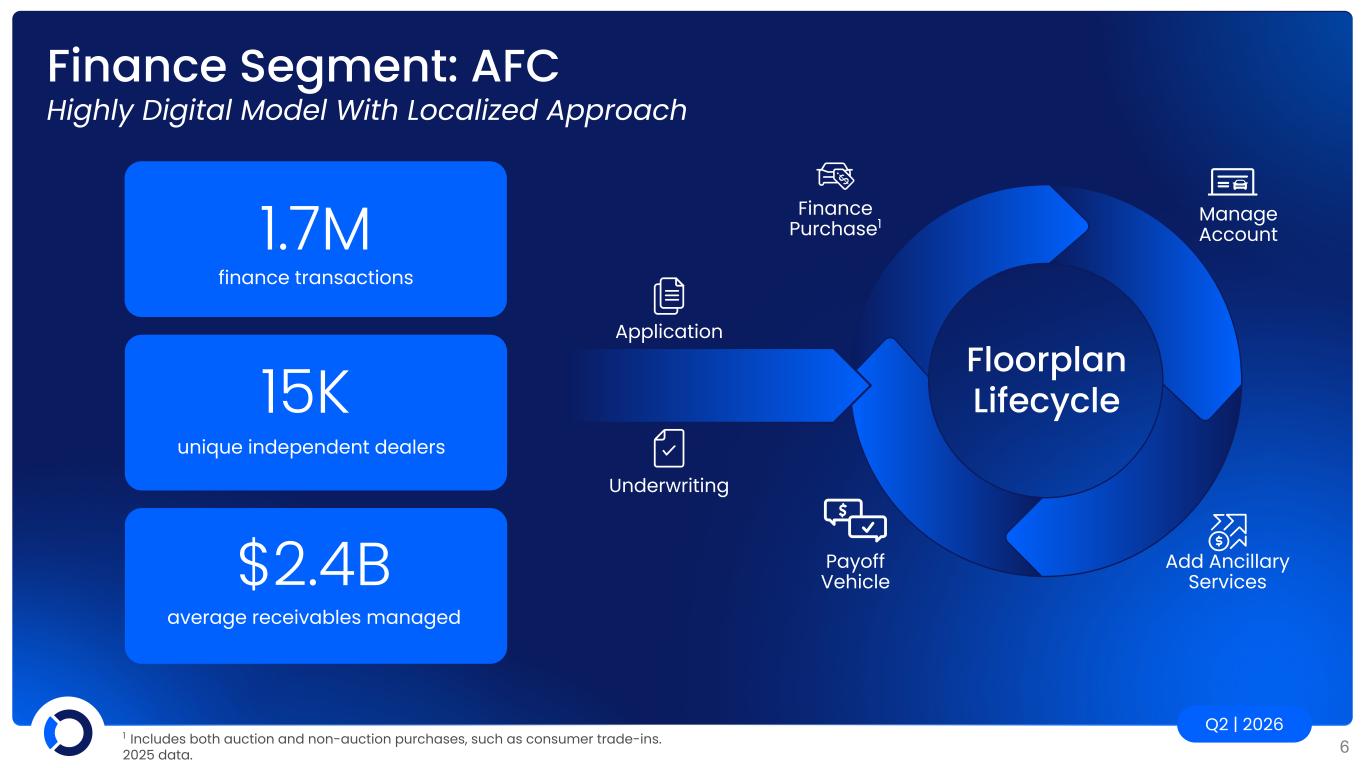
Q2 | 2026 6 Floorplan Lifecycle Finance Segment: AFC Highly Digital Model With Localized Approach Finance Purchase1 Manage Account Add Ancillary Services Payoff Vehicle Application Underwriting finance transactions 1.7M 1.5-2% 15K unique independent dealers $2.4B average receivables managed 1 Includes both auction and non-auction purchases, such as consumer trade-ins. 2025 data.
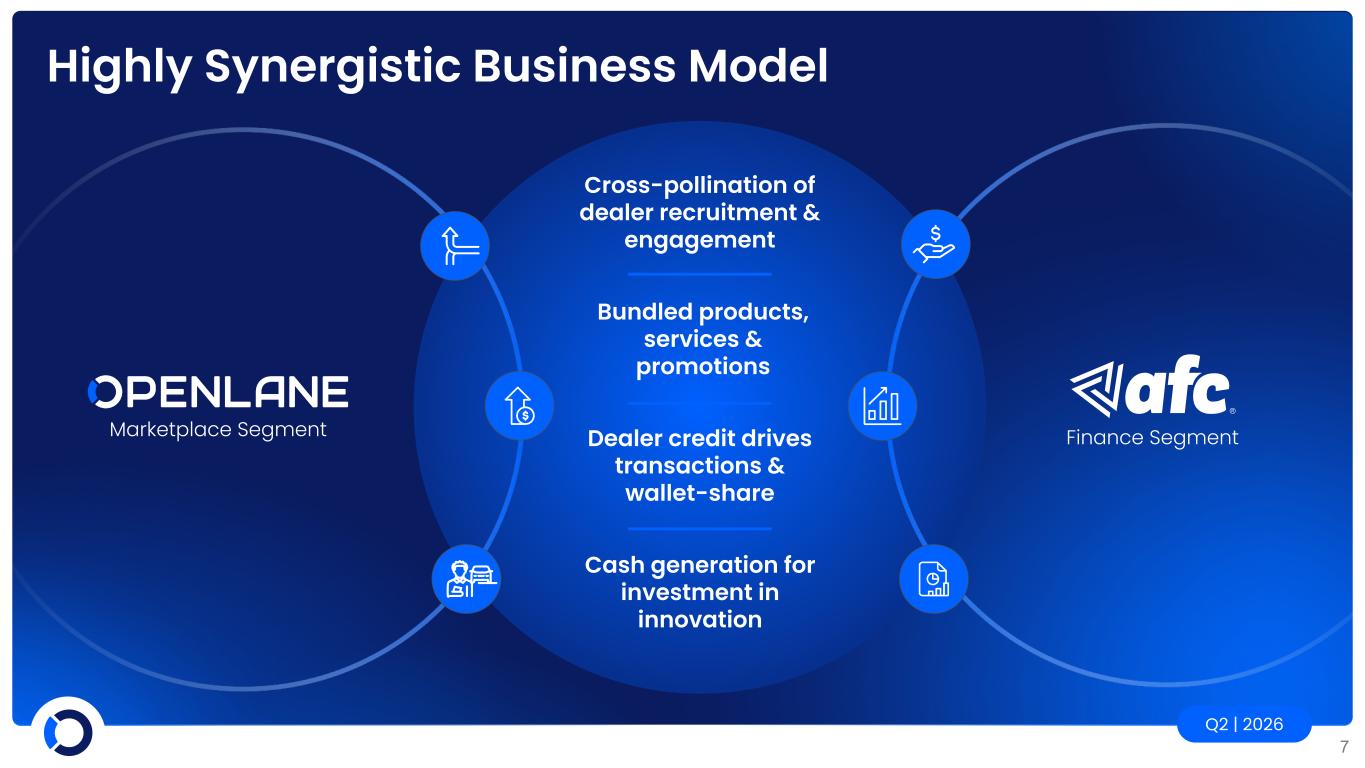
Q2 | 2026 7 Highly Synergistic Business Model Marketplace Segment Finance Segment Cross-pollination of dealer recruitment & engagement Dealer credit drives transactions & wallet-share Bundled products, services & promotions Cash generation for investment in innovation

8 Q2 | 2026 Financial Highlights
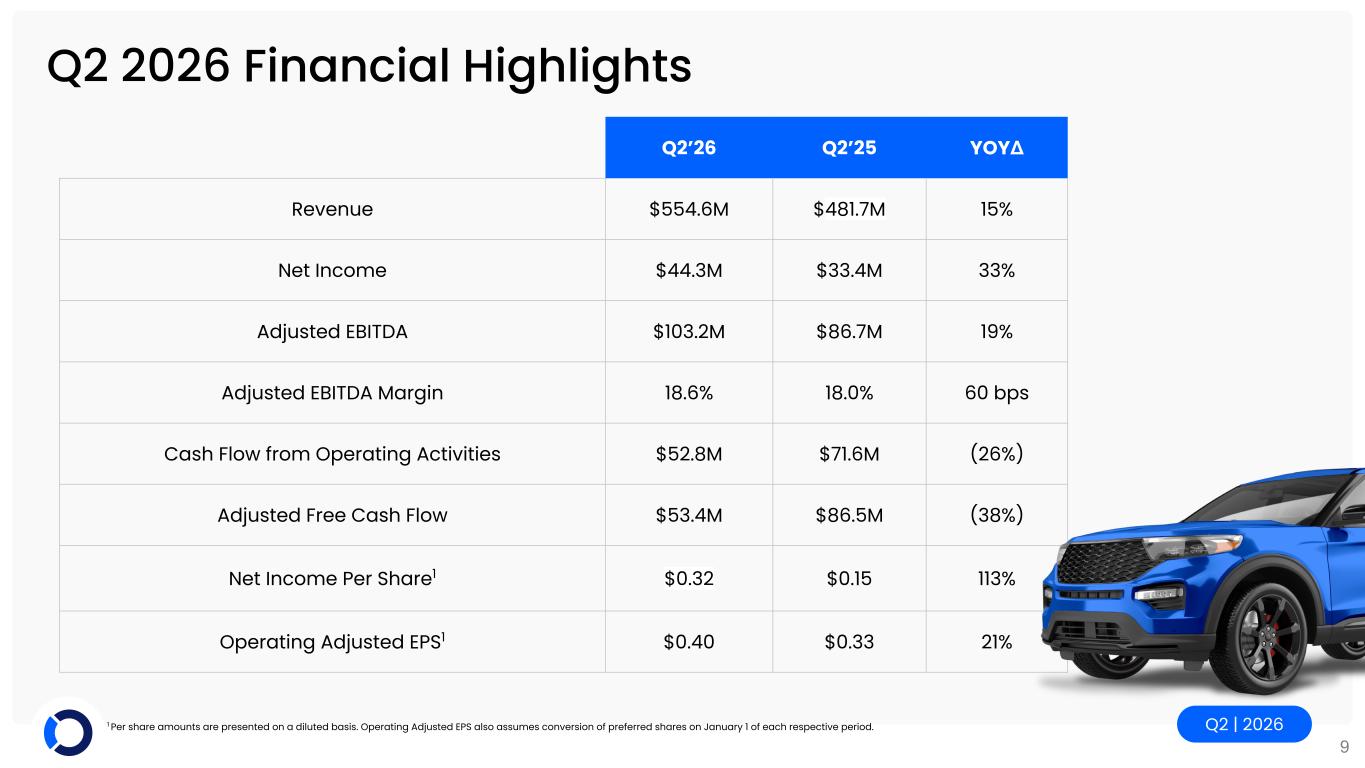
Q2 | 2026 9 Q2 2026 Financial Highlights Q2’26 Q2’25 YOYΔ Revenue $554.6M $481.7M 15% Net Income $44.3M $33.4M 33% Adjusted EBITDA $103.2M $86.7M 19% Adjusted EBITDA Margin 18.6% 18.0% 60 bps Cash Flow from Operating Activities $52.8M $71.6M (26%) Adjusted Free Cash Flow $53.4M $86.5M (38%) Net Income Per Share1 $0.32 $0.15 113% Operating Adjusted EPS1 $0.40 $0.33 21% 1 Per share amounts are presented on a diluted basis. Operating Adjusted EPS also assumes conversion of preferred shares on January 1 of each respective period.
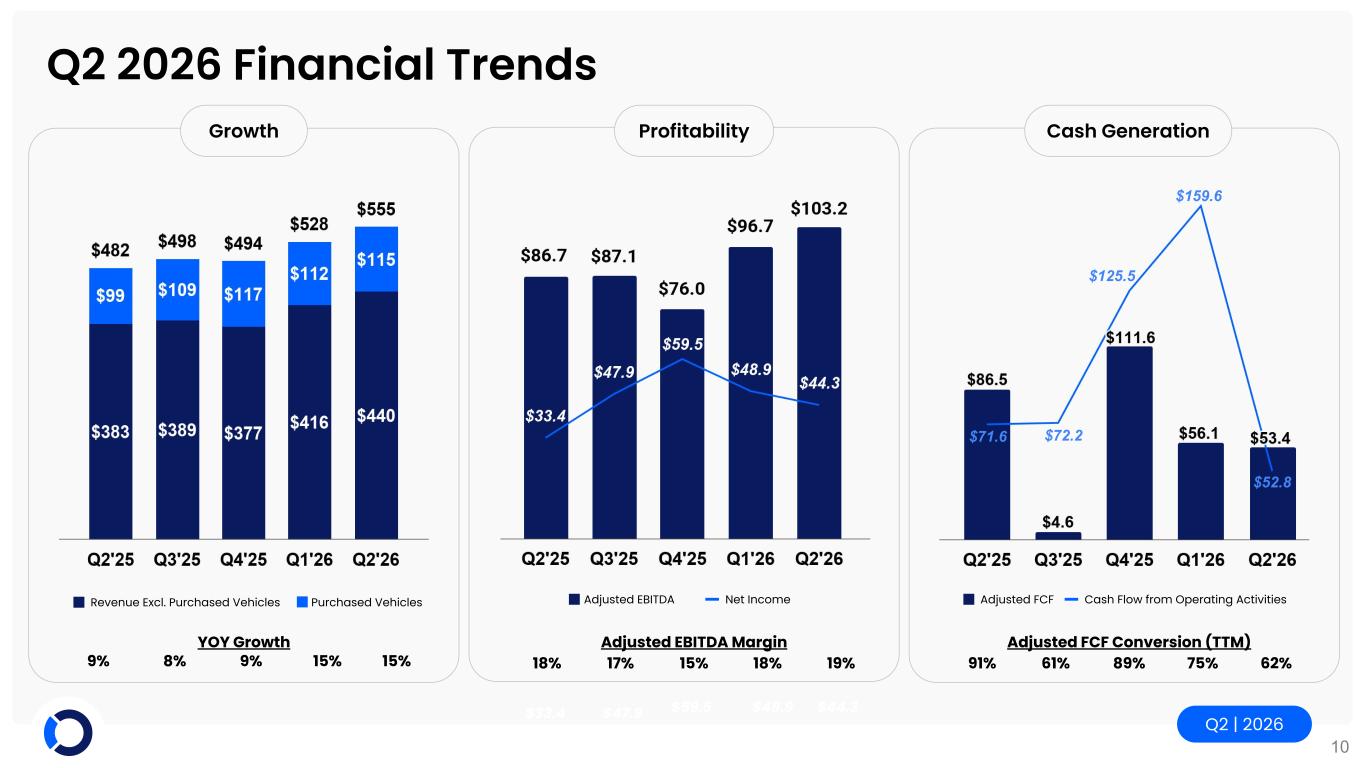
Q2 | 2026 10 Growth Q2 2026 Financial Trends Profitability Cash Generation YOY Growth 9% 8% 9% 15% 15% Adjusted EBITDA Margin 18% 17% 15% 18% 19% Adjusted EBITDA Net IncomeRevenue Excl. Purchased Vehicles Adjusted FCF Cash Flow from Operating ActivitiesPurchased Vehicles Adjusted FCF Conversion (TTM) 91% 61% 89% 75% 62% $33.4 $47.9 $59.5 $48.9 $44.3 $52.8 $159.6 $125.5 $72.2$71.6
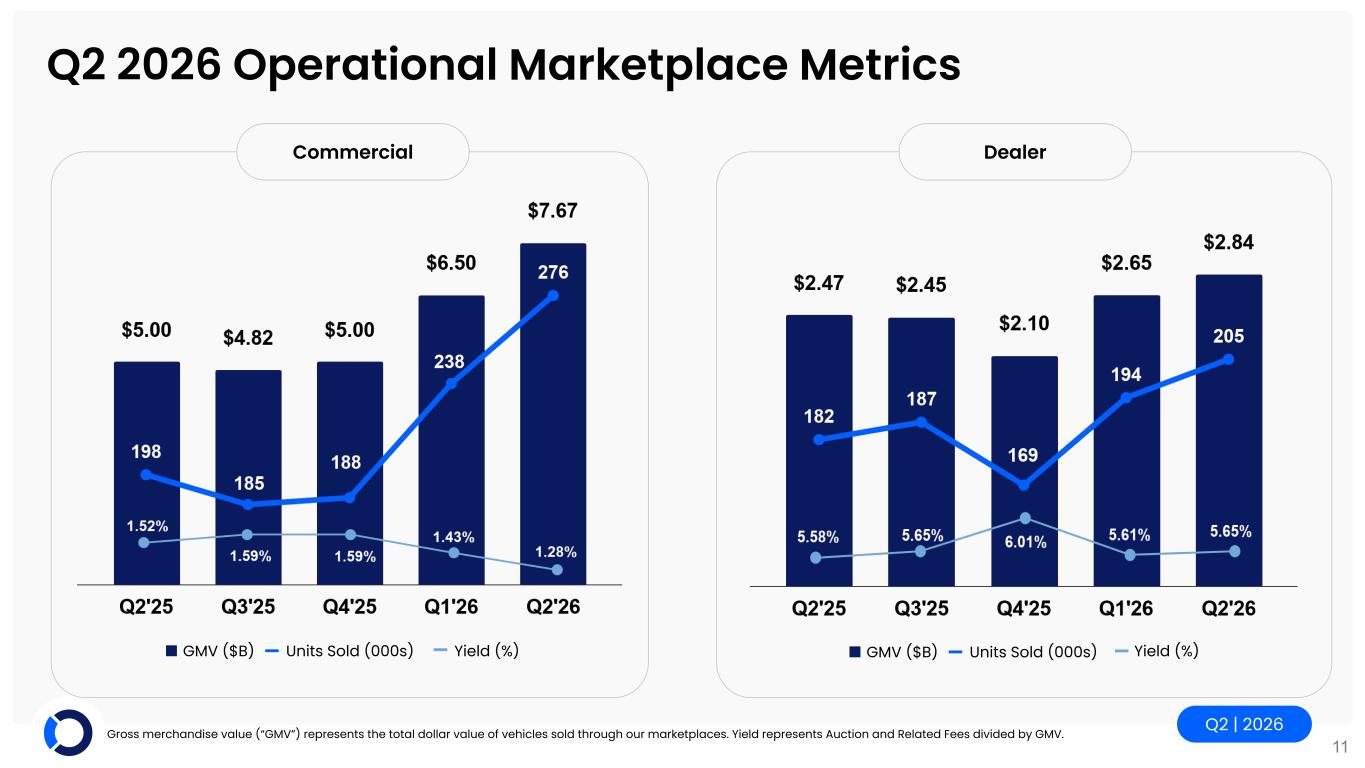
Q2 | 2026 11 Dealer Q2 2026 Operational Marketplace Metrics Commercial GMV ($B) Units Sold (000s) Yield (%)GMV ($B) Units Sold (000s) Yield (%) Gross merchandise value (“GMV”) represents the total dollar value of vehicles sold through our marketplaces. Yield represents Auction and Related Fees divided by GMV.
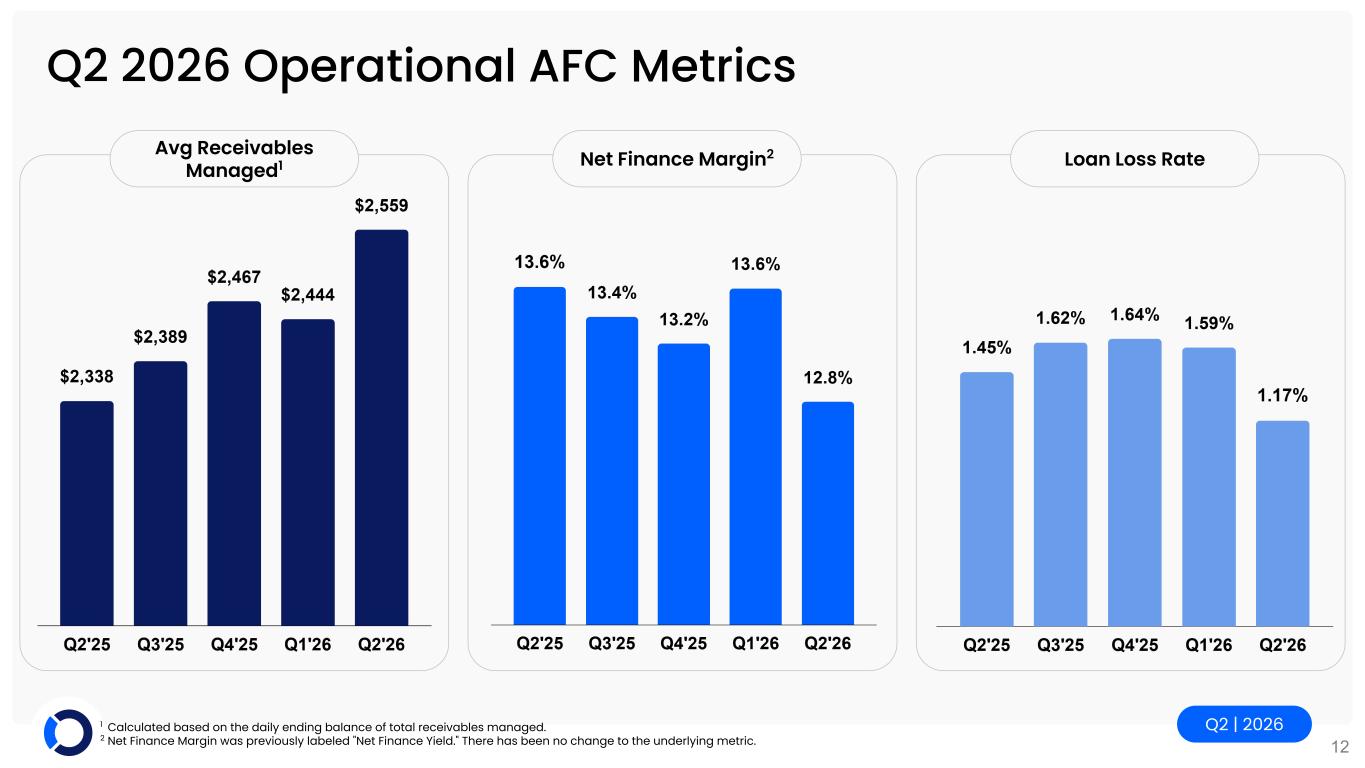
Q2 | 2026 12 Q2 2026 Operational AFC Metrics Net Finance Margin2 Loan Loss Rate 1 Calculated based on the daily ending balance of total receivables managed. 2 Net Finance Margin was previously labeled "Net Finance Yield." There has been no change to the underlying metric. Avg Receivables Managed1
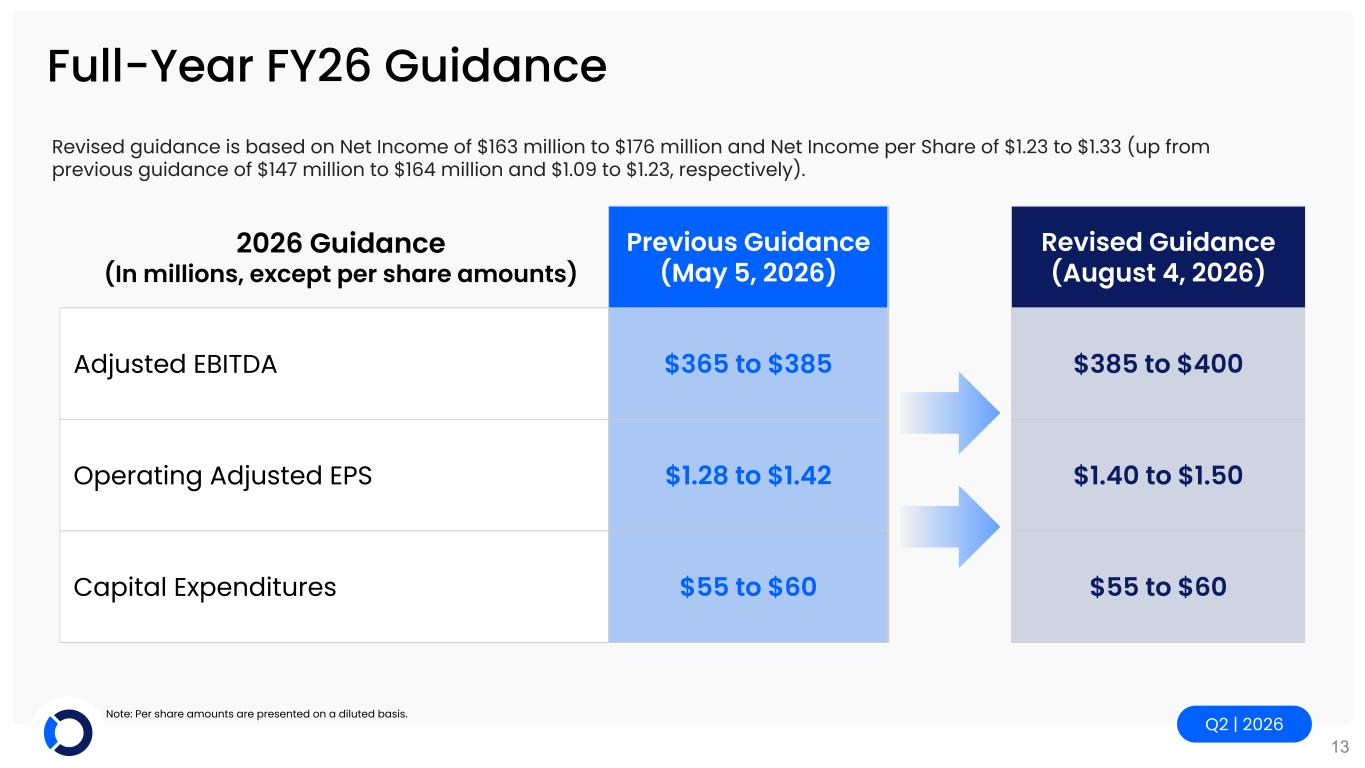
Q2 | 2026 13 Full-Year FY26 Guidance 2026 Guidance (In millions, except per share amounts) Previous Guidance (May 5, 2026) Revised Guidance (August 4, 2026) Adjusted EBITDA $365 to $385 $385 to $400 Operating Adjusted EPS $1.28 to $1.42 $1.40 to $1.50 Capital Expenditures $55 to $60 $55 to $60 Note: Per share amounts are presented on a diluted basis. Revised guidance is based on Net Income of $163 million to $176 million and Net Income per Share of $1.23 to $1.33 (up from previous guidance of $147 million to $164 million and $1.09 to $1.23, respectively).

14 Q2 | 2026 Reconciliations and Other
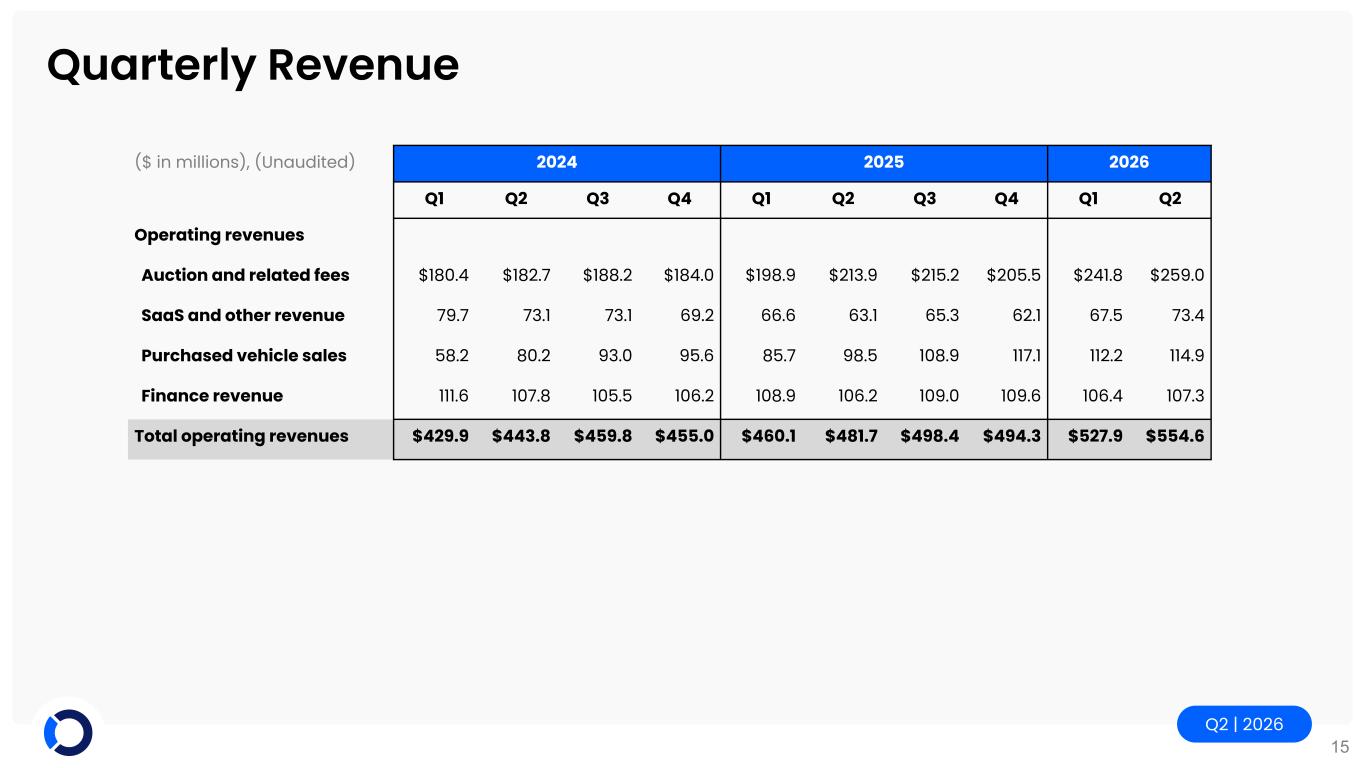
Q2 | 2026 15 Quarterly Revenue ($ in millions), (Unaudited) 2024 2025 2026 Q1 Q2 Q3 Q4 Q1 Q2 Q3 Q4 Q1 Q2 Operating revenues Auction and related fees $180.4 $182.7 $188.2 $184.0 $198.9 $213.9 $215.2 $205.5 $241.8 $259.0 SaaS and other revenue 79.7 73.1 73.1 69.2 66.6 63.1 65.3 62.1 67.5 73.4 Purchased vehicle sales 58.2 80.2 93.0 95.6 85.7 98.5 108.9 117.1 112.2 114.9 Finance revenue 111.6 107.8 105.5 106.2 108.9 106.2 109.0 109.6 106.4 107.3 Total operating revenues $429.9 $443.8 $459.8 $455.0 $460.1 $481.7 $498.4 $494.3 $527.9 $554.6
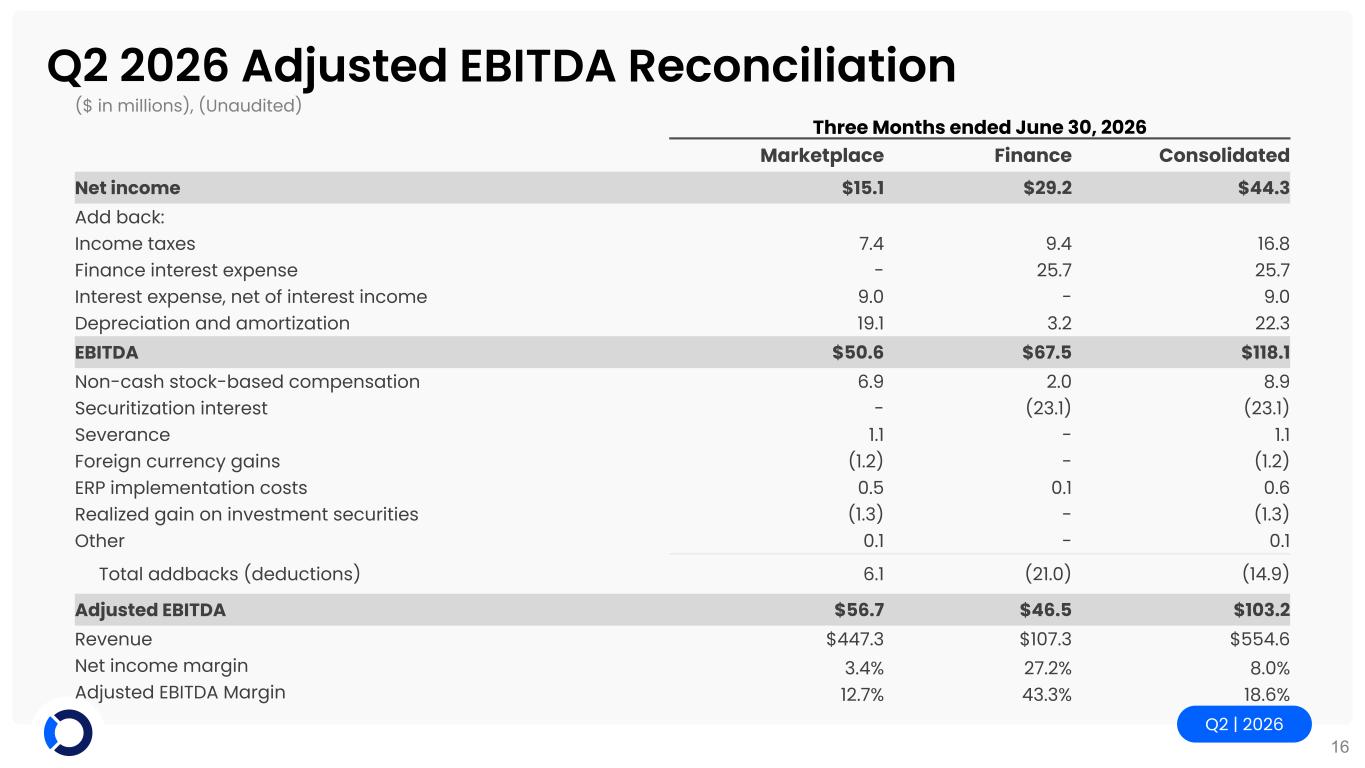
Q2 | 2026 16 Q2 2026 Adjusted EBITDA Reconciliation ($ in millions), (Unaudited) Three Months ended June 30, 2026 Marketplace Finance Consolidated Net income $15.1 $29.2 $44.3 Add back: Income taxes 7.4 9.4 16.8 Finance interest expense - 25.7 25.7 Interest expense, net of interest income 9.0 - 9.0 Depreciation and amortization 19.1 3.2 22.3 EBITDA $50.6 $67.5 $118.1 Non-cash stock-based compensation 6.9 2.0 8.9 Securitization interest - (23.1) (23.1) Severance 1.1 - 1.1 Foreign currency gains (1.2) - (1.2) ERP implementation costs 0.5 0.1 0.6 Realized gain on investment securities (1.3) - (1.3) Other 0.1 - 0.1 Total addbacks (deductions) 6.1 (21.0) (14.9) Adjusted EBITDA $56.7 $46.5 $103.2 Revenue $447.3 $107.3 $554.6 Net income margin 3.4% 27.2% 8.0% Adjusted EBITDA Margin 12.7% 43.3% 18.6%
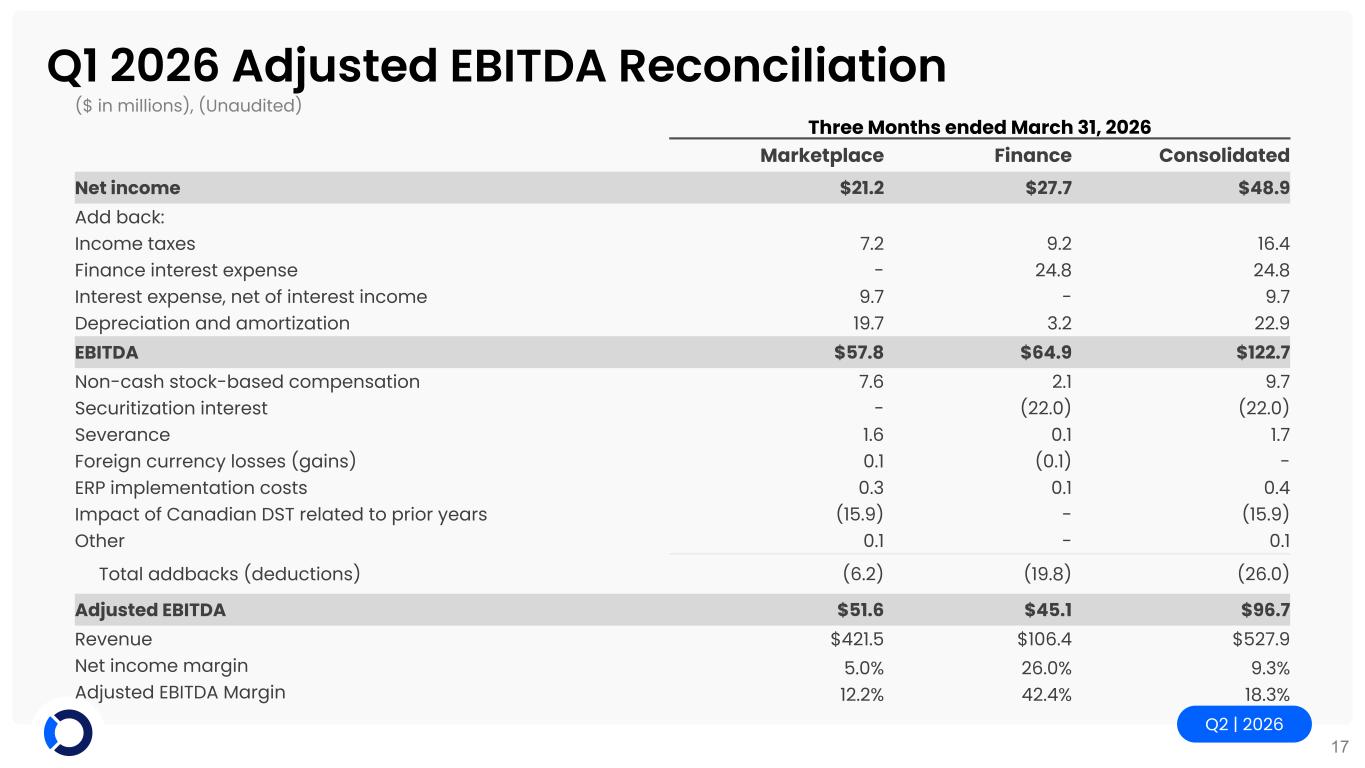
Q2 | 2026 17 Q1 2026 Adjusted EBITDA Reconciliation ($ in millions), (Unaudited) Three Months ended March 31, 2026 Marketplace Finance Consolidated Net income $21.2 $27.7 $48.9 Add back: Income taxes 7.2 9.2 16.4 Finance interest expense - 24.8 24.8 Interest expense, net of interest income 9.7 - 9.7 Depreciation and amortization 19.7 3.2 22.9 EBITDA $57.8 $64.9 $122.7 Non-cash stock-based compensation 7.6 2.1 9.7 Securitization interest - (22.0) (22.0) Severance 1.6 0.1 1.7 Foreign currency losses (gains) 0.1 (0.1) - ERP implementation costs 0.3 0.1 0.4 Impact of Canadian DST related to prior years (15.9) - (15.9) Other 0.1 - 0.1 Total addbacks (deductions) (6.2) (19.8) (26.0) Adjusted EBITDA $51.6 $45.1 $96.7 Revenue $421.5 $106.4 $527.9 Net income margin 5.0% 26.0% 9.3% Adjusted EBITDA Margin 12.2% 42.4% 18.3%
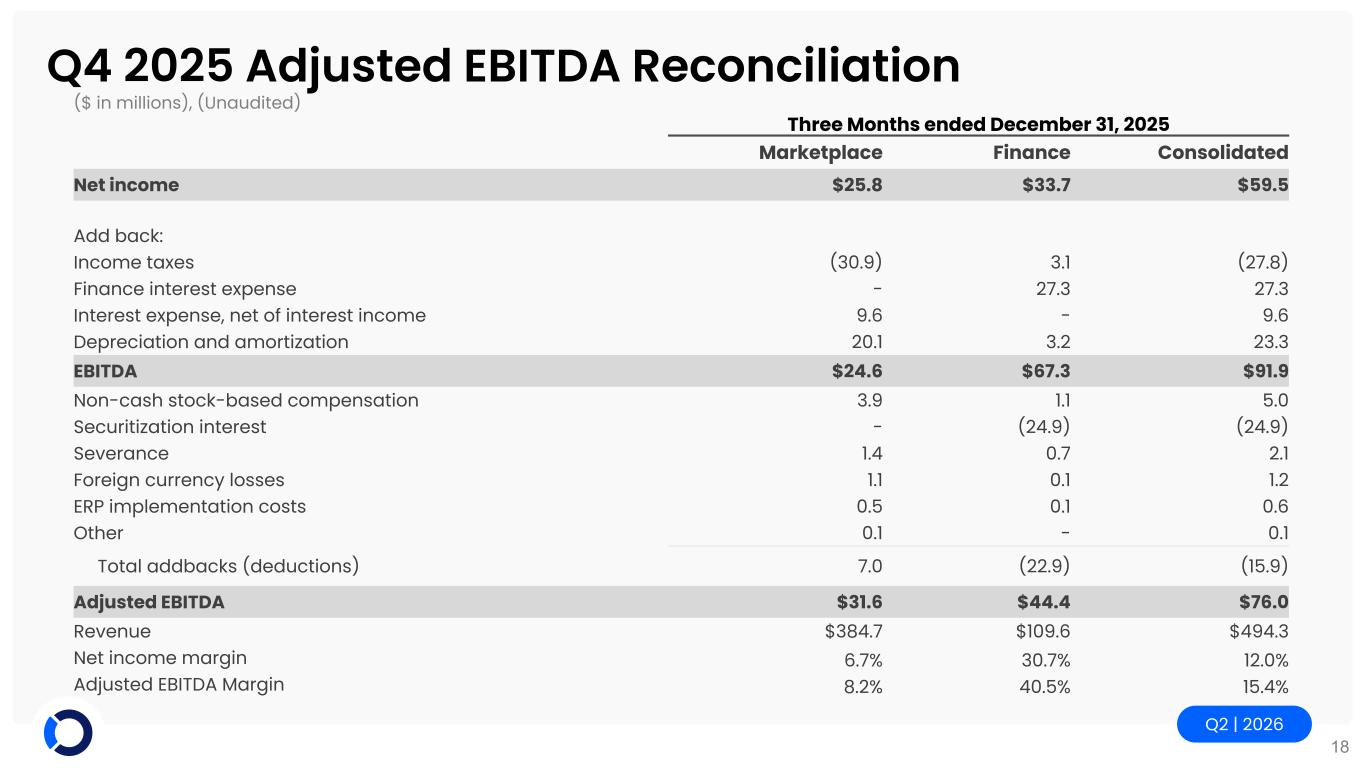
Q2 | 2026 18 Q4 2025 Adjusted EBITDA Reconciliation ($ in millions), (Unaudited) Three Months ended December 31, 2025 Marketplace Finance Consolidated Net income $25.8 $33.7 $59.5 Add back: Income taxes (30.9) 3.1 (27.8) Finance interest expense - 27.3 27.3 Interest expense, net of interest income 9.6 - 9.6 Depreciation and amortization 20.1 3.2 23.3 EBITDA $24.6 $67.3 $91.9 Non-cash stock-based compensation 3.9 1.1 5.0 Securitization interest - (24.9) (24.9) Severance 1.4 0.7 2.1 Foreign currency losses 1.1 0.1 1.2 ERP implementation costs 0.5 0.1 0.6 Other 0.1 - 0.1 Total addbacks (deductions) 7.0 (22.9) (15.9) Adjusted EBITDA $31.6 $44.4 $76.0 Revenue $384.7 $109.6 $494.3 Net income margin 6.7% 30.7% 12.0% Adjusted EBITDA Margin 8.2% 40.5% 15.4%
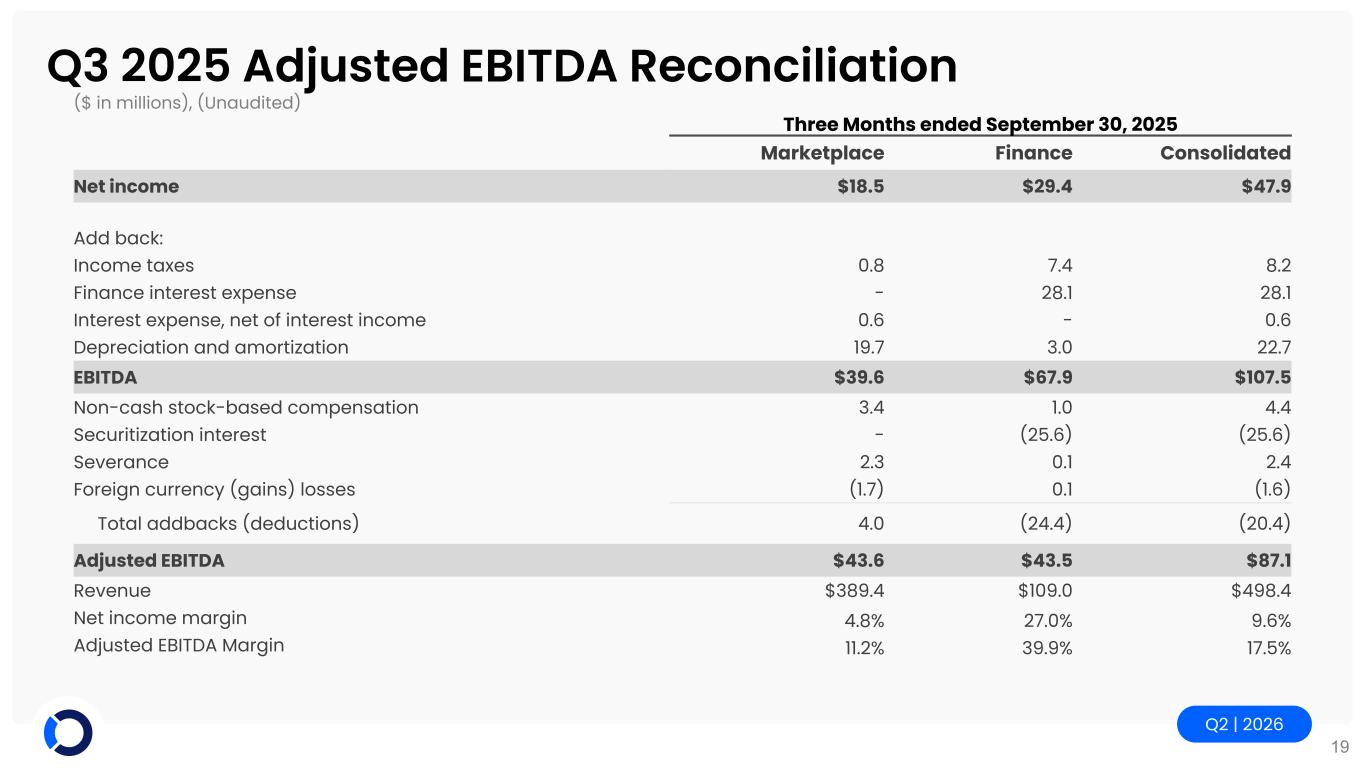
Q2 | 2026 19 Q3 2025 Adjusted EBITDA Reconciliation ($ in millions), (Unaudited) Three Months ended September 30, 2025 Marketplace Finance Consolidated Net income $18.5 $29.4 $47.9 Add back: Income taxes 0.8 7.4 8.2 Finance interest expense - 28.1 28.1 Interest expense, net of interest income 0.6 - 0.6 Depreciation and amortization 19.7 3.0 22.7 EBITDA $39.6 $67.9 $107.5 Non-cash stock-based compensation 3.4 1.0 4.4 Securitization interest - (25.6) (25.6) Severance 2.3 0.1 2.4 Foreign currency (gains) losses (1.7) 0.1 (1.6) Total addbacks (deductions) 4.0 (24.4) (20.4) Adjusted EBITDA $43.6 $43.5 $87.1 Revenue $389.4 $109.0 $498.4 Net income margin 4.8% 27.0% 9.6% Adjusted EBITDA Margin 11.2% 39.9% 17.5%
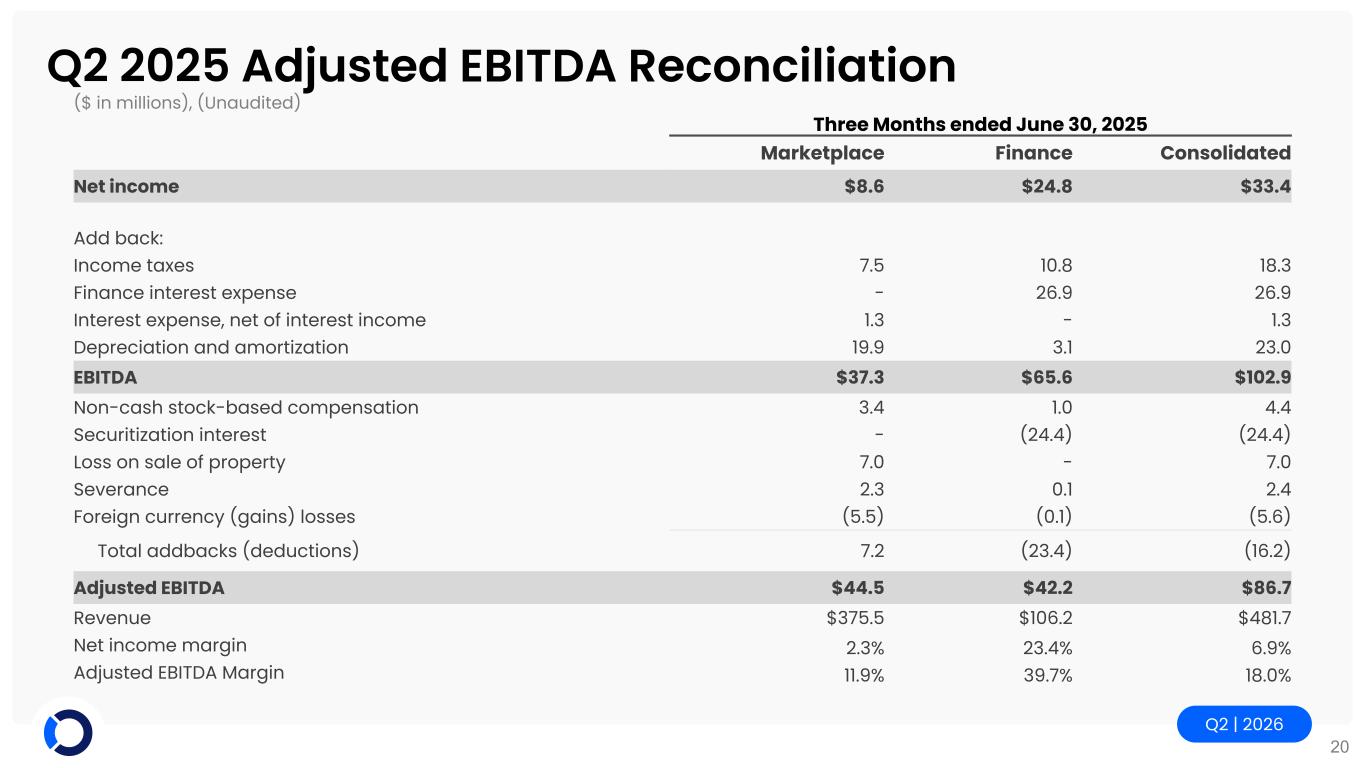
Q2 | 2026 20 Q2 2025 Adjusted EBITDA Reconciliation ($ in millions), (Unaudited) Three Months ended June 30, 2025 Marketplace Finance Consolidated Net income $8.6 $24.8 $33.4 Add back: Income taxes 7.5 10.8 18.3 Finance interest expense - 26.9 26.9 Interest expense, net of interest income 1.3 - 1.3 Depreciation and amortization 19.9 3.1 23.0 EBITDA $37.3 $65.6 $102.9 Non-cash stock-based compensation 3.4 1.0 4.4 Securitization interest - (24.4) (24.4) Loss on sale of property 7.0 - 7.0 Severance 2.3 0.1 2.4 Foreign currency (gains) losses (5.5) (0.1) (5.6) Total addbacks (deductions) 7.2 (23.4) (16.2) Adjusted EBITDA $44.5 $42.2 $86.7 Revenue $375.5 $106.2 $481.7 Net income margin 2.3% 23.4% 6.9% Adjusted EBITDA Margin 11.9% 39.7% 18.0%
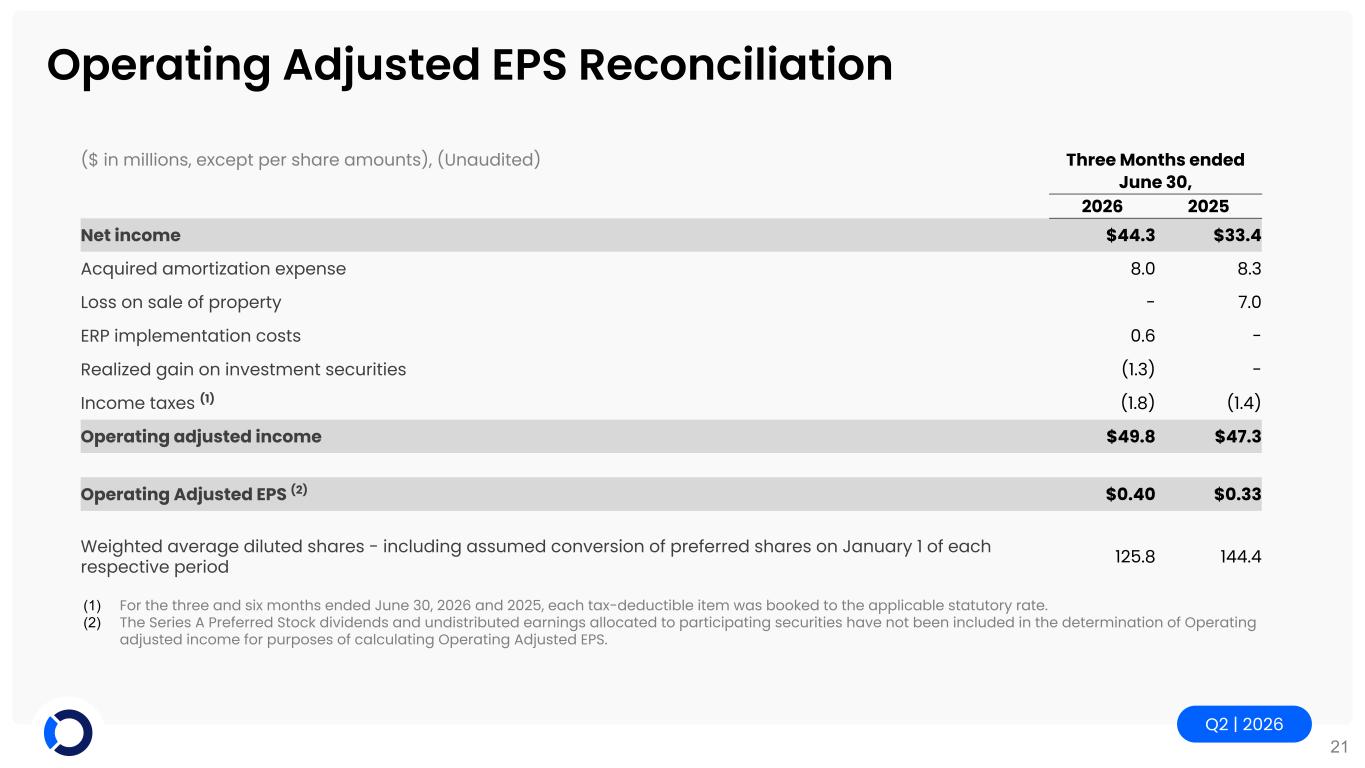
Q2 | 2026 21 Operating Adjusted EPS Reconciliation ($ in millions, except per share amounts), (Unaudited) Three Months ended June 30, 2026 2025 Net income $44.3 $33.4 Acquired amortization expense 8.0 8.3 Loss on sale of property - 7.0 ERP implementation costs 0.6 - Realized gain on investment securities (1.3) - Income taxes (1) (1.8) (1.4) Operating adjusted income $49.8 $47.3 Operating Adjusted EPS (2) $0.40 $0.33 Weighted average diluted shares - including assumed conversion of preferred shares on January 1 of each respective period 125.8 144.4 (1) For the three and six months ended June 30, 2026 and 2025, each tax-deductible item was booked to the applicable statutory rate. (2) The Series A Preferred Stock dividends and undistributed earnings allocated to participating securities have not been included in the determination of Operating adjusted income for purposes of calculating Operating Adjusted EPS.
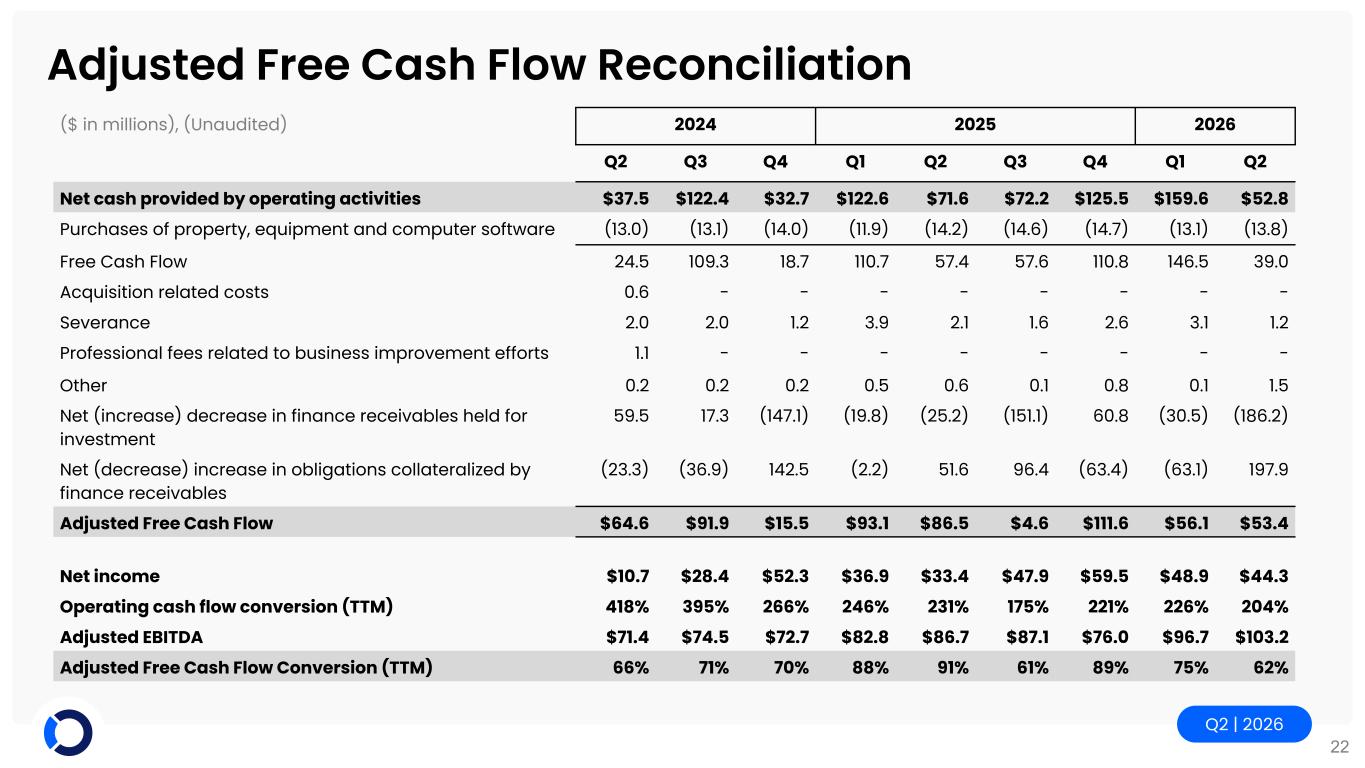
Q2 | 2026 22 Adjusted Free Cash Flow Reconciliation ($ in millions), (Unaudited) 2024 2025 2026 Q2 Q3 Q4 Q1 Q2 Q3 Q4 Q1 Q2 Net cash provided by operating activities $37.5 $122.4 $32.7 $122.6 $71.6 $72.2 $125.5 $159.6 $52.8 Purchases of property, equipment and computer software (13.0) (13.1) (14.0) (11.9) (14.2) (14.6) (14.7) (13.1) (13.8) Free Cash Flow 24.5 109.3 18.7 110.7 57.4 57.6 110.8 146.5 39.0 Acquisition related costs 0.6 - - - - - - - - Severance 2.0 2.0 1.2 3.9 2.1 1.6 2.6 3.1 1.2 Professional fees related to business improvement efforts 1.1 - - - - - - - - Other 0.2 0.2 0.2 0.5 0.6 0.1 0.8 0.1 1.5 Net (increase) decrease in finance receivables held for investment 59.5 17.3 (147.1) (19.8) (25.2) (151.1) 60.8 (30.5) (186.2) Net (decrease) increase in obligations collateralized by finance receivables (23.3) (36.9) 142.5 (2.2) 51.6 96.4 (63.4) (63.1) 197.9 Adjusted Free Cash Flow $64.6 $91.9 $15.5 $93.1 $86.5 $4.6 $111.6 $56.1 $53.4 Net income $10.7 $28.4 $52.3 $36.9 $33.4 $47.9 $59.5 $48.9 $44.3 Operating cash flow conversion (TTM) 418% 395% 266% 246% 231% 175% 221% 226% 204% Adjusted EBITDA $71.4 $74.5 $72.7 $82.8 $86.7 $87.1 $76.0 $96.7 $103.2 Adjusted Free Cash Flow Conversion (TTM) 66% 71% 70% 88% 91% 61% 89% 75% 62%
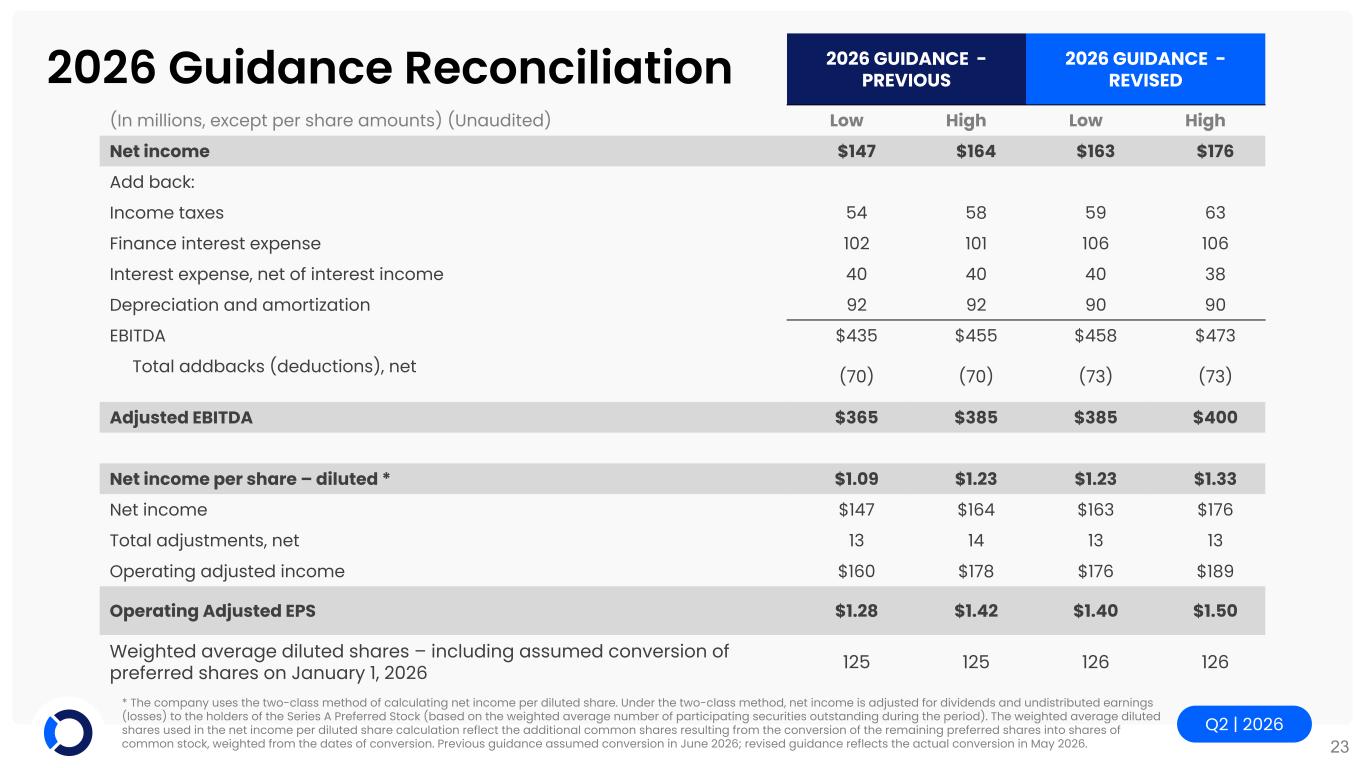
Q2 | 2026 23 2026 Guidance Reconciliation 2026 GUIDANCE - PREVIOUS 2026 GUIDANCE - REVISED (In millions, except per share amounts) (Unaudited) Low High Low High Net income $147 $164 $163 $176 Add back: Income taxes 54 58 59 63 Finance interest expense 102 101 106 106 Interest expense, net of interest income 40 40 40 38 Depreciation and amortization 92 92 90 90 EBITDA $435 $455 $458 $473 Total addbacks (deductions), net (70) (70) (73) (73) Adjusted EBITDA $365 $385 $385 $400 Net income per share – diluted * $1.09 $1.23 $1.23 $1.33 Net income $147 $164 $163 $176 Total adjustments, net 13 14 13 13 Operating adjusted income $160 $178 $176 $189 Operating Adjusted EPS $1.28 $1.42 $1.40 $1.50 Weighted average diluted shares – including assumed conversion of preferred shares on January 1, 2026 125 125 126 126 * The company uses the two-class method of calculating net income per diluted share. Under the two-class method, net income is adjusted for dividends and undistributed earnings (losses) to the holders of the Series A Preferred Stock (based on the weighted average number of participating securities outstanding during the period). The weighted average diluted shares used in the net income per diluted share calculation reflect the additional common shares resulting from the conversion of the remaining preferred shares into shares of common stock, weighted from the dates of conversion. Previous guidance assumed conversion in June 2026; revised guidance reflects the actual conversion in May 2026.