
Quarterly Earnings Results Presentation Q2 2026 - August 3, 2026
2 PresBuilder Placeholder - Delete this box if you see it on a slide, but DO NOT REMOVE this box from the slide layout Forward Looking Statements This presentation contains certain forward-looking statements, including, but not limited to, certain plans, expectations, goals, projections, and statements, which are not historical facts and are subject to numerous assumptions, risks, and uncertainties. Statements that do not describe historical or current facts, including statements about beliefs and expectations, are forward-looking statements. All forward-looking statements are made in good faith by the company and are intended to qualify for the safe harbor from liability established by Section 27A of the Securities Act of 1933, Section 21E of the Securities Exchange Act of 1934, and the Private Securities Litigation Reform Act of 1995.You should not rely on these forward-looking statements as predictions of future events. Words such as "expect," "estimate," "project," "budget," "forecast," "anticipate," "intend," "plan," “target”, “goal”, "may," "will," "could," "should," "believes," "predicts," "potential," "continue," and similar expressions are intended to identify such forward-looking statements. These forward-looking statements include, without limitation, the Company’s expectations with respect to future performance. These forward-looking statements involve significant risks and uncertainties that could cause the actual results to differ materially from the expected results. Most of these factors are outside the Company's control and are difficult to predict. Factors that may cause such differences include, but are not limited to: (1) unfavorable economic conditions that may affect operations, financial condition and cash flows including spending on home renovation or construction projects, inflation, recessions, instability in the financial markets or credit markets; (2) increased supply chain costs, including tariffs, raw materials, sourcing, transportation and energy; (3) the highly competitive nature of the markets that we serve; (4) the ability to continue to innovate with new products and services; (5) seasonality; (6) large customer concentration; (7) the ability to recruit and retain qualified employees; (8) the outcome of any legal proceedings that may be instituted against the Company; (9) adverse changes in currency exchange rates; or (10) regulatory changes and potential legislation that could adversely impact financial results. The foregoing list of factors is not exclusive, and readers should also refer to those risks that are included in the Company’s filings with the Securities and Exchange Commission (“SEC”), including its Annual Report on Form 10-K for the fiscal year ended December 27, 2025 filed on February 17, 2026. Given these uncertainties, current or prospective investors are cautioned not to place undue reliance on any such forward looking statements. Except as required by applicable law, the Company does not undertake or accept any obligation or undertaking to release publicly any updates or revisions to any forward-looking statements in this communication to reflect any change in its expectations or any change in events, conditions or circumstances on which any such statement is based. Presentation of Non-GAAP Financial Measures In addition to the results provided in accordance with U.S. Generally Accepted Accounting Principles (“GAAP”) throughout this presentation the company has provided non-GAAP financial measures, which present results on a basis adjusted for certain items. The company uses these non-GAAP financial measures for business planning purposes and in measuring its performance relative to that of its competitors. The company believes that these non-GAAP financial measures are useful financial metrics to assess its operating performance from period-to-period by excluding certain items that the company believes are not representative of its core business. These non-GAAP financial measures are not intended to replace, and should not be considered superior to, the presentation of the company’s financial results in accordance with GAAP. The use of the non-GAAP financial measures terms may differ from similar measures reported by other companies and may not be comparable to other similarly titled measures. These non-GAAP financial measures are reconciled from the respective measures under GAAP in the appendix below. The company is not able to provide a reconciliation of the company’s non-GAAP financial guidance to the corresponding GAAP measures without unreasonable effort because of the inherent difficulty in forecasting and quantifying certain amounts necessary for such a reconciliation such as certain non-cash, nonrecurring or other items that are included in net income and EBITDA as well as the related tax impacts of these items and asset dispositions / acquisitions and changes in foreign currency exchange rates that are included in cash flow, due to the uncertainty and variability of the nature and amount of these future charges and costs.
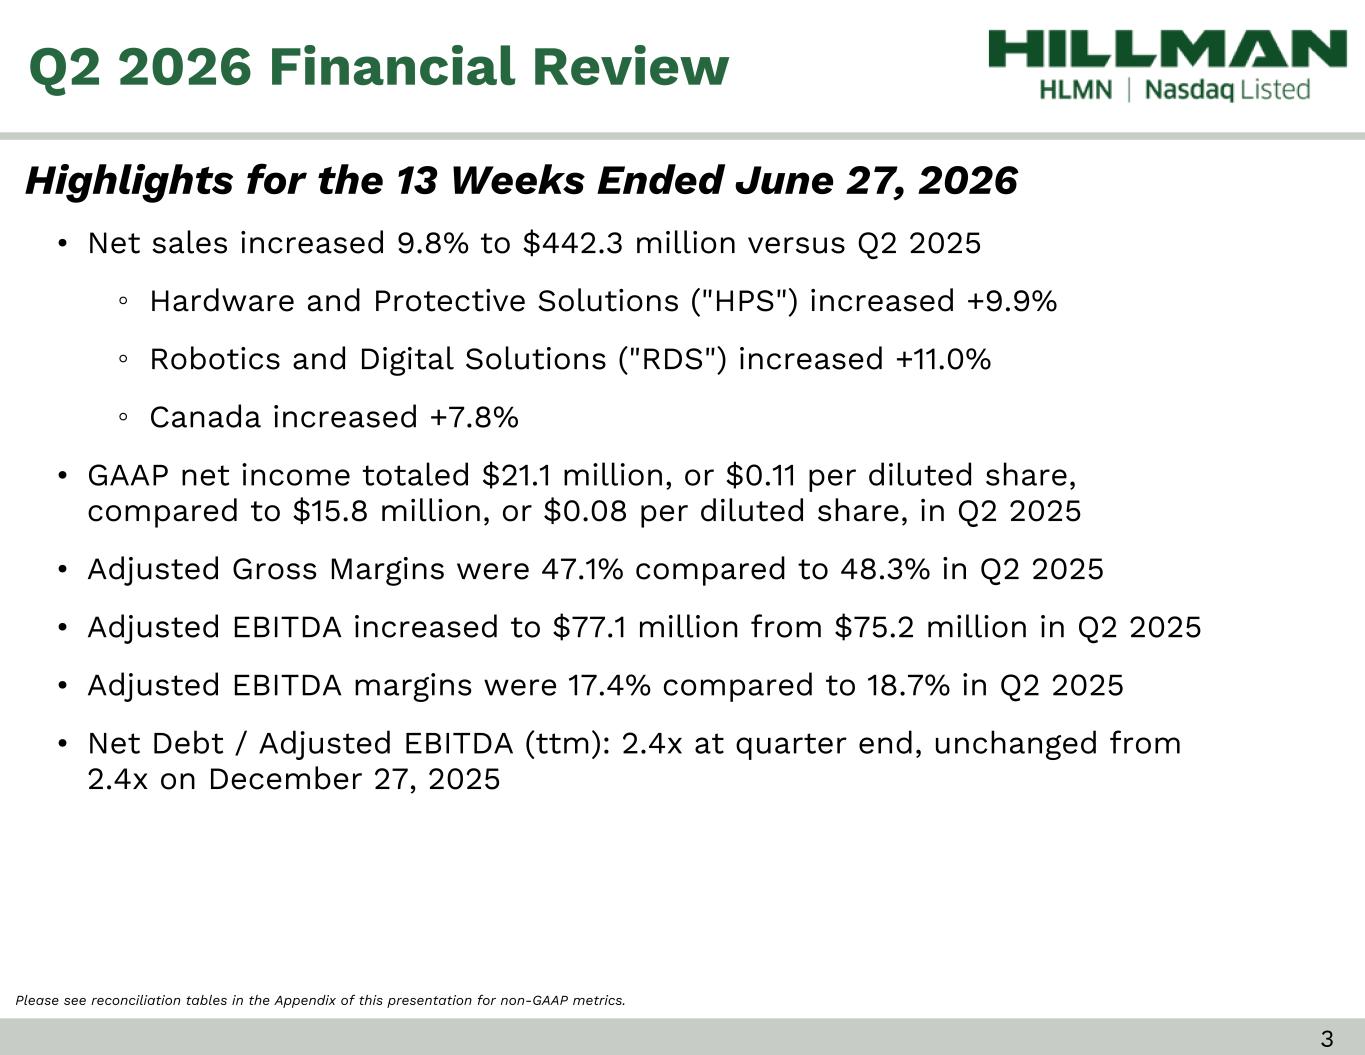
3 • Net sales increased 9.8% to $442.3 million versus Q2 2025 ◦ Hardware and Protective Solutions ("HPS") increased +9.9% ◦ Robotics and Digital Solutions ("RDS") increased +11.0% ◦ Canada increased +7.8% • GAAP net income totaled $21.1 million, or $0.11 per diluted share, compared to $15.8 million, or $0.08 per diluted share, in Q2 2025 • Adjusted Gross Margins were 47.1% compared to 48.3% in Q2 2025 • Adjusted EBITDA increased to $77.1 million from $75.2 million in Q2 2025 • Adjusted EBITDA margins were 17.4% compared to 18.7% in Q2 2025 • Net Debt / Adjusted EBITDA (ttm): 2.4x at quarter end, unchanged from 2.4x on December 27, 2025 Q2 2026 Financial Review Please see reconciliation tables in the Appendix of this presentation for non-GAAP metrics. Highlights for the 13 Weeks Ended June 27, 2026
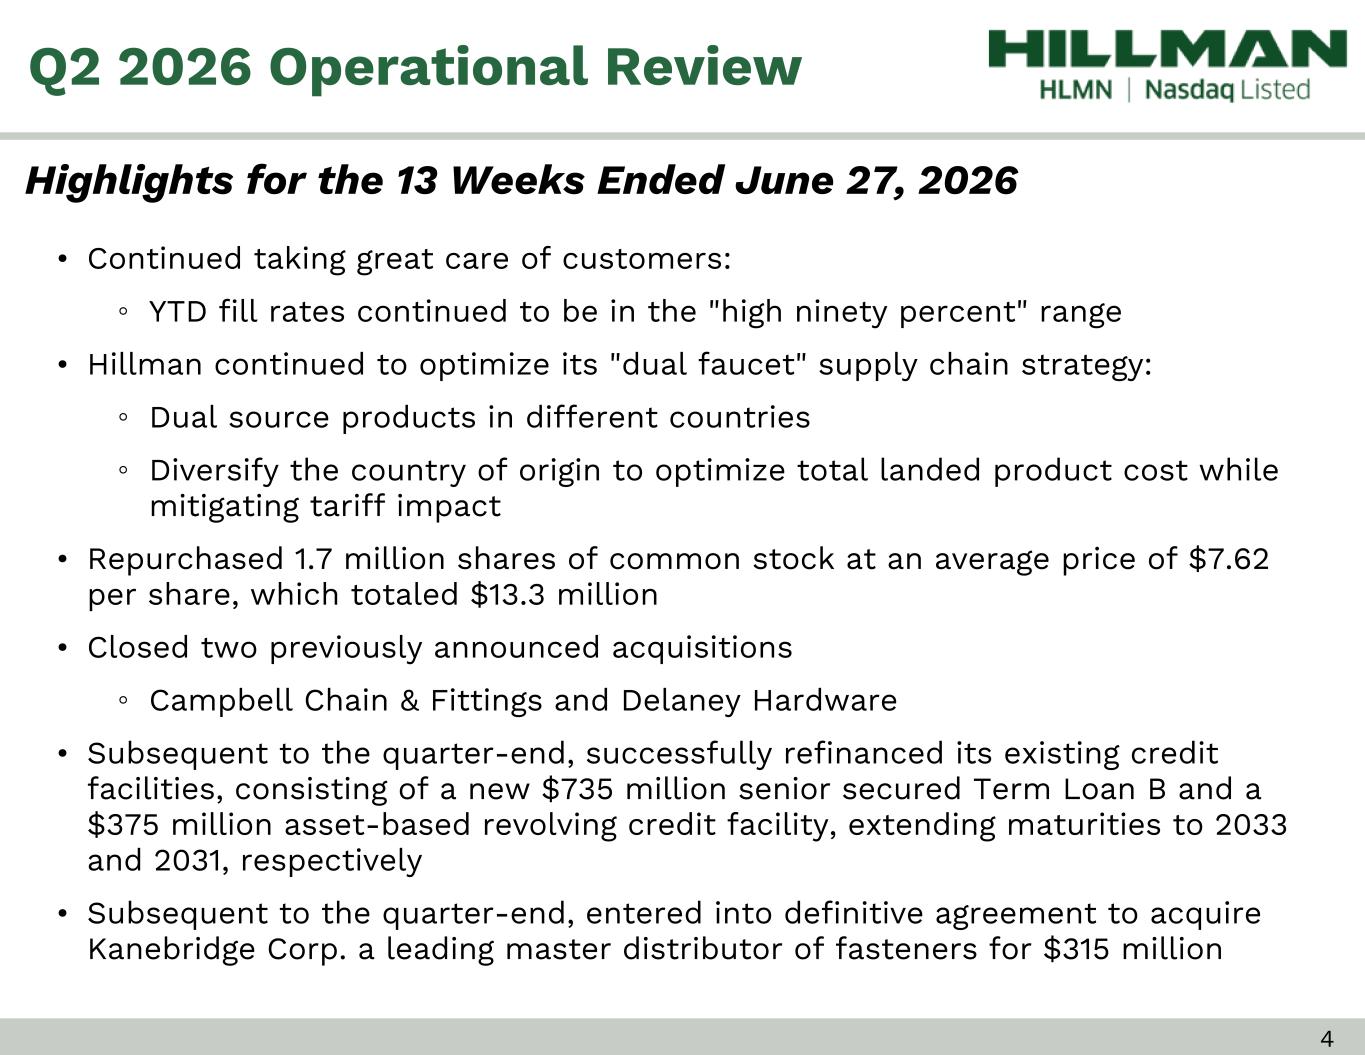
4 Q2 2026 Operational Review Highlights for the 13 Weeks Ended June 27, 2026 • Continued taking great care of customers: ◦ YTD fill rates continued to be in the "high ninety percent" range • Hillman continued to optimize its "dual faucet" supply chain strategy: ◦ Dual source products in different countries ◦ Diversify the country of origin to optimize total landed product cost while mitigating tariff impact • Repurchased 1.7 million shares of common stock at an average price of $7.62 per share, which totaled $13.3 million • Closed two previously announced acquisitions ◦ Campbell Chain & Fittings and Delaney Hardware • Subsequent to the quarter-end, successfully refinanced its existing credit facilities, consisting of a new $735 million senior secured Term Loan B and a $375 million asset-based revolving credit facility, extending maturities to 2033 and 2031, respectively • Subsequent to the quarter-end, entered into definitive agreement to acquire Kanebridge Corp. a leading master distributor of fasteners for $315 million
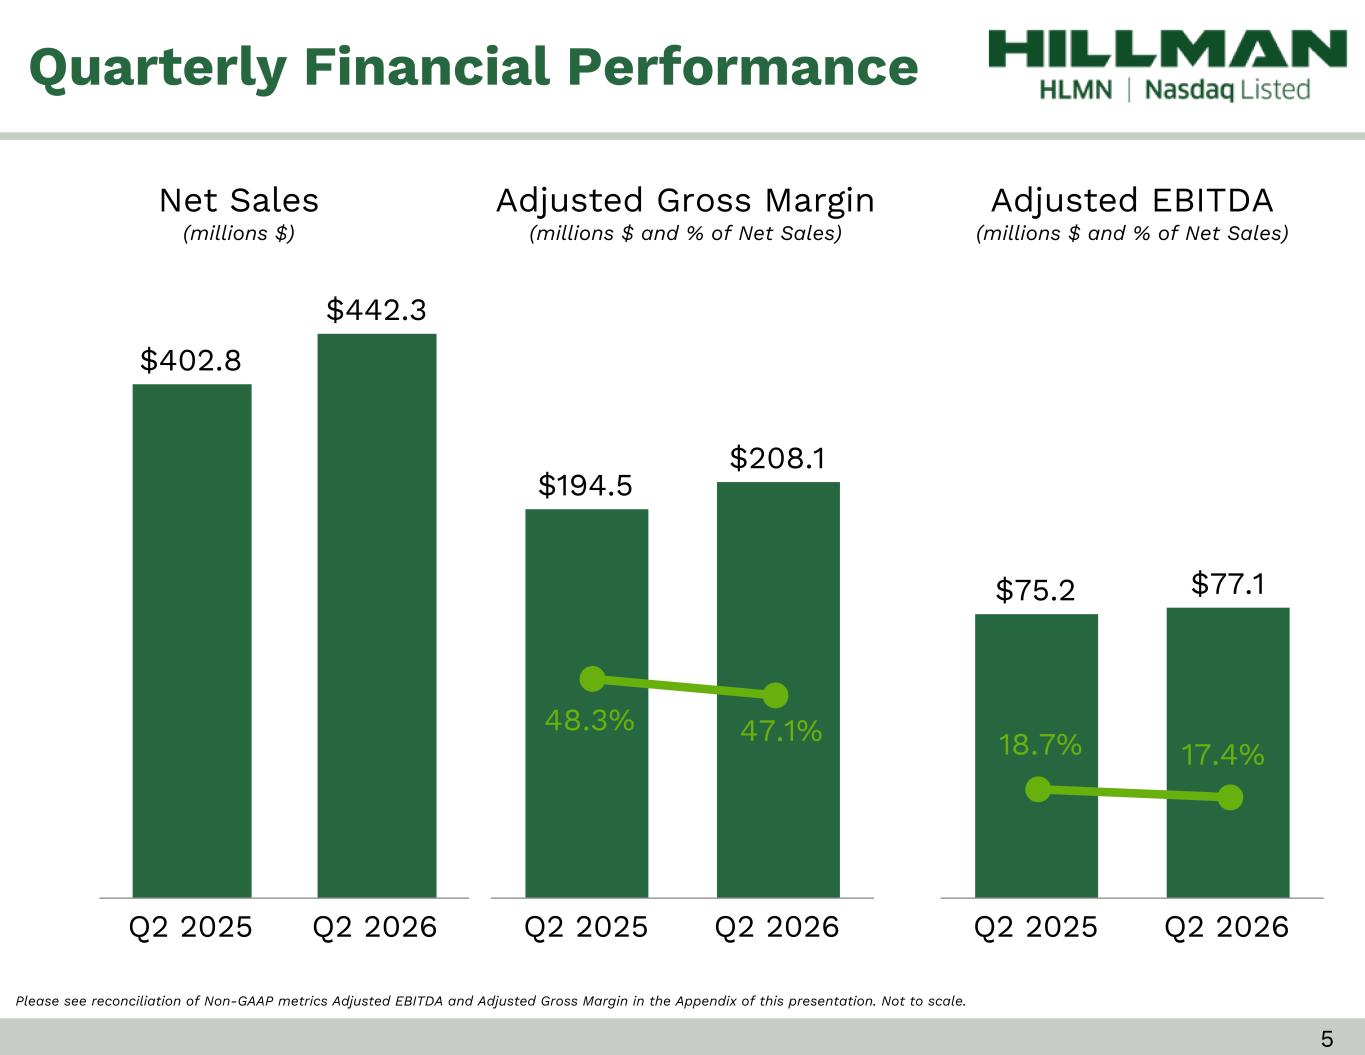
5 Quarterly Financial Performance Adjusted EBITDA (millions $ and % of Net Sales) Please see reconciliation of Non-GAAP metrics Adjusted EBITDA and Adjusted Gross Margin in the Appendix of this presentation. Not to scale. Net Sales (millions $) Adjusted Gross Margin (millions $ and % of Net Sales) $75.2 $77.1 Q2 2025 Q2 2026 17.4%18.7% $194.5 $208.1 Q2 2025 Q2 2026 $402.8 $442.3 Q2 2025 Q2 2026 47.1%48.3%
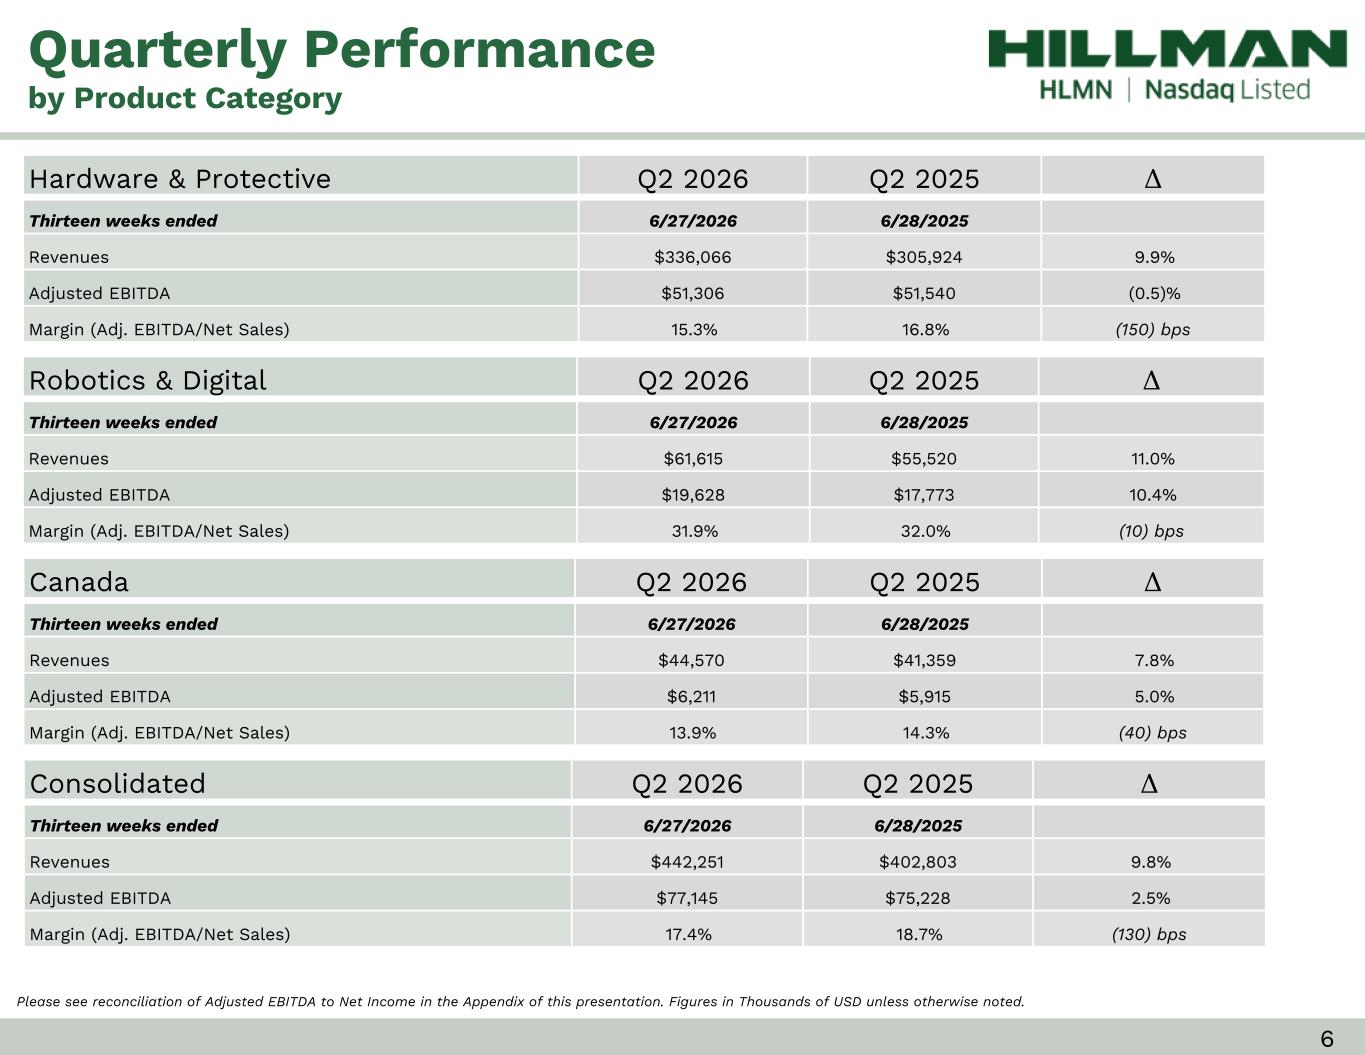
6 Hardware & Protective Q2 2026 Q2 2025 Δ Thirteen weeks ended 6/27/2026 6/28/2025 Revenues $336,066 $305,924 9.9% Adjusted EBITDA $51,306 $51,540 (0.5)% Margin (Adj. EBITDA/Net Sales) 15.3% 16.8% (150) bps Robotics & Digital Q2 2026 Q2 2025 Δ Thirteen weeks ended 6/27/2026 6/28/2025 Revenues $61,615 $55,520 11.0% Adjusted EBITDA $19,628 $17,773 10.4% Margin (Adj. EBITDA/Net Sales) 31.9% 32.0% (10) bps Canada Q2 2026 Q2 2025 Δ Thirteen weeks ended 6/27/2026 6/28/2025 Revenues $44,570 $41,359 7.8% Adjusted EBITDA $6,211 $5,915 5.0% Margin (Adj. EBITDA/Net Sales) 13.9% 14.3% (40) bps Consolidated Q2 2026 Q2 2025 Δ Thirteen weeks ended 6/27/2026 6/28/2025 Revenues $442,251 $402,803 9.8% Adjusted EBITDA $77,145 $75,228 2.5% Margin (Adj. EBITDA/Net Sales) 17.4% 18.7% (130) bps Quarterly Performance by Product Category Please see reconciliation of Adjusted EBITDA to Net Income in the Appendix of this presentation. Figures in Thousands of USD unless otherwise noted. • Top Row: ◦ 27 point height ◦ 16 font (work sans) ◦ 4 point white bottom line • First Column green ◦ Dark: CFD9D1 ◦ Light: D9E1DA • Other Columns gray ◦ Dark: D9D9D9 ◦ Light E0E0E0 ◦ 1 point white bottom and inside lines
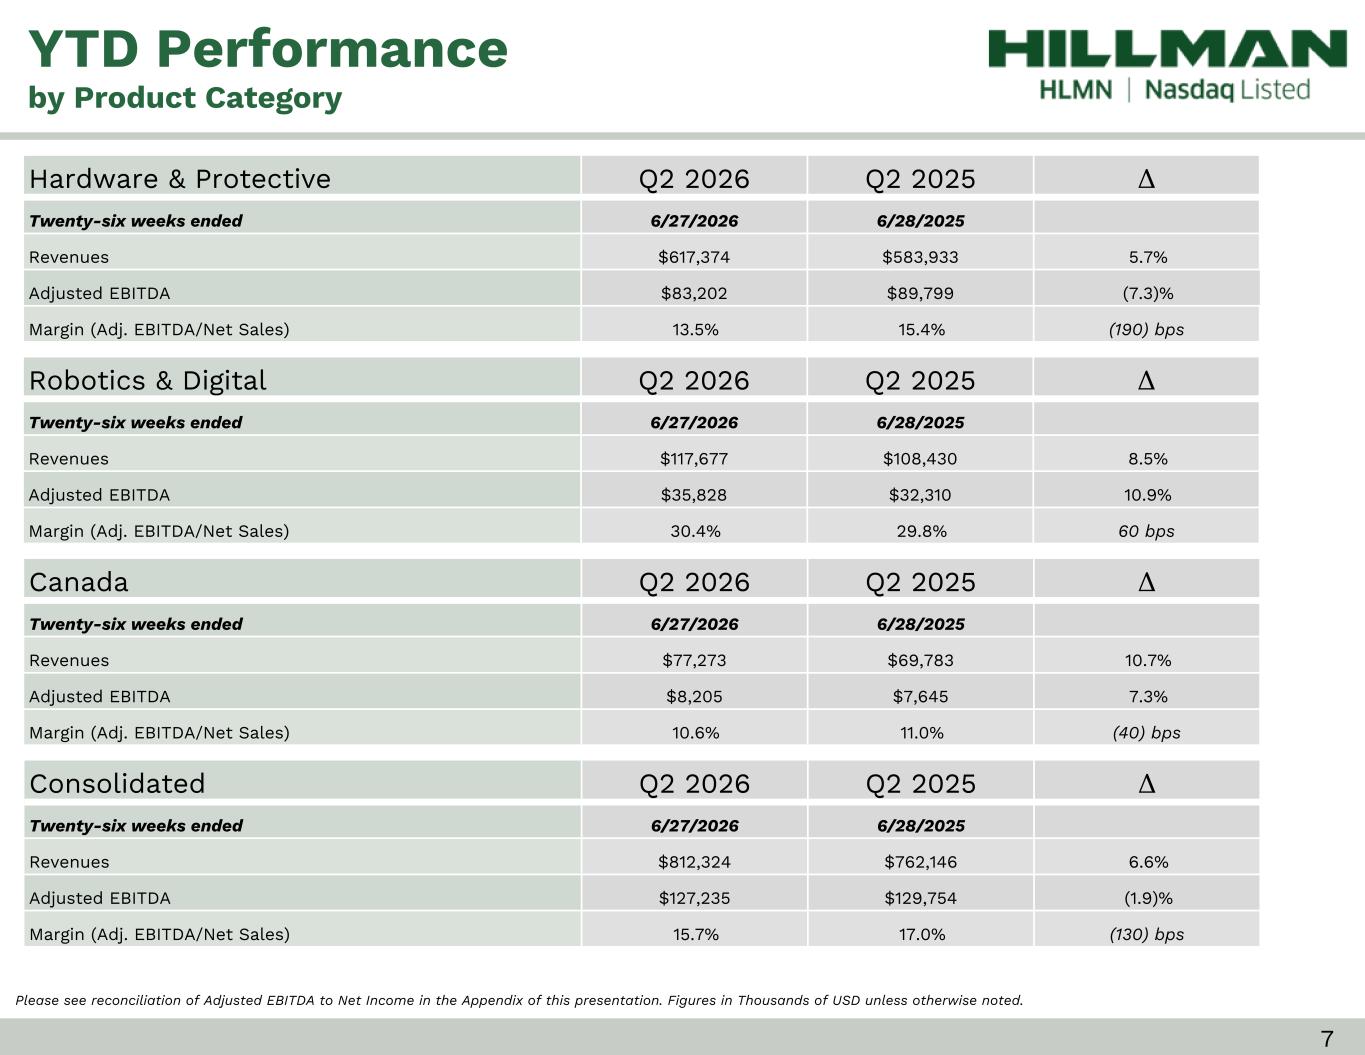
7 Hardware & Protective Q2 2026 Q2 2025 Δ Twenty-six weeks ended 6/27/2026 6/28/2025 Revenues $617,374 $583,933 5.7% Adjusted EBITDA $83,202 $89,799 (7.3)% Margin (Adj. EBITDA/Net Sales) 13.5% 15.4% (190) bps Robotics & Digital Q2 2026 Q2 2025 Δ Twenty-six weeks ended 6/27/2026 6/28/2025 Revenues $117,677 $108,430 8.5% Adjusted EBITDA $35,828 $32,310 10.9% Margin (Adj. EBITDA/Net Sales) 30.4% 29.8% 60 bps Canada Q2 2026 Q2 2025 Δ Twenty-six weeks ended 6/27/2026 6/28/2025 Revenues $77,273 $69,783 10.7% Adjusted EBITDA $8,205 $7,645 7.3% Margin (Adj. EBITDA/Net Sales) 10.6% 11.0% (40) bps Consolidated Q2 2026 Q2 2025 Δ Twenty-six weeks ended 6/27/2026 6/28/2025 Revenues $812,324 $762,146 6.6% Adjusted EBITDA $127,235 $129,754 (1.9)% Margin (Adj. EBITDA/Net Sales) 15.7% 17.0% (130) bps YTD Performance by Product Category Please see reconciliation of Adjusted EBITDA to Net Income in the Appendix of this presentation. Figures in Thousands of USD unless otherwise noted.
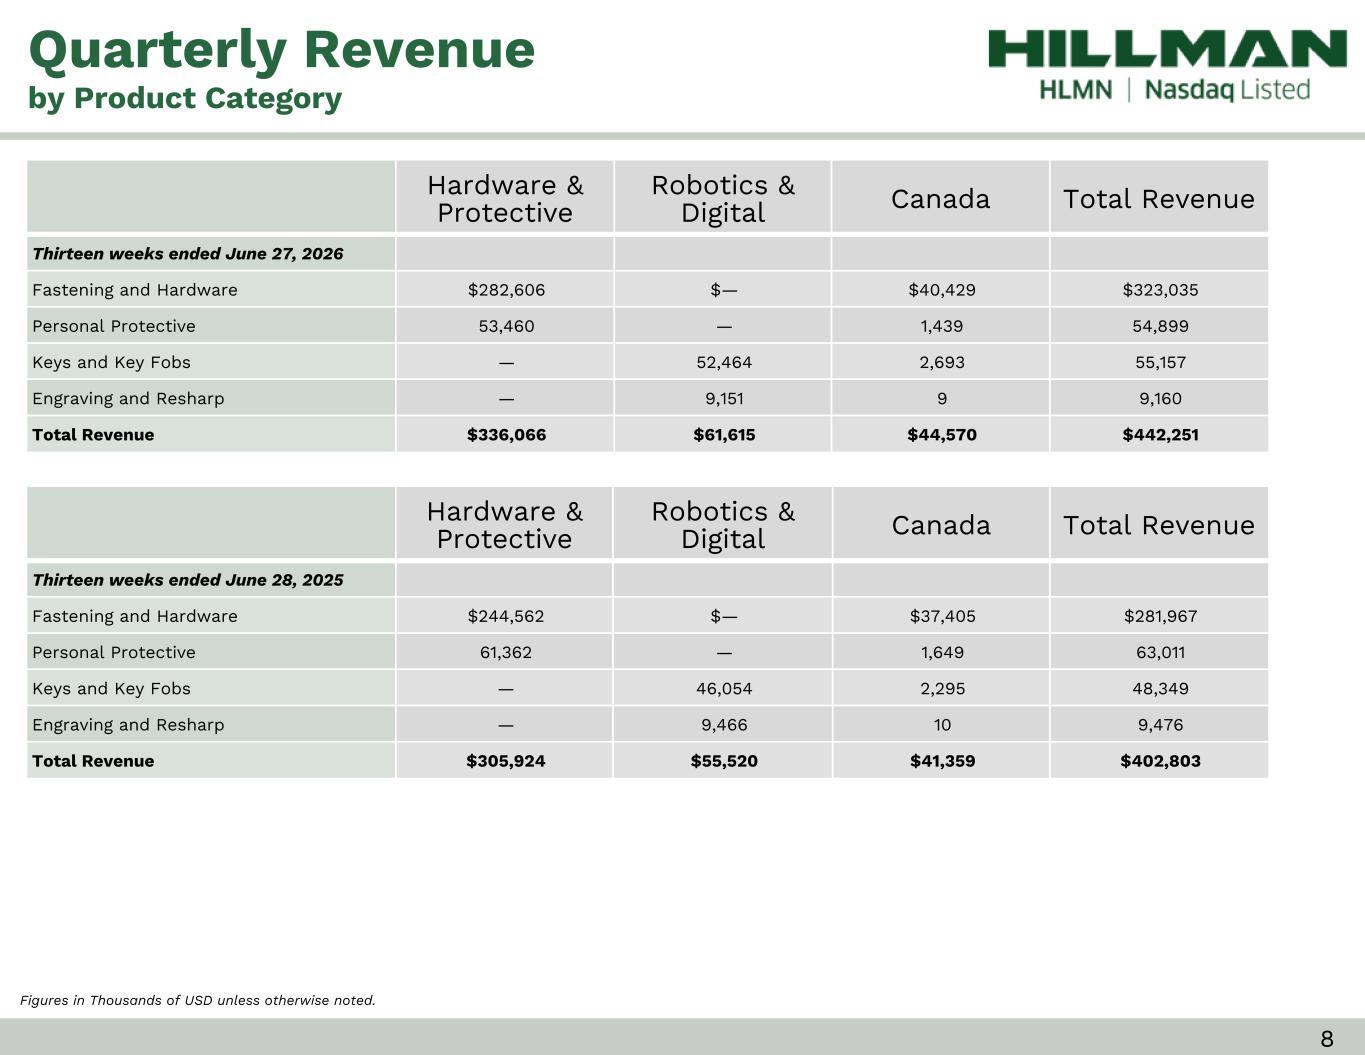
8 Hardware & Protective Robotics & Digital Canada Total Revenue Thirteen weeks ended June 27, 2026 Fastening and Hardware $282,606 $— $40,429 $323,035 Personal Protective 53,460 — 1,439 54,899 Keys and Key Fobs — 52,464 2,693 55,157 Engraving and Resharp — 9,151 9 9,160 Total Revenue $336,066 $61,615 $44,570 $442,251 Quarterly Revenue by Product Category Hardware & Protective Robotics & Digital Canada Total Revenue Thirteen weeks ended June 28, 2025 Fastening and Hardware $244,562 $— $37,405 $281,967 Personal Protective 61,362 — 1,649 63,011 Keys and Key Fobs — 46,054 2,295 48,349 Engraving and Resharp — 9,466 10 9,476 Total Revenue $305,924 $55,520 $41,359 $402,803 Figures in Thousands of USD unless otherwise noted.
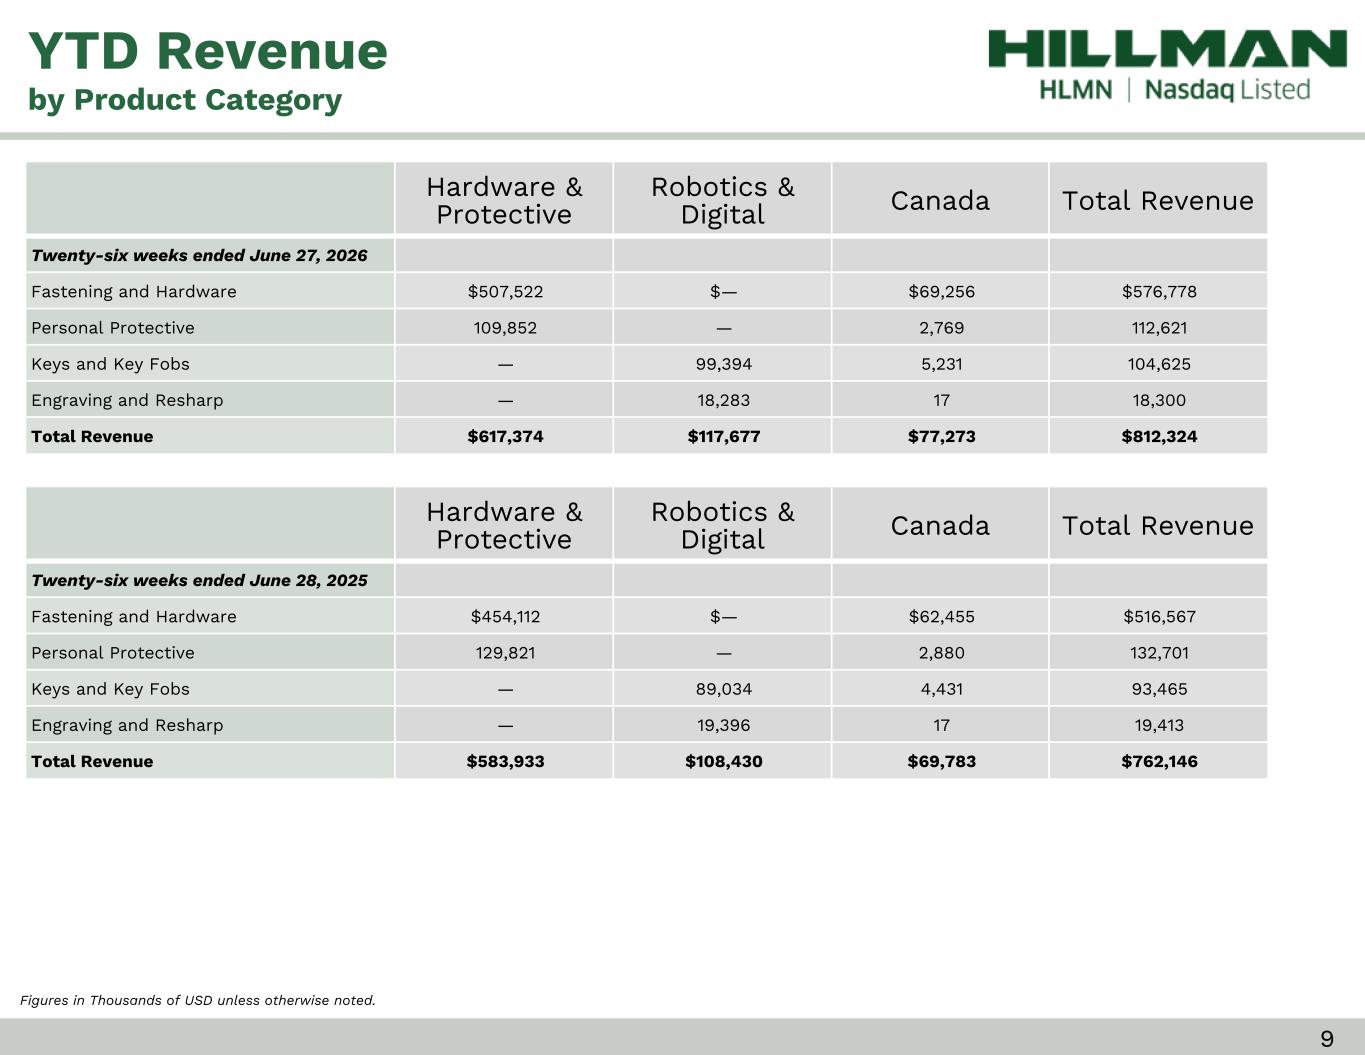
9 Hardware & Protective Robotics & Digital Canada Total Revenue Twenty-six weeks ended June 27, 2026 Fastening and Hardware $507,522 $— $69,256 $576,778 Personal Protective 109,852 — 2,769 112,621 Keys and Key Fobs — 99,394 5,231 104,625 Engraving and Resharp — 18,283 17 18,300 Total Revenue $617,374 $117,677 $77,273 $812,324 YTD Revenue by Product Category Hardware & Protective Robotics & Digital Canada Total Revenue Twenty-six weeks ended June 28, 2025 Fastening and Hardware $454,112 $— $62,455 $516,567 Personal Protective 129,821 — 2,880 132,701 Keys and Key Fobs — 89,034 4,431 93,465 Engraving and Resharp — 19,396 17 19,413 Total Revenue $583,933 $108,430 $69,783 $762,146 Figures in Thousands of USD unless otherwise noted.
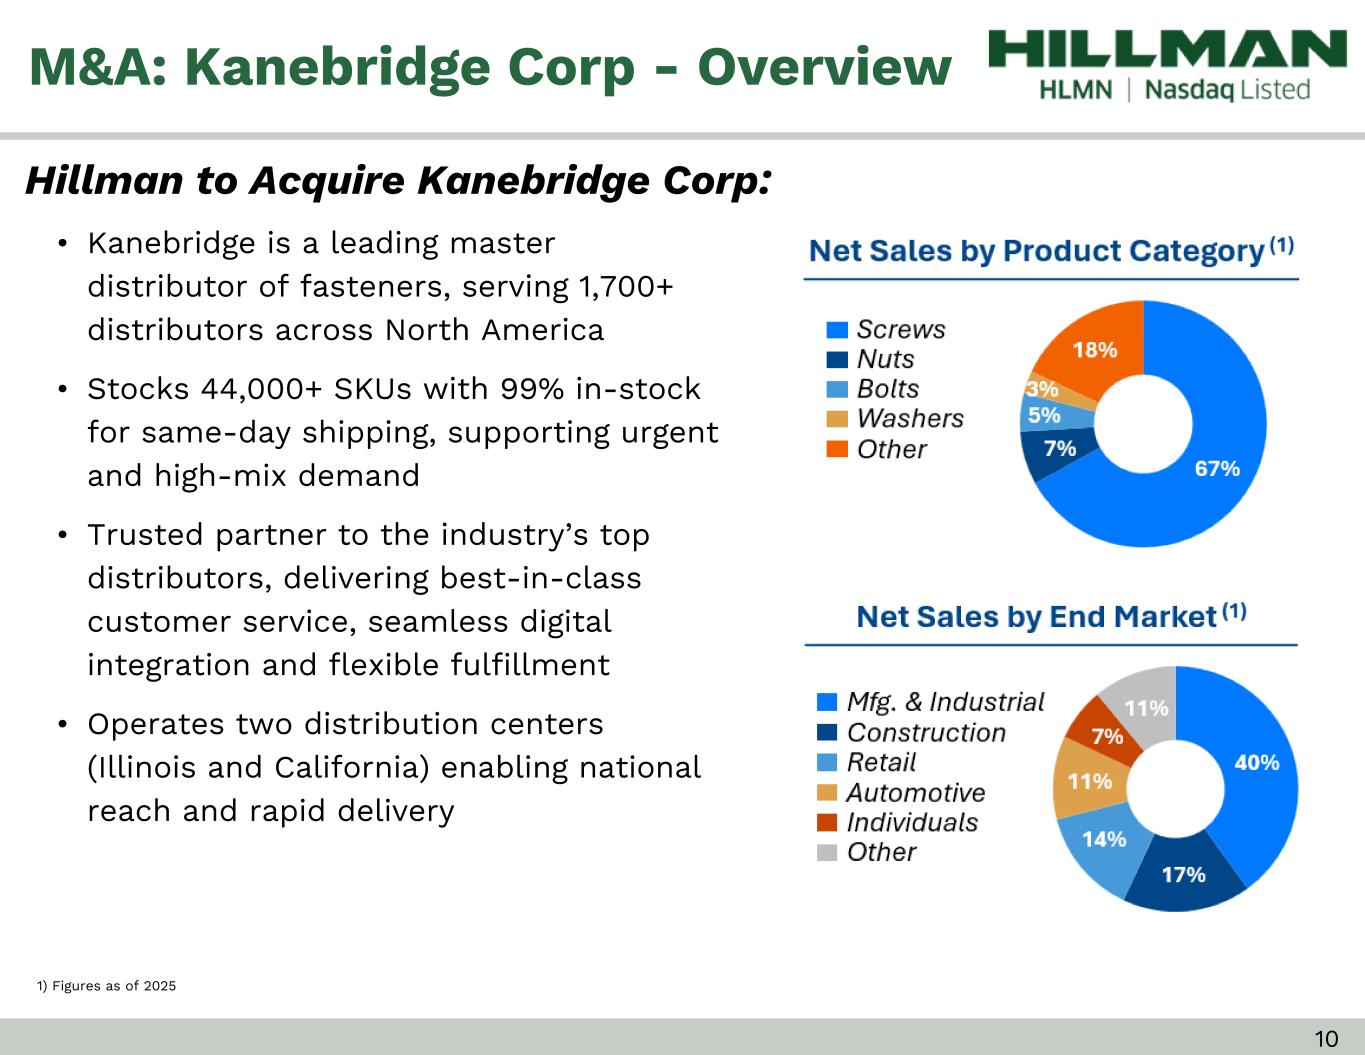
10 M&A: Kanebridge Corp - Overview Hillman to Acquire Kanebridge Corp: • Kanebridge is a leading master distributor of fasteners, serving 1,700+ distributors across North America • Stocks 44,000+ SKUs with 99% in-stock for same-day shipping, supporting urgent and high-mix demand • Trusted partner to the industry’s top distributors, delivering best-in-class customer service, seamless digital integration and flexible fulfillment • Operates two distribution centers (Illinois and California) enabling national reach and rapid delivery 1) Figures as of 2025
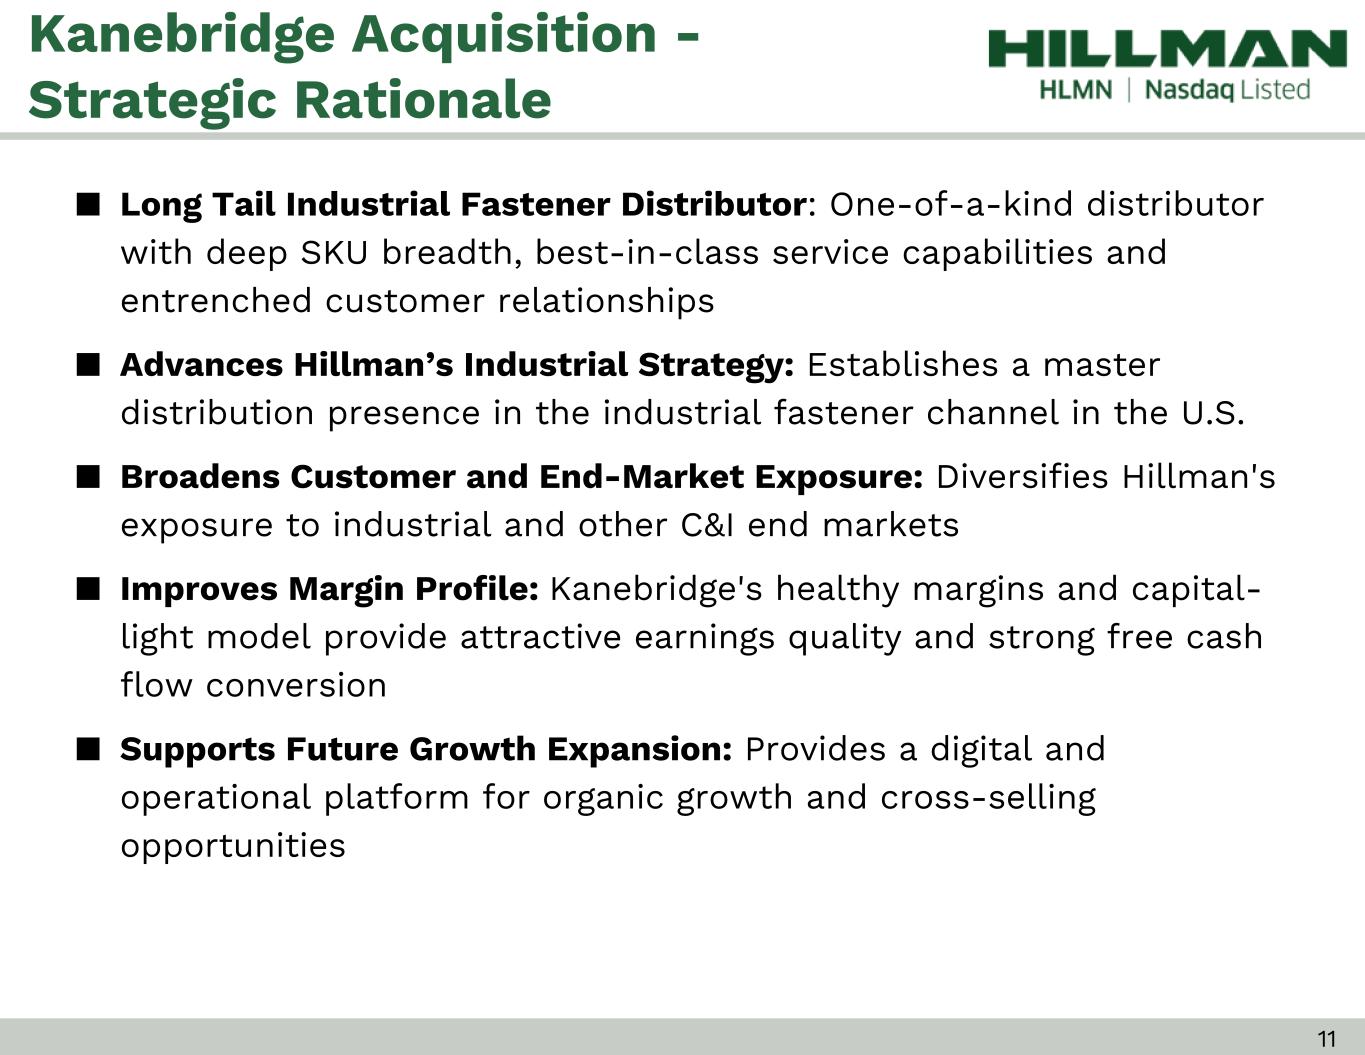
11 Kanebridge Acquisition - Strategic Rationale ■ Long Tail Industrial Fastener Distributor: One-of-a-kind distributor with deep SKU breadth, best-in-class service capabilities and entrenched customer relationships ■ Advances Hillman’s Industrial Strategy: Establishes a master distribution presence in the industrial fastener channel in the U.S. ■ Broadens Customer and End-Market Exposure: Diversifies Hillman's exposure to industrial and other C&I end markets ■ Improves Margin Profile: Kanebridge's healthy margins and capital- light model provide attractive earnings quality and strong free cash flow conversion ■ Supports Future Growth Expansion: Provides a digital and operational platform for organic growth and cross-selling opportunities
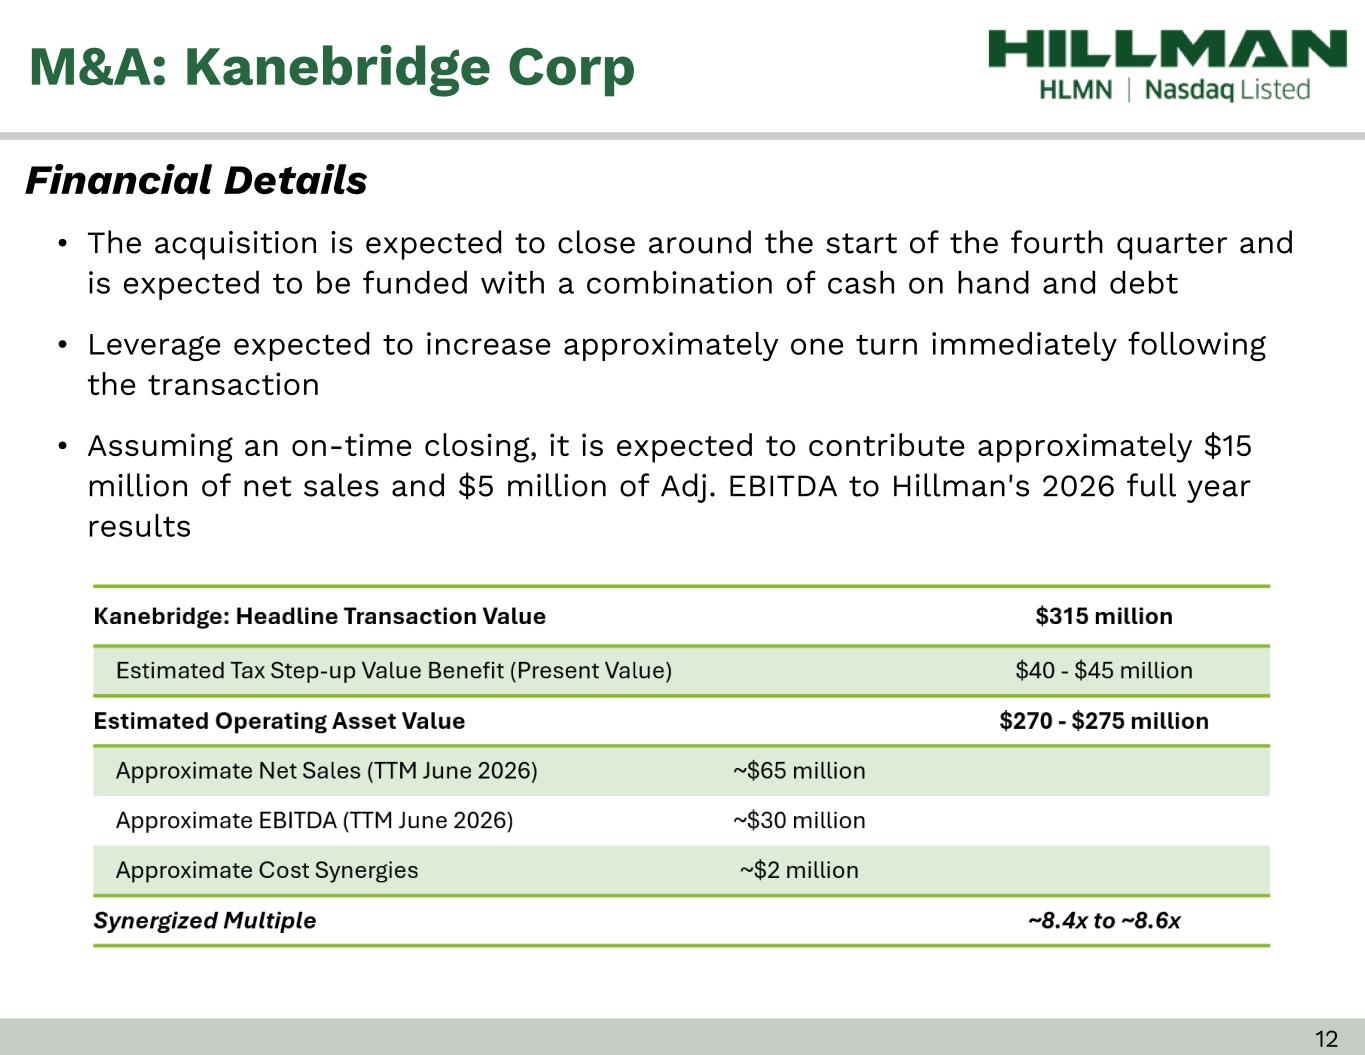
12 M&A: Kanebridge Corp Financial Details • The acquisition is expected to close around the start of the fourth quarter and is expected to be funded with a combination of cash on hand and debt • Leverage expected to increase approximately one turn immediately following the transaction • Assuming an on-time closing, it is expected to contribute approximately $15 million of net sales and $5 million of Adj. EBITDA to Hillman's 2026 full year results
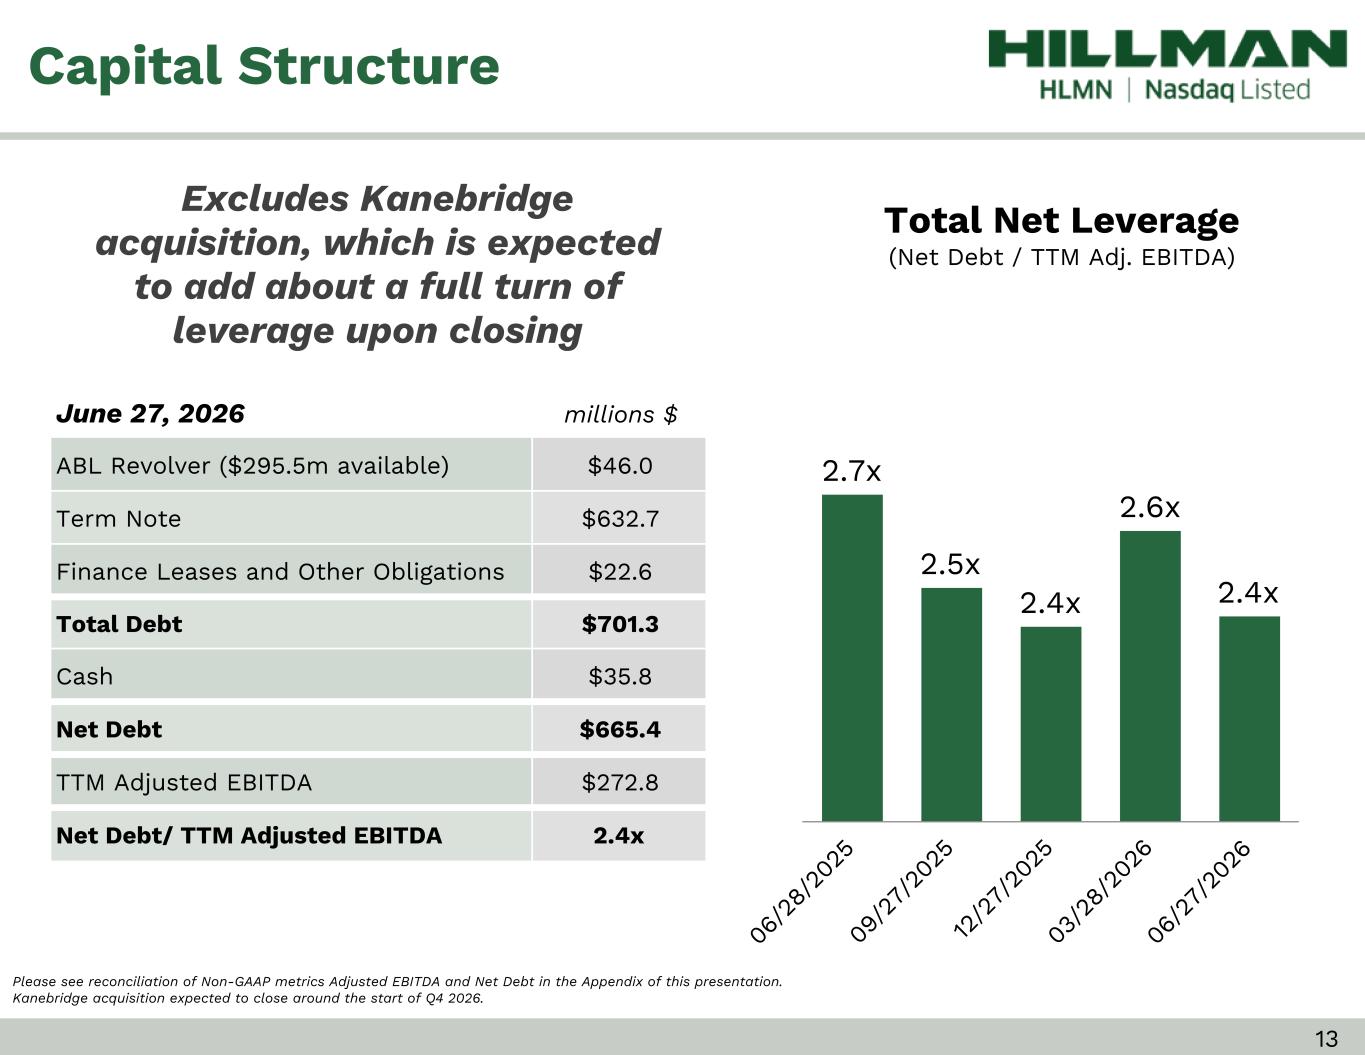
13 Total Net Leverage (Net Debt / TTM Adj. EBITDA) Capital Structure June 27, 2026 millions $ ABL Revolver ($295.5m available) $46.0 Term Note $632.7 Finance Leases and Other Obligations $22.6 Total Debt $701.3 Cash $35.8 Net Debt $665.4 TTM Adjusted EBITDA $272.8 Net Debt/ TTM Adjusted EBITDA 2.4x Please see reconciliation of Non-GAAP metrics Adjusted EBITDA and Net Debt in the Appendix of this presentation. Kanebridge acquisition expected to close around the start of Q4 2026. 2.7x 2.5x 2.4x 2.6x 2.4x 06 /2 8/ 20 25 09 /2 7/ 20 25 12 /2 7/ 20 25 03 /2 8/ 20 26 06 /2 7/ 20 26 Excludes Kanebridge acquisition, which is expected to add about a full turn of leverage upon closing
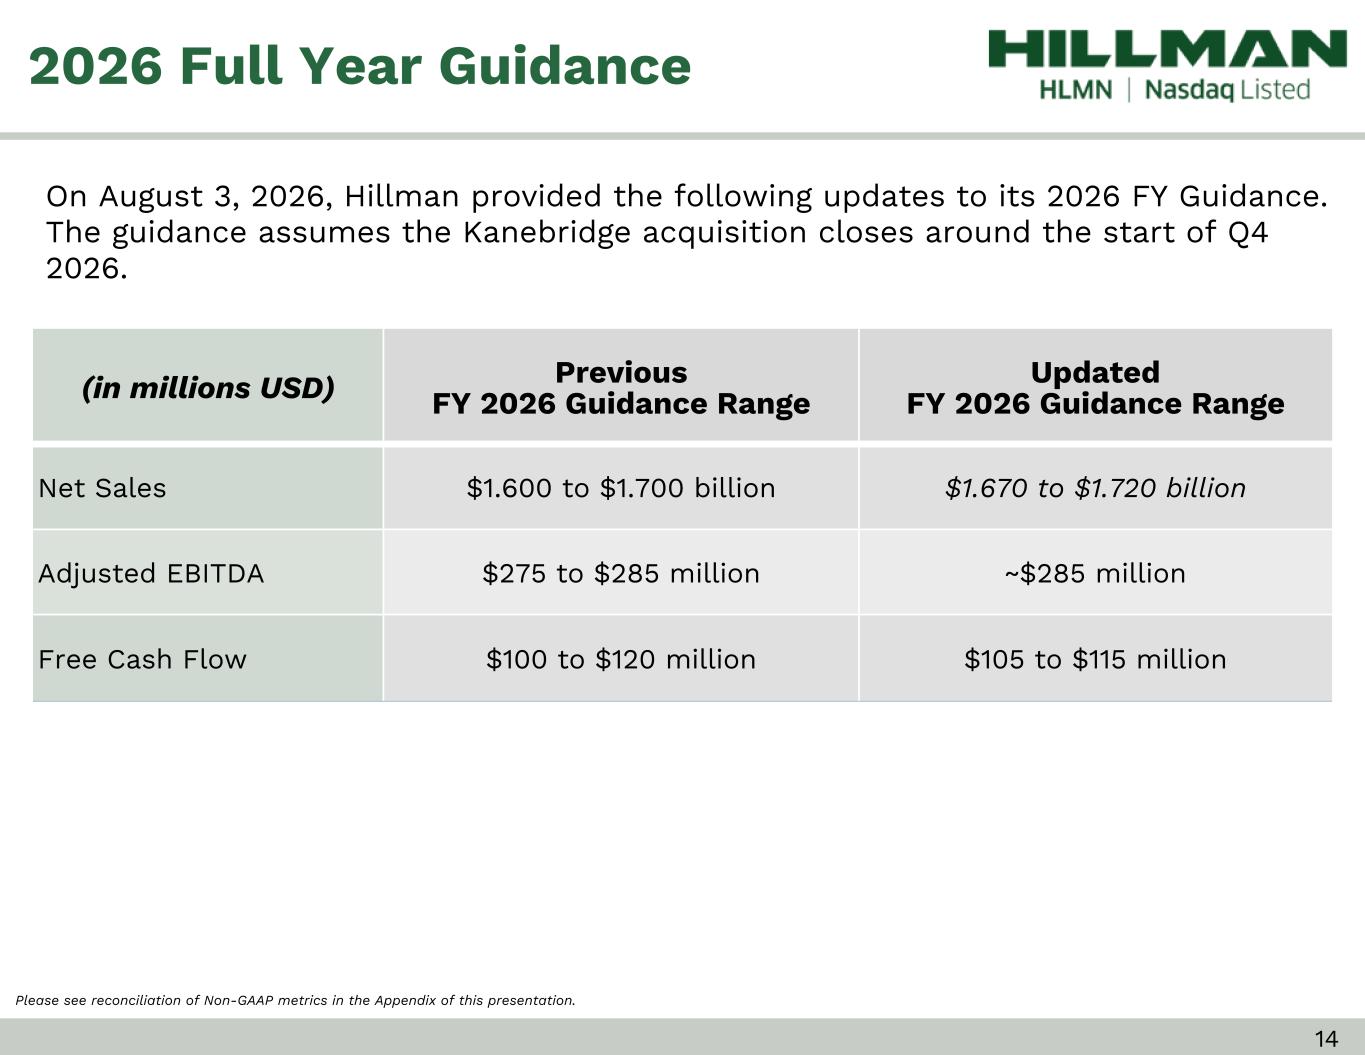
14 2026 Full Year Guidance (in millions USD) Previous FY 2026 Guidance Range Updated FY 2026 Guidance Range Net Sales $1.600 to $1.700 billion $1.670 to $1.720 billion Adjusted EBITDA $275 to $285 million ~$285 million Free Cash Flow $100 to $120 million $105 to $115 million On August 3, 2026, Hillman provided the following updates to its 2026 FY Guidance. The guidance assumes the Kanebridge acquisition closes around the start of Q4 2026. Please see reconciliation of Non-GAAP metrics in the Appendix of this presentation.
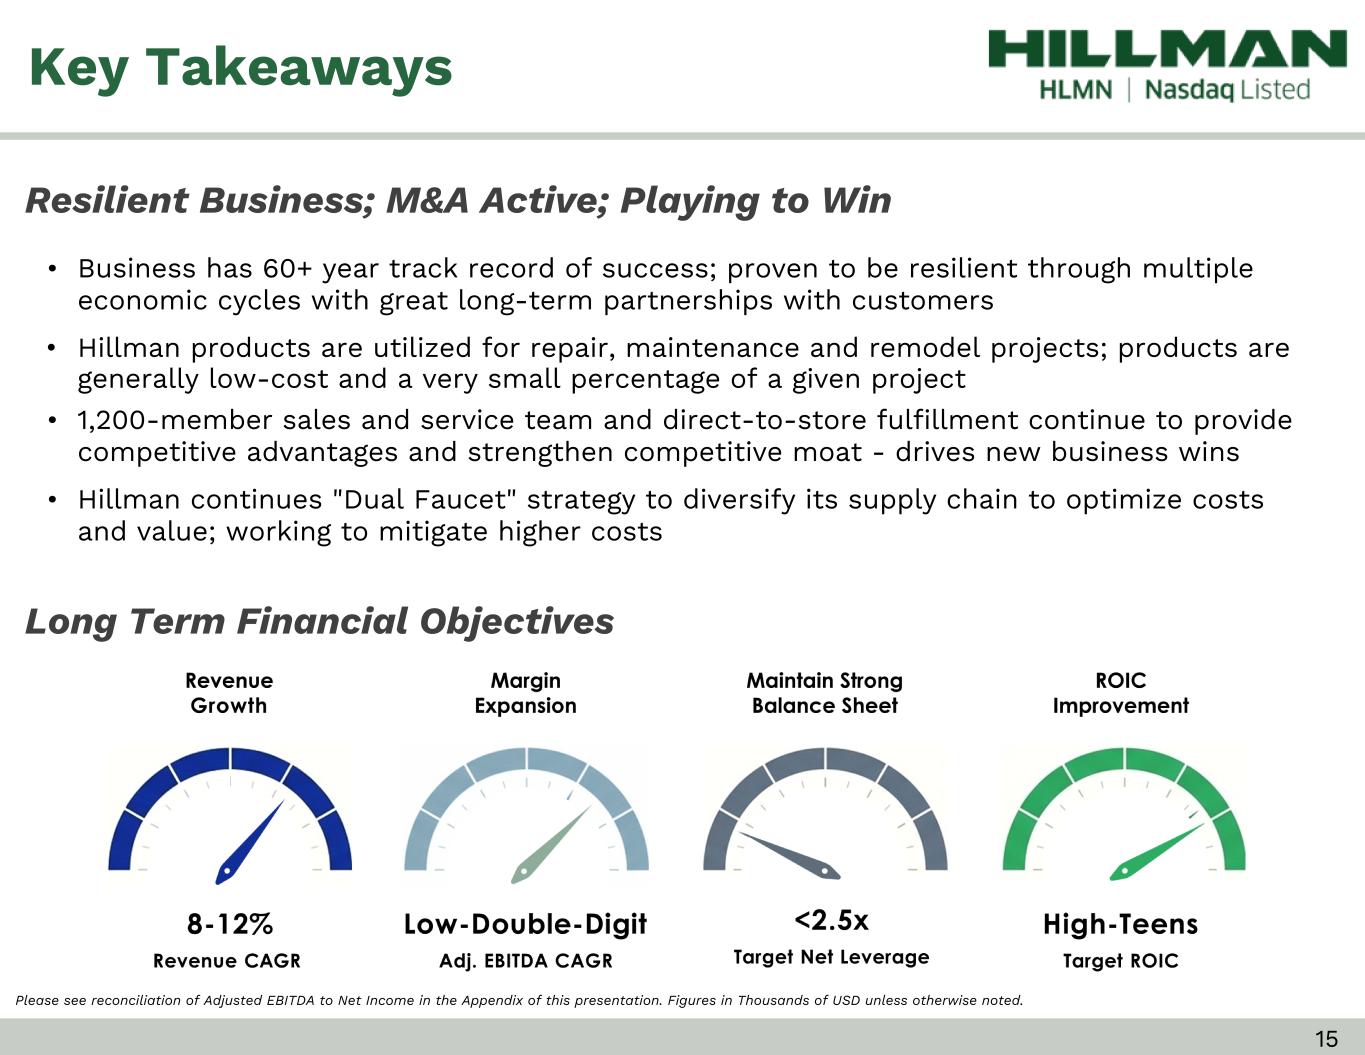
15 Key Takeaways Resilient Business; M&A Active; Playing to Win • Business has 60+ year track record of success; proven to be resilient through multiple economic cycles with great long-term partnerships with customers • Hillman products are utilized for repair, maintenance and remodel projects; products are generally low-cost and a very small percentage of a given project • 1,200-member sales and service team and direct-to-store fulfillment continue to provide competitive advantages and strengthen competitive moat - drives new business wins • Hillman continues "Dual Faucet" strategy to diversify its supply chain to optimize costs and value; working to mitigate higher costs Long Term Financial Objectives Please see reconciliation of Adjusted EBITDA to Net Income in the Appendix of this presentation. Figures in Thousands of USD unless otherwise noted.
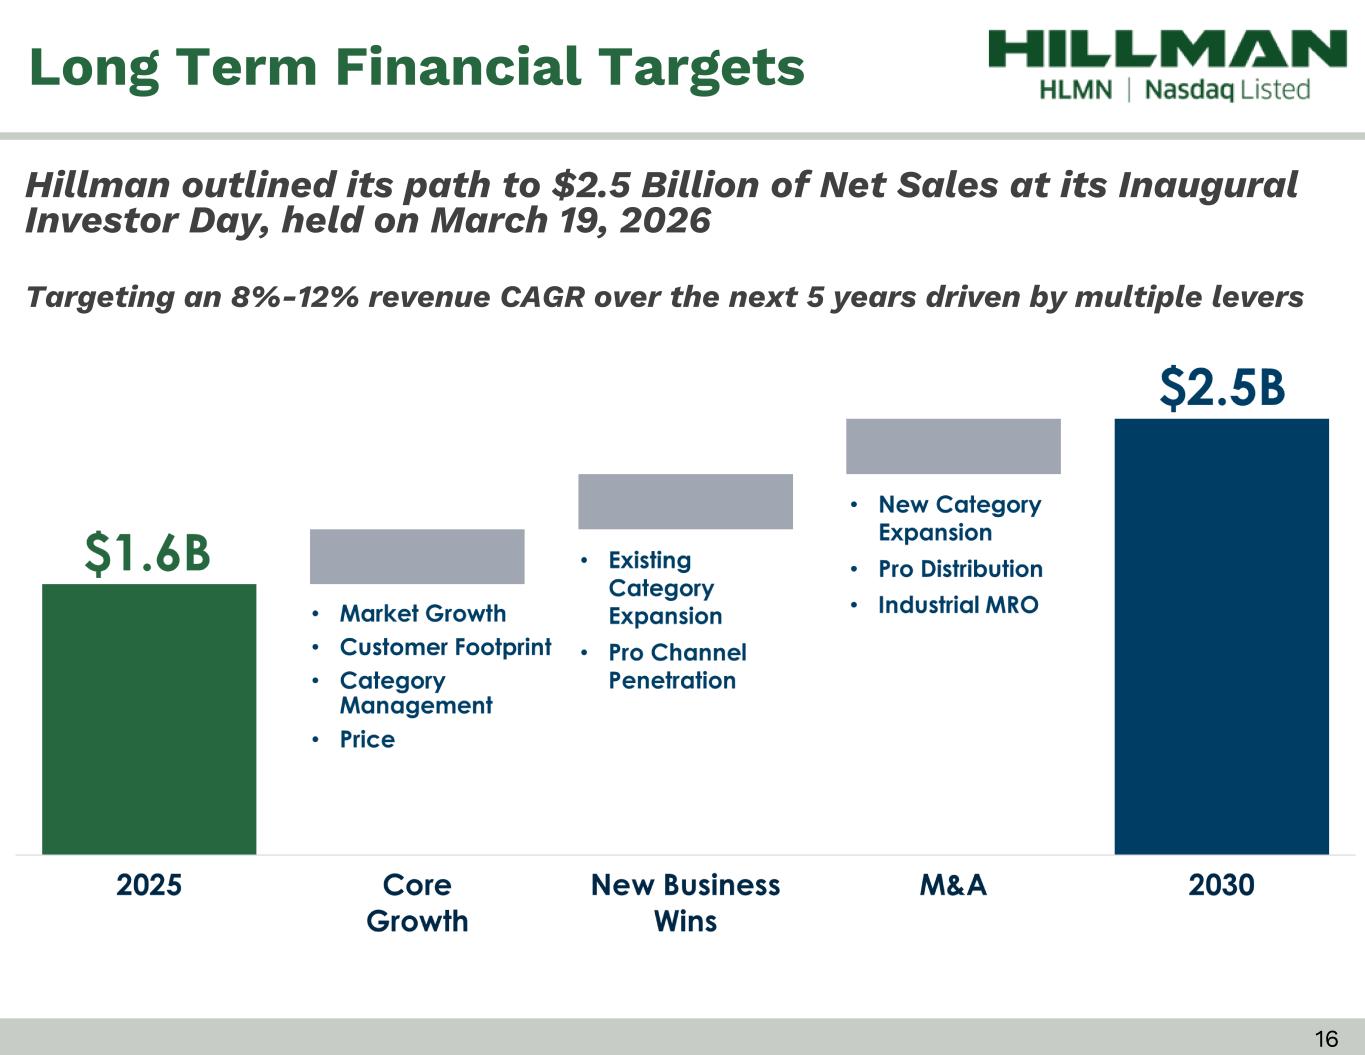
16 Long Term Financial Targets Hillman outlined its path to $2.5 Billion of Net Sales at its Inaugural Investor Day, held on March 19, 2026 Targeting an 8%-12% revenue CAGR over the next 5 years driven by multiple levers

Appendix
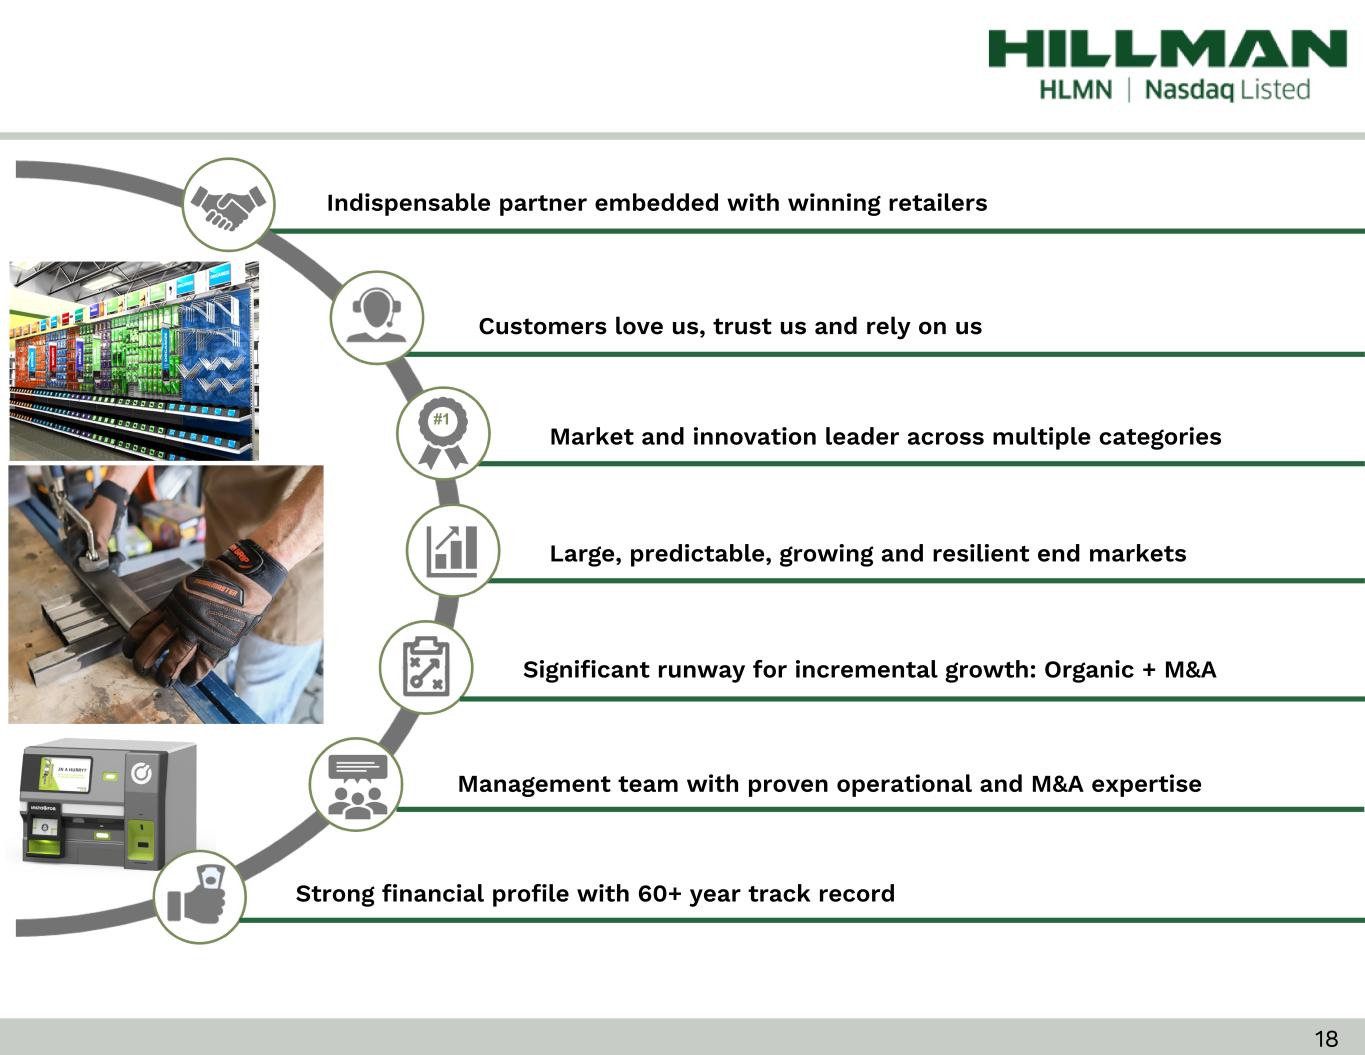
18 Investment Highlights Significant runway for incremental growth: Organic + M&A Management team with proven operational and M&A expertise Strong financial profile with 60+ year track record Market and innovation leader across multiple categories Indispensable partner embedded with winning retailers Customers love us, trust us and rely on us Large, predictable, growing and resilient end markets
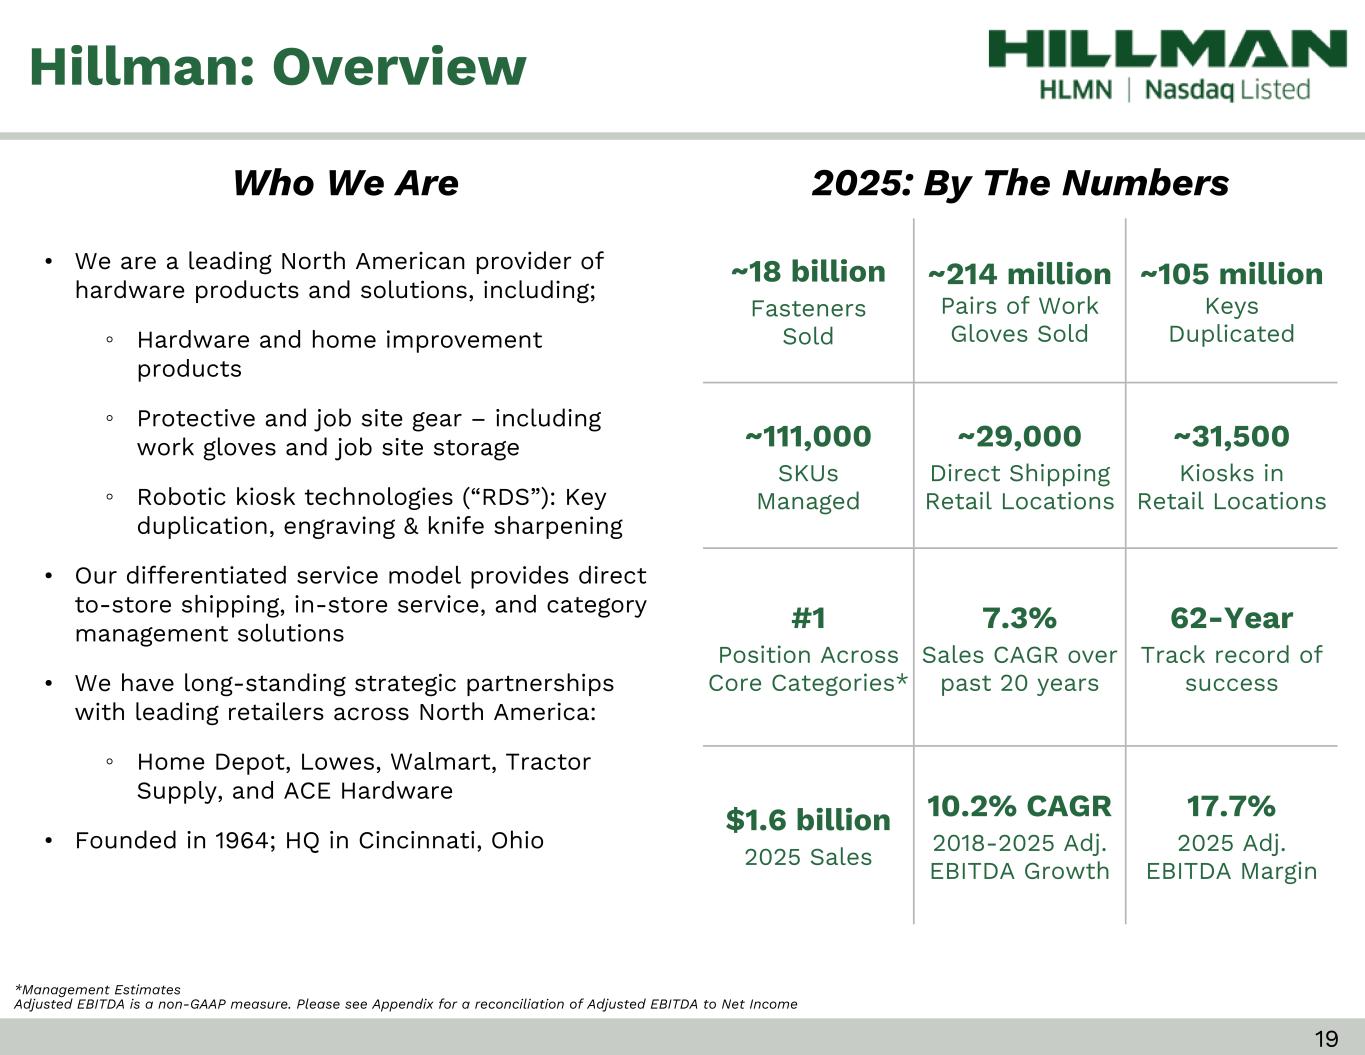
19 Hillman: Overview Who We Are *Management Estimates Adjusted EBITDA is a non-GAAP measure. Please see Appendix for a reconciliation of Adjusted EBITDA to Net Income ~18 billion Fasteners Sold ~214 million Pairs of Work Gloves Sold ~105 million Keys Duplicated ~111,000 SKUs Managed ~29,000 Direct Shipping Retail Locations ~31,500 Kiosks in Retail Locations #1 Position Across Core Categories* 7.3% Sales CAGR over past 20 years 62-Year Track record of success $1.6 billion 2025 Sales 10.2% CAGR 2018-2025 Adj. EBITDA Growth 17.7% 2025 Adj. EBITDA Margin 2025: By The Numbers • We are a leading North American provider of hardware products and solutions, including; ◦ Hardware and home improvement products ◦ Protective and job site gear – including work gloves and job site storage ◦ Robotic kiosk technologies (“RDS”): Key duplication, engraving & knife sharpening • Our differentiated service model provides direct to-store shipping, in-store service, and category management solutions • We have long-standing strategic partnerships with leading retailers across North America: ◦ Home Depot, Lowes, Walmart, Tractor Supply, and ACE Hardware • Founded in 1964; HQ in Cincinnati, Ohio
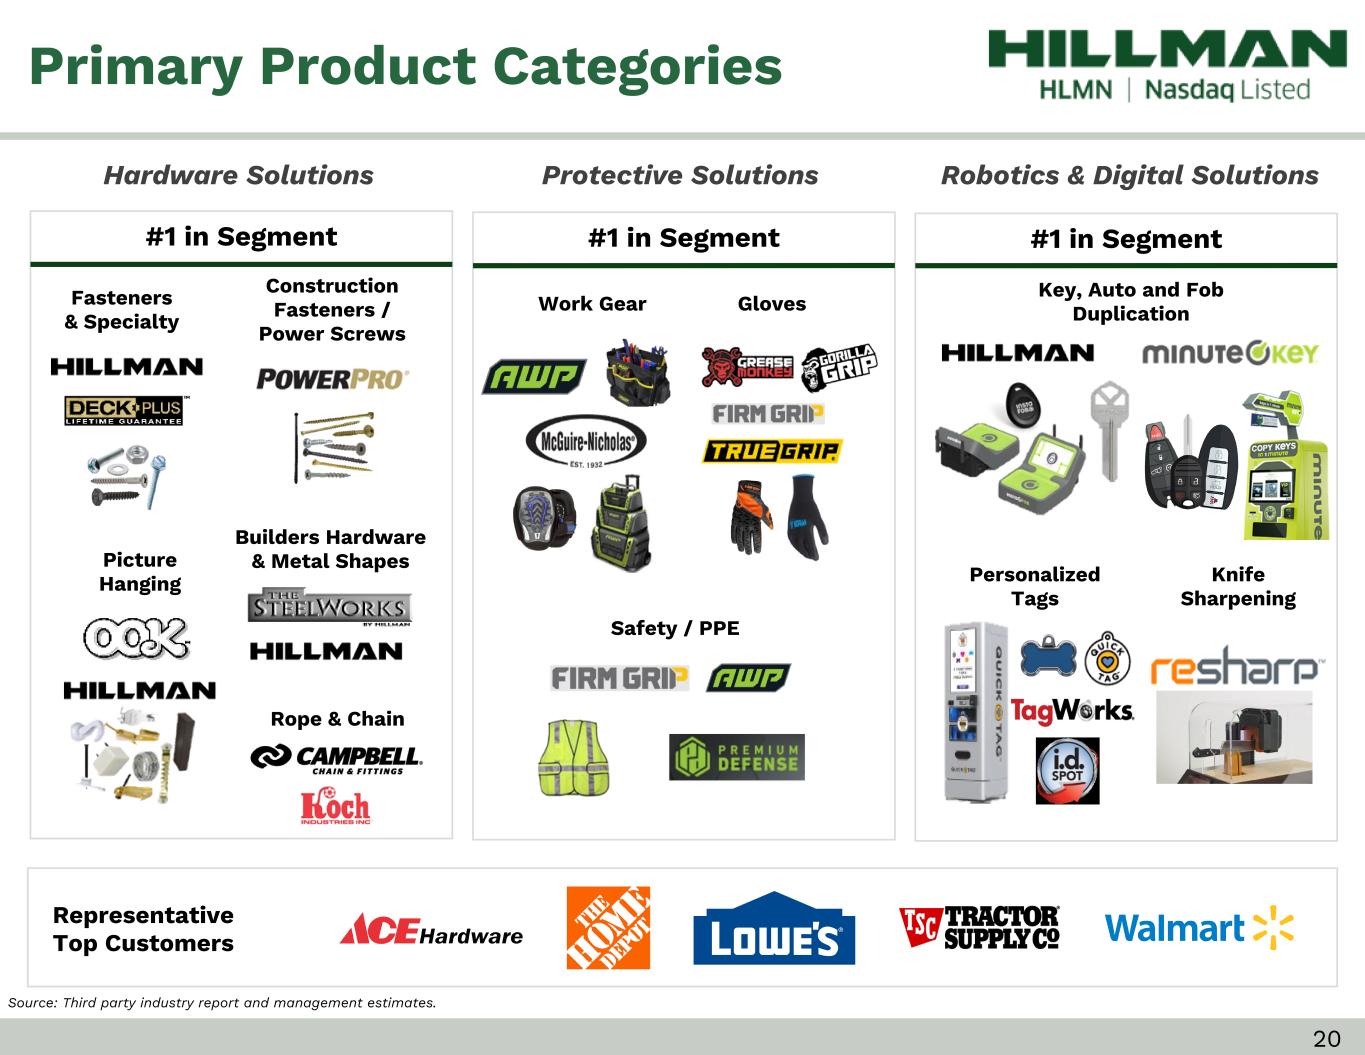
20 #1 in Segment Representative Top Customers #1 in Segment #1 in Segment Key, Auto and Fob Duplication Personalized Tags Knife Sharpening Fasteners & Specialty Gloves Builders Hardware & Metal Shapes Safety / PPE Construction Fasteners / Power Screws Work Gear Picture Hanging Source: Third party industry report and management estimates. Primary Product Categories Hardware Solutions Robotics & Digital SolutionsProtective Solutions Rope & Chain
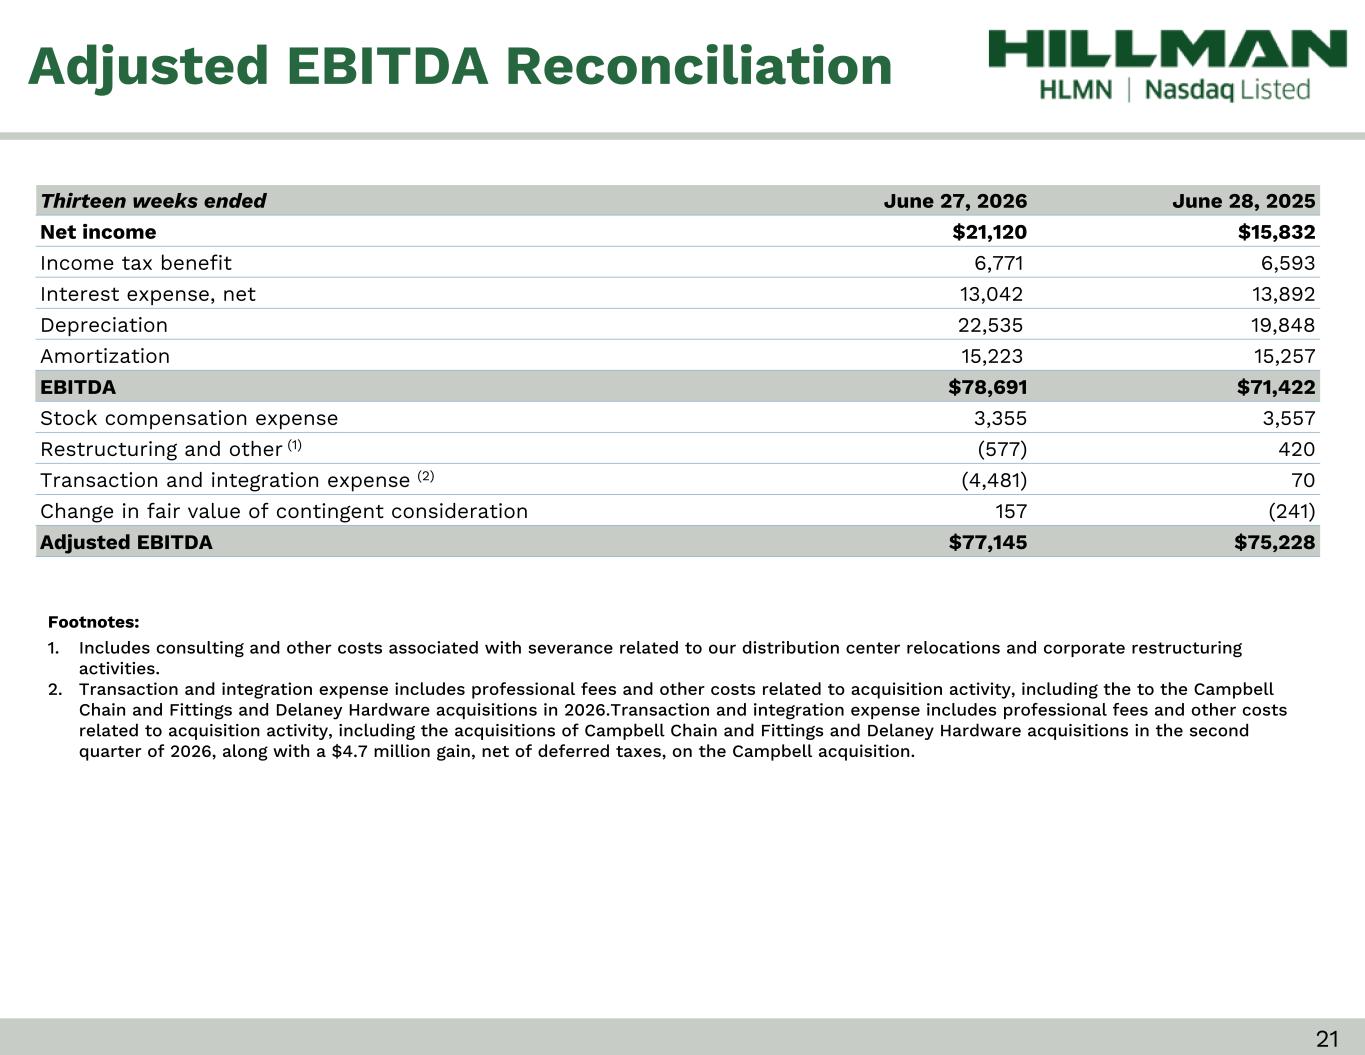
21 Thirteen weeks ended June 27, 2026 June 28, 2025 Net income $21,120 $15,832 Income tax benefit 6,771 6,593 Interest expense, net 13,042 13,892 Depreciation 22,535 19,848 Amortization 15,223 15,257 EBITDA $78,691 $71,422 Stock compensation expense 3,355 3,557 Restructuring and other (1) (577) 420 Transaction and integration expense (2) (4,481) 70 Change in fair value of contingent consideration 157 (241) Adjusted EBITDA $77,145 $75,228 Adjusted EBITDA Reconciliation Footnotes: 1. Includes consulting and other costs associated with severance related to our distribution center relocations and corporate restructuring activities. 2. Transaction and integration expense includes professional fees and other costs related to acquisition activity, including the to the Campbell Chain and Fittings and Delaney Hardware acquisitions in 2026.Transaction and integration expense includes professional fees and other costs related to acquisition activity, including the acquisitions of Campbell Chain and Fittings and Delaney Hardware acquisitions in the second quarter of 2026, along with a $4.7 million gain, net of deferred taxes, on the Campbell acquisition.
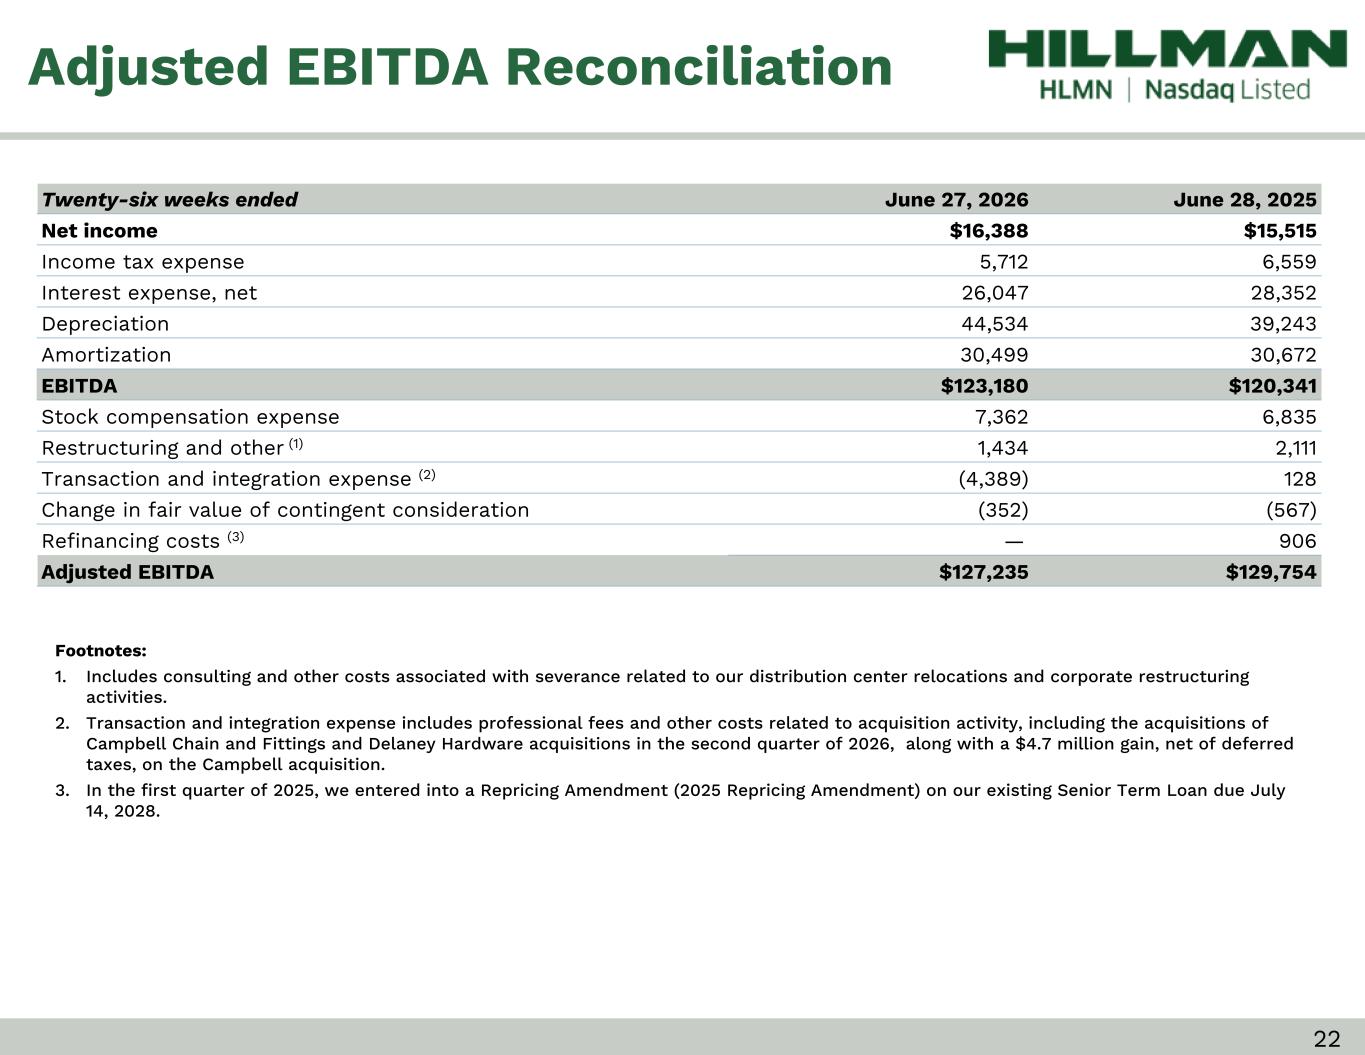
22 Twenty-six weeks ended June 27, 2026 June 28, 2025 Net income $16,388 $15,515 Income tax expense 5,712 6,559 Interest expense, net 26,047 28,352 Depreciation 44,534 39,243 Amortization 30,499 30,672 EBITDA $123,180 $120,341 Stock compensation expense 7,362 6,835 Restructuring and other (1) 1,434 2,111 Transaction and integration expense (2) (4,389) 128 Change in fair value of contingent consideration (352) (567) Refinancing costs (3) — 906 Adjusted EBITDA $127,235 $129,754 Adjusted EBITDA Reconciliation Footnotes: 1. Includes consulting and other costs associated with severance related to our distribution center relocations and corporate restructuring activities. 2. Transaction and integration expense includes professional fees and other costs related to acquisition activity, including the acquisitions of Campbell Chain and Fittings and Delaney Hardware acquisitions in the second quarter of 2026, along with a $4.7 million gain, net of deferred taxes, on the Campbell acquisition. 3. In the first quarter of 2025, we entered into a Repricing Amendment (2025 Repricing Amendment) on our existing Senior Term Loan due July 14, 2028.
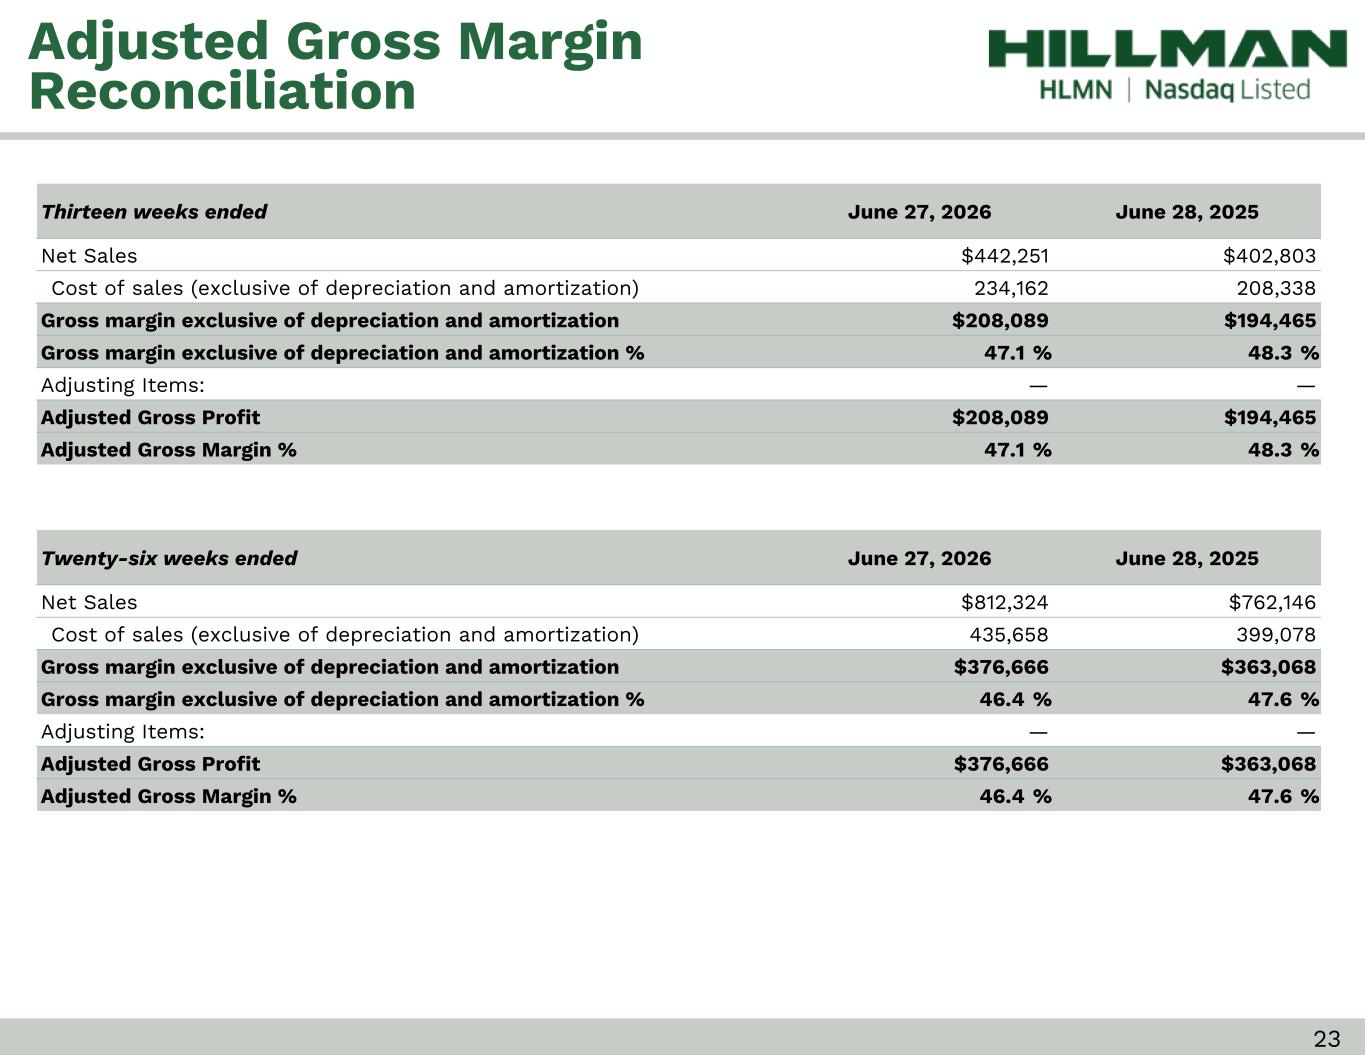
23 Thirteen weeks ended June 27, 2026 June 28, 2025 Net Sales $442,251 $402,803 Cost of sales (exclusive of depreciation and amortization) 234,162 208,338 Gross margin exclusive of depreciation and amortization $208,089 $194,465 Gross margin exclusive of depreciation and amortization % 47.1 % 48.3 % Adjusting Items: — — Adjusted Gross Profit $208,089 $194,465 Adjusted Gross Margin % 47.1 % 48.3 % Twenty-six weeks ended June 27, 2026 June 28, 2025 Net Sales $812,324 $762,146 Cost of sales (exclusive of depreciation and amortization) 435,658 399,078 Gross margin exclusive of depreciation and amortization $376,666 $363,068 Gross margin exclusive of depreciation and amortization % 46.4 % 47.6 % Adjusting Items: — — Adjusted Gross Profit $376,666 $363,068 Adjusted Gross Margin % 46.4 % 47.6 % Adjusted Gross Margin Reconciliation
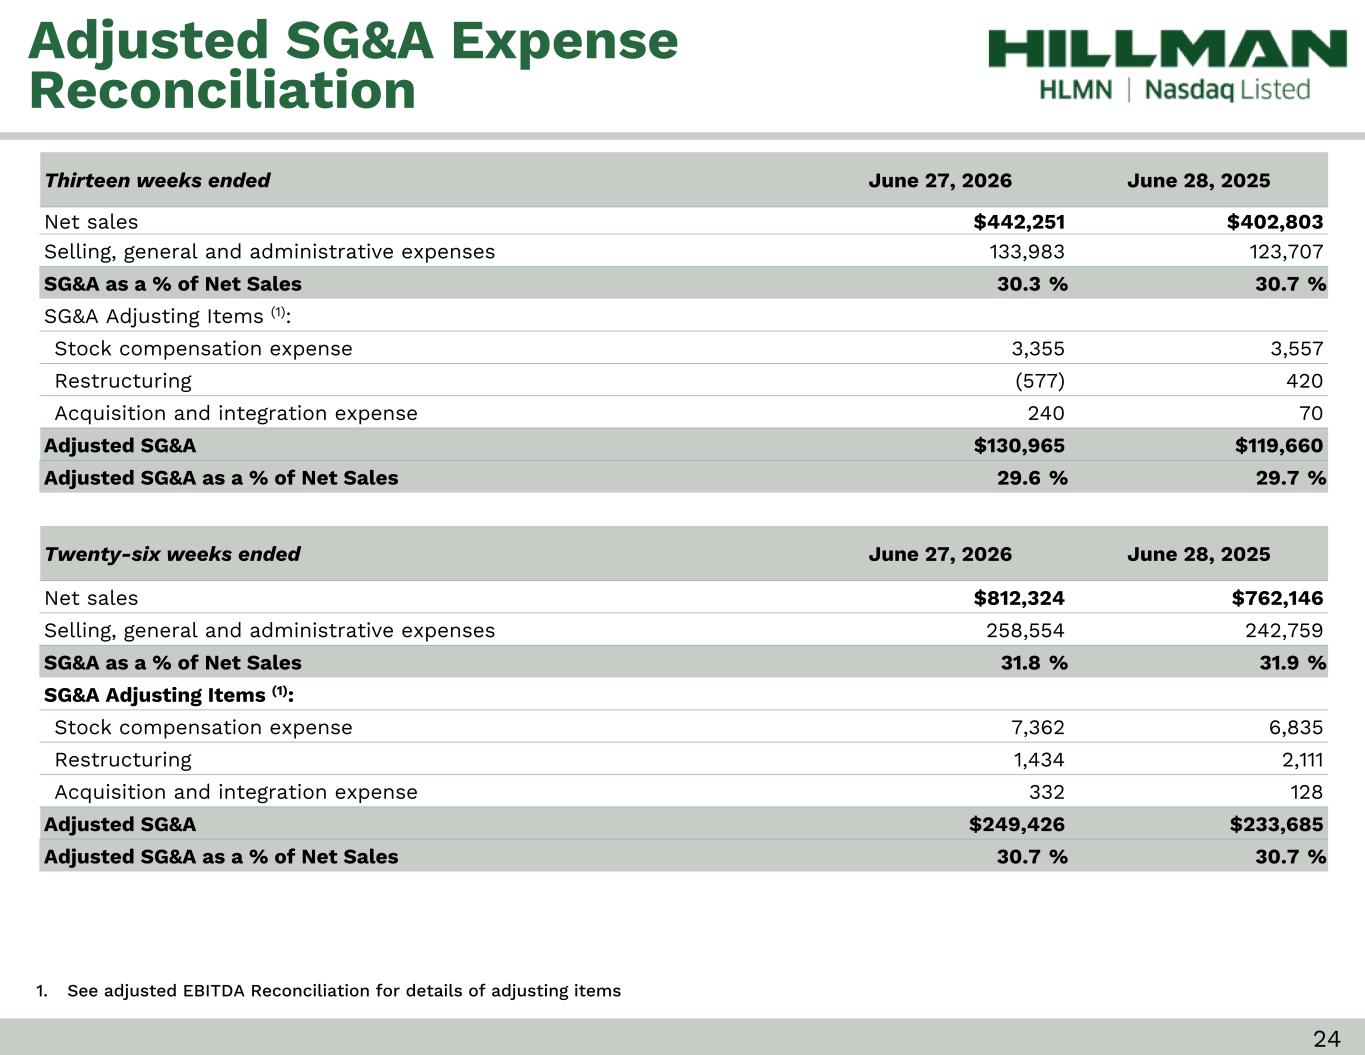
24 Thirteen weeks ended June 27, 2026 June 28, 2025 Net sales $442,251 $402,803 Selling, general and administrative expenses 133,983 123,707 SG&A as a % of Net Sales 30.3 % 30.7 % SG&A Adjusting Items (1): Stock compensation expense 3,355 3,557 Restructuring (577) 420 Acquisition and integration expense 240 70 Adjusted SG&A $130,965 $119,660 Adjusted SG&A as a % of Net Sales 29.6 % 29.7 % Twenty-six weeks ended June 27, 2026 June 28, 2025 Net sales $812,324 $762,146 Selling, general and administrative expenses 258,554 242,759 SG&A as a % of Net Sales 31.8 % 31.9 % SG&A Adjusting Items (1): Stock compensation expense 7,362 6,835 Restructuring 1,434 2,111 Acquisition and integration expense 332 128 Adjusted SG&A $249,426 $233,685 Adjusted SG&A as a % of Net Sales 30.7 % 30.7 % Adjusted SG&A Expense Reconciliation 1. See adjusted EBITDA Reconciliation for details of adjusting items
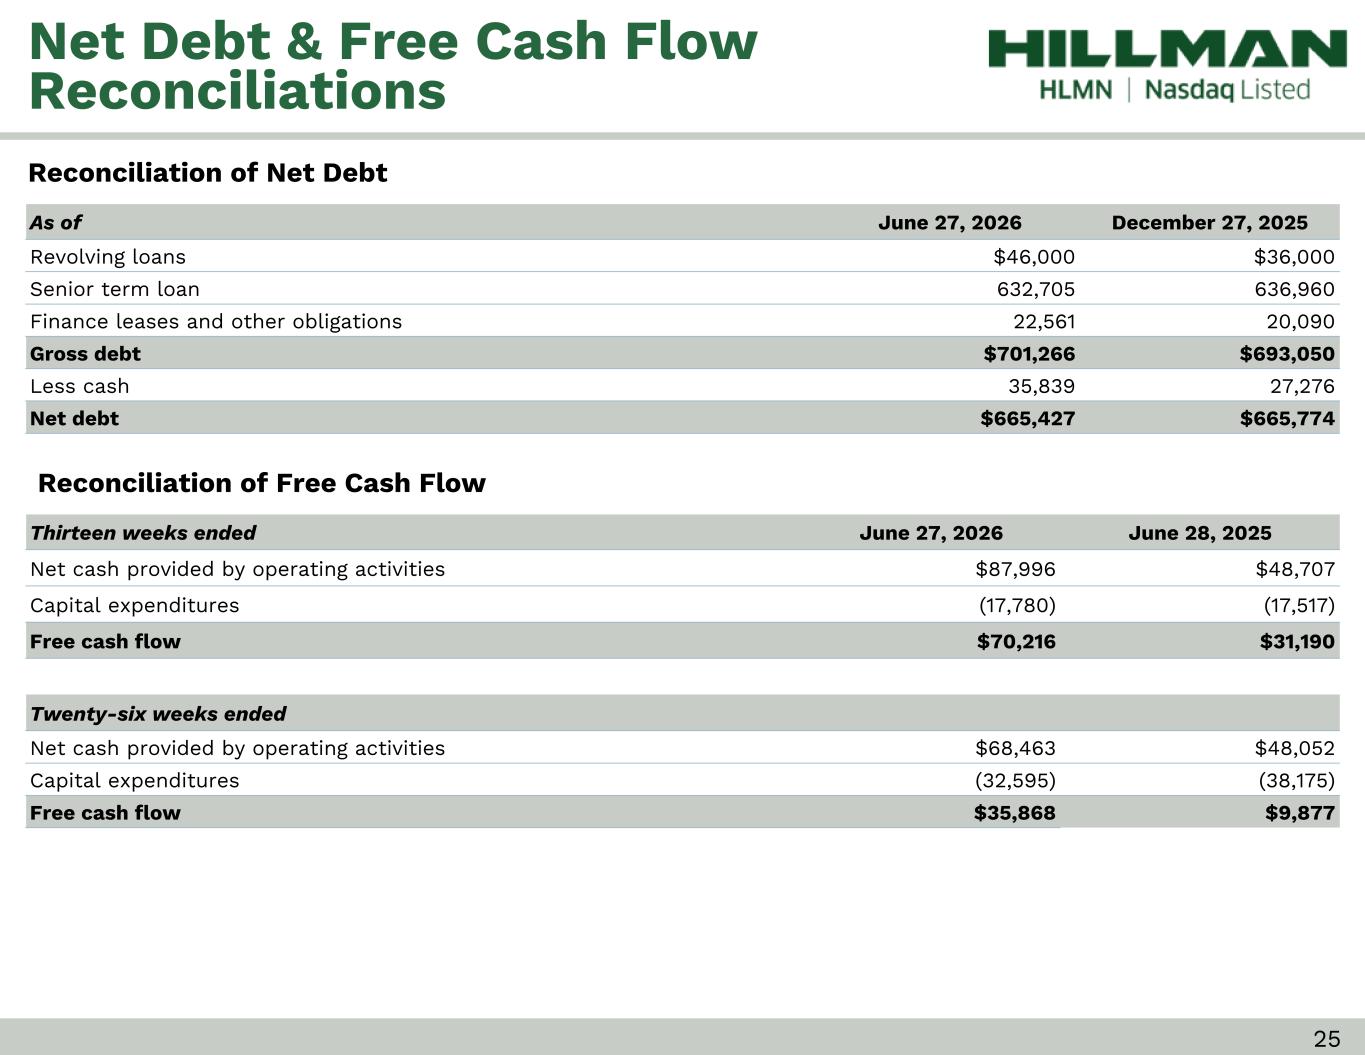
25 As of June 27, 2026 December 27, 2025 Revolving loans $46,000 $36,000 Senior term loan 632,705 636,960 Finance leases and other obligations 22,561 20,090 Gross debt $701,266 $693,050 Less cash 35,839 27,276 Net debt $665,427 $665,774 Net Debt & Free Cash Flow Reconciliations Thirteen weeks ended June 27, 2026 June 28, 2025 Net cash provided by operating activities $87,996 $48,707 Capital expenditures (17,780) (17,517) Free cash flow $70,216 $31,190 Twenty-six weeks ended Net cash provided by operating activities $68,463 $48,052 Capital expenditures (32,595) (38,175) Free cash flow $35,868 $9,877 Reconciliation of Net Debt Reconciliation of Free Cash Flow
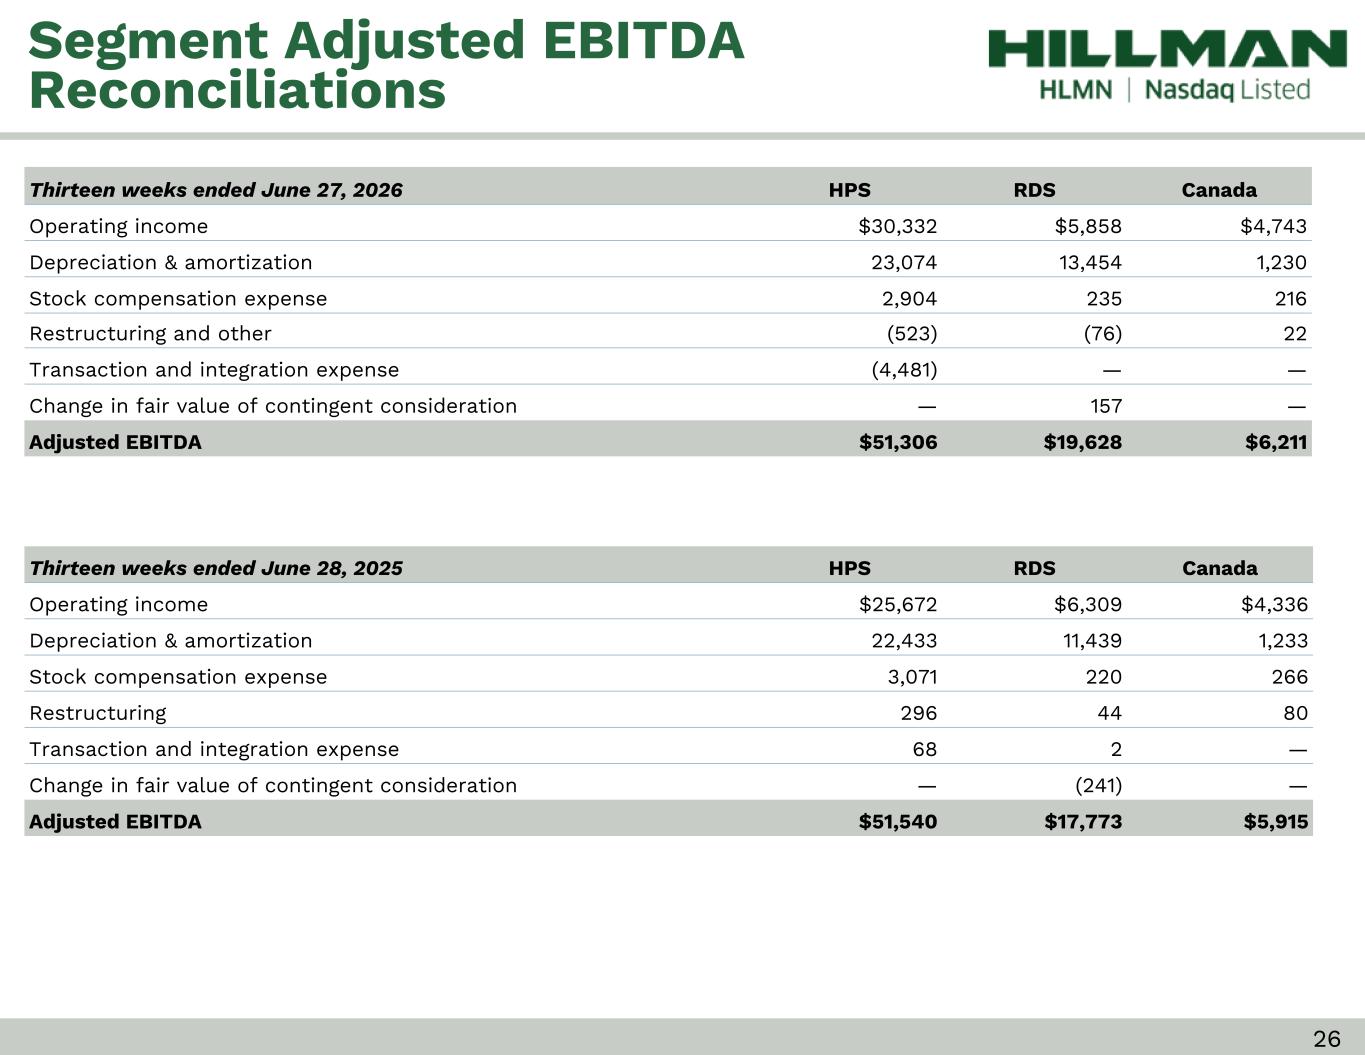
26 Thirteen weeks ended June 27, 2026 HPS RDS Canada Operating income $30,332 $5,858 $4,743 Depreciation & amortization 23,074 13,454 1,230 Stock compensation expense 2,904 235 216 Restructuring and other (523) (76) 22 Transaction and integration expense (4,481) — — Change in fair value of contingent consideration — 157 — Adjusted EBITDA $51,306 $19,628 $6,211 Thirteen weeks ended June 28, 2025 HPS RDS Canada Operating income $25,672 $6,309 $4,336 Depreciation & amortization 22,433 11,439 1,233 Stock compensation expense 3,071 220 266 Restructuring 296 44 80 Transaction and integration expense 68 2 — Change in fair value of contingent consideration — (241) — Adjusted EBITDA $51,540 $17,773 $5,915 Segment Adjusted EBITDA Reconciliations
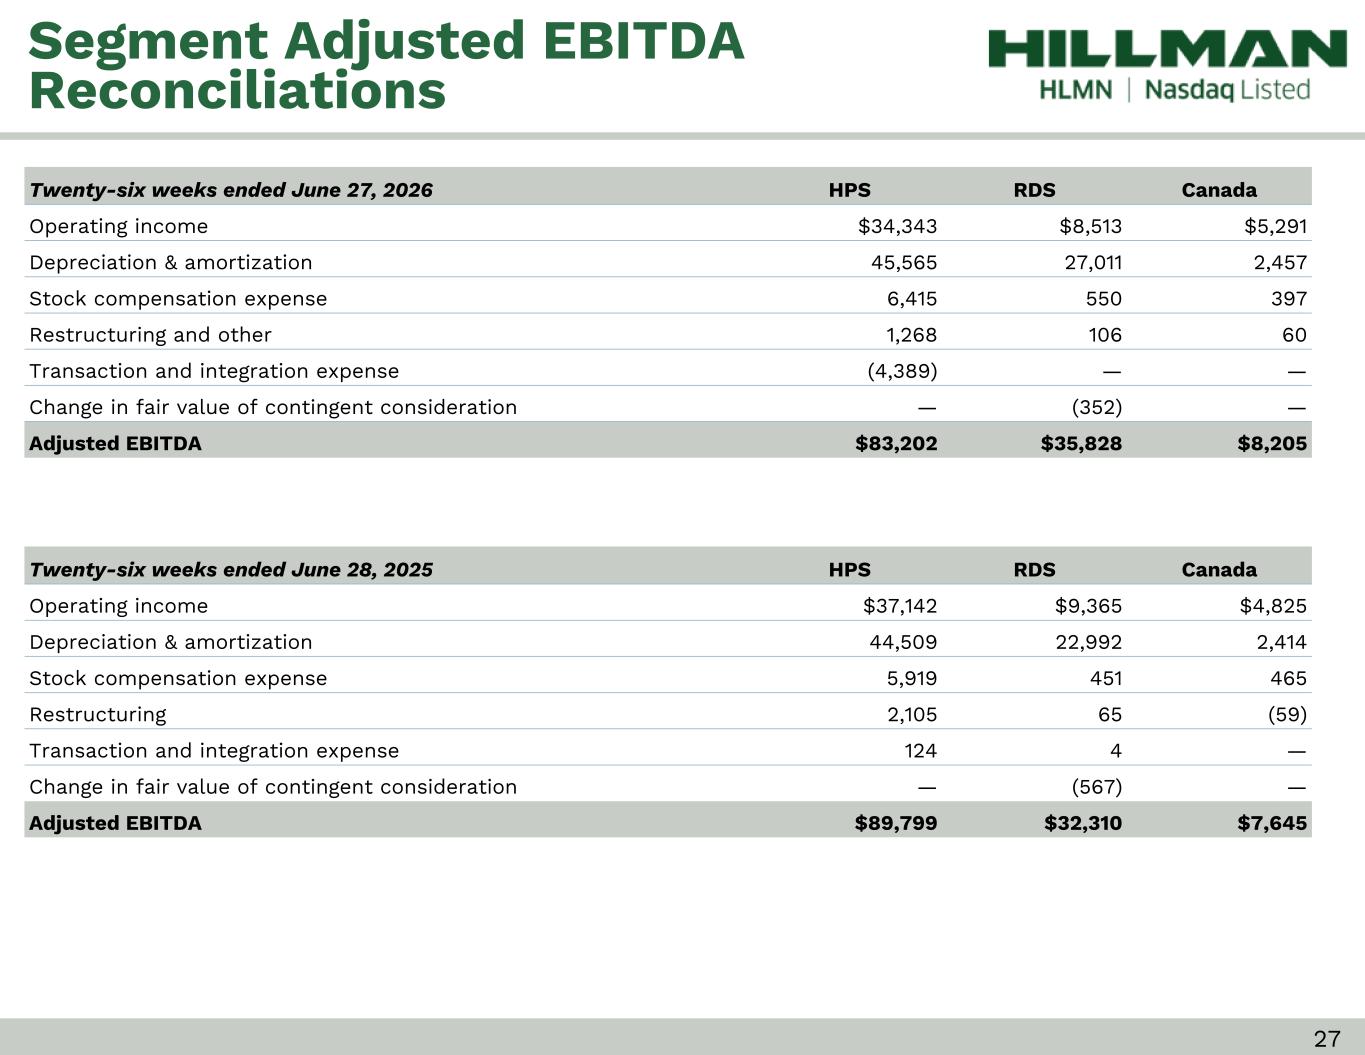
27 Twenty-six weeks ended June 27, 2026 HPS RDS Canada Operating income $34,343 $8,513 $5,291 Depreciation & amortization 45,565 27,011 2,457 Stock compensation expense 6,415 550 397 Restructuring and other 1,268 106 60 Transaction and integration expense (4,389) — — Change in fair value of contingent consideration — (352) — Adjusted EBITDA $83,202 $35,828 $8,205 Twenty-six weeks ended June 28, 2025 HPS RDS Canada Operating income $37,142 $9,365 $4,825 Depreciation & amortization 44,509 22,992 2,414 Stock compensation expense 5,919 451 465 Restructuring 2,105 65 (59) Transaction and integration expense 124 4 — Change in fair value of contingent consideration — (567) — Adjusted EBITDA $89,799 $32,310 $7,645 Segment Adjusted EBITDA Reconciliations