
We build and service the infrastructure that enables our economy to run, our people to move, and our country to grow. Q2 2026 EARNINGS CALL August 4, 2026
2Sterling | STRL: Second Quarter 2026 DISCLOSURE: Forward-Looking Statements This presentation contains, and the officers and directors of the Company may from time to time make, statements that are considered forward- looking statements within the meaning of the Securities Act of 1933 and the Securities Exchange Act of 1934. These forward-looking statements are subject to a number of risks and uncertainties, many of which are beyond our control, which may include statements about: the anticipated benefits of the CEC and Stone Ridge acquisitions; our business strategy; our financial strategy; our industry outlook; our guidance; our expected earnings and margin growth; our pool of future work; and our plans, objectives, expectations, forecasts, outlook and intentions. All of these types of statements, other than statements of historical fact included in this presentation, are forward-looking statements. In some cases, forward-looking statements can be identified by terminology such as “may,” “will,” “could,” "would," “should,” “expect,” “plan,” “project,” “intend,” “anticipate,” “believe,” “estimate,” “predict,” “potential,” “pursue,” “target,” "guidance," “continue,” the negative of such terms or other comparable terminology. The forward-looking statements contained in this presentation are largely based on our expectations, which reflect estimates and assumptions made by our management. These estimates and assumptions reflect our best judgment based on currently known market conditions and other factors. Although we believe such estimates and assumptions to be reasonable, they are inherently uncertain and involve a number of risks and uncertainties that are beyond our control. In addition, management’s assumptions about future events may prove to be inaccurate. Management cautions all readers that the forward- looking statements contained in this presentation are not guarantees of future performance, and we cannot assure any reader that such statements will be realized or the forward-looking events and circumstances will occur. Actual results may differ materially from those anticipated or implied in the forward-looking statements due to factors listed in the “Risk Factors” section in our filings with the U.S. Securities and Exchange Commission and elsewhere in those filings. Additional factors or risks that we currently deem immaterial, that are not presently known to us or that arise in the future could also cause our actual results to differ materially from our expected results. Given these uncertainties, investors are cautioned that many of the assumptions upon which our forward-looking statements are based are likely to change after the date the forward-looking statements are made. The forward-looking statements speak only as of the date made, and we undertake no obligation to publicly update or revise any forward-looking statements for any reason, whether as a result of new information, future events or developments, changed circumstances, or otherwise, notwithstanding any changes in our assumptions, changes in business plans, actual experience or other changes. These cautionary statements qualify all forward-looking statements attributable to us or persons acting on our behalf. This presentation may contain the financial measures: adjusted net income, adjusted operating income, EBITDA, adjusted EBITDA, and adjusted EPS, which are not calculated in accordance with U.S. GAAP. When presented, a reconciliation of the non-GAAP financial measures to the most directly comparable GAAP financial measure will be provided in the Appendix to this presentation.
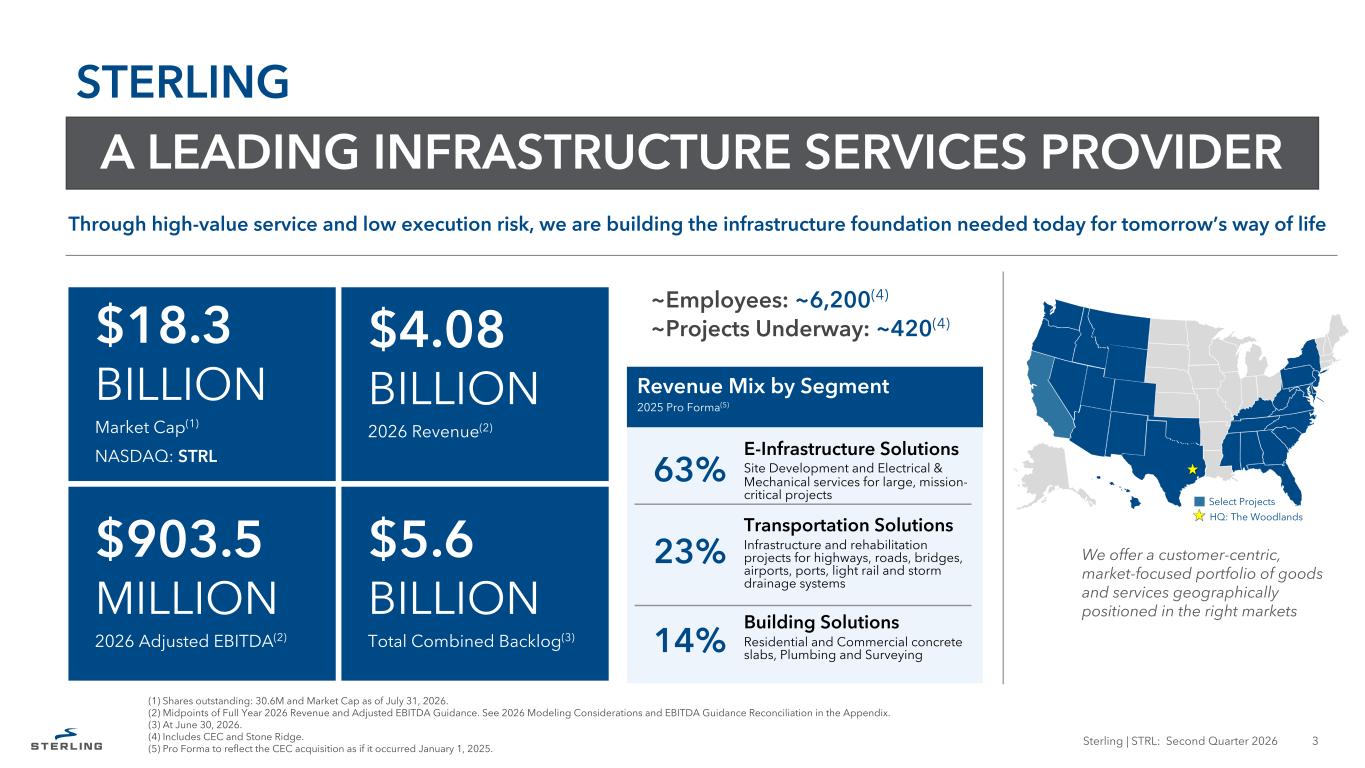
Through high-value service and low execution risk, we are building the infrastructure foundation needed today for tomorrow’s way of life $18.3 BILLION Market Cap(1) NASDAQ: STRL $4.08 BILLION 2026 Revenue(2) $903.5 MILLION 2026 Adjusted EBITDA(2) $5.6 BILLION Total Combined Backlog(3) Sterling | STRL: Second Quarter 2026 3 (1) Shares outstanding: 30.6M and Market Cap as of July 31, 2026. (2) Midpoints of Full Year 2026 Revenue and Adjusted EBITDA Guidance. See 2026 Modeling Considerations and EBITDA Guidance Reconciliation in the Appendix. (3) At June 30, 2026. (4) Includes CEC and Stone Ridge. (5) Pro Forma to reflect the CEC acquisition as if it occurred January 1, 2025. STERLING ~Employees: ~6,200(4) ~Projects Underway: ~420(4) A LEADING INFRASTRUCTURE SERVICES PROVIDER We offer a customer-centric, market-focused portfolio of goods and services geographically positioned in the right markets Select Projects HQ: The Woodlands E-Infrastructure Solutions Site Development and Electrical & Mechanical services for large, mission- critical projects Transportation Solutions Infrastructure and rehabilitation projects for highways, roads, bridges, airports, ports, light rail and storm drainage systems Building Solutions Residential and Commercial concrete slabs, Plumbing and Surveying Revenue Mix by Segment 2025 Pro Forma(5) 63% 23% 14%
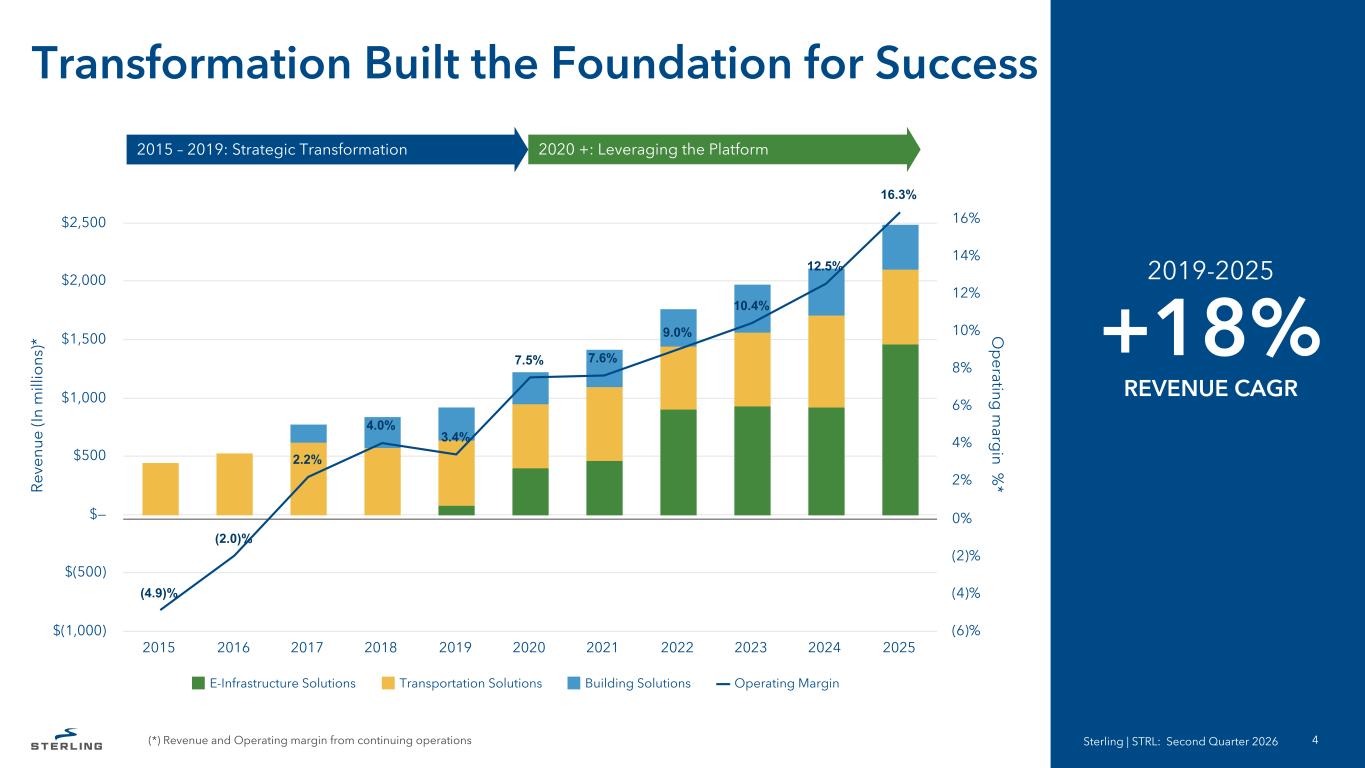
+18% REVENUE CAGR 2019-2025 4 R ev en ue (I n m ill io ns )* O p erating m arg in % * (4.9)% (2.0)% 2.2% 4.0% 3.4% 7.5% 7.6% 9.0% 10.4% 12.5% 16.3% E-Infrastructure Solutions Transportation Solutions Building Solutions Operating Margin 2015 2016 2017 2018 2019 2020 2021 2022 2023 2024 2025 $(1,000) $(500) $— $500 $1,000 $1,500 $2,000 $2,500 (6)% (4)% (2)% 0% 2% 4% 6% 8% 10% 12% 14% 16% 2015 – 2019: Strategic Transformation 2020 +: Leveraging the Platform Transformation Built the Foundation for Success (*) Revenue and Operating margin from continuing operations Sterling | STRL: Second Quarter 2026
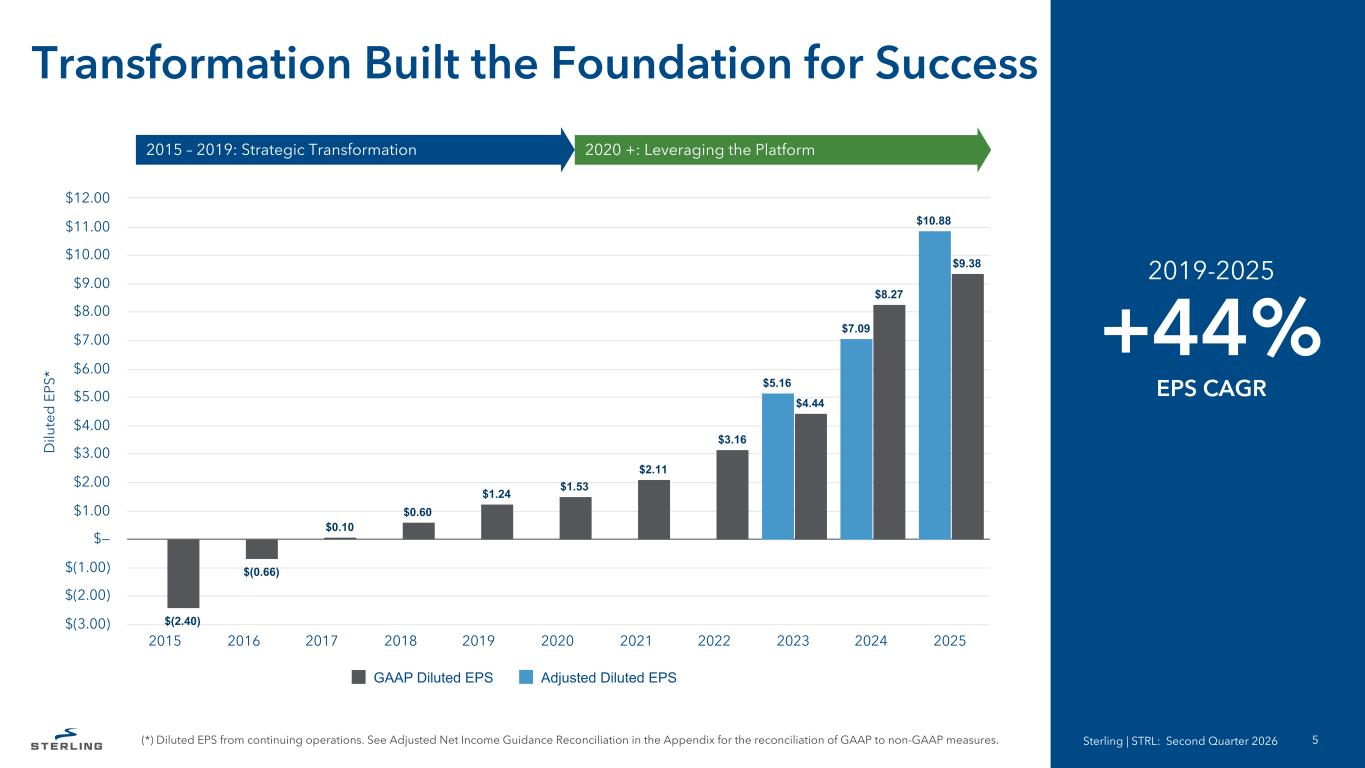
+44% EPS CAGR 2019-2025 5 2015 – 2019: Strategic Transformation 2020 +: Leveraging the Platform Transformation Built the Foundation for Success (*) Diluted EPS from continuing operations. See Adjusted Net Income Guidance Reconciliation in the Appendix for the reconciliation of GAAP to non-GAAP measures. Sterling | STRL: Second Quarter 2026 D ilu te d E PS * $5.16 $7.09 $10.88 $(2.40) $(0.66) $0.10 $0.60 $1.24 $1.53 $2.11 $3.16 $4.44 $8.27 $9.38 GAAP Diluted EPS Adjusted Diluted EPS 2015 2016 2017 2018 2019 2020 2021 2022 2023 2024 2025 $(3.00) $(2.00) $(1.00) $— $1.00 $2.00 $3.00 $4.00 $5.00 $6.00 $7.00 $8.00 $9.00 $10.00 $11.00 $12.00
SECOND QUARTER 2026 RESULTS Sterling | STRL: Second Quarter 2026 6
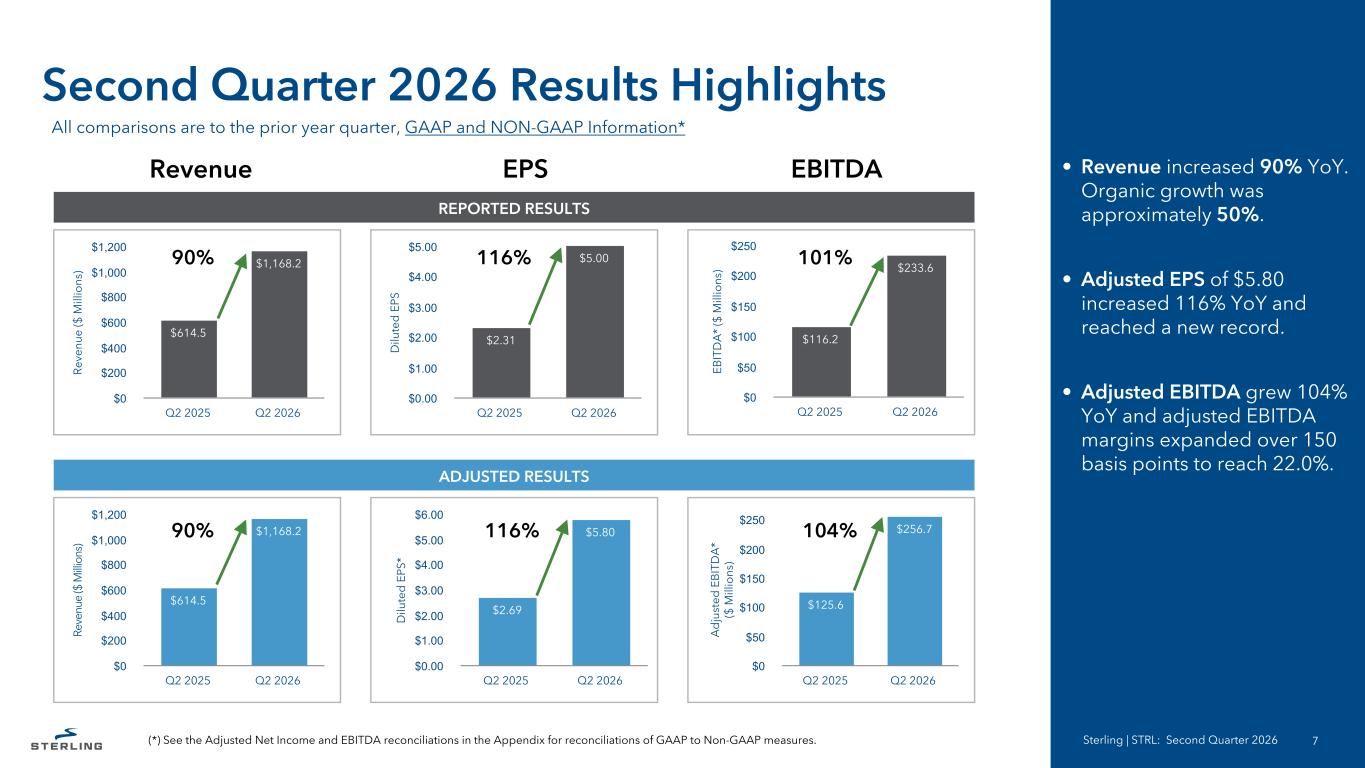
A d ju st ed E B IT D A * ($ M ill io ns ) $125.6 $256.7 Q2 2025 Q2 2026 $0 $50 $100 $150 $200 $250 D ilu te d E PS * $2.69 $5.80 Q2 2025 Q2 2026 $0.00 $1.00 $2.00 $3.00 $4.00 $5.00 $6.00 EB IT D A * ($ M ill io ns ) $116.2 $233.6 Q2 2025 Q2 2026 $0 $50 $100 $150 $200 $250 D ilu te d E PS $2.31 $5.00 Q2 2025 Q2 2026 $0.00 $1.00 $2.00 $3.00 $4.00 $5.00 Re ve nu e ($ M ill io ns ) $614.5 $1,168.2 Q2 2025 Q2 2026 $0 $200 $400 $600 $800 $1,000 $1,200 Re ve nu e ($ M ill io ns ) $614.5 $1,168.2 Q2 2025 Q2 2026 $0 $200 $400 $600 $800 $1,000 $1,200 REPORTED RESULTS Second Quarter 2026 Results Highlights • Revenue increased 90% YoY. Organic growth was approximately 50%. • Adjusted EPS of $5.80 increased 116% YoY and reached a new record. • Adjusted EBITDA grew 104% YoY and adjusted EBITDA margins expanded over 150 basis points to reach 22.0%. (*) See the Adjusted Net Income and EBITDA reconciliations in the Appendix for reconciliations of GAAP to Non-GAAP measures. Sterling | STRL: Second Quarter 2026 7 90% 90% 116% 101% 116% 104% Revenue EPS EBITDA ADJUSTED RESULTS All comparisons are to the prior year quarter, GAAP and NON-GAAP Information*
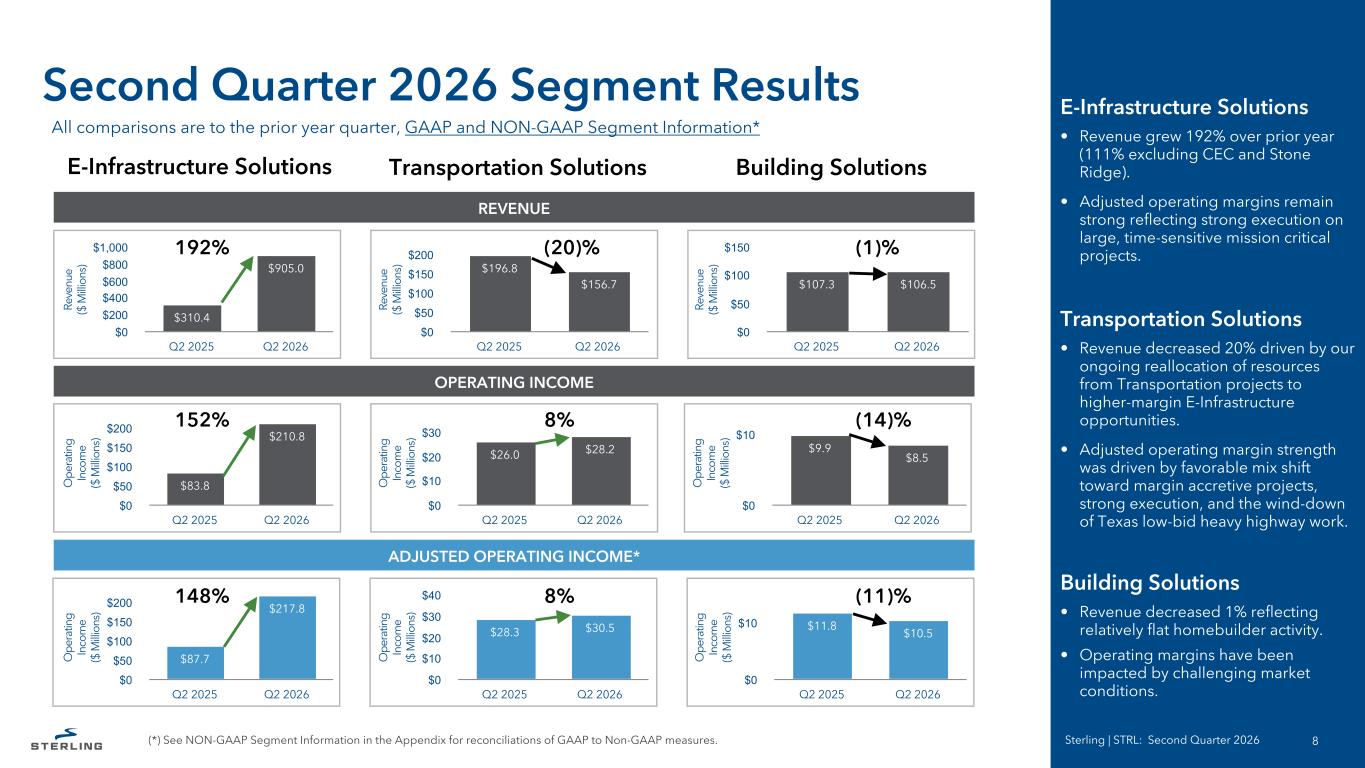
O pe ra tin g In co m e ($ M ill io ns ) $83.8 $210.8 Q2 2025 Q2 2026 $0 $50 $100 $150 $200 O pe ra tin g In co m e ($ M ill io ns ) $26.0 $28.2 Q2 2025 Q2 2026 $0 $10 $20 $30 O pe ra tin g In co m e ($ M ill io ns ) $9.9 $8.5 Q2 2025 Q2 2026 $0 $10 Re ve nu e ($ M ill io ns ) $310.4 $905.0 Q2 2025 Q2 2026 $0 $200 $400 $600 $800 $1,000 Re ve nu e ($ M ill io ns ) $196.8 $156.7 Q2 2025 Q2 2026 $0 $50 $100 $150 $200 Re ve nu e ($ M ill io ns ) $107.3 $106.5 Q2 2025 Q2 2026 $0 $50 $100 $150 Second Quarter 2026 Segment Results Sterling | STRL: Second Quarter 2026 8 Transportation Solutions Building Solutions 192% E-Infrastructure Solutions (20)% (1)% 152% 8% (14)% All comparisons are to the prior year quarter, GAAP and NON-GAAP Segment Information* REVENUE OPERATING INCOME E-Infrastructure Solutions • Revenue grew 192% over prior year (111% excluding CEC and Stone Ridge). • Adjusted operating margins remain strong reflecting strong execution on large, time-sensitive mission critical projects. Transportation Solutions • Revenue decreased 20% driven by our ongoing reallocation of resources from Transportation projects to higher-margin E-Infrastructure opportunities. • Adjusted operating margin strength was driven by favorable mix shift toward margin accretive projects, strong execution, and the wind-down of Texas low-bid heavy highway work. Building Solutions • Revenue decreased 1% reflecting relatively flat homebuilder activity. • Operating margins have been impacted by challenging market conditions. ADJUSTED OPERATING INCOME* O pe ra tin g In co m e ($ M ill io ns ) $87.7 $217.8 Q2 2025 Q2 2026 $0 $50 $100 $150 $200 O pe ra tin g In co m e ($ M ill io ns ) $28.3 $30.5 Q2 2025 Q2 2026 $0 $10 $20 $30 $40 O pe ra tin g In co m e ($ M ill io ns ) $11.8 $10.5 Q2 2025 Q2 2026 $0 $10 148% 8% (11)% (*) See NON-GAAP Segment Information in the Appendix for reconciliations of GAAP to Non-GAAP measures.
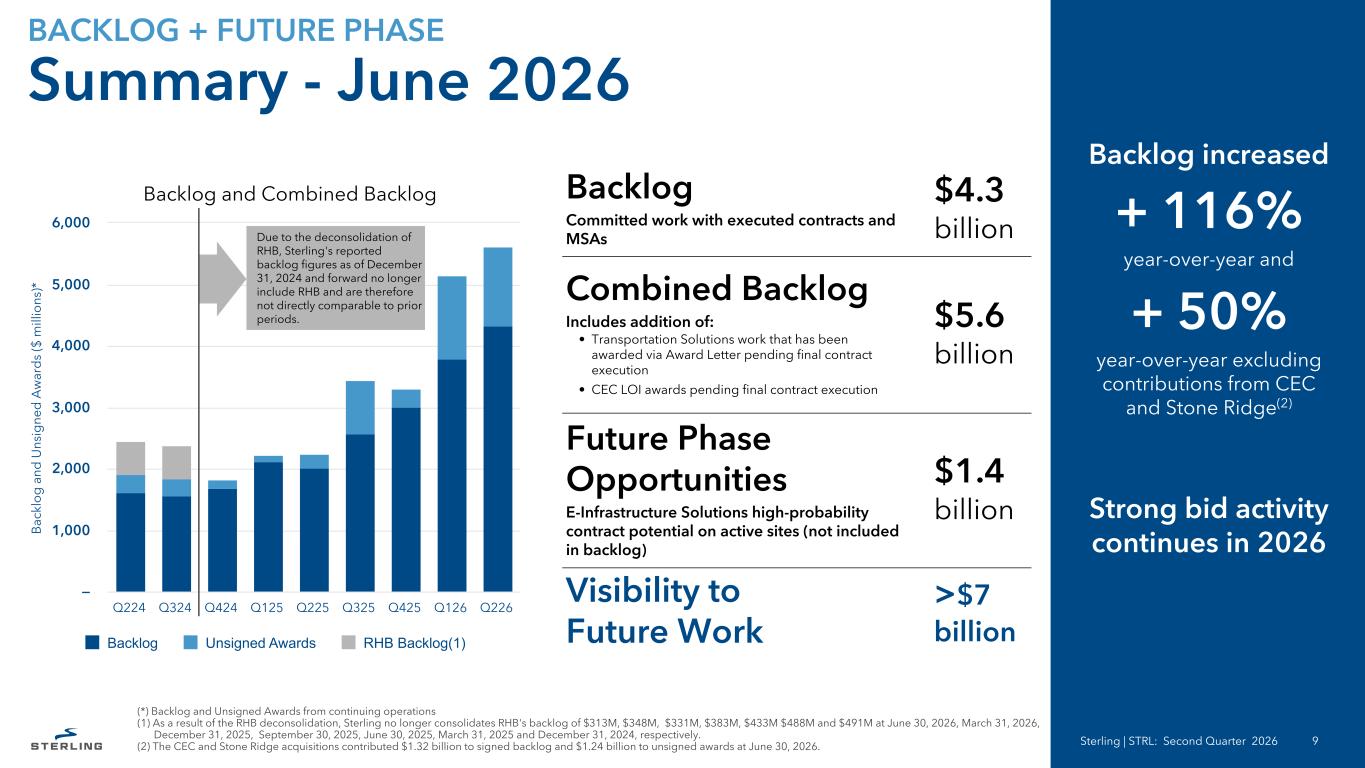
Backlog and Combined Backlog B ac kl o g a nd U ns ig ne d A w ar d s ($ m ill io ns )* Backlog Unsigned Awards RHB Backlog(1) Q224 Q324 Q424 Q125 Q225 Q325 Q425 Q126 Q226 — 1,000 2,000 3,000 4,000 5,000 6,000 Sterling | STRL: Second Quarter 2026 9 Backlog increased + 116% year-over-year and + 50% year-over-year excluding contributions from CEC and Stone Ridge(2) Strong bid activity continues in 2026 BACKLOG + FUTURE PHASE Summary - June 2026 Due to the deconsolidation of RHB, Sterling's reported backlog figures as of December 31, 2024 and forward no longer include RHB and are therefore not directly comparable to prior periods. Backlog Committed work with executed contracts and MSAs $4.3 billion Combined Backlog Includes addition of: • Transportation Solutions work that has been awarded via Award Letter pending final contract execution • CEC LOI awards pending final contract execution $5.6 billion Future Phase Opportunities E-Infrastructure Solutions high-probability contract potential on active sites (not included in backlog) $1.4 billion Visibility to Future Work >$7 billion (*) Backlog and Unsigned Awards from continuing operations (1) As a result of the RHB deconsolidation, Sterling no longer consolidates RHB's backlog of $313M, $348M, $331M, $383M, $433M $488M and $491M at June 30, 2026, March 31, 2026, December 31, 2025, September 30, 2025, June 30, 2025, March 31, 2025 and December 31, 2024, respectively. (2) The CEC and Stone Ridge acquisitions contributed $1.32 billion to signed backlog and $1.24 billion to unsigned awards at June 30, 2026.
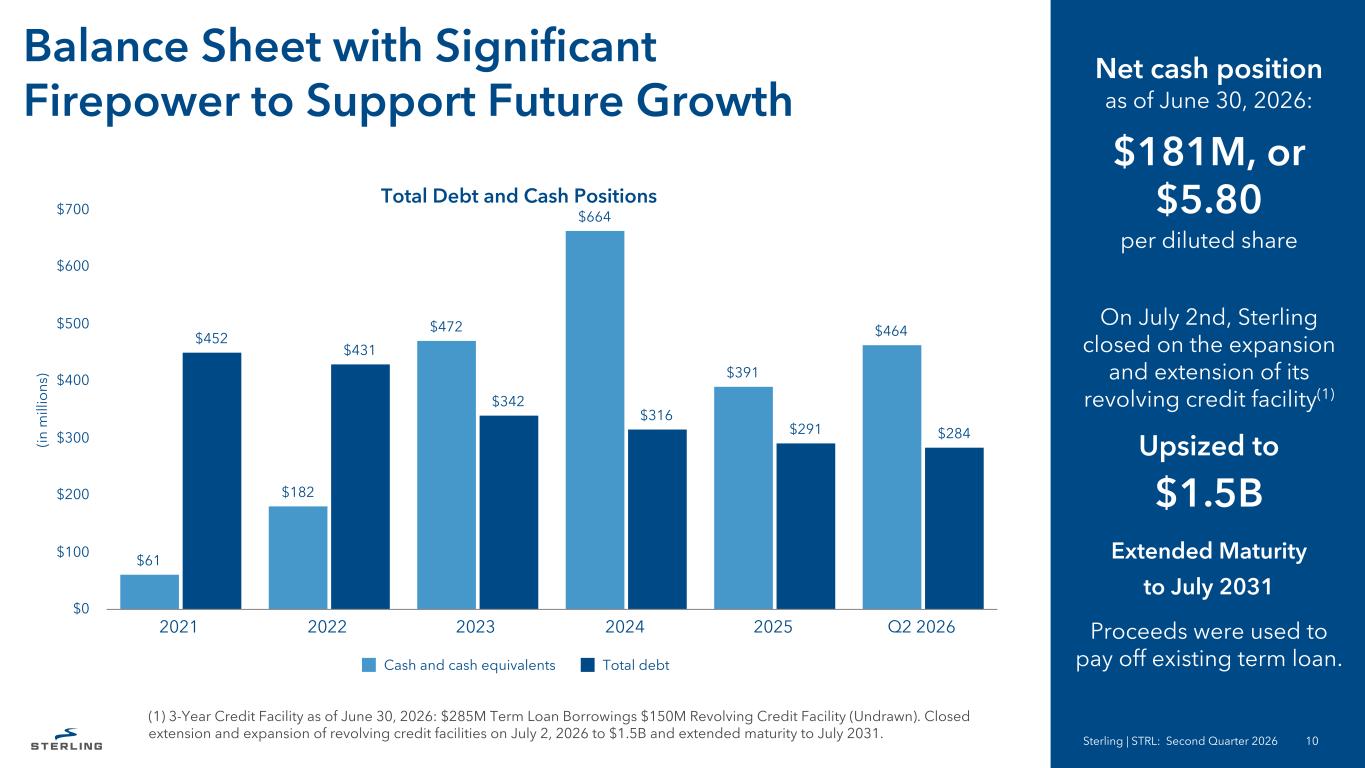
Sterling | STRL: Second Quarter 2026 10 (1) 3-Year Credit Facility as of June 30, 2026: $285M Term Loan Borrowings $150M Revolving Credit Facility (Undrawn). Closed extension and expansion of revolving credit facilities on July 2, 2026 to $1.5B and extended maturity to July 2031. (in m ill io ns ) $61 $182 $472 $664 $391 $464$452 $431 $342 $316 $291 $284 Cash and cash equivalents Total debt 2021 2022 2023 2024 2025 Q2 2026 $0 $100 $200 $300 $400 $500 $600 $700 Total Debt and Cash Positions Balance Sheet with Significant Firepower to Support Future Growth Net cash position as of June 30, 2026: $181M, or $5.80 per diluted share On July 2nd, Sterling closed on the expansion and extension of its revolving credit facility(1) Upsized to $1.5B Extended Maturity to July 2031 Proceeds were used to pay off existing term loan.
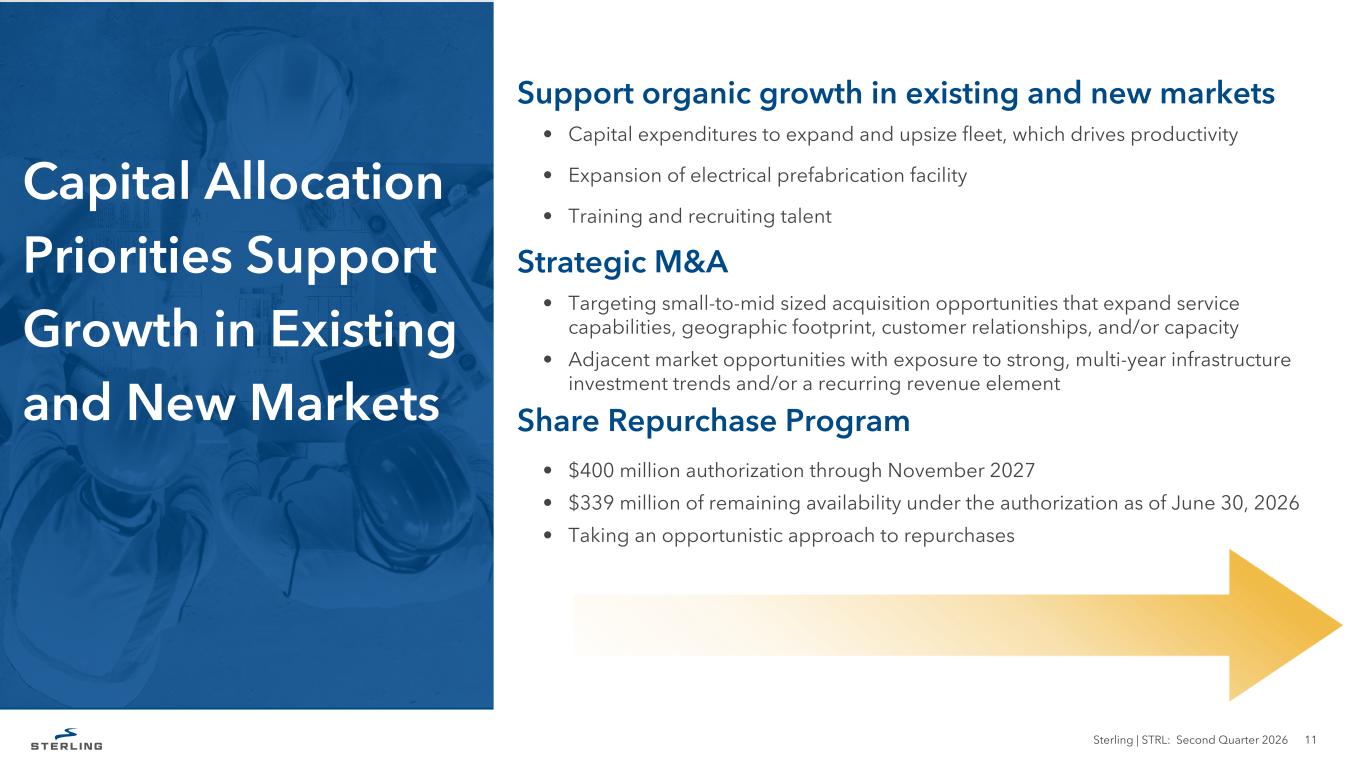
Capital Allocation Priorities Support Growth in Existing and New Markets Sterling | STRL: Second Quarter 2026 11 Support organic growth in existing and new markets • Capital expenditures to expand and upsize fleet, which drives productivity • Expansion of electrical prefabrication facility • Training and recruiting talent Strategic M&A • Targeting small-to-mid sized acquisition opportunities that expand service capabilities, geographic footprint, customer relationships, and/or capacity • Adjacent market opportunities with exposure to strong, multi-year infrastructure investment trends and/or a recurring revenue element Share Repurchase Program • $400 million authorization through November 2027 • $339 million of remaining availability under the authorization as of June 30, 2026 • Taking an opportunistic approach to repurchases
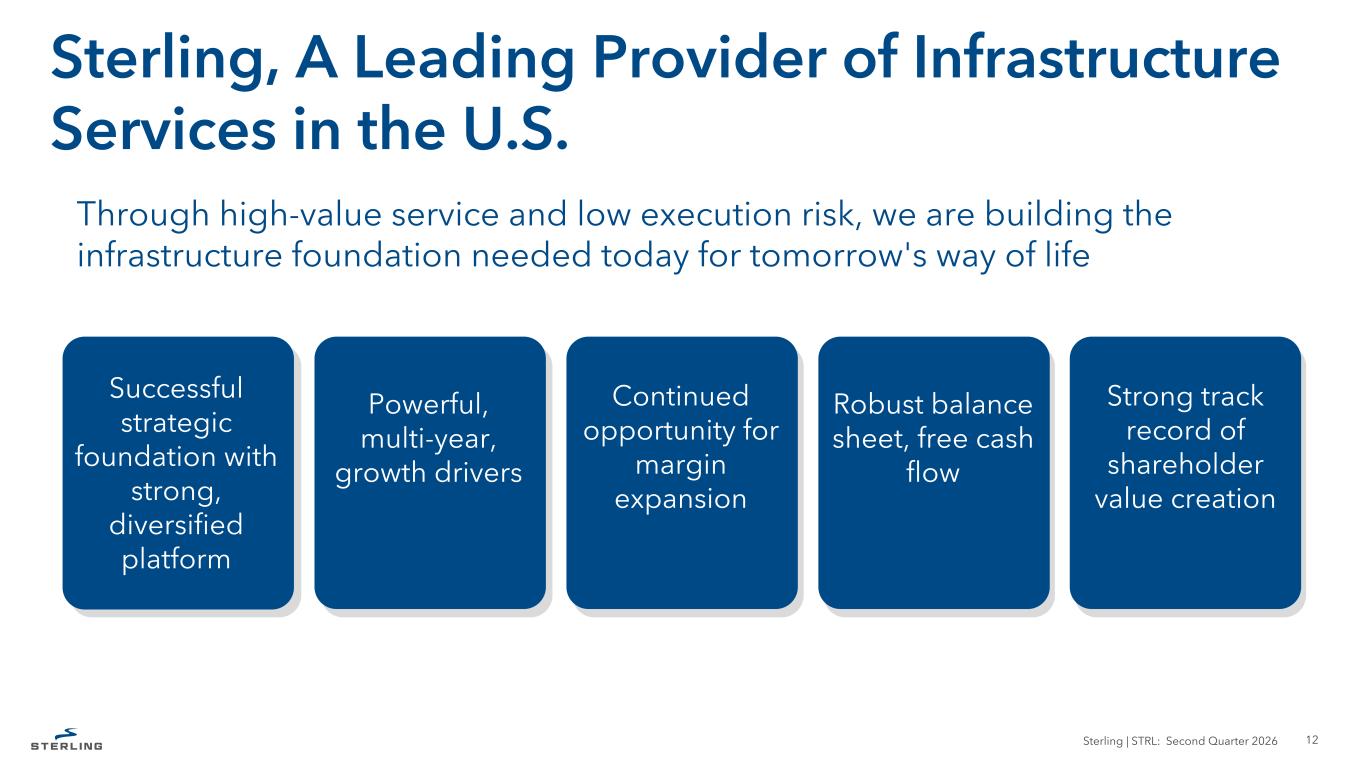
12 Sterling, A Leading Provider of Infrastructure Services in the U.S. Sterling | STRL: Second Quarter 2026 Successful strategic foundation with strong, diversified platform Powerful, multi-year, growth drivers Continued opportunity for margin expansion Robust balance sheet, free cash flow Strong track record of shareholder value creation Through high-value service and low execution risk, we are building the infrastructure foundation needed today for tomorrow's way of life

We build and service the infrastructure that enables our economy to run, our people to move, and our country to grow. Sterling | STRL: Second Quarter 2026 13 Contact Us Sterling Infrastructure, Inc. Noelle Dilts, VP IR and Corporate Strategy Tel: (281) 214-0795 noelle.dilts@strlco.com
Appendix Sterling | STRL: Second Quarter 2026 14
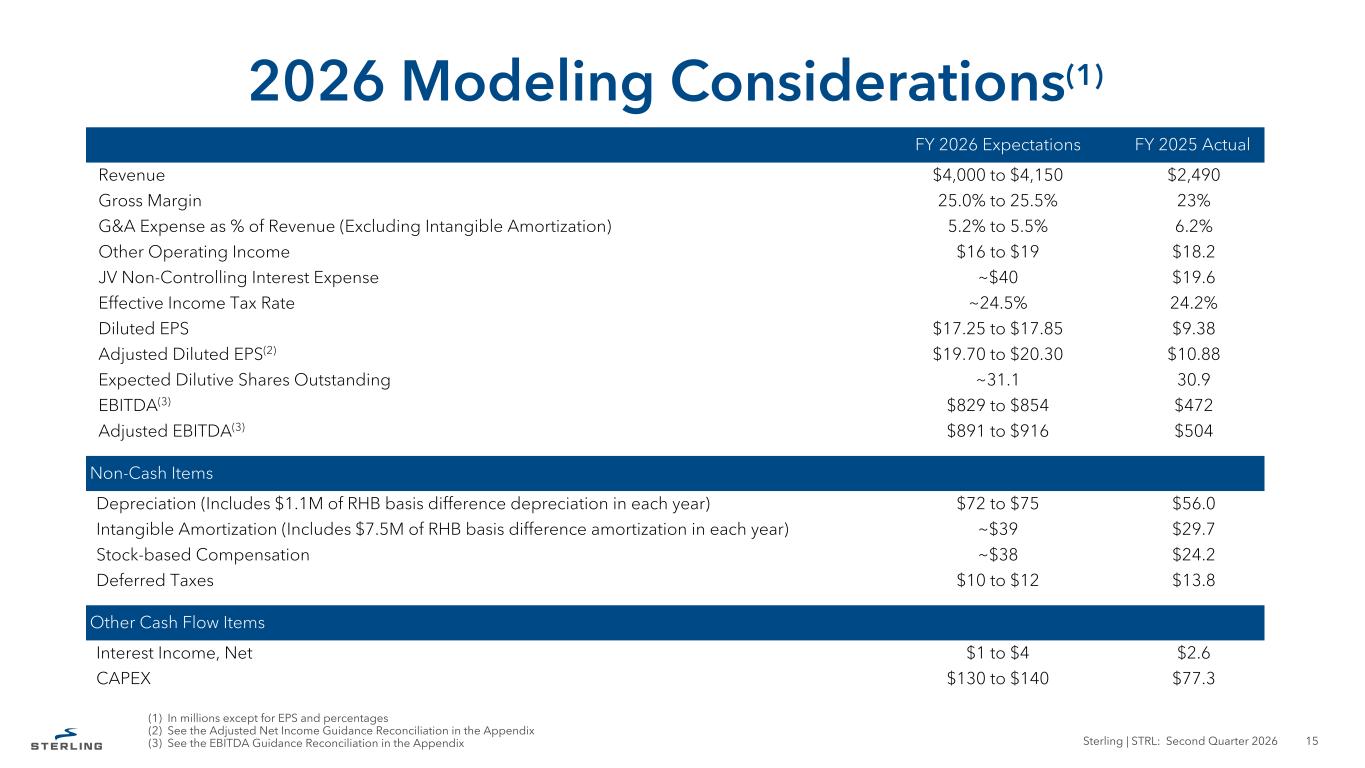
2026 Modeling Considerations(1) Sterling | STRL: Second Quarter 2026 15 (1) In millions except for EPS and percentages (2) See the Adjusted Net Income Guidance Reconciliation in the Appendix (3) See the EBITDA Guidance Reconciliation in the Appendix FY 2026 Expectations FY 2025 Actual Revenue $4,000 to $4,150 $2,490 Gross Margin 25.0% to 25.5% 23% G&A Expense as % of Revenue (Excluding Intangible Amortization) 5.2% to 5.5% 6.2% Other Operating Income $16 to $19 $18.2 JV Non-Controlling Interest Expense ~$40 $19.6 Effective Income Tax Rate ~24.5% 24.2% Diluted EPS $17.25 to $17.85 $9.38 Adjusted Diluted EPS(2) $19.70 to $20.30 $10.88 Expected Dilutive Shares Outstanding ~31.1 30.9 EBITDA(3) $829 to $854 $472 Adjusted EBITDA(3) $891 to $916 $504 Non-Cash Items Depreciation (Includes $1.1M of RHB basis difference depreciation in each year) $72 to $75 $56.0 Intangible Amortization (Includes $7.5M of RHB basis difference amortization in each year) ~$39 $29.7 Stock-based Compensation ~$38 $24.2 Deferred Taxes $10 to $12 $13.8 Other Cash Flow Items Interest Income, Net $1 to $4 $2.6 CAPEX $130 to $140 $77.3
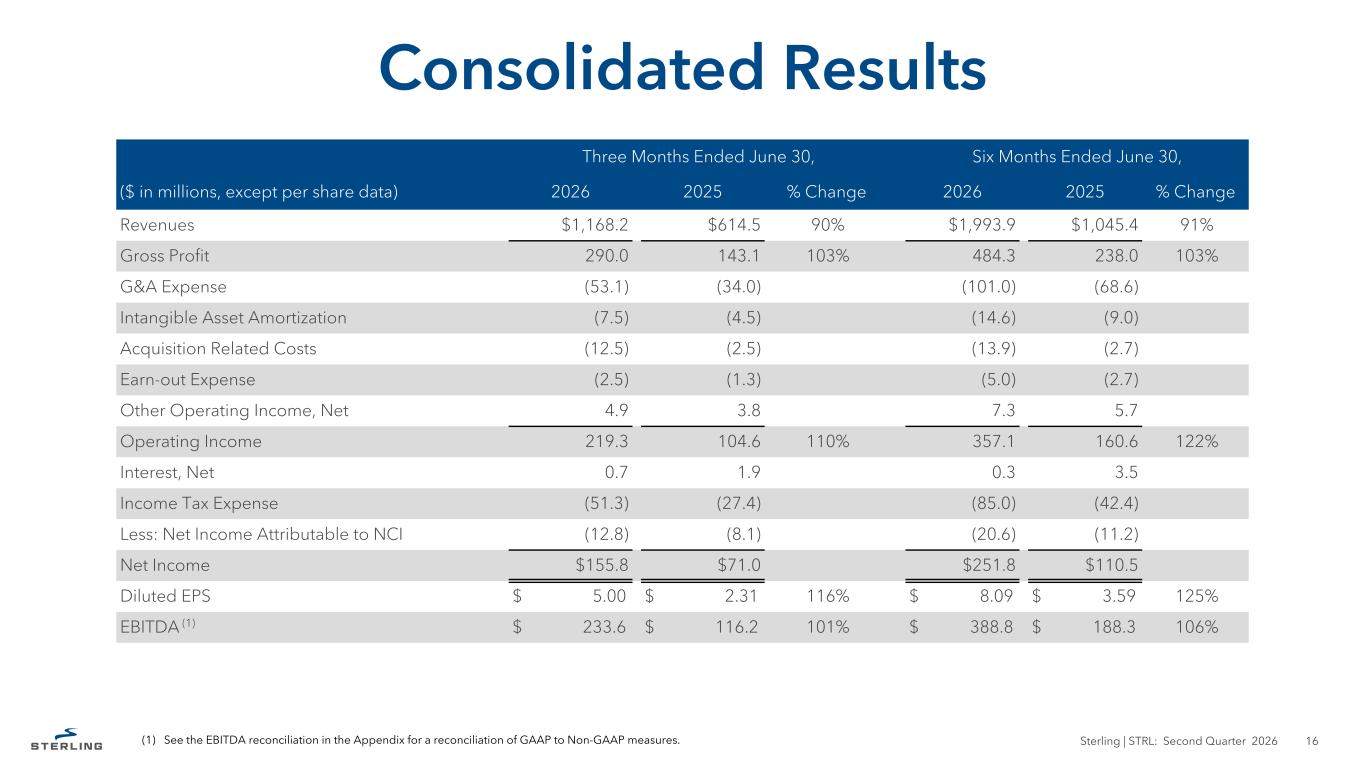
Consolidated Results Three Months Ended June 30, Six Months Ended June 30, ($ in millions, except per share data) 2026 2025 % Change 2026 2025 % Change Revenues $1,168.2 $614.5 90% $1,993.9 $1,045.4 91% Gross Profit 290.0 143.1 103% 484.3 238.0 103% G&A Expense (53.1) (34.0) (101.0) (68.6) Intangible Asset Amortization (7.5) (4.5) (14.6) (9.0) Acquisition Related Costs (12.5) (2.5) (13.9) (2.7) Earn-out Expense (2.5) (1.3) (5.0) (2.7) Other Operating Income, Net 4.9 3.8 7.3 5.7 Operating Income 219.3 104.6 110% 357.1 160.6 122% Interest, Net 0.7 1.9 0.3 3.5 Income Tax Expense (51.3) (27.4) (85.0) (42.4) Less: Net Income Attributable to NCI (12.8) (8.1) (20.6) (11.2) Net Income $155.8 $71.0 $251.8 $110.5 Diluted EPS $ 5.00 $ 2.31 116% $ 8.09 $ 3.59 125% EBITDA (1) $ 233.6 $ 116.2 101% $ 388.8 $ 188.3 106% (1) See the EBITDA reconciliation in the Appendix for a reconciliation of GAAP to Non-GAAP measures. Sterling | STRL: Second Quarter 2026 16
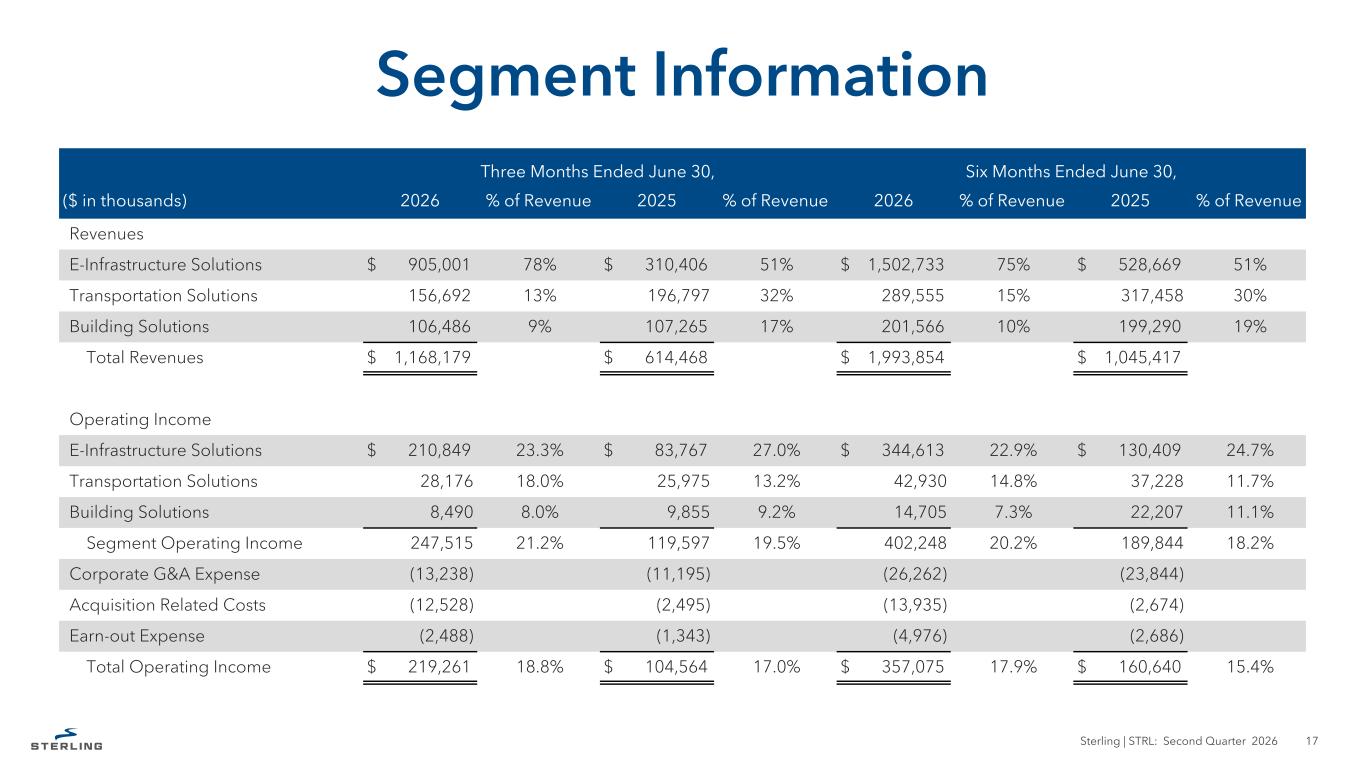
Three Months Ended June 30, Six Months Ended June 30, ($ in thousands) 2026 % of Revenue 2025 % of Revenue 2026 % of Revenue 2025 % of Revenue Revenues E-Infrastructure Solutions $ 905,001 78% $ 310,406 51% $ 1,502,733 75% $ 528,669 51% Transportation Solutions 156,692 13% 196,797 32% 289,555 15% 317,458 30% Building Solutions 106,486 9% 107,265 17% 201,566 10% 199,290 19% Total Revenues $ 1,168,179 $ 614,468 $ 1,993,854 $ 1,045,417 Operating Income E-Infrastructure Solutions $ 210,849 23.3% $ 83,767 27.0% $ 344,613 22.9% $ 130,409 24.7% Transportation Solutions 28,176 18.0% 25,975 13.2% 42,930 14.8% 37,228 11.7% Building Solutions 8,490 8.0% 9,855 9.2% 14,705 7.3% 22,207 11.1% Segment Operating Income 247,515 21.2% 119,597 19.5% 402,248 20.2% 189,844 18.2% Corporate G&A Expense (13,238) (11,195) (26,262) (23,844) Acquisition Related Costs (12,528) (2,495) (13,935) (2,674) Earn-out Expense (2,488) (1,343) (4,976) (2,686) Total Operating Income $ 219,261 18.8% $ 104,564 17.0% $ 357,075 17.9% $ 160,640 15.4% Segment Information Sterling | STRL: Second Quarter 2026 17
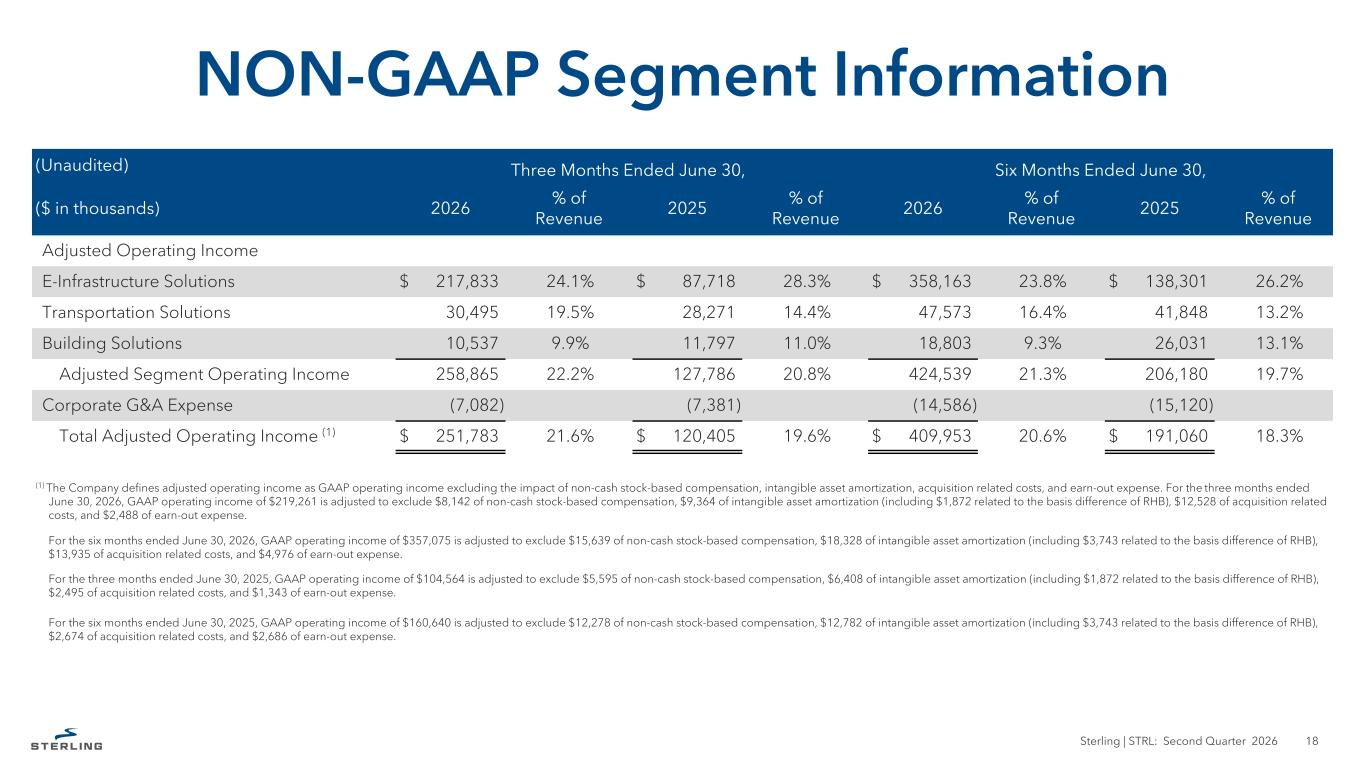
(Unaudited) Three Months Ended June 30, Six Months Ended June 30, ($ in thousands) 2026 % of Revenue 2025 % of Revenue 2026 % of Revenue 2025 % of Revenue Adjusted Operating Income E-Infrastructure Solutions $ 217,833 24.1% $ 87,718 28.3% $ 358,163 23.8% $ 138,301 26.2% Transportation Solutions 30,495 19.5% 28,271 14.4% 47,573 16.4% 41,848 13.2% Building Solutions 10,537 9.9% 11,797 11.0% 18,803 9.3% 26,031 13.1% Adjusted Segment Operating Income 258,865 22.2% 127,786 20.8% 424,539 21.3% 206,180 19.7% Corporate G&A Expense (7,082) (7,381) (14,586) (15,120) Total Adjusted Operating Income (1) $ 251,783 21.6% $ 120,405 19.6% $ 409,953 20.6% $ 191,060 18.3% (1) The Company defines adjusted operating income as GAAP operating income excluding the impact of non-cash stock-based compensation, intangible asset amortization, acquisition related costs, and earn-out expense. For the three months ended June 30, 2026, GAAP operating income of $219,261 is adjusted to exclude $8,142 of non-cash stock-based compensation, $9,364 of intangible asset amortization (including $1,872 related to the basis difference of RHB), $12,528 of acquisition related costs, and $2,488 of earn-out expense. For the six months ended June 30, 2026, GAAP operating income of $357,075 is adjusted to exclude $15,639 of non-cash stock-based compensation, $18,328 of intangible asset amortization (including $3,743 related to the basis difference of RHB), $13,935 of acquisition related costs, and $4,976 of earn-out expense. For the three months ended June 30, 2025, GAAP operating income of $104,564 is adjusted to exclude $5,595 of non-cash stock-based compensation, $6,408 of intangible asset amortization (including $1,872 related to the basis difference of RHB), $2,495 of acquisition related costs, and $1,343 of earn-out expense. For the six months ended June 30, 2025, GAAP operating income of $160,640 is adjusted to exclude $12,278 of non-cash stock-based compensation, $12,782 of intangible asset amortization (including $3,743 related to the basis difference of RHB), $2,674 of acquisition related costs, and $2,686 of earn-out expense. NON-GAAP Segment Information Sterling | STRL: Second Quarter 2026 18
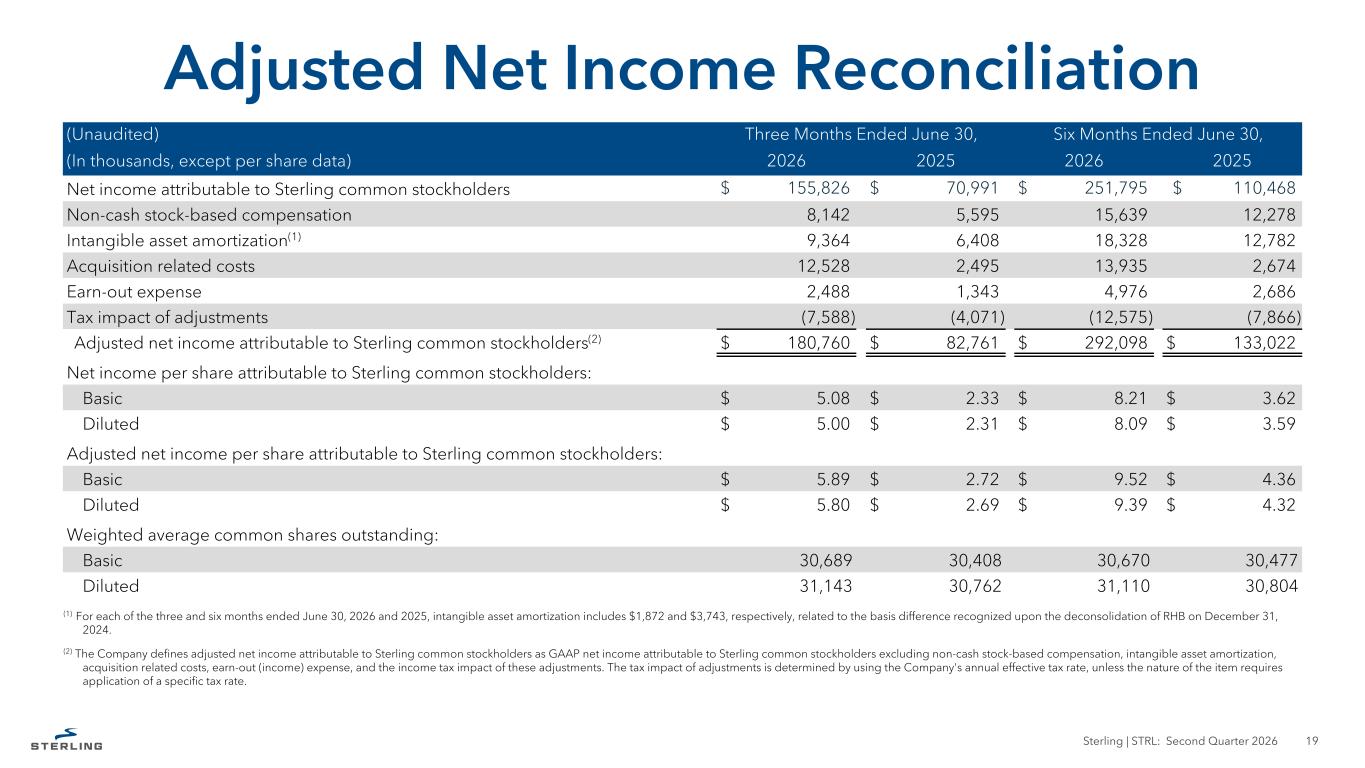
Sterling | STRL: Second Quarter 2026 19 (Unaudited) Three Months Ended June 30, Six Months Ended June 30, (In thousands, except per share data) 2026 2025 2026 2025 Net income attributable to Sterling common stockholders $ 155,826 $ 70,991 $ 251,795 $ 110,468 Non-cash stock-based compensation 8,142 5,595 15,639 12,278 Intangible asset amortization(1) 9,364 6,408 18,328 12,782 Acquisition related costs 12,528 2,495 13,935 2,674 Earn-out expense 2,488 1,343 4,976 2,686 Tax impact of adjustments (7,588) (4,071) (12,575) (7,866) Adjusted net income attributable to Sterling common stockholders(2) $ 180,760 $ 82,761 $ 292,098 $ 133,022 Net income per share attributable to Sterling common stockholders: Basic $ 5.08 $ 2.33 $ 8.21 $ 3.62 Diluted $ 5.00 $ 2.31 $ 8.09 $ 3.59 Adjusted net income per share attributable to Sterling common stockholders: Basic $ 5.89 $ 2.72 $ 9.52 $ 4.36 Diluted $ 5.80 $ 2.69 $ 9.39 $ 4.32 Weighted average common shares outstanding: Basic 30,689 30,408 30,670 30,477 Diluted 31,143 30,762 31,110 30,804 (1) For each of the three and six months ended June 30, 2026 and 2025, intangible asset amortization includes $1,872 and $3,743, respectively, related to the basis difference recognized upon the deconsolidation of RHB on December 31, 2024. (2) The Company defines adjusted net income attributable to Sterling common stockholders as GAAP net income attributable to Sterling common stockholders excluding non-cash stock-based compensation, intangible asset amortization, acquisition related costs, earn-out (income) expense, and the income tax impact of these adjustments. The tax impact of adjustments is determined by using the Company's annual effective tax rate, unless the nature of the item requires application of a specific tax rate. Adjusted Net Income Reconciliation
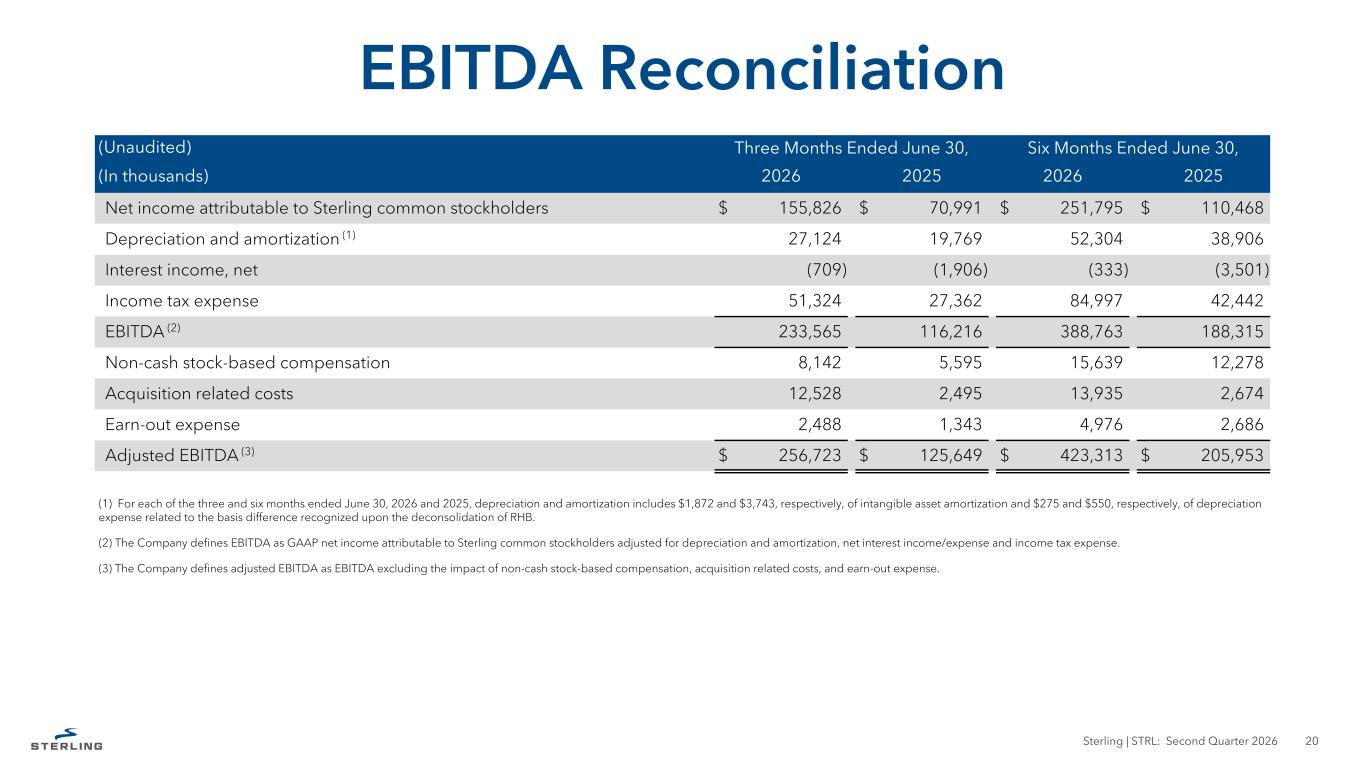
Sterling | STRL: Second Quarter 2026 20 (Unaudited) Three Months Ended June 30, Six Months Ended June 30, (In thousands) 2026 2025 2026 2025 Net income attributable to Sterling common stockholders $ 155,826 $ 70,991 $ 251,795 $ 110,468 Depreciation and amortization (1) 27,124 19,769 52,304 38,906 Interest income, net (709) (1,906) (333) (3,501) Income tax expense 51,324 27,362 84,997 42,442 EBITDA (2) 233,565 116,216 388,763 188,315 Non-cash stock-based compensation 8,142 5,595 15,639 12,278 Acquisition related costs 12,528 2,495 13,935 2,674 Earn-out expense 2,488 1,343 4,976 2,686 Adjusted EBITDA (3) $ 256,723 $ 125,649 $ 423,313 $ 205,953 (1) For each of the three and six months ended June 30, 2026 and 2025, depreciation and amortization includes $1,872 and $3,743, respectively, of intangible asset amortization and $275 and $550, respectively, of depreciation expense related to the basis difference recognized upon the deconsolidation of RHB. (2) The Company defines EBITDA as GAAP net income attributable to Sterling common stockholders adjusted for depreciation and amortization, net interest income/expense and income tax expense. (3) The Company defines adjusted EBITDA as EBITDA excluding the impact of non-cash stock-based compensation, acquisition related costs, and earn-out expense. EBITDA Reconciliation
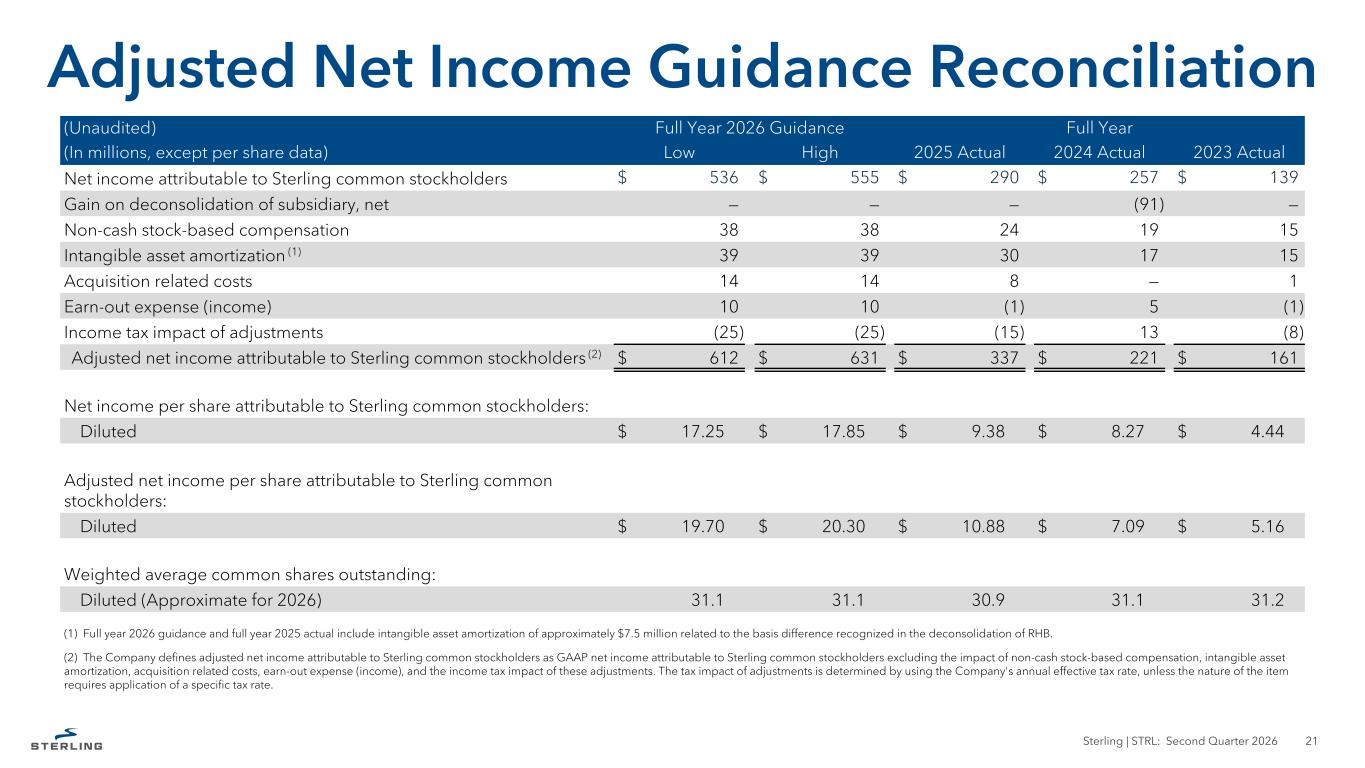
Sterling | STRL: Second Quarter 2026 21 (Unaudited) Full Year 2026 Guidance Full Year (In millions, except per share data) Low High 2025 Actual 2024 Actual 2023 Actual Net income attributable to Sterling common stockholders $ 536 $ 555 $ 290 $ 257 $ 139 Gain on deconsolidation of subsidiary, net — — — (91) — Non-cash stock-based compensation 38 38 24 19 15 Intangible asset amortization (1) 39 39 30 17 15 Acquisition related costs 14 14 8 — 1 Earn-out expense (income) 10 10 (1) 5 (1) Income tax impact of adjustments (25) (25) (15) 13 (8) Adjusted net income attributable to Sterling common stockholders (2) $ 612 $ 631 $ 337 $ 221 $ 161 Net income per share attributable to Sterling common stockholders: Diluted $ 17.25 $ 17.85 $ 9.38 $ 8.27 $ 4.44 Adjusted net income per share attributable to Sterling common stockholders: Diluted $ 19.70 $ 20.30 $ 10.88 $ 7.09 $ 5.16 Weighted average common shares outstanding: Diluted (Approximate for 2026) 31.1 31.1 30.9 31.1 31.2 Adjusted Net Income Guidance Reconciliation (1) Full year 2026 guidance and full year 2025 actual include intangible asset amortization of approximately $7.5 million related to the basis difference recognized in the deconsolidation of RHB. (2) The Company defines adjusted net income attributable to Sterling common stockholders as GAAP net income attributable to Sterling common stockholders excluding the impact of non-cash stock-based compensation, intangible asset amortization, acquisition related costs, earn-out expense (income), and the income tax impact of these adjustments. The tax impact of adjustments is determined by using the Company's annual effective tax rate, unless the nature of the item requires application of a specific tax rate.
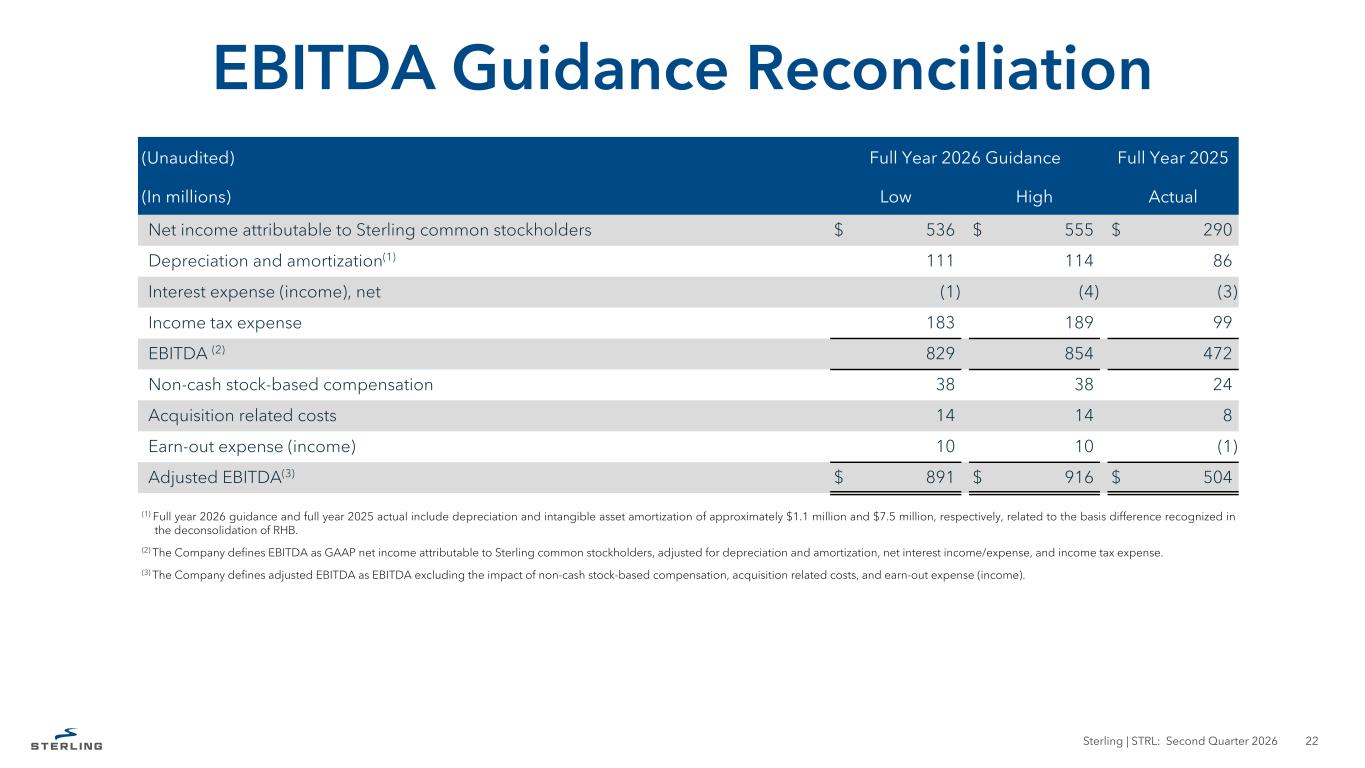
Sterling | STRL: Second Quarter 2026 22 (Unaudited) Full Year 2026 Guidance Full Year 2025 (In millions) Low High Actual Net income attributable to Sterling common stockholders $ 536 $ 555 $ 290 Depreciation and amortization(1) 111 114 86 Interest expense (income), net (1) (4) (3) Income tax expense 183 189 99 EBITDA (2) 829 854 472 Non-cash stock-based compensation 38 38 24 Acquisition related costs 14 14 8 Earn-out expense (income) 10 10 (1) Adjusted EBITDA(3) $ 891 $ 916 $ 504 EBITDA Guidance Reconciliation (1) Full year 2026 guidance and full year 2025 actual include depreciation and intangible asset amortization of approximately $1.1 million and $7.5 million, respectively, related to the basis difference recognized in the deconsolidation of RHB. (2) The Company defines EBITDA as GAAP net income attributable to Sterling common stockholders, adjusted for depreciation and amortization, net interest income/expense, and income tax expense. (3) The Company defines adjusted EBITDA as EBITDA excluding the impact of non-cash stock-based compensation, acquisition related costs, and earn-out expense (income).
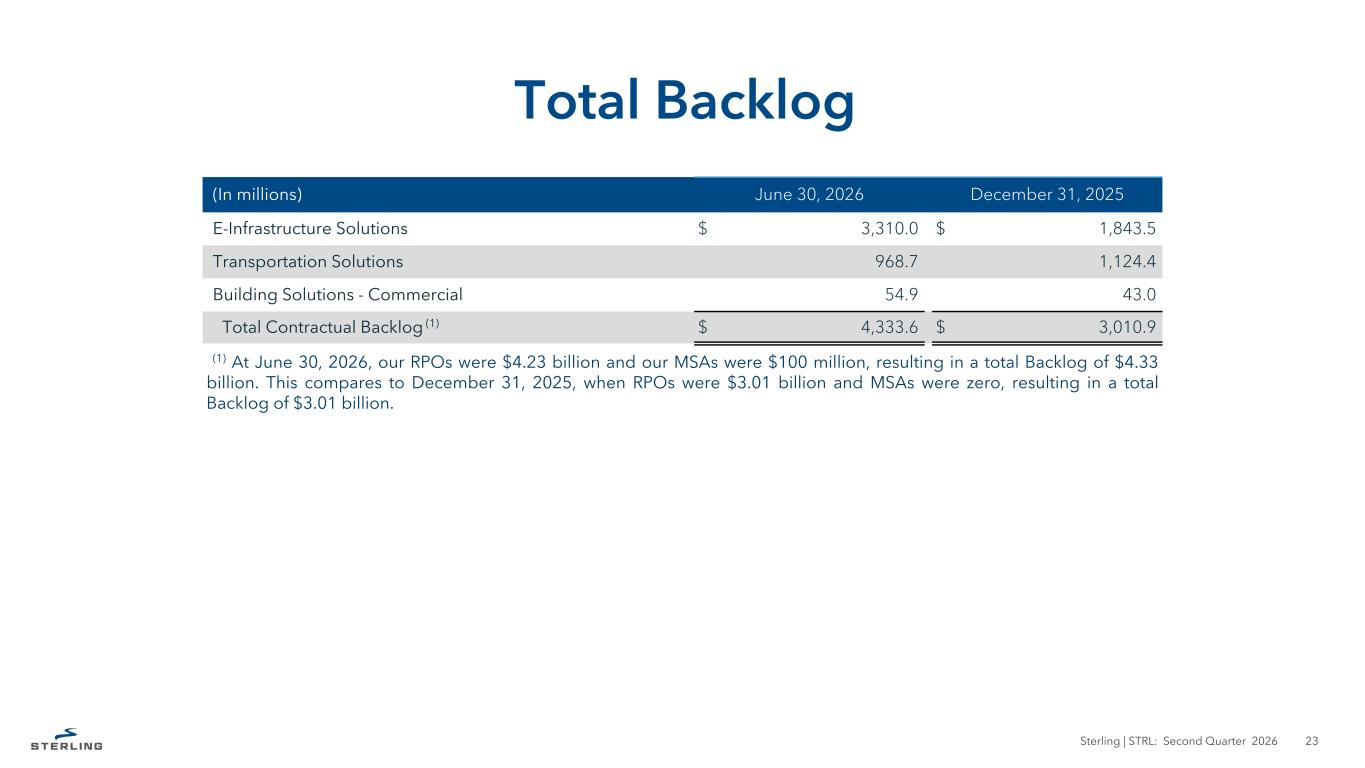
Sterling | STRL: Second Quarter 2026 23 Total Backlog (In millions) June 30, 2026 December 31, 2025 E-Infrastructure Solutions $ 3,310.0 $ 1,843.5 Transportation Solutions 968.7 1,124.4 Building Solutions - Commercial 54.9 43.0 Total Contractual Backlog (1) $ 4,333.6 $ 3,010.9 (1) At June 30, 2026, our RPOs were $4.23 billion and our MSAs were $100 million, resulting in a total Backlog of $4.33 billion. This compares to December 31, 2025, when RPOs were $3.01 billion and MSAs were zero, resulting in a total Backlog of $3.01 billion.

We build and service the infrastructure that enables our economy to run, our people to move, and our country to grow. THANK YOU