Exhibit 99.1
MANAGEMENT’S DISCUSSION AND ANALYSIS OF FINANCIAL CONDITION AND RESULTS OF OPERATIONS
The following discussion and analysis should be read in conjunction with our unaudited interim condensed consolidated financial statements, the notes to those financial statements and other financial data that appear elsewhere in this report. This discussion should also be read together with our audited consolidated financial statements and the notes thereto, and the other information contained in our annual report on Form 20-F for the fiscal year ended October 31, 2025 filed with the Securities and Exchange Commission on March 2, 2026. In addition to historical information, the following discussion contains forward-looking statements based on current expectations that involve risks and uncertainties. Actual results and the timing of certain events may differ significantly from those projected in such forward-looking statements due to a number of factors. Our unaudited interim condensed consolidated financial statements are prepared in conformity with U.S. GAAP.
Overview
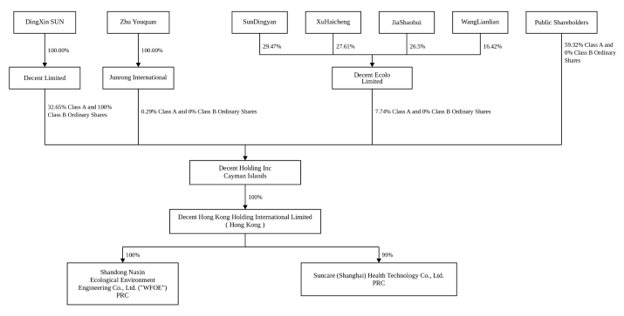
Decent Holding Inc. is a holding company that was incorporated under the laws of the Cayman Islands, and our Class A ordinary shares are listed on the Nasdaq Capital Market under the symbol “DXST”. As a holding company with no material operations of its own, we conduct our operations in China through our PRC operating subsidiaries, Shandong Dingxin Ecology Environmental Co., Ltd. (“Shandong Dingxin”), which we hold through Decent Hong Kong Holding International Limited, our wholly-owned Hong Kong subsidiary (“Decent HK”), and Shandong Naxin Ecological Environment Engineering Co., Limited, our wholly foreign-owned enterprise in the PRC, and Suncare (Shanghai) Health Technology Co., Ltd. (“Suncare”), which was incorporated on December 24, 2025 and in which we hold a 99% equity interest through our subsidiary, Decent HK. We refer to Shandong Dingxin and Suncare collectively as our Operating Subsidiaries in China.
We strive to be a pioneer in the field of water pollution treatment and resource reutilization treatment in China. We specialize in the provision of wastewater treatment, ecological river restoration and river ecosystem management through water quality enhancement, as well as microbial products that are primarily used for water quality enhancement and pollutant removal, through our Operating Subsidiary, Shandong Dingxin Ecology Environmental Co., Ltd. In addition, through Suncare, we operate a community-based senior health and elderly care platform serving China’s aging population, which was launched in March 2026. The platform operates through a network of community service locations, each of which typically serves surrounding residential communities of approximately 30,000 to 100,000 people, and offers preventive health consultations, lifestyle management services and aging support, together with related training services and product sales, on a membership basis under an online-to-offline model. This business generated revenue of $3,502,890, or 18.85% of our total revenue, for the six months ended April 30, 2026.
Our main services and products include (1) wastewater treatment, (2) river water quality management, (3) microbial products for water quality enhancement and pollutant removal, (4) senior health and elderly care services, including related training services, and (5) other services and products.
We have invested heavily on research and development to sharpen our innovation edge. So far, we have established cooperation relationships for scientific research and development with well-known academic institutions in China, such as Yantai University with whom we had entered into a research cooperation agreement. We have an in-house research and development team with members possessing technical expertise in engineering and chemistry as well as a sharp business sense that we believe can accurately capture and meet our customers’ needs.
We have received a number of industry awards and certifications recognizing our success and achievements, including the “Yantai City Industrial Design Center” awarded by the Yantai Municipal Bureau of Industry and Information Technology in 2022, the “Yantai New Special Expertise Enterprise” awarded by the Yantai Municipal Bureau of Industry and Information Technology in 2022, the “High-Tech Enterprise” awarded by the Shandong Provincial Department of Science and Technology, Shandong Provincial Department of Finance, and Shandong Provincial Taxation Bureau of the State Administration of Taxation in 2022, the “Shandong Province ‘One Enterprise, One Technology’ Innovative Enterprises” awarded by the Shandong Provincial Bureau of Small and Medium Enterprises in 2015.
Recent Developments
Reverse Share Split.
On March 16, 2026, we effected a share consolidation of our Class A ordinary shares and Class B ordinary shares at a ratio of one-for-twenty-five. All share and per share amounts presented in this report and in our unaudited interim condensed consolidated financial statements have been retroactively restated to give effect to the share consolidation.
Launch and Expansion of Our Senior Health and Elderly Care Platform.
In March 2026, Suncare launched its digital senior health and elderly care platform. On March 10, 2026, Suncare entered into a strategic cooperation agreement with a regional senior care operator in China, which is expected to extend the platform to approximately 70 community service locations across several provinces in eastern and northern China. On June 9, 2026, we entered into a partnership with Taihao Robotics to establish a robotics training network in China. As of June 30, 2026, the platform had approximately 150,000 paid members across approximately 480 community service locations, and we are targeting approximately 1,000 community service locations by the end of 2026.
Financing Activities.
In November 2025, we completed a registered offering of our Class A ordinary shares and accompanying warrants. Net cash provided by financing activities was $7,037,437 for the six months ended April 30, 2026. On April 24, 2026, we filed a registration statement on Form F-3, which was declared effective on May 8, 2026.
Extraordinary General Meeting.
On July 14, 2026, our shareholders approved an increase in our authorized share capital from US$50,000, divided into 19,800,000 Class A ordinary shares and 200,000 Class B ordinary shares, to US$2,500,000, divided into 900,000,000 Class A ordinary shares and 100,000,000 Class B ordinary shares; authority for our board of directors to effect one or more share consolidations of our issued and unissued Class A ordinary shares and Class B ordinary shares at a ratio of not less than one-for-ten and not more than one-for-250 within one year of the meeting; and related amendments to our memorandum and articles of association.
Corporate Structure
2
Comparison of Results of Operations For the Six Months Ended April 30, 2026 and 2025
The following table sets forth key components of our results of operations during the six months ended April 30, 2026 and 2025, both in U.S. dollars and as a percentage of our revenue.
| For the Six Months Ended April 30, | ||||||||||||||||
| 2026 | 2025 | |||||||||||||||
| Amount | % of revenue | Amount | % of revenue | |||||||||||||
| Revenue | ||||||||||||||||
| Wastewater treatment revenue | $ | 9,186,083 | 49.43 | $ | 493,123 | 8.97 | ||||||||||
| River water quality management revenue | 4,297,181 | 23.12 | 4,728,449 | 85.99 | ||||||||||||
| Product sales revenue | 1,344,830 | 7.24 | 277,081 | 5.04 | ||||||||||||
| Training Services | 3,502,890 | 18.85 | — | — | ||||||||||||
| Others | 254,541 | 1.36 | — | — | ||||||||||||
| Total revenue | 18,585,525 | 100.00 | 5,498,653 | 100.00 | ||||||||||||
| Cost of revenue | ||||||||||||||||
| Wastewater treatment revenue | (7,220,924 | ) | (38.85 | ) | (401,310 | ) | (7.30 | ) | ||||||||
| River water quality management revenue | (3,288,424 | ) | (17.69 | ) | (3,424,737 | ) | (62.28 | ) | ||||||||
| Product sales revenue | (1,004,579 | ) | (5.41 | ) | (161,511 | ) | (2.94 | ) | ||||||||
| Training Services | (872,309 | ) | (4.69 | ) | — | — | ||||||||||
| Total cost of revenue | (12,386,236 | ) | (66.64 | ) | (3,987,558 | ) | (72.52 | ) | ||||||||
| Gross profit | 6,199,289 | 33.36 | 1,511,095 | 27.48 | ||||||||||||
| Selling expenses | (3,076,861 | ) | (16.56 | ) | (223,821 | ) | (4.07 | ) | ||||||||
| General and administrative expenses | (3,809,799 | ) | (20.50 | ) | (1,740,278 | ) | (31.65 | ) | ||||||||
| Research and development expenses | (188,381 | ) | (1.01 | ) | (12,784 | ) | (0.23 | ) | ||||||||
| Net loss from operations | (875,752 | ) | (4.71 | ) | (465,788 | ) | (8.47 | ) | ||||||||
| Total other income, net | 7,622 | 0.04 | 16,375 | 0.30 | ||||||||||||
| Net loss before income taxes | (868,130 | ) | (4.67 | ) | (449,413 | ) | (8.17 | ) | ||||||||
| Income tax expenses | (205,963 | ) | (1.11 | ) | (29,752 | ) | (0.54 | ) | ||||||||
| Net loss | $ | (1,074,093 | ) | (5.78 | ) | $ | (479,165 | ) | (8.71 | ) | ||||||
The following table lists the calculation methods of gross profit and gross profit margin of each type of revenue:
| For the six months ended April 30, | Changes | |||||||||||||||
| 2026 | 2025 | Amount | % | |||||||||||||
| Wastewater treatment revenue | ||||||||||||||||
| Revenue | $ | 9,186,084 | $ | 493,123 | $ | 8,692,961 | 1762.84 | % | ||||||||
| Cost of revenue | 7,220,924 | 401,310 | 6,819,614 | 1699.34 | % | |||||||||||
| Gross profit | $ | 1,965,160 | $ | 91,813 | $ | 1,873,347 | 2040.39 | % | ||||||||
| Gross profit margin | 21.39 | % | 18.62 | % | 2.77 | % | 14.88 | % | ||||||||
| River water quality management revenue | ||||||||||||||||
| Revenue | $ | 4,297,180 | $ | 4,728,449 | $ | (431,269 | ) | (9.12 | )% | |||||||
| Cost of revenue | 3,288,423 | 3,424,737 | (136,314 | ) | (3.98 | )% | ||||||||||
| Gross profit | $ | 1,008,757 | $ | 1,303,712 | $ | (294,955 | ) | (22.62 | )% | |||||||
| Gross profit margin | 23.47 | % | 27.57 | % | (4.10 | )% | (14.87 | )% | ||||||||
| Product sales revenue | ||||||||||||||||
| Revenue | $ | 1,344,830 | $ | 277,081 | $ | 1,067,749 | 385.36 | % | ||||||||
| Cost of revenue | 1,004,580 | 161,511 | 843,069 | 521.99 | % | |||||||||||
| Gross profit | $ | 340,250 | $ | 115,570 | $ | 224,680 | 194.41 | % | ||||||||
| Gross profit margin | 25.30 | % | 41.71 | % | (16.41 | )% | (39.34 | )% | ||||||||
| Training revenue | ||||||||||||||||
| Revenue | $ | 3,502,890 | $ | — | $ | 3,502,890 | 100.00 | % | ||||||||
| Cost of revenue | 872,309 | — | 872,309 | 100.00 | % | |||||||||||
| Gross profit | $ | 2,630,581 | $ | — | $ | 2,630,581 | 100.00 | % | ||||||||
| Gross profit margin | 75.10 | % | — | % | 75.10 | % | 100.00 | % | ||||||||
| Other revenue | ||||||||||||||||
| Revenue | $ | 254,541 | $ | — | $ | 254,541 | 100.00 | % | ||||||||
| Cost of revenue | — | — | — | — | % | |||||||||||
| Gross profit | $ | 254,541 | $ | — | $ | 254,541 | 100.00 | % | ||||||||
| Gross profit margin | 100.00 | % | — | % | 100.00 | % | 100.00 | % | ||||||||
| Total | ||||||||||||||||
| Revenue | $ | 18,585,525 | $ | 5,498,653 | $ | 13,086,872 | 238.00 | % | ||||||||
| Cost of revenue | 12,386,236 | 3,987,558 | 8,398,678 | 210.62 | % | |||||||||||
| Gross profit | $ | 6,199,289 | $ | 1,511,095 | $ | 4,688,194 | 310.25 | % | ||||||||
| Gross profit margin | 33.36 | % | 27.48 | % | 5.88 | % | 21.40 | % | ||||||||
3
Revenue
Our revenue primarily comes from wastewater treatment projects, river water quality management services, product sales, training and others. Total revenue increased by 238.00% or $13,086,872 to $18,585,525 for the six months ended April 30, 2026 compared with total revenue of $5,498,653 for the six months ended April 30, 2025. Our total revenue for the six months ended April 30, 2026 exceeded our total revenue of $12,949,345 for the entire fiscal year ended October 31, 2025. Revenue growth was primarily attributable to the expansion of existing business lines and the incremental contribution from the newly launched digital health and wellness segment, which mainly includes training services and product sales.
Revenue from Wastewater Treatment Service
For the six months ended April 30, 2026, the revenue from wastewater treatment service increased significantly to $9,186,084, from $493,123 for the six months ended April 30, 2025, with a growth of 1,762.84%. The cost of revenue for wastewater treatment was $7,220,924 for the six months ended April 30, 2026, as compared to $401,310 for the six months ended April 30, 2025, with a growth of 1,699.34%. This substantial growth is reflective of successful bids and project completions in this stream. Consequently, the gross profit margin was 21.39% and 18.62% for the six months ended April 30, 2026 and 2025, respectively.
Revenue from River Water Quality Management
For the six months ended April 30, 2026, the revenue from river water quality management witnessed a minor decrease of $431,269, or 9.12%, as compared to $4,728,449 for the six months ended April 30, 2025. Hence, the costs associated had also decreased, leading to a gross profit margin of 23.47% and 27.57% for the six months ended April 30, 2026 and 2025, respectively.
Revenue from Product Sales
For the six months ended April 30, 2026, the revenue from product sales increased by 385.36% to $1,067,749 compared to $277,081 for the six months ended April 30, 2025. The Company's main product is microbial inoculum, with customers primarily being local enterprises. In response to intensifying market competition and to enhance attractiveness to target customers, the Company implemented a strategic price reduction on its microbial inoculum products during the period, which significantly improved the products' cost-effectiveness in the market. This strategy effectively drove a substantial increase in sales revenue; however, the price reduction consequently exerted pressure on product gross margin, resulting in a contraction of profit margins. Additionally, the newly added digital health business line also contributed a portion of product sales revenue during the period. The cost of revenue for product sales saw an increase of 521.99% to $1,004,580 for the six months ended April 30, 2026 from $161,511 for the six months ended April 30, 2025. Consequently, the gross profit as a percentage of revenue was 25.30% and 41.71% for the six months ended April 30, 2026 and 2025, respectively.
Revenue from Training
During the period, the Company strategically expanded into the digital health business segment, with training services emerging as a key new component. This segment contributed revenue of $3,502,890, incurred cost of revenue of $872,309, and delivered gross profit of $2,630,581, achieving a gross margin of 75.1%. With its high-margin profile, this new business line contributed meaningfully to the overall revenue growth and gross margin improvement during the period.
Overall, despite varied performance across different segments, it showed a continuously upward trend in revenue for the six months ended April 30, 2026 compared with the same period in 2025. The total gross profit margin raised from 27.48% for the six months ended April 30, 2025 to 33.36% for the six months ended April 30, 2026.
Cost of revenue
Our cost of revenue was $12,386,236 and $3,987,558 for the six months ended April 30, 2026 and 2025, respectively. The increase in cost of revenues is a direct result of our increase of revenues.
Gross profit and gross margin
Our gross profit was $6,199,289 for the six months ended April 30, 2026, compared with a gross profit of $1,511,095 for the six months ended April 30, 2025. Gross profit as a percentage of revenue (gross margin) was 33.36% for the six months ended April 30, 2026, compared to a gross profit of 27.48% for the six months ended April 30, 2025. The increase in gross profit and gross profit margin was primarily attributable to the improvement in revenue mix. On one hand, the wastewater treatment service segment accounted for a larger share of total revenue during the period; while this segment carries a moderate gross margin, its expanding scale drove down unit costs through economies of scale, thereby enhancing its marginal profit contribution. On the other hand, the Company's newly launched digital health business line contributed relatively high gross profit, further lifting the overall profitability.
Operating Expenses
Total operating expenses increased by $5,098,158 or 257.89% to $7,075,041 for the six months ended April 30, 2026 from $1,976,883 for the six months ended April 30, 2025.
Our selling expense increased $2,853,040 for the six months ended April 30, 2026 as compared to the six months ended April 30, 2025, mainly due to the increase in marketing fees for the Company's newly launched digital health business line.
The increase in general and administrative expenses of approximately $2,069,521 was mainly attributable to 1) an increase in consultant and service fees of approximately $1.14 million; 2) an increase in salary and welfare of approximately $0.84 million, due to the implemented internal personnel adjustments; 3) an increase in rental of approximately $0.06 million.
Our research and development expenses increased by $175,597 for the six months ended April 30, 2026, as compared to the same period last year, mainly due to the engagement of external research institutions to assist with our research and development initiatives.
4
Income tax expenses
Our income tax expenses were $205,963 for the six months ended April 30, 2026, compared to an income tax expenses for the six months ended April 30, 2025, which was $29,752.
Net loss
As a result of the cumulative effect of the factors described above, our net loss for the six months ended April 30, 2026 and 2025 were $1,074,093 and $479,165, respectively.
Liquidity and Capital Resources
The following table sets forth a summary of our cash flows for the periods indicated:
| For six months ended April 30, | ||||||||
| 2026 | 2025 | |||||||
| Net cash used in operating activities | $ | (5,730,198 | ) | $ | (1,559,979 | ) | ||
| Net cash used in investing activities | (259,445 | ) | (1,945,771 | ) | ||||
| Net cash provided by (used in) financing activities | 7,037,437 | 3,971,014 | ||||||
| Net change in cash | 1,047,794 | 465,264 | ||||||
| Effect of exchange rate changes on cash | 32,707 | (33,880 | ) | |||||
| Cash at the beginning of period | 572,807 | 407,031 | ||||||
| Cash at the end of period | $ | 1,653,308 | $ | 838,415 | ||||
As of April 30, 2026, we had cash of $1,653,308, consisted of $1,506,822 denominated in USD and $146,486 denominated in RMB. As of October 31, 2025, the cash consisted of $79,440 denominated in USD and $493,367 denominated in RMB.
Operating Activities
Our net cash used in operating activities was $5,730,198 for the six months ended April 30, 2026, as compared to net cash used in operating activities of $1,559,979 for the six months ended April 30, 2025.
Our net cash used in operating activities for the six months ended April 30, 2026 reflects (i) our net loss of $1,074,093, adjustments to reconcile net loss to net cash used in operating activities of $896,505, (ii) an increase in accounts receivable of $8,999,285, (iii) an increase in contract assets of $4,119,007, partially offset by (iv) an increase in accounts payable of $4,173,124, (v) an increase in other payables of $1,986,935, and (vi) an increase in contract liabilities of $1,233,224.
Our net cash used in operating activities for the six months ended April 30, 2025 reflects (i) our net loss of $479,165, adjustments to reconcile net loss to net cash used in operating activities of $720,349, (ii) an increase in accounts receivables of $651,784 due to the increase of revenue, (iii) a decrease in accounts payables of $703,567, partially offset by (iv) an increase in other payables of $632,182.
Investing Activities
Net cash used in investing activities was $259,445 for the six months ended April 30, 2026, as compared to net cash used in investing activities of $1,945,771 for the six months ended April 30, 2025.
The net cash used in investing activities for the six months ended April 30, 2026 was mainly attributable to (i) purchase of property and equipment of $16,445, (ii) loan made to third parties of $243,000.
The net cash used in investing activities for the six months ended April 30, 2025 was mainly attributable to (i) purchase of property and equipment of $585, (ii) loan made to third parties of $1,984,087, and (iii) repayment from related parties of $38,901.
5
Financing Activities
Our net cash provided by financing activities was $7,037,437 for the six months ended April 30, 2026, as compared to the net cash provided by financing activities of $3,971,014 for the six months ended April 30, 2025. The net cash provided by financing activities for the six months ended April 30, 2026 was mainly due to net proceed from offering of $7,037,437. The net cash provided by financing activities for the six months ended April 30, 2025 was mainly due to net proceed from offering of $3,035,285, partially offset by principal payment for obligation under finance leases of $11,695.
Contractual Obligation
The following table summarizes our contractual obligations, which are comprised entirely of operating lease obligations, as of April 30, 2026, and the effect these obligations are expected to have on our liquidity and cash flows in future periods.
| Payments due by period | ||||||||||||||||||||
| Total | Less than 1 year | 1 – 2 years | 2 – 3 years | More than 3 years | ||||||||||||||||
| Contractual Obligations | ||||||||||||||||||||
| Operating Lease Obligations | $ | 747,508 | $ | 302,493 | $ | 309,816 | $ | 135,200 | $ | - | ||||||||||
Off-Balance Sheet Arrangements
We have not entered into any financial guarantees or other commitments to guarantee the payment obligations of any third parties. In addition, we have not entered into any derivative contracts that are indexed to our own shares and classified as shareholders’ equity, or that are not reflected in our financial statements. Furthermore, we do not have any retained or contingent interest in assets transferred to an unconsolidated entity that serves as credit, liquidity or market risk support to such entity. Moreover, we do not have any variable interest in an unconsolidated entity that provides financing, liquidity, market risk or credit support to us or engages in leasing, hedging or research and development services with us.
6