The Fund seeks high total return over time through a combination of capital appreciation and income.
The following tables describe the fees and expenses that you may pay if you buy, hold and sell shares of the Fund. You may pay other fees, such as brokerage commissions and other fees to financial intermediaries, when buying or selling shares of the Fund, which are not reflected in the tables and examples below.
The Fund pays transaction costs, such as commissions, as applicable, when it buys and sells securities (or “turns over” its portfolio). A higher portfolio turnover rate may indicate higher transaction costs and may result in higher taxes when Fund shares are held in a taxable account. These costs, which are not reflected in annual fund operating expenses or in the example, affect the Fund’s performance. During the fiscal year ended May 31, 2025, the Fund’s portfolio turnover rate was 13% of the average value of its portfolio.
This example is intended to help you compare the cost of investing in shares of the Fund with the cost of investing in other mutual funds. The example assumes that you invest $10,000 in the Fund for the time periods indicated and then redeem all your shares at the end of those periods. The example also assumes that your investment has a 5% return each year and that the Fund’s operating expenses, before fee waivers and/or expense reimbursements, remain the same. The example assumes that the Fund’s fee waiver and/or expense reimbursement arrangements will each remain in place for the durations noted in the table above. Although your actual costs may be higher or lower, based on these assumptions your costs would be:
The Fund is a “fund of funds” that invests in Class W, Class R6 or Class I shares of other Nuveen mutual funds and in other investment pools or investment products, including other funds or exchange-traded funds (“ETFs”) advised by the Fund’s investment adviser, Nuveen Fund Advisors, LLC (“Nuveen Fund Advisors”), the Fund’s sub-adviser, Nuveen Asset Management, LLC (“Nuveen Asset Management”), or their affiliates (collectively, the “Underlying Funds”). In general, the Fund is designed for investors who have an approximate target retirement year in mind, and the Fund’s investments are adjusted from more aggressive to more conservative over time as the Fund’s target retirement year approaches and for approximately 30 years afterwards. The Fund invests in Underlying Funds according to an asset allocation strategy designed for investors who retired in, or planned to retire within a few years of, 2010 and may have begun taking systematic withdrawals upon retirement.
Nuveen Asset Management currently expects to allocate approximately 32.00% of the Fund’s assets to equity Underlying Funds, 66.00% of its assets to fixed-income Underlying Funds and 2.00% of its assets to direct real estate Underlying Funds. These allocations represent targets for equity, fixed-income and direct real estate asset classes. Target allocations will change over time and actual allocations may vary up to ten percentage points from the targets. The target allocations along the investment glidepath, illustrated in the chart below, gradually become more conservative. The Fund had target allocations of approximately 50.00% equity/50.00% fixed-income in the Fund’s target retirement year of 2010 (the direct real estate asset class was added in 2017) and will reach the Fund’s final target allocation of approximately 20.00% equity/80.00% fixed-income/0.00% direct real estate in 2040. Within the equity, fixed-income and direct real estate asset classes, Nuveen Asset Management allocates the Fund’s investments to particular market sectors (U.S. equity, international equity, fixed-income, non-USD fixed-income, short-term fixed-income, inflation-protected assets and direct real estate) represented by various Underlying Funds. These market sector allocations may vary by up to 10% from the Fund’s target market sector allocations. The Fund’s current target market sector allocations for June 30, 2026, which will change over time, are approximately as follows: U.S. Equity: 20.80%; International Equity: 11.20%; Fixed-Income: 34.51%; Non-USD Fixed-Income: 5.50%; Short-Term Fixed-Income: 16.00%; Inflation-Protected Assets: 10.00%; and Direct Real Estate: 2.00%. The asset class and market sector names used herein are intended to reflect the primary type of investment of the Underlying Funds within each of these categories.
The Fund’s target market sector allocations to Underlying Funds may include the Nuveen Core Equity Fund, Nuveen Large Cap Growth Fund, Nuveen Large Cap Value Fund, Nuveen Quant Small Cap Equity Fund, Nuveen Quant Small/Mid Cap Equity Fund, Nuveen Dividend Growth Fund, Nuveen Dividend Value Fund, Nuveen Growth Opportunities ETF and Nuveen Small Cap Select Fund (U.S. Equity);
Nuveen Emerging Markets Equity Fund, Nuveen International Equity Fund, Nuveen International Opportunities Fund, Nuveen International Value Fund and Nuveen Quant International Small Cap Equity Fund (International Equity); Nuveen Core Bond Fund, Nuveen Core Plus Bond Fund, Nuveen Floating Rate Income Fund and Nuveen High Yield Fund (Fixed-Income); Nuveen Emerging Markets Debt Fund and Nuveen International Bond Fund (Non-USD Fixed-Income); Nuveen Money Market Fund and Nuveen Short Term Bond Fund (Short-Term Fixed-Income); Nuveen Inflation Linked Bond Fund (Inflation-Protected Assets); and Nuveen Real Property Fund LP (Direct Real Estate). Nuveen Real Property Fund LP is a private fund, which is not available for investment by the general public; it is currently offered exclusively to investment pools or investment products managed by Nuveen Asset Management or its affiliates.
As a result of its investments in the Underlying Funds, the Fund’s returns will reflect investments in a mix of domestic and foreign equities of companies of various sizes and market capitalizations, a variety of domestic and foreign fixed-income instruments of private and governmental issuers of varying maturities and credit qualities and direct real estate.
Additional or replacement Underlying Funds for each market sector, as well as additional or replacement market sectors, may be included when making future allocations if Nuveen Asset Management believes that such Underlying Funds and/or market sectors are appropriate in light of the Fund’s desired levels of risk and potential return at the particular time. The Fund’s portfolio management team may also add a new market sector if it believes that will help to achieve the Fund’s investment objective. The relative allocations among Underlying Funds within a market sector may be changed at any time without notice to shareholders, and the portfolio management team may use tactical allocation to take advantage of short to intermediate term opportunities through a combination of positions in Underlying Funds. If 10% or more of the Fund’s assets are expected to be invested in any Underlying Fund or market sector not listed above, shareholders will receive prior notice of such change.
As part of the Fund’s ability to invest in other investment pools or investment products noted above, the Fund may invest in ETFs and exchange-traded notes (“ETNs”) to gain exposure to various market sectors or securities in order to effect its asset allocation strategy. Additionally, the Fund may use ETFs or ETNs for cash management, hedging or defensive purposes. ETFs or ETNs will be subject to the risks associated with the types of securities or sectors that they track, while ETNs, which are structured as fixed-income obligations, will also be subject to the general risks of fixed-income securities, including credit risk.
The Fund’s asset class allocations, market sector allocations within each asset class, and Underlying Fund allocations within each market sector, as of June 30, 2025, are listed in the chart below. These allocations will change over time. Underlying Fund allocations in particular may change from year to year. However, as of the date of this Prospectus, Nuveen Asset Management expects that the allocations among the market sectors and Underlying Funds
set forth below will be adjusted over time as Nuveen Asset Management implements: (i) the addition of Nuveen Small Cap Select Fund and Nuveen International Value Fund as new Underlying Funds in the U.S. Equity and International Equity market sectors, respectively, and corresponding reductions in allocations to other Underlying Funds in those market sectors; (ii) the addition of Nuveen Floating Rate Income Fund as a new Underlying Fund in the Fixed-Income market sector and corresponding reductions in allocations to other Underlying Funds in that market sector; (iii) the redesignation of Nuveen Emerging Markets Debt Fund and Nuveen International Bond Fund from the Fixed-Income market sector to the new Non-USD Fixed-Income market sector; and (iv) strategic reallocations among certain Underlying Funds.
Asset Class | Allocation |
| Market Sector | Allocation |
| Underlying Funds | Allocation |
Equity | 33.22% |
| U.S. Equity | 21.66% |
| Nuveen Large Cap Growth | 3.67% |
Nuveen Growth Opportunities ETF | 3.66% | ||||||
Nuveen Dividend Value | 3.27% | ||||||
Nuveen Large Cap Value | 3.25% | ||||||
Nuveen Core Equity | 3.22% | ||||||
Nuveen Dividend Growth | 3.20% | ||||||
Nuveen Quant Small/Mid Cap Equity | 0.77% | ||||||
Nuveen Quant Small Cap Equity | 0.62% | ||||||
International Equity | 11.56% | Nuveen International Equity | 4.91% | ||||
Nuveen International Opportunities | 2.97% | ||||||
Nuveen Emerging Markets Equity | 2.04% | ||||||
Nuveen Quant International Small Cap Equity | 1.64% | ||||||
Fixed-Income | 64.55% |
| Fixed-Income | 39.85% |
| Nuveen Core Bond | 20.94% |
Nuveen Core Plus Bond | 12.97% | ||||||
Nuveen International Bond | 2.08% | ||||||
Nuveen High Yield | 1.99% | ||||||
Nuveen Emerging Markets Debt | 1.87% | ||||||
Short-Term | 14.82% | Nuveen Short Term Bond | 14.82% | ||||
Inflation- | 9.88% | Nuveen Inflation Linked Bond | 9.88% | ||||
Real Estate | 2.23% |
| Direct Real Estate | 2.23% |
| Nuveen Real Property Fund LP | 2.23% |
Total | 100.00% | 100.00% | 100.00% |
The following chart shows how the investment glidepath for the Fund is expected to gradually move the Fund’s target allocations over time between the different target market sector allocations. The actual market sector allocations of the Fund may differ from this chart. The Fund seeks to achieve its final target market sector allocations approximately 30 years following the target date.
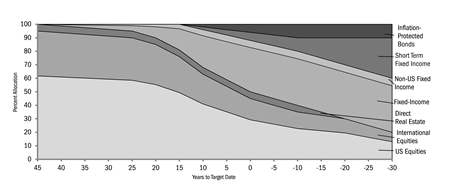
The Fund is designed to accommodate investors who invest in a fund up to their target retirement date, and plan to make gradual systematic withdrawals in retirement. In addition, investors should note that the Fund will continue to have a significant level of equity exposure up to, through and after its target retirement date, and this exposure could cause significant fluctuations in the value of the Fund depending on the performance of the equity markets generally.
After the Fund reaches its final target allocation, the Board of Trustees may authorize the merger of the Fund into another Lifecycle Fund which has also reached its final target allocation or other similar fund designed to maintain a relatively stable asset allocation reflecting the resting point on the glidepath described in the chart above. Fund shareholders will receive prior notice of any such merger.
The following chart and table help illustrate some of the risks of investing in the Fund by showing changes in the Fund’s performance from year to year. The bar chart shows the annual total returns of the Retirement Class of the Fund, before taxes, in each full calendar year for the last ten years. Because the expenses vary across share classes, the performance of the Retirement Class may vary from the other share classes. Below the bar chart are the best and worst returns of the Retirement Class for a calendar quarter during the full calendar-year periods covered by the bar chart. The performance table following the bar chart shows the Fund’s average annual total returns for the Retirement, Class I, Premier and Class R6 classes over the applicable one-year, five-year, ten-year and since-inception periods ended December 31, 2024, and how those returns compare to those of a broad-based securities market index and a composite index that represents the market sectors in which the Fund invests across the equity and fixed-income asset classes. For periods prior to August 1, 2026, Teachers Advisors, LLC (“Advisors”) served as investment adviser to the Fund. After-tax performance is shown only for the Retirement Class shares, and after-tax returns for the other classes of shares will vary from the after-tax returns presented for the Retirement Class shares.
The returns shown below reflect previous agreements by Advisors, the Fund’s prior investment adviser, to waive or reimburse the Fund and certain Underlying Funds for certain fees and expenses. Without these waivers and reimbursements, the returns of the Fund would have been lower. Past performance of the Fund (before and after taxes) is not necessarily an indication of how it will perform in the future. The indices listed below are unmanaged, and you cannot invest directly in an index. The returns for the indices reflect no deduction for fees, expenses or taxes.
For current performance information of each share class, including performance to the most recent month-end, please visit www.nuveen.com/performance or call 800-257-8787.
† The year-to-date return as of the most recent calendar quarter, which ended on June 30, 2025, was 5.49%.
Best quarter: 10.65%, for the quarter ended June 30, 2020. Worst quarter: -9.69%, for the quarter ended March 31, 2020.
You could lose money over short or long periods by investing in this Fund. An investment in the Fund, due to the nature of the Fund’s portfolio holdings, typically is subject to the following principal investment risks:
· Asset Allocation Risk—The risk that the Fund may not achieve its target allocations. In addition, there is the risk that the asset allocations may not achieve the desired risk-return characteristic or that the selection of Underlying Funds and the allocations among them will result in the Fund underperforming other similar funds or cause an investor to lose money.
· Underlying Funds Risks—The Fund is exposed to the risks of the Underlying Funds in which it invests in direct proportion to the amount of assets the Fund allocates to each Underlying Fund.
· Equity Underlying Funds Risks—The risks of investing in equity Underlying Funds include risks specific to their investment strategies, as well as risks related to the equity markets in general, such as:
· market risk—The risk that market prices of portfolio investments held by a Fund may fluctuate rapidly or unpredictably due to a variety of factors, including responses to government actions or interventions, or changing economic, political or market conditions. Market risk may
affect a single issuer, industry or sector of the economy, or it may affect the market as a whole. Such conditions may add significantly to the risk of volatility in the net asset value (“NAV”) of the Fund’s shares and adversely affect the Fund and its investments. From time to time, a Fund may invest a significant portion of its assets in companies in one or more related sectors or industries, which would make the Fund more vulnerable to adverse developments affecting such sectors or industries;
· issuer risk—The risk that an issuer’s earnings prospects, credit rating and overall financial position will deteriorate, causing a decline in the value of the issuer’s financial instruments over short or extended periods of time;
· foreign investment risk—Foreign markets can be more volatile than the U.S. market due to increased risks of adverse issuer, political, regulatory, currency, market or economic developments as well as armed conflicts and can result in greater price volatility and perform differently from financial instruments of U.S. issuers. This risk may be heightened in emerging or developing markets. Foreign investments may also have lower liquidity and be more difficult to value than investments in U.S. issuers. To the extent a Fund invests a significant portion of its assets in the securities of companies in a single country or region, it may be more susceptible to adverse economic, market, political or regulatory events or conditions affecting that country or region. Foreign investments may also be subject to risk of loss because of more or less foreign government regulation, less public information, less stringent investor protections and less stringent accounting, corporate governance, financial reporting and disclosure standards. Changes in the value of foreign currencies may make the return on an investment increase or decrease, unrelated to the quality or performance of the investment itself. The imposition of sanctions, exchange controls (including repatriation restrictions), confiscations, trade restrictions (including tariffs) and other restrictions by the United States or other governments may also negatively impact a Fund’s investments. Economic sanctions and other similar governmental actions or developments could, among other things, effectively restrict or eliminate a Fund’s ability to purchase or sell certain foreign securities or groups of foreign securities, and/or thus may make a Fund’s investments in such securities less liquid (or illiquid) or more difficult to value. The type and severity of sanctions and other measures that may be imposed could vary broadly in scope, and their impact is impossible to predict;
· small- and mid-cap risk—The risk that the stocks of small-capitalization companies often experience greater price volatility than large- or mid-sized companies because small-cap companies are often
newer or less established than larger companies and are likely to have more limited resources, products and markets. Securities of small-cap companies often have lower overall liquidity than securities of larger companies as a result of there being a smaller market for their securities, which can have an adverse effect on the pricing of these securities and on the ability to sell these securities when a Fund’s investment adviser or sub-adviser deems it appropriate. Stocks of mid-capitalization companies often experience greater price volatility, lower trading volume and lower overall liquidity than the stocks of larger, more established companies;
· style risk—The risk that use of a particular investing style (such as growth or value investing) may fall out of favor in the marketplace for various periods of time and result in underperformance relative to the broader market sector or significant declines in the value of a Fund’s portfolio investments; and
· dividend-paying security risk—The risk that investments in dividend-paying securities could cause a Fund to underperform similar funds that invest without consideration of an issuer’s track record of paying dividends.
· Fixed-Income Underlying Funds Risks—The risks of investing in fixed-income Underlying Funds include risks specific to their investment strategies, as well as risks related to the fixed-income markets in general, such as:
· interest rate risk—The risk that changes in interest rates can adversely affect the value or liquidity of, and income generated by, fixed-income investments. This risk is heightened to the extent a Fund invests in longer duration fixed-income investments and during periods when prevailing interest rates are changing. There is a risk that interest rates across the financial system may change, possibly significantly and/or rapidly. In general, changing interest rates, including rates that fall below zero, or a lack of market participants may lead to decreased liquidity and increased volatility in the fixed-income or debt markets, making it more difficult for the Fund to sell fixed-income investments. When interest rates change, the values of longer duration fixed-income securities usually change more than the values of shorter duration fixed-income securities. Conversely, fixed-income securities with shorter durations or maturities will be less volatile but may provide lower returns than fixed-income securities with longer durations or maturities. Other factors that may affect the value of debt securities include, but are not limited to, economic, political, public health, and other crises and responses by governments and companies to such crises;
· prepayment risk—The risk that, during periods of falling interest rates, borrowers may pay off their mortgage loans sooner than expected,
forcing a Fund to reinvest the unanticipated proceeds at lower interest rates and resulting in a decline in income;
· extension risk—The risk that, during periods of rising interest rates, borrowers may pay off their mortgage loans later than expected, preventing a Fund from reinvesting principal proceeds at higher interest rates and resulting in less income than potentially available;
· issuer risk—The risk that an issuer’s earnings prospects, credit rating and overall financial position will deteriorate, causing a decline in the value of the issuer’s financial instruments over short or extended periods of time;
· credit risk—The risk that the issuer of fixed-income investments may not be able or willing, or may be perceived (whether by market participants, rating agencies, pricing services or otherwise) as not able or willing, to meet interest or principal payments when the payments become due. Actual or perceived changes in economic, social, public health, financial or political conditions in general or that affect a particular type of investment, issuer, guarantor or counterparty can reduce the ability of the party to meet its obligations, which can affect the credit quality, liquidity and/or value of an investment;
· credit spread risk—The risk that credit spreads (i.e., the difference in yield between securities that is due to differences in each security’s respective credit quality) may increase when market participants believe that bonds generally have a greater risk of default, which could result in a decline in the market values of a Fund’s debt securities;
· income volatility risk—The risk that the level of current income from a portfolio of fixed-income investments may decline in certain interest rate environments;
· market volatility, liquidity and valuation risk (types of market risk)—The risk that volatile or dramatic reductions in trading activity make it difficult for a Fund to properly value its investments and that a Fund may not be able to purchase or sell an investment at an attractive price, if at all;
· fixed-income foreign investment risk—Investment in fixed-income securities or financial instruments of foreign issuers involves increased risks due to adverse issuer, political, regulatory, currency, market or economic developments as well as armed conflicts. These developments may impact the ability of a foreign debt issuer to make timely and ultimate payments on its debt obligations to a Fund or impair a Fund’s ability to enforce its rights against the foreign debt issuer. These risks are heightened in emerging or developing markets. Foreign investments may also have lower overall liquidity and be more difficult to value than investments in U.S. issuers. To the extent a
Fund invests a significant portion of its assets in the securities of companies in a single country or region, it may be more susceptible to adverse economic, market, political or regulatory events or conditions affecting that country or region. Foreign investments may also be subject to risk of loss because of more or less foreign government regulation, less public information, less stringent investor protections and less stringent accounting, corporate governance, financial reporting and disclosure standards. Changes in the value of foreign currencies may make the return on an investment increase or decrease, unrelated to the quality or performance of the investment itself. The imposition of sanctions, exchange controls (including repatriation restrictions), confiscations, trade restrictions (including tariffs) and other restrictions by the United States and other governments may also negatively impact a Fund’s investments. Economic sanctions and other similar governmental actions or developments could, among other things, effectively restrict or eliminate a Fund’s ability to purchase or sell certain foreign securities or groups of foreign securities, and/or thus may make a Fund’s investments in such securities less liquid (or illiquid) or more difficult to value. The type and severity of sanctions and other measures that may be imposed could vary broadly in scope, and their impact is impossible to predict; and
· call risk—The risk that, during periods of falling interest rates, an issuer may call (or repay) a fixed-income security prior to maturity, resulting in a decline in a Fund’s income.
· Underlying ETF Risk—In addition to the same principal risks as an investment in a mutual fund with the same investment objectives, strategies and policies as the ETF, investments in an Underlying Fund that is an ETF are subject to additional risks, including: (i) the market price of the ETF’s shares may trade at a premium or a discount to their NAV; (ii) an active trading market for an ETF’s shares may not develop or be maintained; and (iii) there is no assurance that the requirements of the exchange necessary to maintain the listing of an ETF will continue to be met or remain unchanged.
· Direct Real Estate Underlying Funds Risks—The risks of investing in direct real estate Underlying Funds include risks specific to their investment strategies, as well as risks related to investing in real estate in general, such as:
· real estate-related investment risk—The risks associated with exposure to direct real estate through investing in investment vehicles managed by Nuveen Asset Management that will primarily invest directly in real estate, which can include declines in real estate values or revenues, uninsured losses at properties, the absence of regulatory oversight of and a secondary market for interests in direct real estate
Underlying Funds, a scarcity of interests issued by direct real estate Underlying Funds, making it difficult for the Fund to achieve its target allocation, and illiquidity of interests in direct real estate Underlying Funds (which exposes the Fund to illiquid investments risk).
· Emerging Markets Underlying Funds Risk—The risk of foreign investment often increases in countries with emerging markets or those economically tied to emerging market countries. For example, these countries may have more unstable governments than developed countries, and their economies may be based on only a few industries. Emerging market countries may also have less stringent regulation of accounting, auditing, financial reporting and recordkeeping requirements, which would affect a Fund’s ability to evaluate potential portfolio companies. As a result, there could be less information available about issuers in emerging market countries, which could negatively affect Nuveen Asset Management’s ability to evaluate local companies or their potential impact on a Fund’s performance. Because the financial markets of emerging market countries may be very small, share prices of financial instruments in emerging market countries may be volatile and difficult to determine. Financial instruments of issuers in these countries may have lower overall liquidity than those of issuers in more developed countries and may be more vulnerable to market manipulation. In addition, foreign investors such as a Fund are subject to a variety of special restrictions in many emerging market countries. Moreover, legal remedies for investors in emerging markets may be more limited, and U.S. authorities may have less ability to enforce certain regulatory or legal obligations or otherwise bring actions against bad actors in emerging market countries.
· Illiquid Investments Underlying Funds Risk—The risk that illiquid investments may be difficult to sell for the value at which they are carried, if at all, or at any price within the desired time frame.
· Currency Underlying Funds Risk—The risk that foreign (non-U.S.) currencies may decline in value relative to the U.S. dollar and adversely affect the value of a Fund’s investments in foreign currencies, securities denominated in foreign currencies or derivative instruments that provide exposure to foreign currencies. Currency rates in foreign countries may fluctuate significantly over short periods of time for a number of reasons, including changes in interest rates and the imposition of currency controls or other political, economic and tax developments in the U.S. or abroad.
· Active Management Risk—The risk that the strategy, investment selection or trading execution of Nuveen Asset Management or another investment adviser or sub-adviser of an Underlying Fund could cause the Fund or an Underlying Fund to underperform its benchmark index or mutual funds with
similar investment objectives and/or strategies and may not produce the desired results or expected returns.
· Fund of Funds Risk—The ability of the Fund to achieve its investment objective will depend in part upon the ability of the Underlying Funds to achieve their investment objectives. There can be no guarantee that any Underlying Fund will achieve its investment objective.
| [1] | As of the close of business on December 31, 2024, the Lifecycle 2010 Fund Composite Index consisted of: 40.0% Bloomberg U.S. Aggregate Bond Index; 23.1% Russell 3000® Index; 12.4% MSCI All Country World Index ex USA Investable Market Index; 14.5% Bloomberg U.S. 1–3 Year Government/Credit Bond Index; and 10.0% Bloomberg U.S. Treasury Inflation Protected Securities (TIPS) 1-10 Year Index. The Fund’s composite benchmark, the components that make up a composite benchmark and the method of calculating a composite benchmark’s performance may vary over time. |
| [2] | Portions of the Management fees and Other expenses are based on expenses originally incurred by Class W shares of the Underlying Funds (as defined below) of the Trust, which have been incurred directly by the Fund pursuant to certain contractual arrangements intended to reallocate directly to the Fund certain fees and expenses that had been paid by the Underlying Funds of the Trust. For additional information, please see the “Management of the Funds” section of this Prospectus. |
| [3] | Restated to reflect estimate for the current fiscal year. |
| [4] | “Acquired fund fees and expenses” are the Fund’s proportionate amount of the expenses of any investment companies or pools in which it invests (excluding expenses originally incurred by Class W shares of the Underlying Funds of the Trust that have been incurred directly by the Fund, which are instead reflected in Management fees and Other expenses). These expenses are not paid directly by Fund shareholders. Instead, Fund shareholders bear these expenses indirectly because they reduce Fund performance. Because “Acquired fund fees and expenses” are included in the chart above, the Fund’s operating expenses here will not correlate with the expenses included in the Financial highlights in this Prospectus and the Fund’s Form N-CSR. |
| [5] | Nuveen Fund Advisors has contractually agreed to waive 0.100% of the Fund’s Management fee. This waiver will remain in effect through at least September 30, 2028, unless changed with the approval of the Board of Trustees. Nuveen Fund Advisors has also contractually agreed to waive an additional 0.066% of the Fund’s Management fee. This waiver will remain in effect through at least September 30, 2026, unless changed with the approval of the Board of Trustees. |
| [6] | Under the Fund’s expense reimbursement arrangements, the Fund’s investment adviser, Nuveen Fund Advisors, LLC (“Nuveen Fund Advisors”), has contractually agreed to reimburse the Fund for any Total annual Fund operating expenses (excluding interest, taxes, brokerage commissions or other transactional expenses, Acquired fund fees and expenses, extraordinary expenses and any expenses originally attributable to Class W shares of the Underlying Funds of the Trust that were incurred directly by the Fund) that exceed: (i) 0.150% of average daily net assets for Class I shares; (ii) 0.150% of average daily net assets for Premier Class shares; (iii) 0.000% of average daily net assets for Class R6 shares; and (iv) 0.250% of average daily net assets for Retirement Class shares of the Fund. These expense reimbursement arrangements will continue through at least September 30, 2026, unless changed with approval of the Board of Trustees. Nuveen Fund Advisors has also agreed to reimburse the Fund for 0.080% of the Total annual Fund operating expenses of each of its share classes that are originally attributable to Class W shares of the Underlying Funds of the Trust. This expense reimbursement arrangement may be terminated or modified prior to July 31, 2028 only with approval of the Board of Trustees. |