Shareholder Report
|
6 Months Ended |
|
May 31, 2026
USD ($)
Holding
|
|---|
| Shareholder Report [Line Items] |
|
| Document Type |
N-CSRS
|
| Amendment Flag |
false
|
| Registrant Name |
Ultimus Managers Trust
|
| Entity Central Index Key |
0001545440
|
| Entity Investment Company Type |
N-1A
|
| Document Period End Date |
May 31, 2026
|
| Shareholder Report Annual or Semi-Annual |
Semi-Annual Shareholder Report
|
| C000123053 |
|
| Shareholder Report [Line Items] |
|
| Fund Name |
Lyrical U.S. Value Equity Fund
|
| Class Name |
Institutional Class
|
| Trading Symbol |
LYRIX
|
| Annual or Semi-Annual Statement [Text Block] |
This semi-annual shareholder report contains important information about Lyrical U.S. Value Equity Fund (the "Fund") for the period of December 1, 2025 to May 31, 2026.
|
| Additional Information [Text Block] |
You can find additional information about the Fund at www.lyricalvaluefunds.com. You can also request this information by contacting us at (888) 884-8099.
|
| Additional Information Phone Number |
(888) 884-8099
|
| Additional Information Website |
<span style="font-weight: 700; box-sizing: border-box; color: rgb(16, 34, 62); display: inline; flex-wrap: nowrap; font-size: 12px; grid-area: auto; line-height: 18px; margin: 0px; overflow: visible; text-align: left; text-align-last: left; white-space-collapse: preserve-breaks;">www.lyricalvaluefunds.com</span>
|
| Expenses [Text Block] |
What were the Fund’s annualized costs for the last six months?(based on a hypothetical $10,000 investment)Table SummaryClass Name | Costs of a $10,000 investment | Costs paid as a percentage of a $10,000 investment |
|---|
Institutional Class | $53 | 0.99% |
|---|
|
| Expenses Paid, Amount |
$ 53
|
| Expense Ratio, Percent |
0.99%
|
| Factors Affecting Performance [Text Block] |
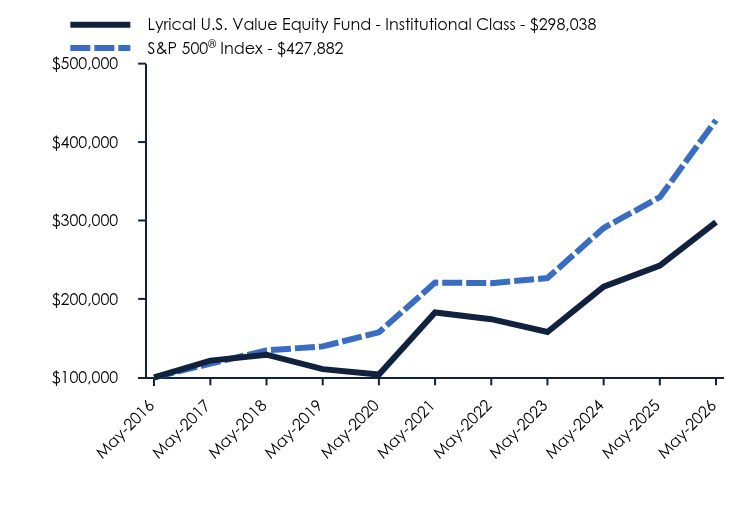
How did the Fund perform during the reporting period? The Fund performed well over the reporting period, outperforming the S&P 500® Index. For the reporting period, the three positions that most positively impacted performance were: Flex Ltd. (FLEX) up 155%, NetApp, Inc. (NTAP) up 58%, and F5, Inc. (FFIV) up 60%. These stocks are all benefiting from the enormous spending on AI and data centers. On the other side, the three positions that most negatively impacted performance were: Fidelity National Information Services, Inc. (FIS) down 34%, HCA Healthcare, Inc. (HCA) down 25%, and NRG Energy, Inc. (NRG) down 20%. These companies all produced strong earnings growth, but underperformed due to their valuation multiple compressing. With good fundamentals, and now a cheaper valuation, we continue to believe in the future return potential of these investments. At the end of the period, the Fund was attractively valued with a price-to-earnings (P/E) ratio of 12.9 times next twelve months consensus earnings. On this same basis the S&P 500® Index had a valuation of 21.1 times earnings, a premium of 63% to the Fund. This discount persists despite the faster growth history of the companies in our portfolio and their lower economic sensitivity. |
| Performance Past Does Not Indicate Future [Text] |
Past performance is not necessarily indicative of future results.
|
| Line Graph [Table Text Block] |
Table Summary | Lyrical U.S. Value Equity Fund - Institutional Class | S&P 500® Index |
|---|
May-2016 | $100,000 | $100,000 |
|---|
May-2017 | $121,322 | $117,468 |
|---|
May-2018 | $128,847 | $134,365 |
|---|
May-2019 | $110,427 | $139,448 |
|---|
May-2020 | $103,503 | $157,349 |
|---|
May-2021 | $182,697 | $220,790 |
|---|
May-2022 | $174,173 | $220,129 |
|---|
May-2023 | $157,765 | $226,561 |
|---|
May-2024 | $215,603 | $290,420 |
|---|
May-2025 | $242,565 | $329,694 |
|---|
May-2026 | $298,038 | $427,882 |
|---|
|
| Average Annual Return [Table Text Block] |
Table Summary | 1 Year | 5 Years | 10 Years |
|---|
Lyrical U.S. Value Equity Fund - Institutional Class | 22.87% | 10.28% | 11.54% |
|---|
S&P 500® Index | 29.78% | 14.15% | 15.65% |
|---|
|
| No Deduction of Taxes [Text Block] |
The graph and table do not reflect the deduction of taxes that a shareholder would pay on fund distributions or redemption of fund shares.
|
| AssetsNet |
$ 1,261,659,922
|
| Holdings Count | Holding |
34
|
| Advisory Fees Paid, Amount |
$ 4,791,560
|
| InvestmentCompanyPortfolioTurnover |
14.00%
|
| Additional Fund Statistics [Text Block] |
- Net Assets$1,261,659,922
- Number of Portfolio Holdings34
- Advisory Fee (net of waivers & recoupments)$4,791,560
- Portfolio Turnover14%
|
| Holdings [Text Block] |
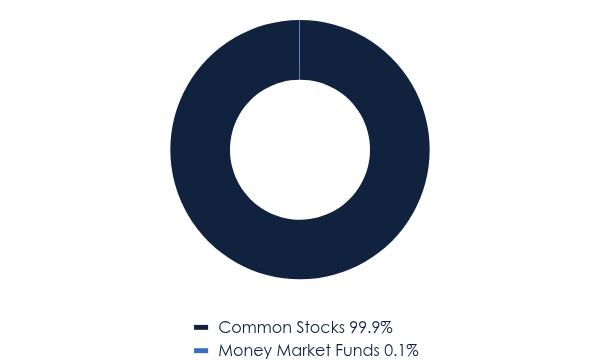
Asset Weighting (% of total investments)Table SummaryValue | Value |
|---|
Common Stocks | 99.9% | Money Market Funds | 0.1% | Sector Weighting (% of net assets)Table SummaryValue | Value |
|---|
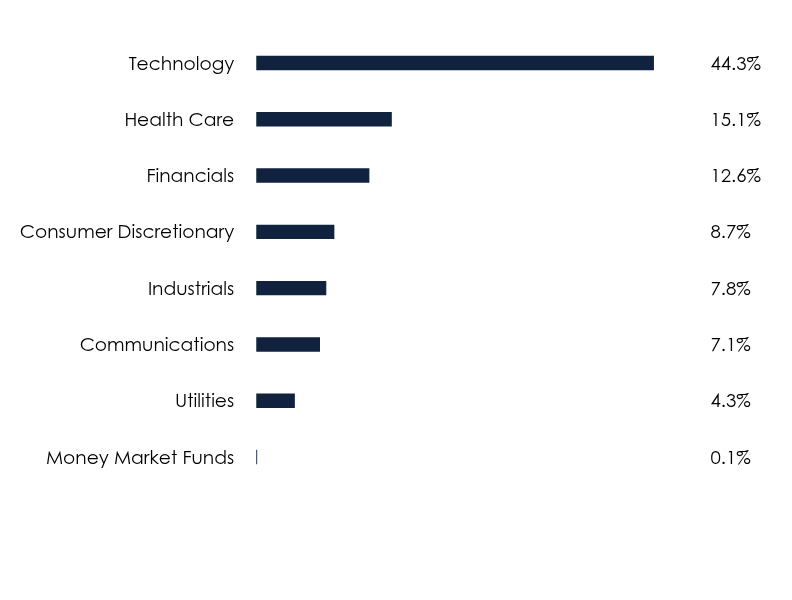
Money Market Funds | 0.1% | Utilities | 4.3% | Communications | 7.1% | Industrials | 7.8% | Consumer Discretionary | 8.7% | Financials | 12.6% | Health Care | 15.1% | Technology | 44.3% | Top 10 Holdings (% of net assets)Table SummaryHolding Name | % of Net Assets |
|---|
Flex Ltd. | 9.6% |
|---|
NetApp, Inc. | 5.5% |
|---|
eBay, Inc. | 5.2% |
|---|
NXP Semiconductors N.V. | 5.1% |
|---|
Johnson Controls International plc | 4.8% |
|---|
Expedia Group, Inc. | 4.3% |
|---|
NRG Energy, Inc. | 4.3% |
|---|
Corpay, Inc. | 4.1% |
|---|
IQVIA Holdings, Inc. | 3.9% |
|---|
F5, Inc. | 3.7% |
|---|
|
| Material Fund Change [Text Block] |
No material changes occurred during the period ended May 31, 2026. |
| C000138389 |
|
| Shareholder Report [Line Items] |
|
| Fund Name |
Lyrical U.S. Value Equity Fund
|
| Class Name |
Investor Class
|
| Trading Symbol |
LYRBX
|
| Annual or Semi-Annual Statement [Text Block] |
This semi-annual shareholder report contains important information about Lyrical U.S. Value Equity Fund (the "Fund") for the period of December 1, 2025 to May 31, 2026.
|
| Additional Information [Text Block] |
You can find additional information about the Fund at www.lyricalvaluefunds.com. You can also request this information by contacting us at (888) 884-8099.
|
| Additional Information Phone Number |
(888) 884-8099
|
| Additional Information Website |
<span style="font-weight: 700; box-sizing: border-box; color: rgb(16, 34, 62); display: inline; flex-wrap: nowrap; font-size: 12px; grid-area: auto; line-height: 18px; margin: 0px; overflow: visible; text-align: left; text-align-last: left; white-space-collapse: preserve-breaks;">www.lyricalvaluefunds.com</span>
|
| Expenses [Text Block] |
What were the Fund’s annualized costs for the last six months?(based on a hypothetical $10,000 investment)Table SummaryClass Name | Costs of a $10,000 investment | Costs paid as a percentage of a $10,000 investment |
|---|
Investor Class | $66 | 1.24% |
|---|
|
| Expenses Paid, Amount |
$ 66
|
| Expense Ratio, Percent |
1.24%
|
| Factors Affecting Performance [Text Block] |
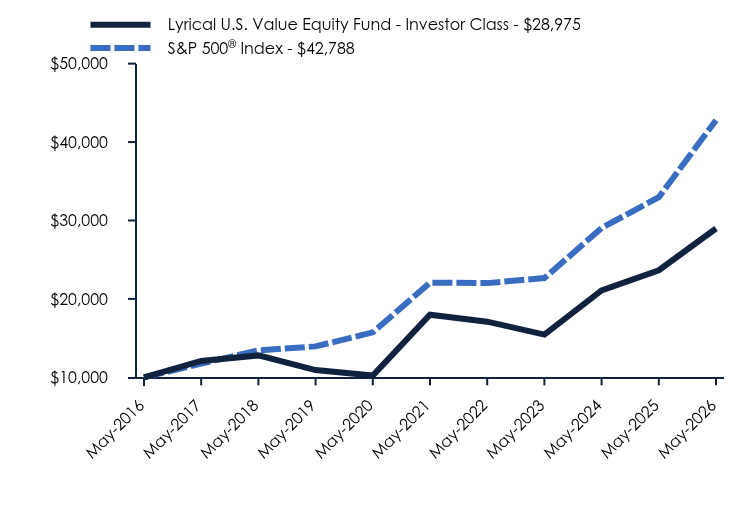
How did the Fund perform during the reporting period? The Fund performed well over the reporting period, outperforming the S&P 500® Index. For the reporting period, the three positions that most positively impacted performance were: Flex Ltd. (FLEX) up 155%, NetApp, Inc. (NTAP) up 58%, and F5, Inc. (FFIV) up 60%. These stocks are all benefiting from the enormous spending on AI and data centers. On the other side, the three positions that most negatively impacted performance were: Fidelity National Information Services, Inc. (FIS) down 34%, HCA Healthcare, Inc. (HCA) down 25%, and NRG Energy, Inc. (NRG) down 20%. These companies all produced strong earnings growth, but underperformed due to their valuation multiple compressing. With good fundamentals, and now a cheaper valuation, we continue to believe in the future return potential of these investments. At the end of the period, the Fund was attractively valued with a price-to-earnings (P/E) ratio of 12.9 times next twelve months consensus earnings. On this same basis the S&P 500® Index had a valuation of 21.1 times earnings, a premium of 63% to the Fund. This discount persists despite the faster growth history of the companies in our portfolio and their lower economic sensitivity. |
| Performance Past Does Not Indicate Future [Text] |
Past performance is not necessarily indicative of future results.
|
| Line Graph [Table Text Block] |
Table Summary | Lyrical U.S. Value Equity Fund - Investor Class | S&P 500® Index |
|---|
May-2016 | $10,000 | $10,000 |
|---|
May-2017 | $12,090 | $11,747 |
|---|
May-2018 | $12,797 | $13,436 |
|---|
May-2019 | $10,925 | $13,945 |
|---|
May-2020 | $10,220 | $15,735 |
|---|
May-2021 | $17,991 | $22,079 |
|---|
May-2022 | $17,100 | $22,013 |
|---|
May-2023 | $15,451 | $22,656 |
|---|
May-2024 | $21,073 | $29,042 |
|---|
May-2025 | $23,653 | $32,969 |
|---|
May-2026 | $28,975 | $42,788 |
|---|
|
| Average Annual Return [Table Text Block] |
Table Summary | 1 Year | 5 Years | 10 Years |
|---|
Lyrical U.S. Value Equity Fund - Investor Class | 22.50% | 10.00% | 11.23% |
|---|
S&P 500® Index | 29.78% | 14.15% | 15.65% |
|---|
|
| No Deduction of Taxes [Text Block] |
The graph and table do not reflect the deduction of taxes that a shareholder would pay on fund distributions or redemption of fund shares.
|
| AssetsNet |
$ 1,261,659,922
|
| Holdings Count | Holding |
34
|
| Advisory Fees Paid, Amount |
$ 4,791,560
|
| InvestmentCompanyPortfolioTurnover |
14.00%
|
| Additional Fund Statistics [Text Block] |
- Net Assets$1,261,659,922
- Number of Portfolio Holdings34
- Advisory Fee (net of waivers & recoupments)$4,791,560
- Portfolio Turnover14%
|
| Holdings [Text Block] |
Asset Weighting (% of total investments)Table SummaryValue | Value |
|---|
Common Stocks | 99.9% | Money Market Funds | 0.1% | Sector Weighting (% of net assets)Table SummaryValue | Value |
|---|
Money Market Funds | 0.1% | Utilities | 4.3% | Communications | 7.1% | Industrials | 7.8% | Consumer Discretionary | 8.7% | Financials | 12.6% | Health Care | 15.1% | Technology | 44.3% | Top 10 Holdings (% of net assets)Table SummaryHolding Name | % of Net Assets |
|---|
Flex Ltd. | 9.6% |
|---|
NetApp, Inc. | 5.5% |
|---|
eBay, Inc. | 5.2% |
|---|
NXP Semiconductors N.V. | 5.1% |
|---|
Johnson Controls International plc | 4.8% |
|---|
Expedia Group, Inc. | 4.3% |
|---|
NRG Energy, Inc. | 4.3% |
|---|
Corpay, Inc. | 4.1% |
|---|
IQVIA Holdings, Inc. | 3.9% |
|---|
F5, Inc. | 3.7% |
|---|
|
| Material Fund Change [Text Block] |
No material changes occurred during the period ended May 31, 2026. |
| C000236986 |
|
| Shareholder Report [Line Items] |
|
| Fund Name |
Lyrical U.S. Value Equity Fund
|
| Class Name |
A Class
|
| Trading Symbol |
LYRAX
|
| Annual or Semi-Annual Statement [Text Block] |
This semi-annual shareholder report contains important information about Lyrical U.S. Value Equity Fund (the "Fund") for the period of December 1, 2025 to May 31, 2026.
|
| Additional Information [Text Block] |
You can find additional information about the Fund at www.lyricalvaluefunds.com. You can also request this information by contacting us at (888) 884-8099.
|
| Additional Information Phone Number |
(888) 884-8099
|
| Additional Information Website |
<span style="font-weight: 700; box-sizing: border-box; color: rgb(16, 34, 62); display: inline; flex-wrap: nowrap; font-size: 12px; grid-area: auto; line-height: 18px; margin: 0px; overflow: visible; text-align: left; text-align-last: left; white-space-collapse: preserve-breaks;">www.lyricalvaluefunds.com</span>
|
| Expenses [Text Block] |
What were the Fund’s annualized costs for the last six months?(based on a hypothetical $10,000 investment)Table SummaryClass Name | Costs of a $10,000 investment | Costs paid as a percentage of a $10,000 investment |
|---|
A Class | $66 | 1.24% |
|---|
|
| Expenses Paid, Amount |
$ 66
|
| Expense Ratio, Percent |
1.24%
|
| Factors Affecting Performance [Text Block] |
How did the Fund perform during the reporting period? The Fund performed well over the reporting period, outperforming the S&P 500® Index. For the reporting period, the three positions that most positively impacted performance were: Flex Ltd. (FLEX) up 155%, NetApp, Inc. (NTAP) up 58%, and F5, Inc. (FFIV) up 60%. These stocks are all benefiting from the enormous spending on AI and data centers. On the other side, the three positions that most negatively impacted performance were: Fidelity National Information Services, Inc. (FIS) down 34%, HCA Healthcare, Inc. (HCA) down 25%, and NRG Energy, Inc. (NRG) down 20%. These companies all produced strong earnings growth, but underperformed due to their valuation multiple compressing. With good fundamentals, and now a cheaper valuation, we continue to believe in the future return potential of these investments. At the end of the period, the Fund was attractively valued with a price-to-earnings (P/E) ratio of 12.9 times next twelve months consensus earnings. On this same basis the S&P 500® Index had a valuation of 21.1 times earnings, a premium of 63% to the Fund. This discount persists despite the faster growth history of the companies in our portfolio and their lower economic sensitivity. |
| Performance Past Does Not Indicate Future [Text] |
Past performance is not necessarily indicative of future results.
|
| Line Graph [Table Text Block] |
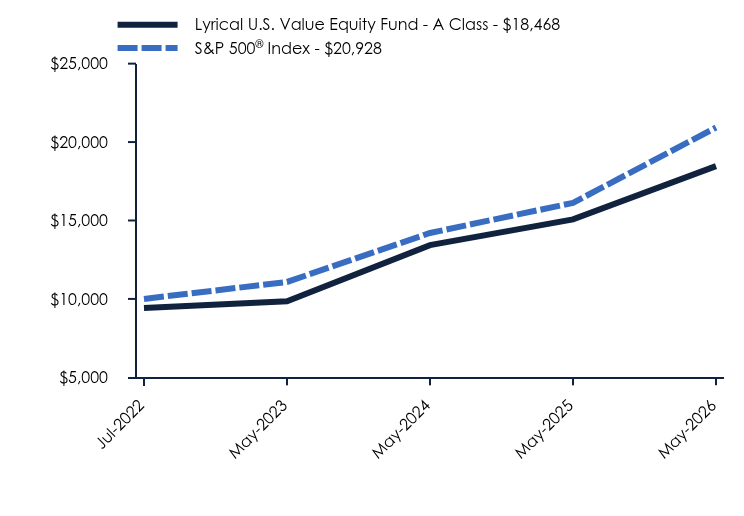
Table Summary | Lyrical U.S. Value Equity Fund - A Class | S&P 500® Index |
|---|
Jul-2022 | $9,426 | $10,000 |
|---|
May-2023 | $9,851 | $11,081 |
|---|
May-2024 | $13,428 | $14,205 |
|---|
May-2025 | $15,072 | $16,126 |
|---|
May-2026 | $18,468 | $20,928 |
|---|
|
| Average Annual Return [Table Text Block] |
Table Summary | 1 Year | Since Inception (July 5, 2022) |
|---|
Lyrical U.S. Value Equity Fund - A Class | | |
|---|
Without Load | 22.53% | 18.80% |
|---|
With LoadFootnote Reference* | 15.49% | 17.01% |
|---|
S&P 500® Index | 29.78% | 20.82% |
|---|
|
| Performance Inception Date |
Jul. 05, 2022
|
| No Deduction of Taxes [Text Block] |
The graph and table do not reflect the deduction of taxes that a shareholder would pay on fund distributions or redemption of fund shares.
|
| AssetsNet |
$ 1,261,659,922
|
| Holdings Count | Holding |
34
|
| Advisory Fees Paid, Amount |
$ 4,791,560
|
| InvestmentCompanyPortfolioTurnover |
14.00%
|
| Additional Fund Statistics [Text Block] |
- Net Assets$1,261,659,922
- Number of Portfolio Holdings34
- Advisory Fee (net of waivers & recoupments)$4,791,560
- Portfolio Turnover14%
|
| Holdings [Text Block] |
Asset Weighting (% of total investments)Table SummaryValue | Value |
|---|
Common Stocks | 99.9% | Money Market Funds | 0.1% | Sector Weighting (% of net assets)Table SummaryValue | Value |
|---|
Money Market Funds | 0.1% | Utilities | 4.3% | Communications | 7.1% | Industrials | 7.8% | Consumer Discretionary | 8.7% | Financials | 12.6% | Health Care | 15.1% | Technology | 44.3% | Top 10 Holdings (% of net assets)Table SummaryHolding Name | % of Net Assets |
|---|
Flex Ltd. | 9.6% |
|---|
NetApp, Inc. | 5.5% |
|---|
eBay, Inc. | 5.2% |
|---|
NXP Semiconductors N.V. | 5.1% |
|---|
Johnson Controls International plc | 4.8% |
|---|
Expedia Group, Inc. | 4.3% |
|---|
NRG Energy, Inc. | 4.3% |
|---|
Corpay, Inc. | 4.1% |
|---|
IQVIA Holdings, Inc. | 3.9% |
|---|
F5, Inc. | 3.7% |
|---|
|
| Material Fund Change [Text Block] |
No material changes occurred during the period ended May 31, 2026. |
| C000236985 |
|
| Shareholder Report [Line Items] |
|
| Fund Name |
Lyrical U.S. Value Equity Fund
|
| Class Name |
C Class
|
| Trading Symbol |
LYRCX
|
| Annual or Semi-Annual Statement [Text Block] |
This semi-annual shareholder report contains important information about Lyrical U.S. Value Equity Fund (the "Fund") for the period of December 1, 2025 to May 31, 2026.
|
| Additional Information [Text Block] |
You can find additional information about the Fund at www.lyricalvaluefunds.com. You can also request this information by contacting us at (888) 884-8099.
|
| Additional Information Phone Number |
(888) 884-8099
|
| Additional Information Website |
<span style="font-weight: 700; box-sizing: border-box; color: rgb(16, 34, 62); display: inline; flex-wrap: nowrap; font-size: 12px; grid-area: auto; line-height: 18px; margin: 0px; overflow: visible; text-align: left; text-align-last: left; white-space-collapse: preserve-breaks;">www.lyricalvaluefunds.com</span>
|
| Expenses [Text Block] |
What were the Fund’s annualized costs for the last six months?(based on a hypothetical $10,000 investment)Table SummaryClass Name | Costs of a $10,000 investment | Costs paid as a percentage of a $10,000 investment |
|---|
C Class | $106 | 1.99% |
|---|
|
| Expenses Paid, Amount |
$ 106
|
| Expense Ratio, Percent |
1.99%
|
| Factors Affecting Performance [Text Block] |
How did the Fund perform during the reporting period? The Fund performed well over the reporting period, outperforming the S&P 500® Index. For the reporting period, the three positions that most positively impacted performance were: Flex Ltd. (FLEX) up 155%, NetApp, Inc. (NTAP) up 58%, and F5, Inc. (FFIV) up 60%. These stocks are all benefiting from the enormous spending on AI and data centers. On the other side, the three positions that most negatively impacted performance were: Fidelity National Information Services, Inc. (FIS) down 34%, HCA Healthcare, Inc. (HCA) down 25%, and NRG Energy, Inc. (NRG) down 20%. These companies all produced strong earnings growth, but underperformed due to their valuation multiple compressing. With good fundamentals, and now a cheaper valuation, we continue to believe in the future return potential of these investments. At the end of the period, the Fund was attractively valued with a price-to-earnings (P/E) ratio of 12.9 times next twelve months consensus earnings. On this same basis the S&P 500® Index had a valuation of 21.1 times earnings, a premium of 63% to the Fund. This discount persists despite the faster growth history of the companies in our portfolio and their lower economic sensitivity. |
| Performance Past Does Not Indicate Future [Text] |
Past performance is not necessarily indicative of future results.
|
| Line Graph [Table Text Block] |
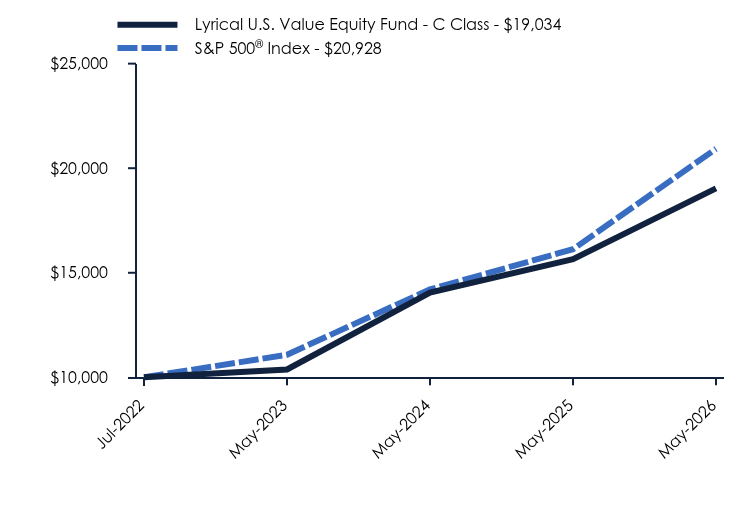
Table Summary | Lyrical U.S. Value Equity Fund - C Class | S&P 500® Index |
|---|
Jul-2022 | $10,000 | $10,000 |
|---|
May-2023 | $10,378 | $11,081 |
|---|
May-2024 | $14,047 | $14,205 |
|---|
May-2025 | $15,651 | $16,126 |
|---|
May-2026 | $19,034 | $20,928 |
|---|
|
| Average Annual Return [Table Text Block] |
Table Summary | 1 Year | Since Inception (July 5, 2022) |
|---|
Lyrical U.S. Value Equity Fund - C Class | | |
|---|
Without CDSC | 21.61% | 17.92% |
|---|
With CDSC | 20.61% | 17.92% |
|---|
S&P 500® Index | 29.78% | 20.82% |
|---|
|
| Performance Inception Date |
Jul. 05, 2022
|
| No Deduction of Taxes [Text Block] |
The graph and table do not reflect the deduction of taxes that a shareholder would pay on fund distributions or redemption of fund shares.
|
| AssetsNet |
$ 1,261,659,922
|
| Holdings Count | Holding |
34
|
| Advisory Fees Paid, Amount |
$ 4,791,560
|
| InvestmentCompanyPortfolioTurnover |
14.00%
|
| Additional Fund Statistics [Text Block] |
- Net Assets$1,261,659,922
- Number of Portfolio Holdings34
- Advisory Fee (net of waivers & recoupments)$4,791,560
- Portfolio Turnover14%
|
| Holdings [Text Block] |
Asset Weighting (% of total investments)Table SummaryValue | Value |
|---|
Common Stocks | 99.9% | Money Market Funds | 0.1% | Sector Weighting (% of net assets)Table SummaryValue | Value |
|---|
Money Market Funds | 0.1% | Utilities | 4.3% | Communications | 7.1% | Industrials | 7.8% | Consumer Discretionary | 8.7% | Financials | 12.6% | Health Care | 15.1% | Technology | 44.3% | Top 10 Holdings (% of net assets)Table SummaryHolding Name | % of Net Assets |
|---|
Flex Ltd. | 9.6% |
|---|
NetApp, Inc. | 5.5% |
|---|
eBay, Inc. | 5.2% |
|---|
NXP Semiconductors N.V. | 5.1% |
|---|
Johnson Controls International plc | 4.8% |
|---|
Expedia Group, Inc. | 4.3% |
|---|
NRG Energy, Inc. | 4.3% |
|---|
Corpay, Inc. | 4.1% |
|---|
IQVIA Holdings, Inc. | 3.9% |
|---|
F5, Inc. | 3.7% |
|---|
|
| Material Fund Change [Text Block] |
No material changes occurred during the period ended May 31, 2026. |
| C000218236 |
|
| Shareholder Report [Line Items] |
|
| Fund Name |
Lyrical International Value Equity Fund
|
| Class Name |
Institutional Class
|
| Trading Symbol |
LYRWX
|
| Annual or Semi-Annual Statement [Text Block] |
This semi-annual shareholder report contains important information about Lyrical International Value Equity Fund (the "Fund") for the period of December 1, 2025 to May 31, 2026.
|
| Additional Information [Text Block] |
You can find additional information about the Fund at www.lyricalvaluefunds.com. You can also request this information by contacting us at (888) 884-8099.
|
| Additional Information Phone Number |
(888) 884-8099
|
| Additional Information Website |
<span style="font-weight: 700; box-sizing: border-box; color: rgb(16, 34, 62); display: inline; flex-wrap: nowrap; font-size: 12px; grid-area: auto; line-height: 14.4px; margin: 0px; overflow: visible; text-align: left; text-align-last: left; white-space-collapse: preserve-breaks;">www.lyricalvaluefunds.com</span>
|
| Expenses [Text Block] |
What were the Fund’s annualized costs for the last six months?(based on a hypothetical $10,000 investment)Table SummaryClass Name | Costs of a $10,000 investment | Costs paid as a percentage of a $10,000 investment |
|---|
Institutional Class | $53 | 0.99% |
|---|
|
| Expenses Paid, Amount |
$ 53
|
| Expense Ratio, Percent |
0.99%
|
| Factors Affecting Performance [Text Block] |
How did the Fund perform during the reporting period? The Fund was up 12.7% during the reporting period, driven by a combination of multiple expansion and earnings growth. The MSCI EAFE Index was up 12.7% during the period and the MSCI EAFE Equal-Weighted Index was up 10.3%. For the reporting period, the three positions that most positively impacted performance were: Samsung Electronics Company Ltd. (SMSN-LON) up 209%, Renesas Electronics Corporation (6723-JP) up 141%, and CK Hutchison Holdings Ltd. (1-HK) up 30%. Both Samsung Electronics Company Ltd. and Renesas Electronics Corporation are benefiting from the enormous spending on artificial intelligence (AI) and data centers. Outperformance for all three stocks was primarily driven by earnings growth. On the other side, the three positions that most negatively impacted performance were: Nintendo Company Ltd. - ADR (NTDOY-US) down 46%, Sony Group Corporation (6758-JP) down 26%, and Grab Holdings Limited - Class A (GRAB-US) down 31%. Both Sony Group Corporation and Grab Holdings Ltd.- Class A produced strong earnings growth, but underperformed due to their valuation multiples compressing. Nintendo Company Ltd. - ADR's profitability has been impacted by soaring memory costs, a near-term headwind that does not change our long-term thesis. Even after strong returns in the period, the portfolio remains attractively valued. The price-to-earnings (P/E) ratio ended the period at 11.9 times the next twelve months consensus earnings. The MSCI EAFE had a valuation of 15.4 times earnings on this same basis, a premium of 23% to the Fund. In addition to an attractive valuation, our Fund also has had superior earnings growth. Since 2008, the companies in our portfolio have grown their earnings per share at a 7.7% annualized rate, compared to the MSCI EAFE at 2.7%. |
| Performance Past Does Not Indicate Future [Text] |
Past performance is not necessarily indicative of future
results.
|
| Line Graph [Table Text Block] |
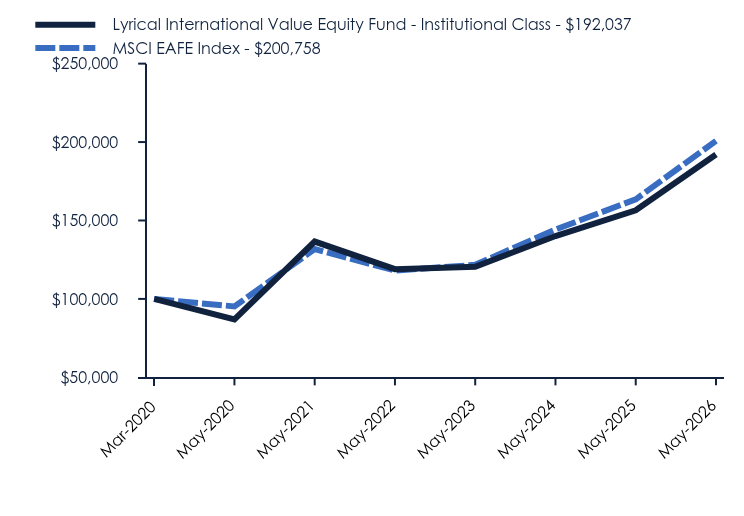
Table Summary | Lyrical International Value Equity Fund - Institutional Class | MSCI EAFE Index |
|---|
Mar-2020 | $100,000 | $100,000 |
|---|
May-2020 | $86,900 | $95,200 |
|---|
May-2021 | $136,568 | $131,770 |
|---|
May-2022 | $118,957 | $118,093 |
|---|
May-2023 | $120,448 | $121,708 |
|---|
May-2024 | $140,066 | $144,256 |
|---|
May-2025 | $156,479 | $163,484 |
|---|
May-2026 | $192,037 | $200,758 |
|---|
|
| Average Annual Return [Table Text Block] |
Table Summary | 1 Year | 5 Years | Since Inception (March 2, 2020) |
|---|
Lyrical International Value Equity Fund - Institutional Class | 22.72% | 7.06% | 11.01% |
|---|
MSCI EAFE Index | 22.80% | 8.79% | 11.80% |
|---|
|
| Performance Inception Date |
Mar. 02, 2020
|
| No Deduction of Taxes [Text Block] |
The graph and table do not reflect the deduction of taxes that a shareholder would pay on fund distributions or redemption of fund shares.
|
| AssetsNet |
$ 38,001,209
|
| Holdings Count | Holding |
29
|
| Advisory Fees Paid, Amount |
$ 0
|
| InvestmentCompanyPortfolioTurnover |
11.00%
|
| Additional Fund Statistics [Text Block] |
- Net Assets$38,001,209
- Number of Portfolio Holdings29
- Advisory Fee (net of waivers)$0
- Portfolio Turnover11%
|
| Holdings [Text Block] |
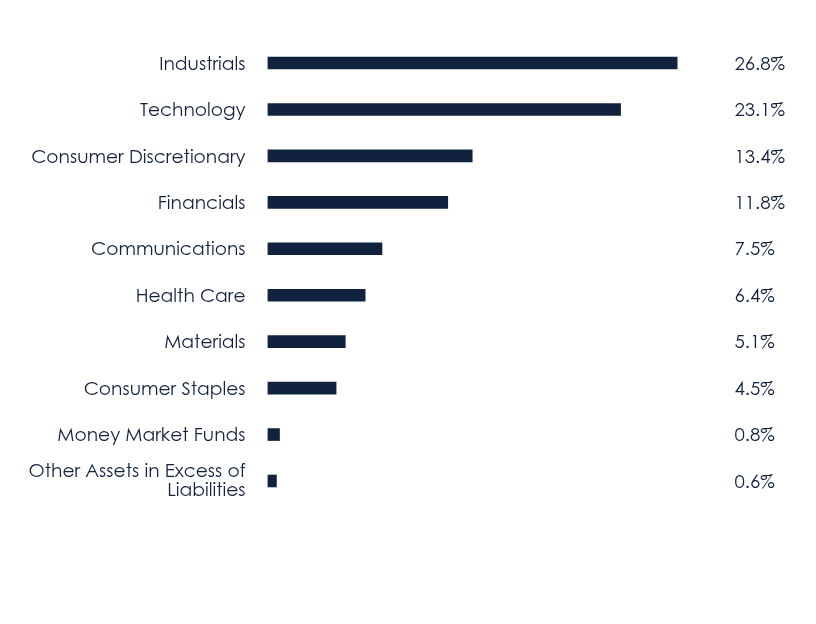
Sector Weighting (% of net assets)Table SummaryValue | Value |
|---|
Other Assets in Excess of Liabilities | 0.6% | Money Market Funds | 0.8% | Consumer Staples | 4.5% | Materials | 5.1% | Health Care | 6.4% | Communications | 7.5% | Financials | 11.8% | Consumer Discretionary | 13.4% | Technology | 23.1% | Industrials | 26.8% | Asset Weighting (% of total investments)Table SummaryValue | Value |
|---|
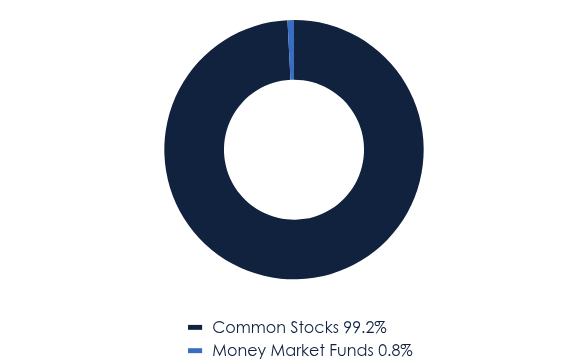
Common Stocks | 99.2% | Money Market Funds | 0.8% | Top 10 Holdings (% of net assets)Table SummaryHolding Name | % of Net Assets |
|---|
Samsung Electronics Company Ltd. | 7.6% |
|---|
Renesas Electronics Corporation | 7.0% |
|---|
CK Hutchison Holdings Ltd. | 4.5% |
|---|
Bollore SE | 4.3% |
|---|
Rexel S.A. | 4.3% |
|---|
Johnson Controls International plc | 4.2% |
|---|
Ayvens S.A. | 4.1% |
|---|
Evolution AB | 4.0% |
|---|
Julius Baer Group Ltd. | 4.0% |
|---|
AerCap Holdings N.V. | 4.0% |
|---|
|
| Material Fund Change [Text Block] |
No material changes occurred during the period ended May 31, 2026. |
| C000218237 |
|
| Shareholder Report [Line Items] |
|
| Fund Name |
Lyrical International Value Equity Fund
|
| Class Name |
Investor Class
|
| Trading Symbol |
LYRNX
|
| Annual or Semi-Annual Statement [Text Block] |
This semi-annual shareholder report contains important information about Lyrical International Value Equity Fund (the "Fund") for the period of December 1, 2025 to May 31, 2026.
|
| Additional Information [Text Block] |
You can find additional information about the Fund at www.lyricalvaluefunds.com. You can also request this information by contacting us at (888) 884-8099.
|
| Additional Information Phone Number |
(888) 884-8099
|
| Additional Information Website |
<span style="font-weight: 700; box-sizing: border-box; color: rgb(16, 34, 62); display: inline; flex-wrap: nowrap; font-size: 12px; grid-area: auto; line-height: 14.4px; margin: 0px; overflow: visible; text-align: left; text-align-last: left; white-space-collapse: preserve-breaks;">www.lyricalvaluefunds.com</span>
|
| Expenses [Text Block] |
What were the Fund’s annualized costs for the last six months?(based on a hypothetical $10,000 investment)Table SummaryClass Name | Costs of a $10,000 investment | Costs paid as a percentage of a $10,000 investment |
|---|
Investor Class | $66 | 1.24% |
|---|
|
| Expenses Paid, Amount |
$ 66
|
| Expense Ratio, Percent |
1.24%
|
| Factors Affecting Performance [Text Block] |
How did the Fund perform during the reporting period? The Fund was up 12.6% during the reporting period, driven by a combination of multiple expansion and earnings growth. The MSCI EAFE Index was up 12.7% during the period and the MSCI EAFE Equal-Weighted Index was up 10.3%. For the reporting period, the three positions that most positively impacted performance were: Samsung Electronics Company Ltd. (SMSN-LON) up 209%, Renesas Electronics Corporation (6723-JP) up 141%, and CK Hutchison Holdings Ltd. (1-HK) up 30%. Both Samsung Electronics Company Ltd. and Renesas Electronics Corporation are benefiting from the enormous spending on artificial intelligence (AI) and data centers. Outperformance for all three stocks was primarily driven by earnings growth. On the other side, the three positions that most negatively impacted performance were: Nintendo Company Ltd. - ADR (NTDOY-US) down 46%, Sony Group Corporation (6758-JP) down 26%, and Grab Holdings Ltd.- Class A (GRAB-US) down 31%. Both Sony Group Corporation and Grab Holdings Limited - Class A produced strong earnings growth, but underperformed due to their valuation multiples compressing. Nintendo Company Ltd. - ADR's profitability has been impacted by soaring memory costs, a near-term headwind that does not change our long-term thesis. Even after strong returns in the period, the portfolio remains attractively valued. The price-to-earnings (P/E) ratio ended the period at 11.9 times the next twelve months consensus earnings. The MSCI EAFE had a valuation of 15.4 times earnings on this same basis, a premium of 23% to the Fund. In addition to an attractive valuation, our Fund also has had superior earnings growth. Since 2008, the companies in our portfolio have grown their earnings per share at a 7.7% annualized rate, compared to the MSCI EAFE at 2.7%. |
| Performance Past Does Not Indicate Future [Text] |
Past performance is not necessarily indicative of future results.
|
| Line Graph [Table Text Block] |
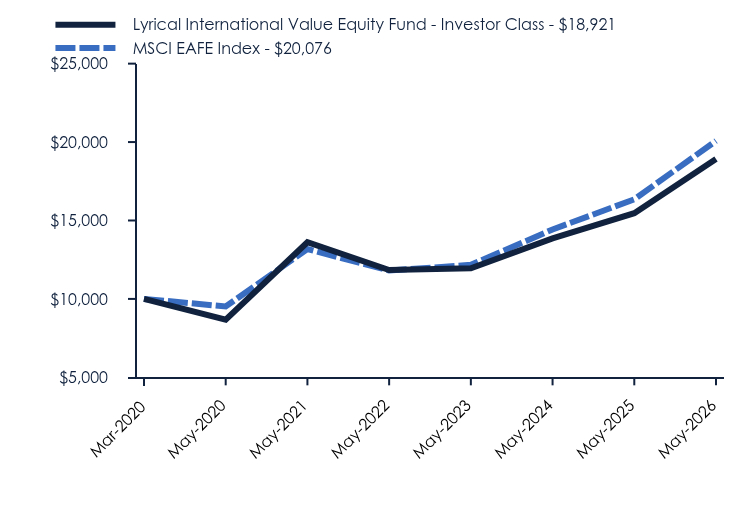
Table Summary | Lyrical International Value Equity Fund - Investor Class | MSCI EAFE Index |
|---|
Mar-2020 | $10,000 | $10,000 |
|---|
May-2020 | $8,680 | $9,520 |
|---|
May-2021 | $13,615 | $13,177 |
|---|
May-2022 | $11,836 | $11,809 |
|---|
May-2023 | $11,955 | $12,171 |
|---|
May-2024 | $13,863 | $14,426 |
|---|
May-2025 | $15,465 | $16,348 |
|---|
May-2026 | $18,921 | $20,076 |
|---|
|
| Average Annual Return [Table Text Block] |
Table Summary | 1 Year | 5 Years | Since Inception (March 2, 2020) |
|---|
Lyrical International Value Equity Fund - Investor Class | 22.35% | 6.80% | 10.75% |
|---|
MSCI EAFE Index | 22.80% | 8.79% | 11.80% |
|---|
|
| Performance Inception Date |
Mar. 02, 2020
|
| No Deduction of Taxes [Text Block] |
The graph and table do not reflect the deduction of taxes that a shareholder would pay on fund distributions or redemption of fund shares.
|
| AssetsNet |
$ 38,001,209
|
| Holdings Count | Holding |
29
|
| Advisory Fees Paid, Amount |
$ 0
|
| InvestmentCompanyPortfolioTurnover |
11.00%
|
| Additional Fund Statistics [Text Block] |
- Net Assets$38,001,209
- Number of Portfolio Holdings29
- Advisory Fee (net of waivers)$0
- Portfolio Turnover11%
|
| Holdings [Text Block] |
Sector Weighting (% of net assets)Table SummaryValue | Value |
|---|
Other Assets in Excess of Liabilities | 0.6% | Money Market Funds | 0.8% | Consumer Staples | 4.5% | Materials | 5.1% | Health Care | 6.4% | Communications | 7.5% | Financials | 11.8% | Consumer Discretionary | 13.4% | Technology | 23.1% | Industrials | 26.8% | Asset Weighting (% of total investments)Table SummaryValue | Value |
|---|
Common Stocks | 99.2% | Money Market Funds | 0.8% | Top 10 Holdings (% of net assets)Table SummaryHolding Name | % of Net Assets |
|---|
Samsung Electronics Company Ltd. | 7.6% |
|---|
Renesas Electronics Corporation | 7.0% |
|---|
CK Hutchison Holdings Ltd. | 4.5% |
|---|
Bollore SE | 4.3% |
|---|
Rexel S.A. | 4.3% |
|---|
Johnson Controls International plc | 4.2% |
|---|
Ayvens S.A. | 4.1% |
|---|
Evolution AB | 4.0% |
|---|
Julius Baer Group Ltd. | 4.0% |
|---|
AerCap Holdings N.V. | 4.0% |
|---|
|
| Material Fund Change [Text Block] |
No material changes occurred during the period ended May 31, 2026. |
| C000216823 |
|
| Shareholder Report [Line Items] |
|
| Fund Name |
Q3 All-Season Systematic Opportunities Fund
|
| Class Name |
Institutional Class
|
| Trading Symbol |
QASOX
|
| Annual or Semi-Annual Statement [Text Block] |
This semi-annual shareholder report contains important information about Q3 All-Season Systematic Opportunities Fund (the "Fund") for the period of December 1, 2025 to May 31, 2026.
|
| Additional Information [Text Block] |
You can find additional information about the Fund at https://funddocs.filepoint.com/q3. You can also request this information by contacting us at (855) 784-2399.
|
| Additional Information Phone Number |
(855) 784-2399
|
| Additional Information Website |
<span style="font-weight: 700; box-sizing: border-box; color: rgb(0, 0, 0); display: inline; flex-wrap: nowrap; font-size: 12px; grid-area: auto; line-height: 18px; margin: 0px; overflow: visible; text-align: left; text-align-last: left; white-space-collapse: preserve-breaks;">https://funddocs.filepoint.com/q3</span>
|
| Expenses [Text Block] |
What were the Fund’s annualized costs for the last six months?(based on a hypothetical $10,000 investment)Table SummaryClass Name | Costs of a $10,000 investment | Costs paid as a percentage of a $10,000 investment |
|---|
Institutional Class | $62 | 1.21% |
|---|
|
| Expenses Paid, Amount |
$ 62
|
| Expense Ratio, Percent |
1.21%
|
| Factors Affecting Performance [Text Block] |
How did the Fund perform during the reporting period? The Fund performed exactly as designed during the six-month period ended May 31, 2026, successfully navigating a highly bifurcated market regime to generate positive risk-adjusted returns. The first half of the reporting period provided an ideal environment for the Fund’s core methodology, which specializes in exploiting short-term equity volatility by purchasing equities during market pullbacks and liquidating positions upon subsequent recoveries. As large-cap equities faced significant downward pressure in February and March due to escalating geopolitical tensions and renewed inflation fears, the Fund systematically executed tactical trades inside the S&P 500® Index and NASDAQ-100® Index platforms. By capturing these distinct trading windows, the strategy achieved equity-like gains while maintaining a substantially lower risk profile than a traditional buy-and-hold approach. When volatility temporarily compressed during the historic, long-only equity surges of April and May, the model adaptively reduced its equity exposure to preserve capital. During these stretches outside of the equity markets, the Fund safely deployed its cash reserves into high-yielding money market funds, providing a stable yield baseline while waiting for the next volatile entry signal. |
| Performance Past Does Not Indicate Future [Text] |
The Fund’s past performance is not a good predictor of how the Fund will perform in the future.
|
| Line Graph [Table Text Block] |
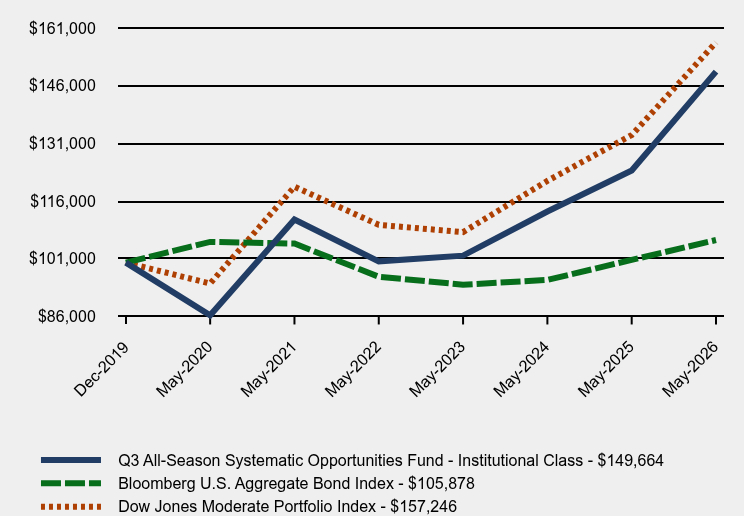
Table Summary | Q3 All-Season Systematic Opportunities Fund - Institutional Class | Bloomberg U.S. Aggregate Bond Index | Dow Jones Moderate Portfolio Index |
|---|
Dec-2019 | $100,000 | $100,000 | $100,000 |
|---|
May-2020 | $86,300 | $105,385 | $94,569 |
|---|
May-2021 | $111,200 | $104,959 | $119,739 |
|---|
May-2022 | $100,327 | $96,329 | $109,822 |
|---|
May-2023 | $101,814 | $94,265 | $107,927 |
|---|
May-2024 | $113,292 | $95,495 | $121,258 |
|---|
May-2025 | $123,942 | $100,709 | $133,172 |
|---|
May-2026 | $149,664 | $105,878 | $157,246 |
|---|
|
| Average Annual Return [Table Text Block] |
Table Summary | 1 Year | 5 Years | Since Inception (December 30, 2019) |
|---|
Q3 All-Season Systematic Opportunities Fund - Institutional Class | 20.75% | 6.12% | 6.48% |
|---|
Bloomberg U.S. Aggregate Bond Index | 5.13% | 0.17% | 0.89% |
|---|
Dow Jones Moderate Portfolio Index | 18.08% | 5.60% | 7.31% |
|---|
|
| Performance Inception Date |
Dec. 30, 2019
|
| No Deduction of Taxes [Text Block] |
The graph and table do not reflect the deduction of taxes that a shareholder would pay on fund distributions or redemption of fund shares.
|
| AssetsNet |
$ 355,196,441
|
| Holdings Count | Holding |
2
|
| Advisory Fees Paid, Amount |
$ 1,545,954
|
| InvestmentCompanyPortfolioTurnover |
2.00%
|
| Additional Fund Statistics [Text Block] |
- Net Assets$355,196,441
- Number of Portfolio Holdings2
- Advisory Fee $1,545,954
- Portfolio Turnover2%
|
| Holdings [Text Block] |
Sector Weighting (% of net assets)Table SummaryValue | Value |
|---|
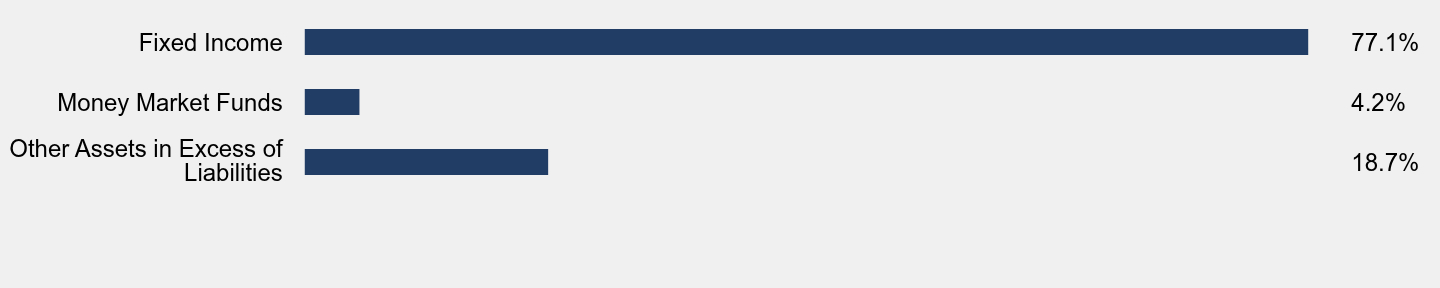
Other Assets in Excess of Liabilities | 18.7% | Money Market Funds | 4.2% | Fixed Income | 77.1% | |
| Material Fund Change [Text Block] |
No material changes occurred during the period ended May 31, 2026. |
| C000256096 |
|
| Shareholder Report [Line Items] |
|
| Fund Name |
Q3 All-Season Systematic Opportunities Fund
|
| Class Name |
C Class
|
| Trading Symbol |
QCSOX
|
| Annual or Semi-Annual Statement [Text Block] |
This semi-annual shareholder report contains important information about Q3 All-Season Systematic Opportunities Fund (the "Fund") for the period of December 1, 2025 to May 31, 2026.
|
| Additional Information [Text Block] |
You can find additional information about the Fund at https://funddocs.filepoint.com/q3. You can also request this information by contacting us at (855) 784-2399.
|
| Additional Information Phone Number |
(855) 784-2399
|
| Additional Information Website |
<span style="font-weight: 700; box-sizing: border-box; color: rgb(0, 0, 0); display: inline; flex-wrap: nowrap; font-size: 12px; grid-area: auto; line-height: 18px; margin: 0px; overflow: visible; text-align: left; text-align-last: left; white-space-collapse: preserve-breaks;">https://funddocs.filepoint.com/q3</span>
|
| Expenses [Text Block] |
What were the Fund’s annualized costs for the last six months?(based on a hypothetical $10,000 investment)Table SummaryClass Name | Costs of a $10,000 investment | Costs paid as a percentage of a $10,000 investment |
|---|
C Class | $132 | 2.58% |
|---|
|
| Expenses Paid, Amount |
$ 132
|
| Expense Ratio, Percent |
2.58%
|
| Factors Affecting Performance [Text Block] |
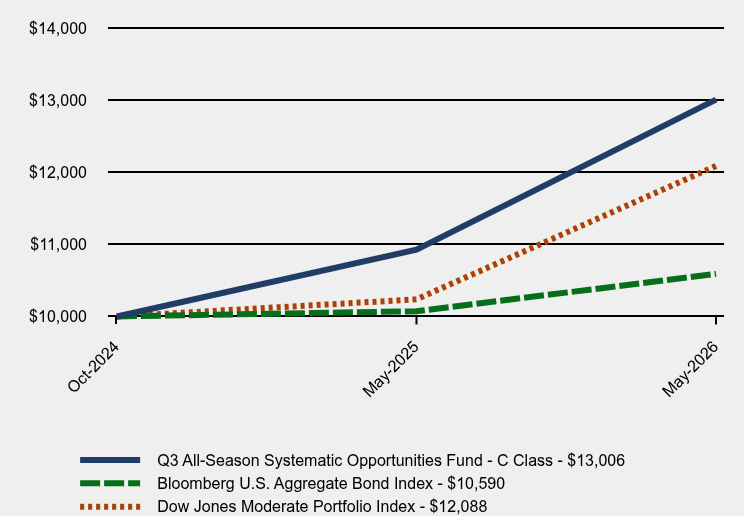
How did the Fund perform during the reporting period? The Fund performed exactly as designed during the six-month period ended May 31, 2026, successfully navigating a highly bifurcated market regime to generate positive risk-adjusted returns. The first half of the reporting period provided an ideal environment for the Fund’s core methodology, which specializes in exploiting short-term equity volatility by purchasing equities during market pullbacks and liquidating positions upon subsequent recoveries. As large-cap equities faced significant downward pressure in February and March due to escalating geopolitical tensions and renewed inflation fears, the Fund systematically executed tactical trades inside the S&P 500® Index and NASDAQ-100® Index platforms. By capturing these distinct trading windows, the strategy achieved equity-like gains while maintaining a substantially lower risk profile than a traditional buy-and-hold approach. When volatility temporarily compressed during the historic, long-only equity surges of April and May, the model adaptively reduced its equity exposure to preserve capital. During these stretches outside of the equity markets, the Fund safely deployed its cash reserves into high-yielding money market funds, providing a stable yield baseline while waiting for the next volatile entry signal. |
| Performance Past Does Not Indicate Future [Text] |
The Fund’s past performance is not a good predictor of how the Fund will perform in the future.
|
| Line Graph [Table Text Block] |
Table Summary | Q3 All-Season Systematic Opportunities Fund - C Class | Bloomberg U.S. Aggregate Bond Index | Dow Jones Moderate Portfolio Index |
|---|
Oct-2024 | $10,000 | $10,000 | $10,000 |
|---|
May-2025 | $10,926 | $10,073 | $10,237 |
|---|
May-2026 | $13,006 | $10,590 | $12,088 |
|---|
|
| Average Annual Return [Table Text Block] |
Table Summary | 1 Year | Since Inception (October 18, 2024) |
|---|
Q3 All-Season Systematic Opportunities Fund - C Class | 19.03% | 17.65% |
|---|
Bloomberg U.S. Aggregate Bond Index | 5.13% | 3.61% |
|---|
Dow Jones Moderate Portfolio Index | 18.08% | 12.44% |
|---|
|
| Performance Inception Date |
Oct. 18, 2024
|
| No Deduction of Taxes [Text Block] |
The graph and table do not reflect the deduction of taxes that a shareholder would pay on fund distributions or redemption of fund shares.
|
| AssetsNet |
$ 355,196,441
|
| Holdings Count | Holding |
2
|
| Advisory Fees Paid, Amount |
$ 1,545,954
|
| InvestmentCompanyPortfolioTurnover |
2.00%
|
| Additional Fund Statistics [Text Block] |
- Net Assets$355,196,441
- Number of Portfolio Holdings2
- Advisory Fee $1,545,954
- Portfolio Turnover2%
|
| Holdings [Text Block] |
Sector Weighting (% of net assets)Table SummaryValue | Value |
|---|
Other Assets in Excess of Liabilities | 18.7% | Money Market Funds | 4.2% | Fixed Income | 77.1% | |
| Material Fund Change [Text Block] |
No material changes occurred during the period ended May 31, 2026. |
| C000238715 |
|
| Shareholder Report [Line Items] |
|
| Fund Name |
Q3 All-Season Active Rotation ETF
|
| Trading Symbol |
QVOY
|
| Security Exchange Name |
CboeBZX
|
| Annual or Semi-Annual Statement [Text Block] |
This semi-annual shareholder report contains important information about Q3 All-Season Active Rotation ETF (the "Fund") for the period of December 1, 2025 to May 31, 2026.
|
| Additional Information [Text Block] |
You can find additional information about the Fund at https://www.q3allseasonfunds.com/etf/. You can also request this information by contacting us at (888) 348-1255.
|
| Additional Information Phone Number |
(888) 348-1255
|
| Additional Information Website |
<span style="font-weight: 700; box-sizing: border-box; color: rgb(0, 0, 0); display: inline; flex-wrap: nowrap; font-size: 12px; grid-area: auto; line-height: 18px; margin: 0px; overflow: visible; text-align: left; text-align-last: left; white-space-collapse: preserve-breaks;">https://www.q3allseasonfunds.com/etf/</span>
|
| Expenses [Text Block] |
What were the Fund’s annualized costs for the last six months?(based on a hypothetical $10,000 investment)Table SummaryFund Name | Costs of a $10,000 investment | Costs paid as a percentage of a $10,000 investment |
|---|
Q3 All-Season Active Rotation ETF | $60 | 1.10% |
|---|
|
| Expenses Paid, Amount |
$ 60
|
| Expense Ratio, Percent |
1.10%
|
| Factors Affecting Performance [Text Block] |
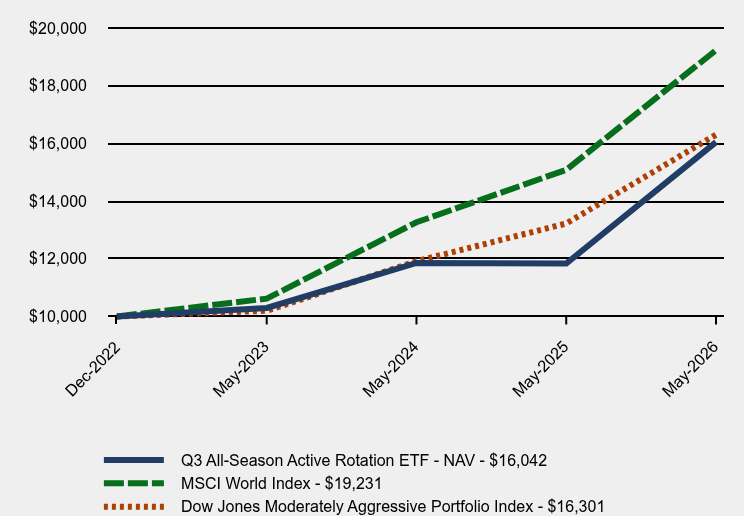
How did the Fund perform during the reporting period? During the six months ended May 31, 2026, the Fund successfully capitalized on powerful rotational shifts across global equity, fixed income, and commodity markets. The reporting period experienced dramatic leadership swings, beginning with a strong value and small-cap bias in early winter, followed by a severe March correction, and concluding with an aggressive technology-led growth expansion in April and May. The Fund’s active equity sleeve, which targets sectors displaying positive relative strength, benefited significantly from this volatile backdrop. Strategic allocations to precious metals and defensive sectors shielded the portfolio during the first-quarter equity contraction, as gold and broad commodities surged amid heightened macroeconomic anxiety. As market leadership aggressively pivoted back toward growth in the spring, the Fund adjusted its underlying exposure to capture the explosive, artificial intelligence-driven technology and semiconductor rally. Furthermore, the Fund’s 15% alternative sleeve contributed meaningfully to overall outperformance, driven by tactical positions in metals that reached multi-year highs. Meanwhile, the fixed income allocation remained agile, rotating across corporate and Treasury sectors to generate modest gains and effectively lower overall portfolio correlation. |
| Performance Past Does Not Indicate Future [Text] |
The Fund's past performance is not a good predictor of how the Fund will perform in the future.
|
| Line Graph [Table Text Block] |
Table Summary | Q3 All-Season Active Rotation ETF - NAV | MSCI World Index | Dow Jones Moderately Aggressive Portfolio Index |
|---|
Dec-2022 | $10,000 | $10,000 | $10,000 |
|---|
May-2023 | $10,295 | $10,619 | $10,197 |
|---|
May-2024 | $11,856 | $13,265 | $11,915 |
|---|
May-2025 | $11,834 | $15,084 | $13,223 |
|---|
May-2026 | $16,042 | $19,231 | $16,301 |
|---|
|
| Average Annual Return [Table Text Block] |
Table Summary | 1 Year | Since Inception (December 6, 2022) |
|---|
Q3 All-Season Active Rotation ETF | 35.56% | 14.54% |
|---|
MSCI World Index | 27.49% | 20.66% |
|---|
Dow Jones Moderately Aggressive Portfolio Index
| 23.27% | 15.06% |
|---|
|
| Performance Inception Date |
Dec. 06, 2022
|
| No Deduction of Taxes [Text Block] |
The graph and table do not reflect the deduction of taxes that a shareholder would pay on fund distributions or redemption of fund shares.
|
| Updated Performance Information Location [Text Block] |
Call (888) 348-1255 or visit https://www.q3allseasonfunds.com/etf/ for updated performance information.
|
| AssetsNet |
$ 59,543,041
|
| Holdings Count | Holding |
12
|
| Advisory Fees Paid, Amount |
$ 174,350
|
| InvestmentCompanyPortfolioTurnover |
284.00%
|
| Additional Fund Statistics [Text Block] |
- Net Assets$59,543,041
- Number of Portfolio Holdings12
- Advisory Fee (net of recoupments)$174,350
- Portfolio Turnover284%
|
| Holdings [Text Block] |
Asset Weighting (% of total investments)Table SummaryValue | Value |
|---|
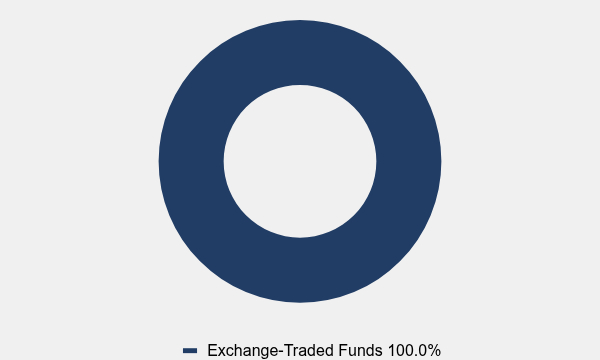
Exchange-Traded Funds | 100.0% | Sector Weighting (% of net assets)Table SummaryValue | Value |
|---|
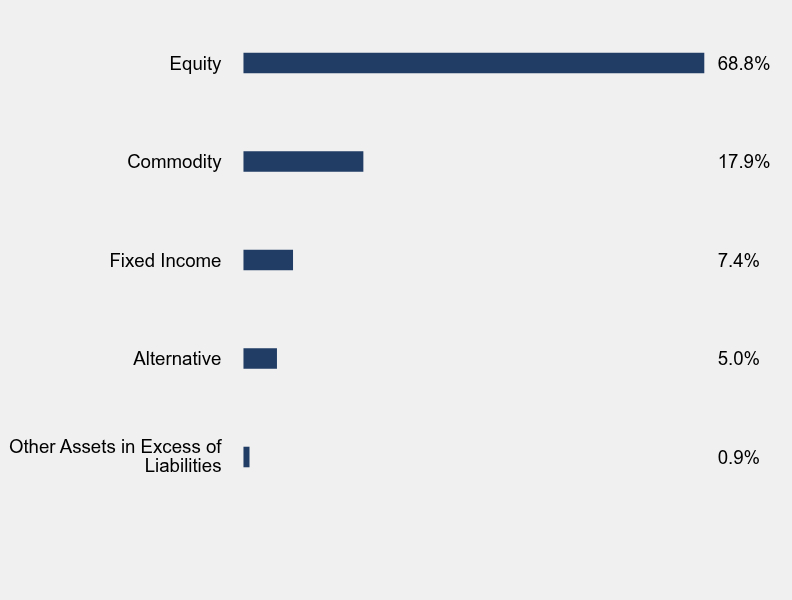
Other Assets in Excess of Liabilities | 0.9% | Alternative | 5.0% | Fixed Income | 7.4% | Commodity | 17.9% | Equity | 68.8% | Top 10 Holdings (% of net assets)Table SummaryHolding Name | % of Net Assets |
|---|
State Street Technology Select Sector SPDR ETF | 14.5% |
|---|
Invesco QQQ Trust Series 1 | 14.1% |
|---|
Invesco S&P 500 High Beta ETF | 13.7% |
|---|
VanEck Oil Services ETF | 13.7% |
|---|
iShares MSCI USA Value Factor ETF | 13.6% |
|---|
Vanguard Small-Cap Value ETF | 12.9% |
|---|
NYLI Hedge Multi-Strategy Tracker ETF | 5.0% |
|---|
iShares Convertible Bond ETF | 4.9% |
|---|
abrdn Bloomberg All Commodity Strategy K-1 Free ETF | 4.2% |
|---|
Janus Henderson AAA CLO ETF | 1.1% |
|---|
|
| Material Fund Change [Text Block] |
No material changes occurred during the period ended May 31, 2026. |
| C000267451 |
|
| Shareholder Report [Line Items] |
|
| Fund Name |
Q3 All-Season Tactical Advantage ETF
|
| Trading Symbol |
QTAC
|
| Security Exchange Name |
CboeBZX
|
| Annual or Semi-Annual Statement [Text Block] |
This semi-annual shareholder report contains important information about Q3 All-Season Tactical Advantage ETF (the "Fund") for the period of December 15, 2025 to May 31, 2026.
|
| Additional Information [Text Block] |
You can find additional information about the Fund at https://www.q3allseasonfunds.com/etf-qtac/. You can also request this information by contacting us at (888) 348-1255.
|
| Additional Information Phone Number |
(888) 348-1255
|
| Additional Information Website |
<span style="font-weight: 700; box-sizing: border-box; color: rgb(0, 0, 0); display: inline; flex-wrap: nowrap; font-size: 12px; grid-area: auto; line-height: 18px; margin: 0px; overflow: visible; text-align: left; text-align-last: left; white-space-collapse: preserve-breaks;">https://www.q3allseasonfunds.com/etf-qtac/</span>
|
| Expenses [Text Block] |
What were the Fund’s annualized costs for the reporting period?(based on a hypothetical $10,000 investment)Table SummaryFund Name | Costs of a $10,000 investment | Costs paid as a percentage of a $10,000 investment |
|---|
Q3 All-Season Tactical Advantage ETF | $85 | 1.84% |
|---|
|
| Expenses Paid, Amount |
$ 85
|
| Expense Ratio, Percent |
1.84%
|
| Factors Affecting Performance [Text Block] |
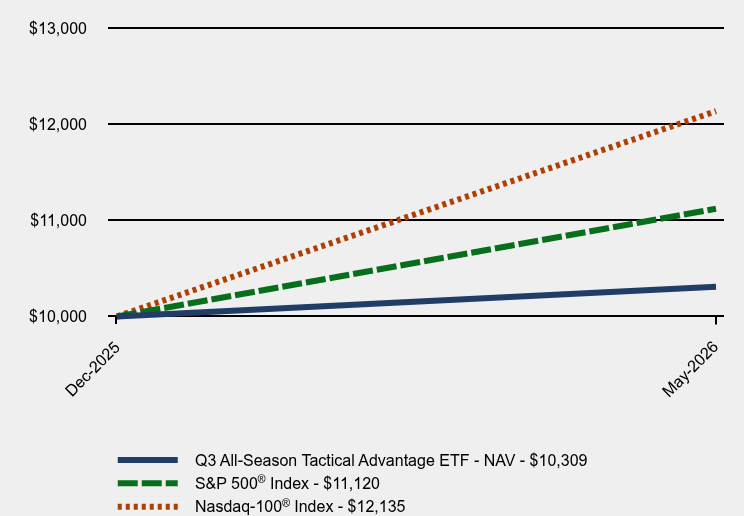
How did the Fund perform during the reporting period? For the six months ended May 31, 2026, performance for the Fund was primarily driven by its variable exposure to Nasdaq-100® Index instruments. The reporting period was characterized by a sharp divergence between a volatile first-quarter retreat and an extraordinary spring rally. Concerns over artificial intelligence (AI) capital expenditures, sticky inflation data, and rising Middle East tensions initially caused large-cap technology stocks to struggle, culminating in a sharp -5.8% drop for the Nasdaq-100® Index in March. Responding to this macro volatility, the Fund’s systematic, quantitative indicators defensively navigated the downturn, utilizing tactical shifts into money market and Treasury funds to mitigate downside pressure and stabilize the portfolio. As market conditions rapidly improved in April, the Index experienced a historic snapback, surging over 15% on the back of resilient economic growth and stellar technology earnings. The Fund’s quantitative models successfully captured this massive pivot, rotating back into full equity exposure to benefit handsomely from the broad tech sector expansion and AI-driven infrastructure momentum that propelled markets to all-time highs through the end of May. |
| Performance Past Does Not Indicate Future [Text] |
The Fund's past performance is not a good predictor of how the Fund will perform in the future.
|
| Line Graph [Table Text Block] |
Table Summary | Q3 All-Season Tactical Advantage ETF - NAV | S&P 500® Index | Nasdaq-100® Index |
|---|
Dec-2025 | $10,000 | $10,000 | $10,000 |
|---|
May-2026 | $10,309 | $11,120 | $12,135 |
|---|
|
| Average Annual Return [Table Text Block] |
Table Summary | Since Inception (December 15, 2025) |
|---|
Q3 All-Season Tactical Advantage ETF | 3.09% |
|---|
S&P 500® Index | 11.20% |
|---|
Nasdaq-100® Index
| 21.35% |
|---|
|
| Performance Inception Date |
Dec. 15, 2025
|
| No Deduction of Taxes [Text Block] |
The graph and table do not reflect the deduction of taxes that a shareholder would pay on fund distributions or redemption of fund shares.
|
| Updated Performance Information Location [Text Block] |
Call (888) 348-1255 or visit https://www.q3allseasonfunds.com/etf-qtac/ for updated performance information.
|
| AssetsNet |
$ 58,991,979
|
| Holdings Count | Holding |
2
|
| Advisory Fees Paid, Amount |
$ 285,294
|
| InvestmentCompanyPortfolioTurnover |
53.00%
|
| Additional Fund Statistics [Text Block] |
- Net Assets$58,991,979
- Number of Portfolio Holdings2
- Advisory Fee $285,294
- Portfolio Turnover53%
|
| Holdings [Text Block] |
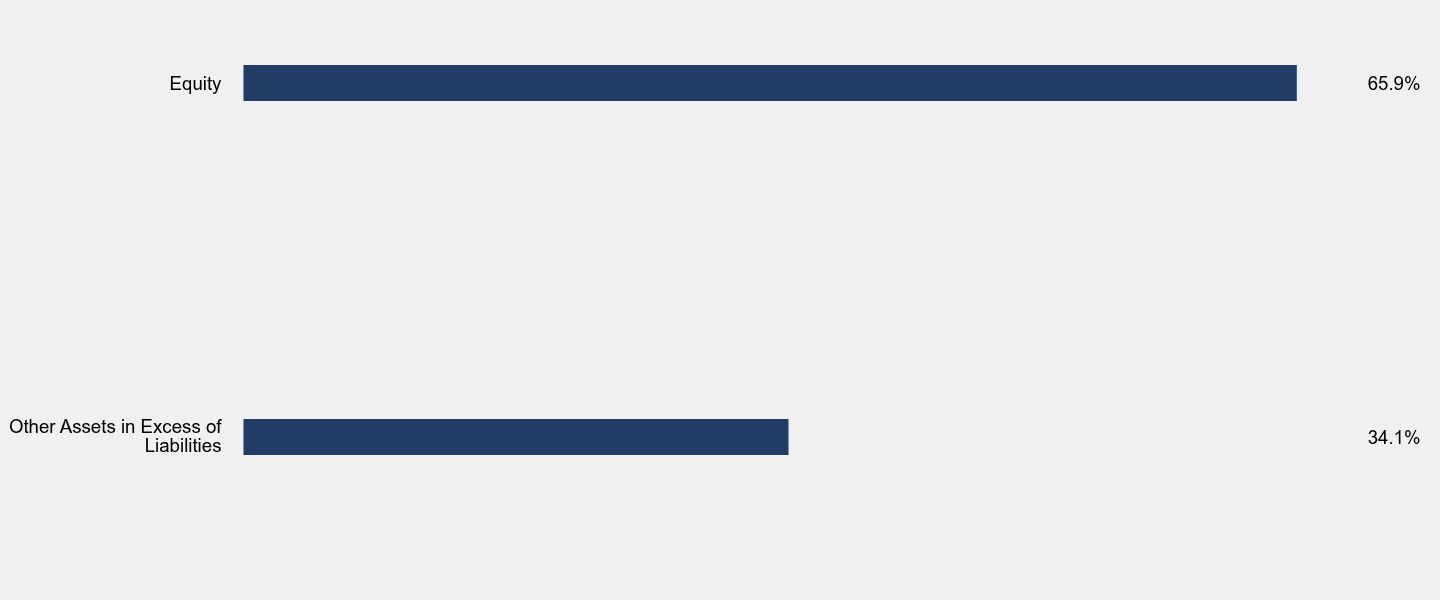
Sector Weighting (% of net assets)Table SummaryValue | Value |
|---|
Other Assets in Excess of Liabilities | 34.1% | Equity | 65.9% | |
| Material Fund Change [Text Block] |
No material changes occurred during the period ended May 31, 2026. |