Shareholder Report
|
|
12 Months Ended |
Jun. 01, 2025 |
May 31, 2026
USD ($)
Holding
|
| Shareholder Report [Line Items] |
|
|
| Document Type |
|
N-CSR
|
| Amendment Flag |
|
false
|
| Registrant Name |
|
DEUTSCHE DWS SECURITIES TRUST
|
| Entity Central Index Key |
|
0000088048
|
| Entity Investment Company Type |
|
N-1A
|
| Document Period End Date |
|
May 31, 2026
|
| Shareholder Report Annual or Semi-Annual |
|
Annual Shareholder Report
|
| C000016782 |
|
|
| Shareholder Report [Line Items] |
|
|
| Fund Name |
|
DWS Health and Wellness Fund
|
| Class Name |
|
Class A
|
| Trading Symbol |
|
SUHAX
|
| Annual or Semi-Annual Statement [Text Block] |
|
This annual shareholder report contains important information about DWS Health and Wellness Fund (the "Fund") for the period June 1, 2025 to May 31, 2026.
|
| Additional Information [Text Block] |
|
You can find additional information about the Fund on the Fund's website at dws.com/mutualreports. You can also request this information by contacting us at (800) 728-3337.
|
| Additional Information Phone Number |
|
(800) 728-3337
|
| Additional Information Website |
|
<span style="box-sizing: border-box; color: rgb(0, 0, 0); display: inline; flex-wrap: nowrap; font-size: 14.6667px; font-weight: 300; grid-area: auto; line-height: 17.6px; margin: 0px; overflow: visible; text-align: left; text-align-last: auto; white-space-collapse: preserve-breaks;">dws.com/mutualreports</span>
|
| Expenses [Text Block] |
|
What were the Fund costs for the last year?(Based on a hypothetical $10,000 investment) Table SummaryFund | Costs of a $10,000 investment | Costs paid as a percentage of a $10,000 investment |
|---|
Class A | $140 | 1.34% |
|---|
Gross expense ratio as of the latest prospectus: 1.35%. See prospectus for any contractual or voluntary waivers; without a waiver, costs would have been higher. |
| Expenses Paid, Amount |
|
$ 140
|
| Expense Ratio, Percent |
|
1.34%
|
| Factors Affecting Performance [Text Block] |
|
How did the Fund perform last year and what affected its performance? Class A shares of the Fund returned 9.65% (unadjusted for sales charges) for the period ended May 31, 2026. The Fund's broad-based index, the S&P 500® Index, returned 29.78% for the same period, while the Fund's additional, more narrowly based index, the MSCI World Health Care Index, returned 12.09%. The Fund’s underperformance relative to the MSCI World Health Care Index reflects the negative impact of sector allocation, most notably an overweight to health care equipment & supplies and an underweight to pharmaceuticals, which was only partially offset by positive stock selection overall. Positive contributions to relative performance in sector terms were led by stock selection within biotechnology, followed by selection within health care providers & services and life sciences tools & services. In terms of individual holdings, pharmaceutical company Eli Lilly & Co. (13.9%) outperformed on exceptional sales growth in its diabetes and obesity franchise brands Mounjaro and Zepbound, respectively, along with continued positive momentum with respect to its pipeline of drugs in development. Biotechnology company Insmed, Inc. (0.4%) also contributed positively. The stock rose sharply on optimism around FDA approval of brensocatib, the first targeted treatment proven to help manage bronchiectasis, the third most common chronic lung disease. In addition, the company’s broader drug pipeline continued to demonstrate progress. UnitedHealth Group, Inc. (5.7%) outperformed as the managed care provider has been more successful than its peers in mitigating the impact of elevated medical cost trends, leading the company to raise full-year 2026 earnings guidance. On the downside, in sector terms an overweight to and selection within health care equipment & supplies and an underweight to pharmaceuticals weighed most heavily on relative performance. In terms of individual holdings, shares of medical device company Boston Scientific Corp. (2.1%) declined on weaker guidance amid increased competition in the cardiac device market which has challenged its heart rhythm disorder franchises as well as its blockbuster Watchman stroke prevention implant. An underweight to Roche Holding AG (1.2%) detracted as well. While Roche has faced concerns around growth quality and reliance on legacy products, the stock is viewed as relatively defensive and held up better than most peers in the face of uncertainty around U.S. drug pricing policy and the U.S.-Iran conflict. Medical technology company Stryker Corp. (2.6%) detracted despite continued solid business fundamentals. The stock declined significantly in the wake of a cyber attack that disrupted the company’s manufacturing and billing systems, leading to a major revenue and earnings miss. Macro headwinds including higher interest rates and pressure on medical reimbursements also impacted sentiment around the broader sector. |
| Performance Past Does Not Indicate Future [Text] |
|
The Fund's past performance is not a good predictor or guarantee of the Fund's future performance.
|
| Line Graph [Table Text Block] |
|
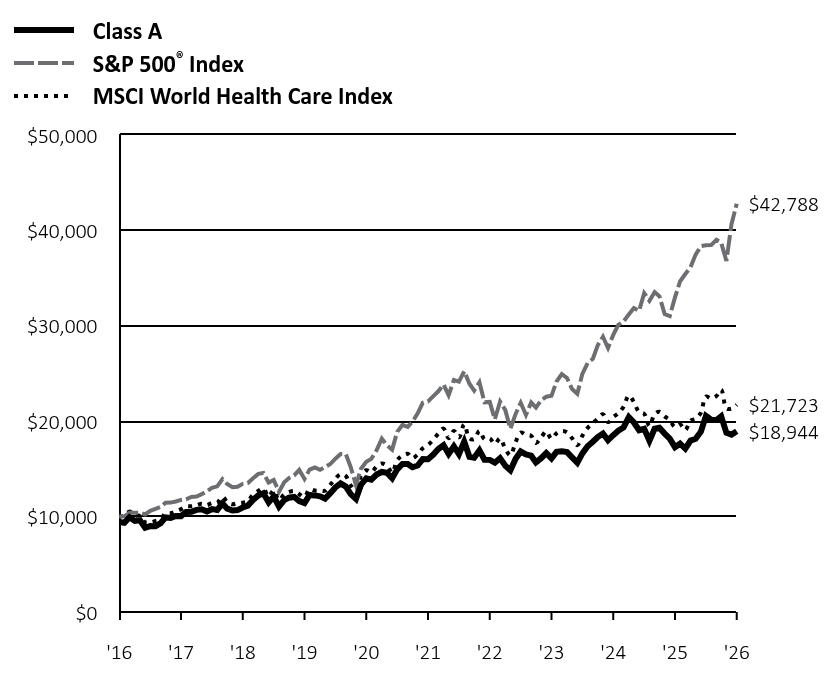 Table Summary | Class A | S&P 500® Index | MSCI World Health Care Index |
|---|
'16 | $9,425 | $10,000 | $10,000 |
|---|
'16 | $9,353 | $10,026 | $10,080 |
|---|
'16 | $9,928 | $10,396 | $10,538 |
|---|
'16 | $9,550 | $10,410 | $10,100 |
|---|
'16 | $9,617 | $10,412 | $10,087 |
|---|
'16 | $8,825 | $10,222 | $9,391 |
|---|
'16 | $9,000 | $10,601 | $9,399 |
|---|
'16 | $8,990 | $10,810 | $9,547 |
|---|
'17 | $9,312 | $11,015 | $9,755 |
|---|
'17 | $9,915 | $11,453 | $10,320 |
|---|
'17 | $9,866 | $11,466 | $10,353 |
|---|
'17 | $10,069 | $11,584 | $10,548 |
|---|
'17 | $10,049 | $11,747 | $10,778 |
|---|
'17 | $10,483 | $11,820 | $11,070 |
|---|
'17 | $10,512 | $12,063 | $11,079 |
|---|
'17 | $10,709 | $12,100 | $11,188 |
|---|
'17 | $10,772 | $12,350 | $11,338 |
|---|
'17 | $10,546 | $12,638 | $11,191 |
|---|
'17 | $10,780 | $13,026 | $11,445 |
|---|
'17 | $10,699 | $13,170 | $11,437 |
|---|
'18 | $11,378 | $13,924 | $12,078 |
|---|
'18 | $10,827 | $13,411 | $11,537 |
|---|
'18 | $10,638 | $13,070 | $11,297 |
|---|
'18 | $10,680 | $13,121 | $11,404 |
|---|
'18 | $10,954 | $13,437 | $11,458 |
|---|
'18 | $11,152 | $13,519 | $11,611 |
|---|
'18 | $11,746 | $14,022 | $12,324 |
|---|
'18 | $12,222 | $14,479 | $12,688 |
|---|
'18 | $12,444 | $14,562 | $12,945 |
|---|
'18 | $11,494 | $13,566 | $12,094 |
|---|
'18 | $12,106 | $13,843 | $12,753 |
|---|
'18 | $11,051 | $12,593 | $11,725 |
|---|
'19 | $11,733 | $13,602 | $12,328 |
|---|
'19 | $11,981 | $14,039 | $12,571 |
|---|
'19 | $12,055 | $14,312 | $12,679 |
|---|
'19 | $11,631 | $14,891 | $12,352 |
|---|
'19 | $11,417 | $13,945 | $12,056 |
|---|
'19 | $12,269 | $14,928 | $12,869 |
|---|
'19 | $12,222 | $15,142 | $12,726 |
|---|
'19 | $12,123 | $14,902 | $12,722 |
|---|
'19 | $11,886 | $15,181 | $12,709 |
|---|
'19 | $12,459 | $15,510 | $13,343 |
|---|
'19 | $13,060 | $16,073 | $13,974 |
|---|
'19 | $13,475 | $16,558 | $14,450 |
|---|
'20 | $13,148 | $16,552 | $14,244 |
|---|
'20 | $12,352 | $15,189 | $13,271 |
|---|
'20 | $11,845 | $13,313 | $12,791 |
|---|
'20 | $13,347 | $15,020 | $14,276 |
|---|
'20 | $14,005 | $15,735 | $14,852 |
|---|
'20 | $13,873 | $16,048 | $14,653 |
|---|
'20 | $14,410 | $16,953 | $15,254 |
|---|
'20 | $14,677 | $18,171 | $15,568 |
|---|
'20 | $14,595 | $17,481 | $15,354 |
|---|
'20 | $14,016 | $17,016 | $14,605 |
|---|
'20 | $14,951 | $18,879 | $15,912 |
|---|
'20 | $15,516 | $19,604 | $16,403 |
|---|
'21 | $15,512 | $19,407 | $16,578 |
|---|
'21 | $15,173 | $19,942 | $16,127 |
|---|
'21 | $15,355 | $20,815 | $16,522 |
|---|
'21 | $16,024 | $21,926 | $17,153 |
|---|
'21 | $16,003 | $22,079 | $17,505 |
|---|
'21 | $16,478 | $22,594 | $18,030 |
|---|
'21 | $17,086 | $23,131 | $18,701 |
|---|
'21 | $17,486 | $23,835 | $19,220 |
|---|
'21 | $16,565 | $22,726 | $18,212 |
|---|
'21 | $17,366 | $24,318 | $18,981 |
|---|
'21 | $16,553 | $24,150 | $18,303 |
|---|
'21 | $17,850 | $25,232 | $19,652 |
|---|
'22 | $16,263 | $23,926 | $18,200 |
|---|
'22 | $16,172 | $23,210 | $18,118 |
|---|
'22 | $16,945 | $24,072 | $18,991 |
|---|
'22 | $15,958 | $21,973 | $18,111 |
|---|
'22 | $15,944 | $22,013 | $18,201 |
|---|
'22 | $15,648 | $20,196 | $17,623 |
|---|
'22 | $16,126 | $22,058 | $18,199 |
|---|
'22 | $15,335 | $21,158 | $17,102 |
|---|
'22 | $14,861 | $19,210 | $16,429 |
|---|
'22 | $16,071 | $20,765 | $17,809 |
|---|
'22 | $16,822 | $21,925 | $18,810 |
|---|
'22 | $16,522 | $20,662 | $18,588 |
|---|
'23 | $16,383 | $21,961 | $18,467 |
|---|
'23 | $15,676 | $21,425 | $17,714 |
|---|
'23 | $16,124 | $22,211 | $18,290 |
|---|
'23 | $16,661 | $22,558 | $18,930 |
|---|
'23 | $16,101 | $22,656 | $18,155 |
|---|
'23 | $16,790 | $24,153 | $18,733 |
|---|
'23 | $16,850 | $24,929 | $18,975 |
|---|
'23 | $16,758 | $24,532 | $18,829 |
|---|
'23 | $16,212 | $23,362 | $18,216 |
|---|
'23 | $15,648 | $22,871 | $17,467 |
|---|
'23 | $16,624 | $24,960 | $18,469 |
|---|
'23 | $17,373 | $26,094 | $19,286 |
|---|
'24 | $17,848 | $26,532 | $19,804 |
|---|
'24 | $18,343 | $27,949 | $20,250 |
|---|
'24 | $18,711 | $28,848 | $20,727 |
|---|
'24 | $18,000 | $27,670 | $19,908 |
|---|
'24 | $18,534 | $29,042 | $20,439 |
|---|
'24 | $18,995 | $30,084 | $20,826 |
|---|
'24 | $19,342 | $30,450 | $21,507 |
|---|
'24 | $20,430 | $31,189 | $22,689 |
|---|
'24 | $19,862 | $31,855 | $22,012 |
|---|
'24 | $19,048 | $31,566 | $20,951 |
|---|
'24 | $19,191 | $33,419 | $20,768 |
|---|
'24 | $17,954 | $32,622 | $19,504 |
|---|
'25 | $19,215 | $33,531 | $20,751 |
|---|
'25 | $19,314 | $33,093 | $20,985 |
|---|
'25 | $18,700 | $31,229 | $20,498 |
|---|
'25 | $18,171 | $31,017 | $20,110 |
|---|
'25 | $17,276 | $32,969 | $19,379 |
|---|
'25 | $17,642 | $34,646 | $19,660 |
|---|
'25 | $17,128 | $35,424 | $19,076 |
|---|
'25 | $17,969 | $36,142 | $20,057 |
|---|
'25 | $18,161 | $37,461 | $20,251 |
|---|
'25 | $18,898 | $38,338 | $20,879 |
|---|
'25 | $20,564 | $38,432 | $22,575 |
|---|
'25 | $20,161 | $38,455 | $22,396 |
|---|
'26 | $20,119 | $39,013 | $22,642 |
|---|
'26 | $20,516 | $38,716 | $23,296 |
|---|
'26 | $18,782 | $36,789 | $21,366 |
|---|
'26 | $18,589 | $40,649 | $21,315 |
|---|
'26 | $18,944 | $42,788 | $21,723 |
|---|
|
| Average Annual Return [Table Text Block] |
|
Table SummaryClass/Index
| 1-Year | 5-Year | 10-Year |
|---|
Class A Unadjusted for Sales Charge | 9.65% | 3.43% | 7.23% |
|---|
Class A Adjusted for the Maximum Sales Charge (max 5.75% load) | 3.35% | 2.21% | 6.60% |
|---|
S&P 500® Index | 29.78% | 14.15% | 15.65% |
|---|
MSCI World Health Care Index | 12.09% | 4.41% | 8.07% |
|---|
|
| No Deduction of Taxes [Text Block] |
|
The performance graph and returns table do not reflect the deduction of taxes that a shareholder would pay on Fund distributions or the redemption of Fund shares.
|
| AssetsNet |
|
$ 231,669,035
|
| Holdings Count | Holding |
|
65
|
| Advisory Fees Paid, Amount |
|
$ 1,894,679
|
| InvestmentCompanyPortfolioTurnover |
|
2.00%
|
| Additional Fund Statistics [Text Block] |
|
Table SummaryNet Assets ($) | 231,669,035 |
|---|
Number of Portfolio Holdings | 65 |
|---|
Portfolio Turnover Rate (%) | 2 |
|---|
Total Net Advisory Fees Paid ($) | 1,894,679 |
|---|
|
| Holdings [Text Block] |
|
Table SummaryAsset Type | % of Net Assets |
|---|
Common Stocks | 100% |
|---|
Cash Equivalents | 0% |
|---|
Rights | 0% |
|---|
Other Assets and Liabilities, Net | 0% |
|---|
Total | 100% |
|---|
Table SummarySector | % of Net Assets |
|---|
Pharmaceuticals | 39% |
|---|
Biotechnology | 20% |
|---|
Health Care Equipment | 16% |
|---|
Life Sciences Tools & Services | 10% |
|---|
Managed Health Care | 7% |
|---|
Health Care Distributors | 5% |
|---|
Health Care Services | 1% |
|---|
Health Care Supplies | 1% |
|---|
Health Care Technology | 0% |
|---|
Ten Largest Equity HoldingsTable SummaryHoldings | 51.5% of Net Assets |
|---|
Eli Lilly & Co. | 13.9% | Johnson & Johnson | 6.2% | UnitedHealth Group, Inc. | 5.7% | AbbVie, Inc. | 4.9% | Merck & Co., Inc. | 4.9% | AstraZeneca PLC | 3.8% | Thermo Fisher Scientific, Inc. | 3.5% | Novartis AG | 2.9% | Amgen, Inc. | 2.9% | Gilead Sciences, Inc. | 2.8% | |
| Material Fund Change [Text Block] |
|
|
| C000016785 |
|
|
| Shareholder Report [Line Items] |
|
|
| Fund Name |
|
DWS Health and Wellness Fund
|
| Class Name |
|
Class C
|
| Trading Symbol |
|
SUHCX
|
| Annual or Semi-Annual Statement [Text Block] |
|
This annual shareholder report contains important information about DWS Health and Wellness Fund (the "Fund") for the period June 1, 2025 to May 31, 2026.
|
| Additional Information [Text Block] |
|
You can find additional information about the Fund on the Fund's website at dws.com/mutualreports. You can also request this information by contacting us at (800) 728-3337.
|
| Additional Information Phone Number |
|
(800) 728-3337
|
| Additional Information Website |
|
<span style="box-sizing: border-box; color: rgb(0, 0, 0); display: inline; flex-wrap: nowrap; font-size: 14.6667px; font-weight: 300; grid-area: auto; line-height: 17.6px; margin: 0px; overflow: visible; text-align: left; text-align-last: auto; white-space-collapse: preserve-breaks;">dws.com/mutualreports</span>
|
| Expenses [Text Block] |
|
What were the Fund costs for the last year?(Based on a hypothetical $10,000 investment) Table SummaryFund | Costs of a $10,000 investment | Costs paid as a percentage of a $10,000 investment |
|---|
Class C | $218 | 2.09% |
|---|
Gross expense ratio as of the latest prospectus: 2.17%. See prospectus for any contractual or voluntary waivers; without a waiver, costs would have been higher. |
| Expenses Paid, Amount |
|
$ 218
|
| Expense Ratio, Percent |
|
2.09%
|
| Factors Affecting Performance [Text Block] |
|
How did the Fund perform last year and what affected its performance? Class C shares of the Fund returned 8.81% (unadjusted for sales charges) for the period ended May 31, 2026. The Fund's broad-based index, the S&P 500® Index, returned 29.78% for the same period, while the Fund's additional, more narrowly based index, the MSCI World Health Care Index, returned 12.09%. The Fund’s underperformance relative to the MSCI World Health Care Index reflects the negative impact of sector allocation, most notably an overweight to health care equipment & supplies and an underweight to pharmaceuticals, which was only partially offset by positive stock selection overall. Positive contributions to relative performance in sector terms were led by stock selection within biotechnology, followed by selection within health care providers & services and life sciences tools & services. In terms of individual holdings, pharmaceutical company Eli Lilly & Co. (13.9%) outperformed on exceptional sales growth in its diabetes and obesity franchise brands Mounjaro and Zepbound, respectively, along with continued positive momentum with respect to its pipeline of drugs in development. Biotechnology company Insmed, Inc. (0.4%) also contributed positively. The stock rose sharply on optimism around FDA approval of brensocatib, the first targeted treatment proven to help manage bronchiectasis, the third most common chronic lung disease. In addition, the company’s broader drug pipeline continued to demonstrate progress. UnitedHealth Group, Inc. (5.7%) outperformed as the managed care provider has been more successful than its peers in mitigating the impact of elevated medical cost trends, leading the company to raise full-year 2026 earnings guidance. On the downside, in sector terms an overweight to and selection within health care equipment & supplies and an underweight to pharmaceuticals weighed most heavily on relative performance. In terms of individual holdings, shares of medical device company Boston Scientific Corp. (2.1%) declined on weaker guidance amid increased competition in the cardiac device market which has challenged its heart rhythm disorder franchises as well as its blockbuster Watchman stroke prevention implant. An underweight to Roche Holding AG (1.2%) detracted as well. While Roche has faced concerns around growth quality and reliance on legacy products, the stock is viewed as relatively defensive and held up better than most peers in the face of uncertainty around U.S. drug pricing policy and the U.S.-Iran conflict. Medical technology company Stryker Corp. (2.6%) detracted despite continued solid business fundamentals. The stock declined significantly in the wake of a cyber attack that disrupted the company’s manufacturing and billing systems, leading to a major revenue and earnings miss. Macro headwinds including higher interest rates and pressure on medical reimbursements also impacted sentiment around the broader sector. |
| Performance Past Does Not Indicate Future [Text] |
|
The Fund's past performance is not a good predictor or guarantee of the Fund's future performance.
|
| Line Graph [Table Text Block] |
|
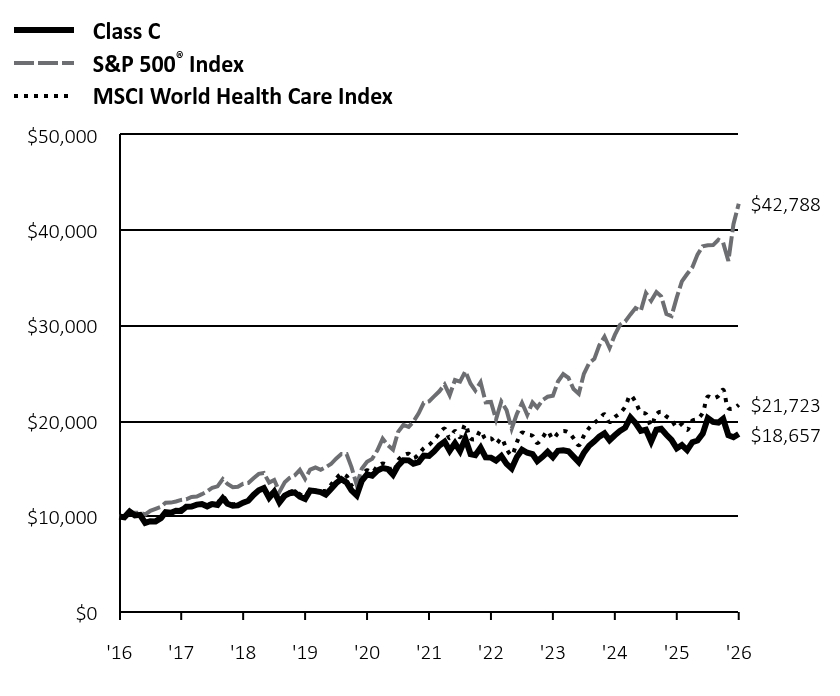 Table Summary | Class C | S&P 500® Index | MSCI World Health Care Index |
|---|
'16 | $10,000 | $10,000 | $10,000 |
|---|
'16 | $9,917 | $10,026 | $10,080 |
|---|
'16 | $10,522 | $10,396 | $10,538 |
|---|
'16 | $10,116 | $10,410 | $10,100 |
|---|
'16 | $10,181 | $10,412 | $10,087 |
|---|
'16 | $9,333 | $10,222 | $9,391 |
|---|
'16 | $9,514 | $10,601 | $9,399 |
|---|
'16 | $9,496 | $10,810 | $9,547 |
|---|
'17 | $9,833 | $11,015 | $9,755 |
|---|
'17 | $10,462 | $11,453 | $10,320 |
|---|
'17 | $10,406 | $11,466 | $10,353 |
|---|
'17 | $10,612 | $11,584 | $10,548 |
|---|
'17 | $10,582 | $11,747 | $10,778 |
|---|
'17 | $11,035 | $11,820 | $11,070 |
|---|
'17 | $11,058 | $12,063 | $11,079 |
|---|
'17 | $11,256 | $12,100 | $11,188 |
|---|
'17 | $11,316 | $12,350 | $11,338 |
|---|
'17 | $11,073 | $12,638 | $11,191 |
|---|
'17 | $11,312 | $13,026 | $11,445 |
|---|
'17 | $11,220 | $13,170 | $11,437 |
|---|
'18 | $11,923 | $13,924 | $12,078 |
|---|
'18 | $11,342 | $13,411 | $11,537 |
|---|
'18 | $11,135 | $13,070 | $11,297 |
|---|
'18 | $11,175 | $13,121 | $11,404 |
|---|
'18 | $11,456 | $13,437 | $11,458 |
|---|
'18 | $11,655 | $13,519 | $11,611 |
|---|
'18 | $12,269 | $14,022 | $12,324 |
|---|
'18 | $12,756 | $14,479 | $12,688 |
|---|
'18 | $12,980 | $14,562 | $12,945 |
|---|
'18 | $11,980 | $13,566 | $12,094 |
|---|
'18 | $12,606 | $13,843 | $12,753 |
|---|
'18 | $11,498 | $12,593 | $11,725 |
|---|
'19 | $12,204 | $13,602 | $12,328 |
|---|
'19 | $12,452 | $14,039 | $12,571 |
|---|
'19 | $12,523 | $14,312 | $12,679 |
|---|
'19 | $12,078 | $14,891 | $12,352 |
|---|
'19 | $11,849 | $13,945 | $12,056 |
|---|
'19 | $12,728 | $14,928 | $12,869 |
|---|
'19 | $12,668 | $15,142 | $12,726 |
|---|
'19 | $12,560 | $14,902 | $12,722 |
|---|
'19 | $12,307 | $15,181 | $12,709 |
|---|
'19 | $12,888 | $15,510 | $13,343 |
|---|
'19 | $13,501 | $16,073 | $13,974 |
|---|
'19 | $13,923 | $16,558 | $14,450 |
|---|
'20 | $13,580 | $16,552 | $14,244 |
|---|
'20 | $12,749 | $15,189 | $13,271 |
|---|
'20 | $12,218 | $13,313 | $12,791 |
|---|
'20 | $13,757 | $15,020 | $14,276 |
|---|
'20 | $14,427 | $15,735 | $14,852 |
|---|
'20 | $14,282 | $16,048 | $14,653 |
|---|
'20 | $14,824 | $16,953 | $15,254 |
|---|
'20 | $15,092 | $18,171 | $15,568 |
|---|
'20 | $14,995 | $17,481 | $15,354 |
|---|
'20 | $14,389 | $17,016 | $14,605 |
|---|
'20 | $15,344 | $18,879 | $15,912 |
|---|
'20 | $15,913 | $19,604 | $16,403 |
|---|
'21 | $15,894 | $19,407 | $16,578 |
|---|
'21 | $15,544 | $19,942 | $16,127 |
|---|
'21 | $15,716 | $20,815 | $16,522 |
|---|
'21 | $16,391 | $21,926 | $17,153 |
|---|
'21 | $16,360 | $22,079 | $17,505 |
|---|
'21 | $16,833 | $22,594 | $18,030 |
|---|
'21 | $17,446 | $23,131 | $18,701 |
|---|
'21 | $17,845 | $23,835 | $19,220 |
|---|
'21 | $16,894 | $22,726 | $18,212 |
|---|
'21 | $17,698 | $24,318 | $18,981 |
|---|
'21 | $16,857 | $24,150 | $18,303 |
|---|
'21 | $18,170 | $25,232 | $19,652 |
|---|
'22 | $16,541 | $23,926 | $18,200 |
|---|
'22 | $16,442 | $23,210 | $18,118 |
|---|
'22 | $17,214 | $24,072 | $18,991 |
|---|
'22 | $16,201 | $21,973 | $18,111 |
|---|
'22 | $16,180 | $22,013 | $18,201 |
|---|
'22 | $15,875 | $20,196 | $17,623 |
|---|
'22 | $16,343 | $22,058 | $18,199 |
|---|
'22 | $15,528 | $21,158 | $17,102 |
|---|
'22 | $15,039 | $19,210 | $16,429 |
|---|
'22 | $16,258 | $20,765 | $17,809 |
|---|
'22 | $17,008 | $21,925 | $18,810 |
|---|
'22 | $16,689 | $20,662 | $18,588 |
|---|
'23 | $16,544 | $21,961 | $18,467 |
|---|
'23 | $15,819 | $21,425 | $17,714 |
|---|
'23 | $16,261 | $22,211 | $18,290 |
|---|
'23 | $16,790 | $22,558 | $18,930 |
|---|
'23 | $16,218 | $22,656 | $18,155 |
|---|
'23 | $16,899 | $24,153 | $18,733 |
|---|
'23 | $16,950 | $24,929 | $18,975 |
|---|
'23 | $16,848 | $24,532 | $18,829 |
|---|
'23 | $16,290 | $23,362 | $18,216 |
|---|
'23 | $15,711 | $22,871 | $17,467 |
|---|
'23 | $16,682 | $24,960 | $18,469 |
|---|
'23 | $17,421 | $26,094 | $19,286 |
|---|
'24 | $17,890 | $26,532 | $19,804 |
|---|
'24 | $18,375 | $27,949 | $20,250 |
|---|
'24 | $18,724 | $28,848 | $20,727 |
|---|
'24 | $18,009 | $27,670 | $19,908 |
|---|
'24 | $18,526 | $29,042 | $20,439 |
|---|
'24 | $18,979 | $30,084 | $20,826 |
|---|
'24 | $19,312 | $30,450 | $21,507 |
|---|
'24 | $20,385 | $31,189 | $22,689 |
|---|
'24 | $19,805 | $31,855 | $22,012 |
|---|
'24 | $18,986 | $31,566 | $20,951 |
|---|
'24 | $19,114 | $33,419 | $20,768 |
|---|
'24 | $17,870 | $32,622 | $19,504 |
|---|
'25 | $19,115 | $33,531 | $20,751 |
|---|
'25 | $19,196 | $33,093 | $20,985 |
|---|
'25 | $18,577 | $31,229 | $20,498 |
|---|
'25 | $18,039 | $31,017 | $20,110 |
|---|
'25 | $17,147 | $32,969 | $19,379 |
|---|
'25 | $17,492 | $34,646 | $19,660 |
|---|
'25 | $16,970 | $35,424 | $19,076 |
|---|
'25 | $17,798 | $36,142 | $20,057 |
|---|
'25 | $17,974 | $37,461 | $20,251 |
|---|
'25 | $18,689 | $38,338 | $20,879 |
|---|
'25 | $20,329 | $38,432 | $22,575 |
|---|
'25 | $19,922 | $38,455 | $22,396 |
|---|
'26 | $19,860 | $39,013 | $22,642 |
|---|
'26 | $20,247 | $38,716 | $23,296 |
|---|
'26 | $18,525 | $36,789 | $21,366 |
|---|
'26 | $18,314 | $40,649 | $21,315 |
|---|
'26 | $18,657 | $42,788 | $21,723 |
|---|
|
| Average Annual Return [Table Text Block] |
|
Table SummaryClass/Index
| 1-Year | 5-Year | 10-Year |
|---|
Class C Unadjusted for Sales Charge | 8.81% | 2.66% | 6.43% |
|---|
Class C Adjusted for the Maximum Sales Charge (max 1.00% CDSC) | 7.81% | 2.66% | 6.43% |
|---|
S&P 500® Index | 29.78% | 14.15% | 15.65% |
|---|
MSCI World Health Care Index | 12.09% | 4.41% | 8.07% |
|---|
|
| No Deduction of Taxes [Text Block] |
|
The performance graph and returns table do not reflect the deduction of taxes that a shareholder would pay on Fund distributions or the redemption of Fund shares.
|
| AssetsNet |
|
$ 231,669,035
|
| Holdings Count | Holding |
|
65
|
| Advisory Fees Paid, Amount |
|
$ 1,894,679
|
| InvestmentCompanyPortfolioTurnover |
|
2.00%
|
| Additional Fund Statistics [Text Block] |
|
Table SummaryNet Assets ($) | 231,669,035 |
|---|
Number of Portfolio Holdings | 65 |
|---|
Portfolio Turnover Rate (%) | 2 |
|---|
Total Net Advisory Fees Paid ($) | 1,894,679 |
|---|
|
| Holdings [Text Block] |
|
Table SummaryAsset Type | % of Net Assets |
|---|
Common Stocks | 100% |
|---|
Cash Equivalents | 0% |
|---|
Rights | 0% |
|---|
Other Assets and Liabilities, Net | 0% |
|---|
Total | 100% |
|---|
Table SummarySector | % of Net Assets |
|---|
Pharmaceuticals | 39% |
|---|
Biotechnology | 20% |
|---|
Health Care Equipment | 16% |
|---|
Life Sciences Tools & Services | 10% |
|---|
Managed Health Care | 7% |
|---|
Health Care Distributors | 5% |
|---|
Health Care Services | 1% |
|---|
Health Care Supplies | 1% |
|---|
Health Care Technology | 0% |
|---|
Ten Largest Equity HoldingsTable SummaryHoldings | 51.5% of Net Assets |
|---|
Eli Lilly & Co. | 13.9% | Johnson & Johnson | 6.2% | UnitedHealth Group, Inc. | 5.7% | AbbVie, Inc. | 4.9% | Merck & Co., Inc. | 4.9% | AstraZeneca PLC | 3.8% | Thermo Fisher Scientific, Inc. | 3.5% | Novartis AG | 2.9% | Amgen, Inc. | 2.9% | Gilead Sciences, Inc. | 2.8% | |
| Material Fund Change [Text Block] |
|
|
| C000016786 |
|
|
| Shareholder Report [Line Items] |
|
|
| Fund Name |
|
DWS Health and Wellness Fund
|
| Class Name |
|
Class S
|
| Trading Symbol |
|
SCHLX
|
| Annual or Semi-Annual Statement [Text Block] |
|
This annual shareholder report contains important information about DWS Health and Wellness Fund (the "Fund") for the period June 1, 2025 to May 31, 2026.
|
| Additional Information [Text Block] |
|
You can find additional information about the Fund on the Fund's website at dws.com/mutualreports. You can also request this information by contacting us at (800) 728-3337.
|
| Additional Information Phone Number |
|
(800) 728-3337
|
| Additional Information Website |
|
<span style="box-sizing: border-box; color: rgb(0, 0, 0); display: inline; flex-wrap: nowrap; font-size: 14.6667px; font-weight: 300; grid-area: auto; line-height: 17.6px; margin: 0px; overflow: visible; text-align: left; text-align-last: auto; white-space-collapse: preserve-breaks;">dws.com/mutualreports</span>
|
| Expenses [Text Block] |
|
What were the Fund costs for the last year?(Based on a hypothetical $10,000 investment) Table SummaryFund | Costs of a $10,000 investment | Costs paid as a percentage of a $10,000 investment |
|---|
Class S | $111 | 1.06% |
|---|
Gross expense ratio as of the latest prospectus: 1.07%. See prospectus for any contractual or voluntary waivers; without a waiver, costs would have been higher. |
| Expenses Paid, Amount |
|
$ 111
|
| Expense Ratio, Percent |
|
1.06%
|
| Factors Affecting Performance [Text Block] |
|
How did the Fund perform last year and what affected its performance? Class S shares of the Fund returned 9.94% for the period ended May 31, 2026. The Fund's broad-based index, the S&P 500® Index, returned 29.78% for the same period, while the Fund's additional, more narrowly based index, the MSCI World Health Care Index, returned 12.09%. The Fund’s underperformance relative to the MSCI World Health Care Index reflects the negative impact of sector allocation, most notably an overweight to health care equipment & supplies and an underweight to pharmaceuticals, which was only partially offset by positive stock selection overall. Positive contributions to relative performance in sector terms were led by stock selection within biotechnology, followed by selection within health care providers & services and life sciences tools & services. In terms of individual holdings, pharmaceutical company Eli Lilly & Co. (13.9%) outperformed on exceptional sales growth in its diabetes and obesity franchise brands Mounjaro and Zepbound, respectively, along with continued positive momentum with respect to its pipeline of drugs in development. Biotechnology company Insmed, Inc. (0.4%) also contributed positively. The stock rose sharply on optimism around FDA approval of brensocatib, the first targeted treatment proven to help manage bronchiectasis, the third most common chronic lung disease. In addition, the company’s broader drug pipeline continued to demonstrate progress. UnitedHealth Group, Inc. (5.7%) outperformed as the managed care provider has been more successful than its peers in mitigating the impact of elevated medical cost trends, leading the company to raise full-year 2026 earnings guidance. On the downside, in sector terms an overweight to and selection within health care equipment & supplies and an underweight to pharmaceuticals weighed most heavily on relative performance. In terms of individual holdings, shares of medical device company Boston Scientific Corp. (2.1%) declined on weaker guidance amid increased competition in the cardiac device market which has challenged its heart rhythm disorder franchises as well as its blockbuster Watchman stroke prevention implant. An underweight to Roche Holding AG (1.2%) detracted as well. While Roche has faced concerns around growth quality and reliance on legacy products, the stock is viewed as relatively defensive and held up better than most peers in the face of uncertainty around U.S. drug pricing policy and the U.S.-Iran conflict. Medical technology company Stryker Corp. (2.6%) detracted despite continued solid business fundamentals. The stock declined significantly in the wake of a cyber attack that disrupted the company’s manufacturing and billing systems, leading to a major revenue and earnings miss. Macro headwinds including higher interest rates and pressure on medical reimbursements also impacted sentiment around the broader sector. |
| Performance Past Does Not Indicate Future [Text] |
|
The Fund's past performance is not a good predictor or guarantee of the Fund's future performance.
|
| Line Graph [Table Text Block] |
|
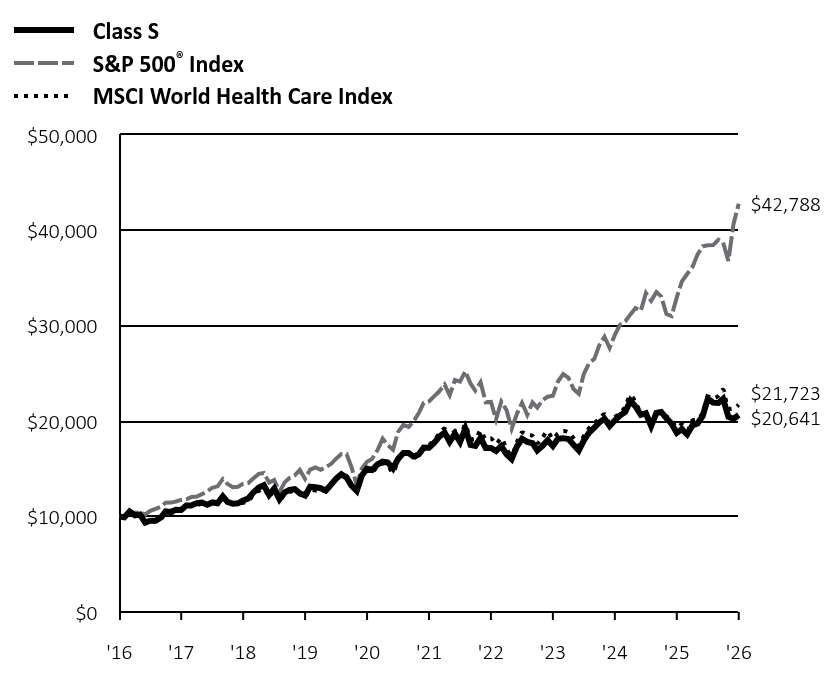 Table Summary | Class S | S&P 500® Index | MSCI World Health Care Index |
|---|
'16 | $10,000 | $10,000 | $10,000 |
|---|
'16 | $9,928 | $10,026 | $10,080 |
|---|
'16 | $10,540 | $10,396 | $10,538 |
|---|
'16 | $10,141 | $10,410 | $10,100 |
|---|
'16 | $10,216 | $10,412 | $10,087 |
|---|
'16 | $9,374 | $10,222 | $9,391 |
|---|
'16 | $9,562 | $10,601 | $9,399 |
|---|
'16 | $9,554 | $10,810 | $9,547 |
|---|
'17 | $9,901 | $11,015 | $9,755 |
|---|
'17 | $10,542 | $11,453 | $10,320 |
|---|
'17 | $10,494 | $11,466 | $10,353 |
|---|
'17 | $10,710 | $11,584 | $10,548 |
|---|
'17 | $10,690 | $11,747 | $10,778 |
|---|
'17 | $11,158 | $11,820 | $11,070 |
|---|
'17 | $11,189 | $12,063 | $11,079 |
|---|
'17 | $11,400 | $12,100 | $11,188 |
|---|
'17 | $11,471 | $12,350 | $11,338 |
|---|
'17 | $11,235 | $12,638 | $11,191 |
|---|
'17 | $11,482 | $13,026 | $11,445 |
|---|
'17 | $11,402 | $13,170 | $11,437 |
|---|
'18 | $12,127 | $13,924 | $12,078 |
|---|
'18 | $11,541 | $13,411 | $11,537 |
|---|
'18 | $11,338 | $13,070 | $11,297 |
|---|
'18 | $11,390 | $13,121 | $11,404 |
|---|
'18 | $11,687 | $13,437 | $11,458 |
|---|
'18 | $11,899 | $13,519 | $11,611 |
|---|
'18 | $12,536 | $14,022 | $12,324 |
|---|
'18 | $13,046 | $14,479 | $12,688 |
|---|
'18 | $13,288 | $14,562 | $12,945 |
|---|
'18 | $12,275 | $13,566 | $12,094 |
|---|
'18 | $12,930 | $13,843 | $12,753 |
|---|
'18 | $11,803 | $12,593 | $11,725 |
|---|
'19 | $12,533 | $13,602 | $12,328 |
|---|
'19 | $12,802 | $14,039 | $12,571 |
|---|
'19 | $12,886 | $14,312 | $12,679 |
|---|
'19 | $12,439 | $14,891 | $12,352 |
|---|
'19 | $12,210 | $13,945 | $12,056 |
|---|
'19 | $13,124 | $14,928 | $12,869 |
|---|
'19 | $13,074 | $15,142 | $12,726 |
|---|
'19 | $12,977 | $14,902 | $12,722 |
|---|
'19 | $12,724 | $15,181 | $12,709 |
|---|
'19 | $13,340 | $15,510 | $13,343 |
|---|
'19 | $13,985 | $16,073 | $13,974 |
|---|
'19 | $14,436 | $16,558 | $14,450 |
|---|
'20 | $14,088 | $16,552 | $14,244 |
|---|
'20 | $13,240 | $15,189 | $13,271 |
|---|
'20 | $12,696 | $13,313 | $12,791 |
|---|
'20 | $14,310 | $15,020 | $14,276 |
|---|
'20 | $15,017 | $15,735 | $14,852 |
|---|
'20 | $14,880 | $16,048 | $14,653 |
|---|
'20 | $15,461 | $16,953 | $15,254 |
|---|
'20 | $15,750 | $18,171 | $15,568 |
|---|
'20 | $15,665 | $17,481 | $15,354 |
|---|
'20 | $15,047 | $17,016 | $14,605 |
|---|
'20 | $16,057 | $18,879 | $15,912 |
|---|
'20 | $16,664 | $19,604 | $16,403 |
|---|
'21 | $16,664 | $19,407 | $16,578 |
|---|
'21 | $16,304 | $19,942 | $16,127 |
|---|
'21 | $16,498 | $20,815 | $16,522 |
|---|
'21 | $17,223 | $21,926 | $17,153 |
|---|
'21 | $17,206 | $22,079 | $17,505 |
|---|
'21 | $17,716 | $22,594 | $18,030 |
|---|
'21 | $18,376 | $23,131 | $18,701 |
|---|
'21 | $18,810 | $23,835 | $19,220 |
|---|
'21 | $17,826 | $22,726 | $18,212 |
|---|
'21 | $18,692 | $24,318 | $18,981 |
|---|
'21 | $17,818 | $24,150 | $18,303 |
|---|
'21 | $19,221 | $25,232 | $19,652 |
|---|
'22 | $17,516 | $23,926 | $18,200 |
|---|
'22 | $17,418 | $23,210 | $18,118 |
|---|
'22 | $18,255 | $24,072 | $18,991 |
|---|
'22 | $17,197 | $21,973 | $18,111 |
|---|
'22 | $17,188 | $22,013 | $18,201 |
|---|
'22 | $16,874 | $20,196 | $17,623 |
|---|
'22 | $17,387 | $22,058 | $18,199 |
|---|
'22 | $16,537 | $21,158 | $17,102 |
|---|
'22 | $16,032 | $19,210 | $16,429 |
|---|
'22 | $17,343 | $20,765 | $17,809 |
|---|
'22 | $18,158 | $21,925 | $18,810 |
|---|
'22 | $17,833 | $20,662 | $18,588 |
|---|
'23 | $17,689 | $21,961 | $18,467 |
|---|
'23 | $16,932 | $21,425 | $17,714 |
|---|
'23 | $17,418 | $22,211 | $18,290 |
|---|
'23 | $18,004 | $22,558 | $18,930 |
|---|
'23 | $17,400 | $22,656 | $18,155 |
|---|
'23 | $18,148 | $24,153 | $18,733 |
|---|
'23 | $18,220 | $24,929 | $18,975 |
|---|
'23 | $18,126 | $24,532 | $18,829 |
|---|
'23 | $17,535 | $23,362 | $18,216 |
|---|
'23 | $16,927 | $22,871 | $17,467 |
|---|
'23 | $17,991 | $24,960 | $18,469 |
|---|
'23 | $18,803 | $26,094 | $19,286 |
|---|
'24 | $19,325 | $26,532 | $19,804 |
|---|
'24 | $19,866 | $27,949 | $20,250 |
|---|
'24 | $20,264 | $28,848 | $20,727 |
|---|
'24 | $19,500 | $27,670 | $19,908 |
|---|
'24 | $20,084 | $29,042 | $20,439 |
|---|
'24 | $20,592 | $30,084 | $20,826 |
|---|
'24 | $20,967 | $30,450 | $21,507 |
|---|
'24 | $22,153 | $31,189 | $22,689 |
|---|
'24 | $21,541 | $31,855 | $22,012 |
|---|
'24 | $20,668 | $31,566 | $20,951 |
|---|
'24 | $20,829 | $33,419 | $20,768 |
|---|
'24 | $19,485 | $32,622 | $19,504 |
|---|
'25 | $20,863 | $33,531 | $20,751 |
|---|
'25 | $20,968 | $33,093 | $20,985 |
|---|
'25 | $20,311 | $31,229 | $20,498 |
|---|
'25 | $19,739 | $31,017 | $20,110 |
|---|
'25 | $18,774 | $32,969 | $19,379 |
|---|
'25 | $19,173 | $34,646 | $19,660 |
|---|
'25 | $18,621 | $35,424 | $19,076 |
|---|
'25 | $19,543 | $36,142 | $20,057 |
|---|
'25 | $19,754 | $37,461 | $20,251 |
|---|
'25 | $20,560 | $38,338 | $20,879 |
|---|
'25 | $22,375 | $38,432 | $22,575 |
|---|
'25 | $21,945 | $38,455 | $22,396 |
|---|
'26 | $21,904 | $39,013 | $22,642 |
|---|
'26 | $22,339 | $38,716 | $23,296 |
|---|
'26 | $20,459 | $36,789 | $21,366 |
|---|
'26 | $20,252 | $40,649 | $21,315 |
|---|
'26 | $20,641 | $42,788 | $21,723 |
|---|
|
| Average Annual Return [Table Text Block] |
|
Table SummaryClass/Index
| 1-Year | 5-Year | 10-Year |
|---|
Class S No Sales Charge | 9.94% | 3.71% | 7.52% |
|---|
S&P 500® Index | 29.78% | 14.15% | 15.65% |
|---|
MSCI World Health Care Index | 12.09% | 4.41% | 8.07% |
|---|
|
| No Deduction of Taxes [Text Block] |
|
The performance graph and returns table do not reflect the deduction of taxes that a shareholder would pay on Fund distributions or the redemption of Fund shares.
|
| AssetsNet |
|
$ 231,669,035
|
| Holdings Count | Holding |
|
65
|
| Advisory Fees Paid, Amount |
|
$ 1,894,679
|
| InvestmentCompanyPortfolioTurnover |
|
2.00%
|
| Additional Fund Statistics [Text Block] |
|
Table SummaryNet Assets ($) | 231,669,035 |
|---|
Number of Portfolio Holdings | 65 |
|---|
Portfolio Turnover Rate (%) | 2 |
|---|
Total Net Advisory Fees Paid ($) | 1,894,679 |
|---|
|
| Holdings [Text Block] |
|
Table SummaryAsset Type | % of Net Assets |
|---|
Common Stocks | 100% |
|---|
Cash Equivalents | 0% |
|---|
Rights | 0% |
|---|
Other Assets and Liabilities, Net | 0% |
|---|
Total | 100% |
|---|
Table SummarySector | % of Net Assets |
|---|
Pharmaceuticals | 39% |
|---|
Biotechnology | 20% |
|---|
Health Care Equipment | 16% |
|---|
Life Sciences Tools & Services | 10% |
|---|
Managed Health Care | 7% |
|---|
Health Care Distributors | 5% |
|---|
Health Care Services | 1% |
|---|
Health Care Supplies | 1% |
|---|
Health Care Technology | 0% |
|---|
Ten Largest Equity HoldingsTable SummaryHoldings | 51.5% of Net Assets |
|---|
Eli Lilly & Co. | 13.9% | Johnson & Johnson | 6.2% | UnitedHealth Group, Inc. | 5.7% | AbbVie, Inc. | 4.9% | Merck & Co., Inc. | 4.9% | AstraZeneca PLC | 3.8% | Thermo Fisher Scientific, Inc. | 3.5% | Novartis AG | 2.9% | Amgen, Inc. | 2.9% | Gilead Sciences, Inc. | 2.8% | |
| Material Fund Change [Text Block] |
|
|
| C000016787 |
|
|
| Shareholder Report [Line Items] |
|
|
| Fund Name |
|
DWS Health and Wellness Fund
|
| Class Name |
|
Institutional Class
|
| Trading Symbol |
|
SUHIX
|
| Annual or Semi-Annual Statement [Text Block] |
|
This annual shareholder report contains important information about DWS Health and Wellness Fund (the "Fund") for the period June 1, 2025 to May 31, 2026.
|
| Additional Information [Text Block] |
|
You can find additional information about the Fund on the Fund's website at dws.com/mutualreports. You can also request this information by contacting us at (800) 728-3337.
|
| Material Fund Change Notice [Text Block] |
|
This report describes changes to the Fund that occurred during the reporting period.
|
| Additional Information Phone Number |
|
(800) 728-3337
|
| Additional Information Website |
|
<span style="box-sizing: border-box; color: rgb(0, 0, 0); display: inline; flex-wrap: nowrap; font-size: 14.6667px; font-weight: 300; grid-area: auto; line-height: 17.6px; margin: 0px; overflow: visible; text-align: left; text-align-last: auto; white-space-collapse: preserve-breaks;">dws.com/mutualreports</span>
|
| Expenses [Text Block] |
|
What were the Fund costs for the last year?(Based on a hypothetical $10,000 investment) Table SummaryFund | Costs of a $10,000 investment | Costs paid as a percentage of a $10,000 investment |
|---|
Institutional Class | $109 | 1.04% |
|---|
Gross expense ratio as of the latest prospectus: 1.09%. See prospectus for any contractual or voluntary waivers; without a waiver, costs would have been higher. |
| Expenses Paid, Amount |
|
$ 109
|
| Expense Ratio, Percent |
|
1.04%
|
| Factors Affecting Performance [Text Block] |
|
How did the Fund perform last year and what affected its performance? Institutional Class shares of the Fund returned 9.97% for the period ended May 31, 2026. The Fund's broad-based index, the S&P 500® Index, returned 29.78% for the same period, while the Fund's additional, more narrowly based index, the MSCI World Health Care Index, returned 12.09%. The Fund’s underperformance relative to the MSCI World Health Care Index reflects the negative impact of sector allocation, most notably an overweight to health care equipment & supplies and an underweight to pharmaceuticals, which was only partially offset by positive stock selection overall. Positive contributions to relative performance in sector terms were led by stock selection within biotechnology, followed by selection within health care providers & services and life sciences tools & services. In terms of individual holdings, pharmaceutical company Eli Lilly & Co. (13.9%) outperformed on exceptional sales growth in its diabetes and obesity franchise brands Mounjaro and Zepbound, respectively, along with continued positive momentum with respect to its pipeline of drugs in development. Biotechnology company Insmed, Inc. (0.4%) also contributed positively. The stock rose sharply on optimism around FDA approval of brensocatib, the first targeted treatment proven to help manage bronchiectasis, the third most common chronic lung disease. In addition, the company’s broader drug pipeline continued to demonstrate progress. UnitedHealth Group, Inc. (5.7%) outperformed as the managed care provider has been more successful than its peers in mitigating the impact of elevated medical cost trends, leading the company to raise full-year 2026 earnings guidance. On the downside, in sector terms an overweight to and selection within health care equipment & supplies and an underweight to pharmaceuticals weighed most heavily on relative performance. In terms of individual holdings, shares of medical device company Boston Scientific Corp. (2.1%) declined on weaker guidance amid increased competition in the cardiac device market which has challenged its heart rhythm disorder franchises as well as its blockbuster Watchman stroke prevention implant. An underweight to Roche Holding AG (1.2%) detracted as well. While Roche has faced concerns around growth quality and reliance on legacy products, the stock is viewed as relatively defensive and held up better than most peers in the face of uncertainty around U.S. drug pricing policy and the U.S.-Iran conflict. Medical technology company Stryker Corp. (2.6%) detracted despite continued solid business fundamentals. The stock declined significantly in the wake of a cyber attack that disrupted the company’s manufacturing and billing systems, leading to a major revenue and earnings miss. Macro headwinds including higher interest rates and pressure on medical reimbursements also impacted sentiment around the broader sector. |
| Performance Past Does Not Indicate Future [Text] |
|
The Fund's past performance is not a good predictor or guarantee of the Fund's future performance.
|
| Line Graph [Table Text Block] |
|
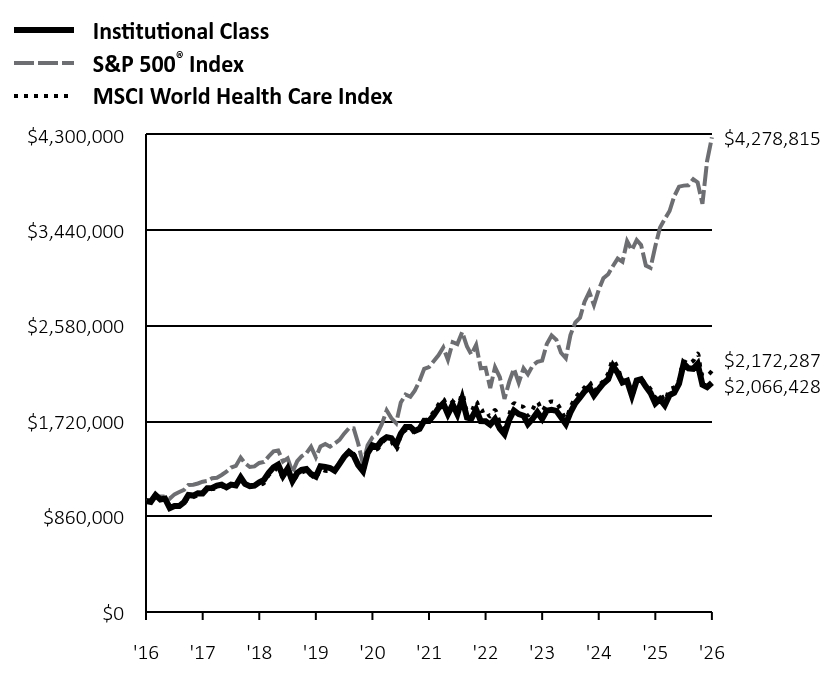 Table Summary | Institutional Class | S&P 500® Index | MSCI World Health Care Index |
|---|
'16 | $1,000,000 | $1,000,000 | $1,000,000 |
|---|
'16 | $992,792 | $1,002,591 | $1,007,957 |
|---|
'16 | $1,053,924 | $1,039,555 | $1,053,806 |
|---|
'16 | $1,014,148 | $1,041,015 | $1,010,022 |
|---|
'16 | $1,021,623 | $1,041,212 | $1,008,691 |
|---|
'16 | $937,533 | $1,022,219 | $939,066 |
|---|
'16 | $956,220 | $1,060,077 | $939,905 |
|---|
'16 | $955,597 | $1,081,031 | $954,677 |
|---|
'17 | $990,156 | $1,101,534 | $975,545 |
|---|
'17 | $1,054,064 | $1,145,271 | $1,031,959 |
|---|
'17 | $1,049,401 | $1,146,607 | $1,035,251 |
|---|
'17 | $1,070,795 | $1,158,383 | $1,054,802 |
|---|
'17 | $1,069,149 | $1,174,685 | $1,077,803 |
|---|
'17 | $1,115,503 | $1,182,017 | $1,107,045 |
|---|
'17 | $1,118,794 | $1,206,322 | $1,107,872 |
|---|
'17 | $1,139,914 | $1,210,015 | $1,118,787 |
|---|
'17 | $1,147,045 | $1,234,975 | $1,133,826 |
|---|
'17 | $1,123,183 | $1,263,794 | $1,119,147 |
|---|
'17 | $1,148,142 | $1,302,554 | $1,144,453 |
|---|
'17 | $1,140,035 | $1,317,037 | $1,143,705 |
|---|
'18 | $1,212,599 | $1,392,443 | $1,207,803 |
|---|
'18 | $1,154,024 | $1,341,122 | $1,153,654 |
|---|
'18 | $1,133,916 | $1,307,040 | $1,129,654 |
|---|
'18 | $1,138,870 | $1,312,055 | $1,140,440 |
|---|
'18 | $1,168,595 | $1,343,652 | $1,145,831 |
|---|
'18 | $1,190,160 | $1,351,922 | $1,161,069 |
|---|
'18 | $1,253,981 | $1,402,232 | $1,232,393 |
|---|
'18 | $1,304,979 | $1,447,924 | $1,268,831 |
|---|
'18 | $1,329,167 | $1,456,165 | $1,294,544 |
|---|
'18 | $1,227,753 | $1,356,636 | $1,209,422 |
|---|
'18 | $1,293,322 | $1,384,282 | $1,275,334 |
|---|
'18 | $1,180,687 | $1,259,294 | $1,172,453 |
|---|
'19 | $1,254,038 | $1,360,209 | $1,232,813 |
|---|
'19 | $1,280,740 | $1,403,883 | $1,257,144 |
|---|
'19 | $1,288,783 | $1,431,163 | $1,267,855 |
|---|
'19 | $1,244,065 | $1,489,110 | $1,235,171 |
|---|
'19 | $1,221,223 | $1,394,480 | $1,205,583 |
|---|
'19 | $1,312,911 | $1,492,758 | $1,286,912 |
|---|
'19 | $1,307,764 | $1,514,212 | $1,272,598 |
|---|
'19 | $1,297,791 | $1,490,226 | $1,272,217 |
|---|
'19 | $1,272,697 | $1,518,109 | $1,270,882 |
|---|
'19 | $1,334,466 | $1,550,991 | $1,334,329 |
|---|
'19 | $1,399,130 | $1,607,290 | $1,397,381 |
|---|
'19 | $1,443,936 | $1,655,801 | $1,444,976 |
|---|
'20 | $1,409,363 | $1,655,152 | $1,424,441 |
|---|
'20 | $1,324,343 | $1,518,901 | $1,327,076 |
|---|
'20 | $1,270,014 | $1,331,297 | $1,279,135 |
|---|
'20 | $1,431,588 | $1,501,961 | $1,427,610 |
|---|
'20 | $1,502,145 | $1,573,496 | $1,485,213 |
|---|
'20 | $1,488,386 | $1,604,788 | $1,465,344 |
|---|
'20 | $1,546,595 | $1,695,274 | $1,525,447 |
|---|
'20 | $1,575,523 | $1,817,131 | $1,556,803 |
|---|
'20 | $1,567,057 | $1,748,086 | $1,535,377 |
|---|
'20 | $1,505,320 | $1,701,598 | $1,460,471 |
|---|
'20 | $1,606,215 | $1,887,862 | $1,591,188 |
|---|
'20 | $1,666,897 | $1,960,447 | $1,640,321 |
|---|
'21 | $1,666,897 | $1,940,655 | $1,657,789 |
|---|
'21 | $1,631,162 | $1,994,168 | $1,612,704 |
|---|
'21 | $1,650,759 | $2,081,504 | $1,652,188 |
|---|
'21 | $1,722,999 | $2,192,591 | $1,715,262 |
|---|
'21 | $1,721,077 | $2,207,905 | $1,750,540 |
|---|
'21 | $1,772,567 | $2,259,448 | $1,802,993 |
|---|
'21 | $1,838,275 | $2,313,121 | $1,870,083 |
|---|
'21 | $1,881,696 | $2,383,453 | $1,921,963 |
|---|
'21 | $1,783,327 | $2,272,599 | $1,821,223 |
|---|
'21 | $1,869,784 | $2,431,821 | $1,898,105 |
|---|
'21 | $1,782,558 | $2,414,971 | $1,830,345 |
|---|
'21 | $1,922,855 | $2,523,201 | $1,965,160 |
|---|
'22 | $1,752,120 | $2,392,633 | $1,819,961 |
|---|
'22 | $1,742,495 | $2,320,994 | $1,811,836 |
|---|
'22 | $1,826,189 | $2,407,171 | $1,899,096 |
|---|
'22 | $1,720,317 | $2,197,261 | $1,811,130 |
|---|
'22 | $1,719,480 | $2,201,292 | $1,820,059 |
|---|
'22 | $1,688,095 | $2,019,589 | $1,762,323 |
|---|
'22 | $1,739,566 | $2,205,804 | $1,819,854 |
|---|
'22 | $1,654,199 | $2,115,847 | $1,710,232 |
|---|
'22 | $1,603,565 | $1,920,980 | $1,642,888 |
|---|
'22 | $1,734,963 | $2,076,505 | $1,780,945 |
|---|
'22 | $1,816,564 | $2,192,548 | $1,881,041 |
|---|
'22 | $1,784,139 | $2,066,225 | $1,858,761 |
|---|
'23 | $1,769,676 | $2,196,054 | $1,846,732 |
|---|
'23 | $1,693,954 | $2,142,473 | $1,771,379 |
|---|
'23 | $1,742,875 | $2,221,132 | $1,829,015 |
|---|
'23 | $1,801,156 | $2,255,800 | $1,892,966 |
|---|
'23 | $1,740,323 | $2,265,605 | $1,815,451 |
|---|
'23 | $1,815,194 | $2,415,305 | $1,873,313 |
|---|
'23 | $1,822,426 | $2,492,897 | $1,897,491 |
|---|
'23 | $1,813,067 | $2,453,206 | $1,882,875 |
|---|
'23 | $1,754,361 | $2,336,242 | $1,821,637 |
|---|
'23 | $1,693,529 | $2,287,119 | $1,746,726 |
|---|
'23 | $1,799,879 | $2,495,991 | $1,846,883 |
|---|
'23 | $1,881,227 | $2,609,385 | $1,928,594 |
|---|
'24 | $1,933,496 | $2,653,234 | $1,980,399 |
|---|
'24 | $1,987,552 | $2,794,905 | $2,025,009 |
|---|
'24 | $2,027,758 | $2,884,830 | $2,072,679 |
|---|
'24 | $1,951,366 | $2,767,000 | $1,990,756 |
|---|
'24 | $2,009,889 | $2,904,201 | $2,043,927 |
|---|
'24 | $2,060,371 | $3,008,410 | $2,082,607 |
|---|
'24 | $2,098,344 | $3,045,030 | $2,150,708 |
|---|
'24 | $2,216,730 | $3,118,892 | $2,268,853 |
|---|
'24 | $2,155,526 | $3,185,503 | $2,201,220 |
|---|
'24 | $2,067,965 | $3,156,615 | $2,095,087 |
|---|
'24 | $2,084,048 | $3,341,912 | $2,076,795 |
|---|
'24 | $1,950,034 | $3,262,247 | $1,950,390 |
|---|
'25 | $2,087,385 | $3,353,092 | $2,075,126 |
|---|
'25 | $2,098,681 | $3,309,340 | $2,098,455 |
|---|
'25 | $2,032,264 | $3,122,878 | $2,049,795 |
|---|
'25 | $1,975,335 | $3,101,702 | $2,011,020 |
|---|
'25 | $1,879,099 | $3,296,938 | $1,937,922 |
|---|
'25 | $1,918,858 | $3,464,596 | $1,965,961 |
|---|
'25 | $1,863,737 | $3,542,352 | $1,907,573 |
|---|
'25 | $1,955,907 | $3,614,161 | $2,005,698 |
|---|
'25 | $1,977,142 | $3,746,078 | $2,025,064 |
|---|
'25 | $2,057,566 | $3,833,787 | $2,087,877 |
|---|
'25 | $2,239,647 | $3,843,184 | $2,257,529 |
|---|
'25 | $2,196,705 | $3,845,537 | $2,239,623 |
|---|
'26 | $2,192,442 | $3,901,298 | $2,264,153 |
|---|
'26 | $2,236,499 | $3,871,649 | $2,329,583 |
|---|
'26 | $2,047,953 | $3,678,860 | $2,136,580 |
|---|
'26 | $2,027,108 | $4,064,870 | $2,131,469 |
|---|
'26 | $2,066,428 | $4,278,815 | $2,172,287 |
|---|
|
| Average Annual Return [Table Text Block] |
|
Table SummaryClass/Index
| 1-Year | 5-Year | 10-Year |
|---|
Institutional Class No Sales Charge | 9.97% | 3.73% | 7.53% |
|---|
S&P 500® Index | 29.78% | 14.15% | 15.65% |
|---|
MSCI World Health Care Index | 12.09% | 4.41% | 8.07% |
|---|
|
| No Deduction of Taxes [Text Block] |
|
The performance graph and returns table do not reflect the deduction of taxes that a shareholder would pay on Fund distributions or the redemption of Fund shares.
|
| Material Change Date |
Jun. 01, 2025
|
|
| AssetsNet |
|
$ 231,669,035
|
| Holdings Count | Holding |
|
65
|
| Advisory Fees Paid, Amount |
|
$ 1,894,679
|
| InvestmentCompanyPortfolioTurnover |
|
2.00%
|
| Additional Fund Statistics [Text Block] |
|
Table SummaryNet Assets ($) | 231,669,035 |
|---|
Number of Portfolio Holdings | 65 |
|---|
Portfolio Turnover Rate (%) | 2 |
|---|
Total Net Advisory Fees Paid ($) | 1,894,679 |
|---|
|
| Holdings [Text Block] |
|
Table SummaryAsset Type | % of Net Assets |
|---|
Common Stocks | 100% |
|---|
Cash Equivalents | 0% |
|---|
Rights | 0% |
|---|
Other Assets and Liabilities, Net | 0% |
|---|
Total | 100% |
|---|
Table SummarySector | % of Net Assets |
|---|
Pharmaceuticals | 39% |
|---|
Biotechnology | 20% |
|---|
Health Care Equipment | 16% |
|---|
Life Sciences Tools & Services | 10% |
|---|
Managed Health Care | 7% |
|---|
Health Care Distributors | 5% |
|---|
Health Care Services | 1% |
|---|
Health Care Supplies | 1% |
|---|
Health Care Technology | 0% |
|---|
Ten Largest Equity HoldingsTable SummaryHoldings | 51.5% of Net Assets |
|---|
Eli Lilly & Co. | 13.9% | Johnson & Johnson | 6.2% | UnitedHealth Group, Inc. | 5.7% | AbbVie, Inc. | 4.9% | Merck & Co., Inc. | 4.9% | AstraZeneca PLC | 3.8% | Thermo Fisher Scientific, Inc. | 3.5% | Novartis AG | 2.9% | Amgen, Inc. | 2.9% | Gilead Sciences, Inc. | 2.8% | |
| Material Fund Change [Text Block] |
|
This is a summary of certain changes of the Fund since June 1, 2025. For more information, review the Fund's current prospectus at dws.com/mutualreports, or call (800) 728-3337. Effective October 1, 2025, the Fund’s contractual cap on total annual operating expense for Institutional Class shares changed from 1.10% to 1.04%. The cap excludes certain expenses such as extraordinary expenses, taxes, brokerage, interest expense and acquired fund fees and expenses. |
| Material Fund Change Expenses [Text Block] |
|
Effective October 1, 2025, the Fund’s contractual cap on total annual operating expense for Institutional Class shares changed from 1.10% to 1.04%. The cap excludes certain expenses such as extraordinary expenses, taxes, brokerage, interest expense and acquired fund fees and expenses.
|
| Summary of Change Legend [Text Block] |
|
This is a summary of certain changes of the Fund since June 1, 2025. For more information, review the Fund's current prospectus at dws.com/mutualreports, or call (800) 728-3337.
|