Shareholder Report
May 31, 2026
USD ($)
Holding
What were the Fund costs for the last year?
(Based on a hypothetical $10,000 investment)
| Fund (Class) | Costs of a $10,000 investment | Costs paid as a percentage of a $10,000 investment |
| Virtus Stone Harbor Emerging Markets Bond Fund Class I / SHCDX |
$97 | 0.93% |
What factors impacted Fund performance over the reporting period?
Country exposures and issue selection contributed positively to performance relative to the J.P. Morgan CEMBI Broad Diversified Index (the "Index") for the 12 months ended May 31, 2026. Exposures in Asia contributed most to relative performance. In other regions, issue selection in Argentina and Colombia and overweights in Ghana and Ukraine enhanced performance. In terms of industry attribution, an underweight to and issue selection within financial/lease contributed, as did an overweight to and issue selection in exploration & production ("E&P"). Underweight exposures in higher-rated credits and overweight exposures in lower-quality credits contributed to relative performance for the period. Some of the positive performance attribution was offset by an overweight to Brazil and an underweight to Trinidad.
| FACTOR | IMPACT | SUMMARY |
| Argentina |
Positive |
Issue selection, particularly in Albanesi, a thermal power and gas generator in Argentina, contributed to performance relative to the Index. |
| Colombia |
Positive |
Issue selection, particularly in Gran Tierra, an international oil and gas E&P company with main operations in Colombia and Ecuador, contributed to relative performance. |
| Trinidad |
Negative |
Issue selection, particularly in Consolidated Energy, a global natural gas-based petrochemical producer with core operations in Trinidad and Tobago, detracted from relative performance. |
| Brazil | Negative | Issue selection, particularly in Ambipar, a global environmental solutions provider based in Brazil, detracted from relative performance. |
The preceding information is the opinion of portfolio management only through the end of the period stated. Any such opinions are subject to change at any time based upon market or other conditions and should not be relied upon as investment advice. Performance figures assume reinvestment of distributions and exclude the effect of sales charges. Performance data quoted represents past results. Past performance is no guarantee of future results, and there is no guarantee that market forecasts will be realized.
How has the Fund historically performed?
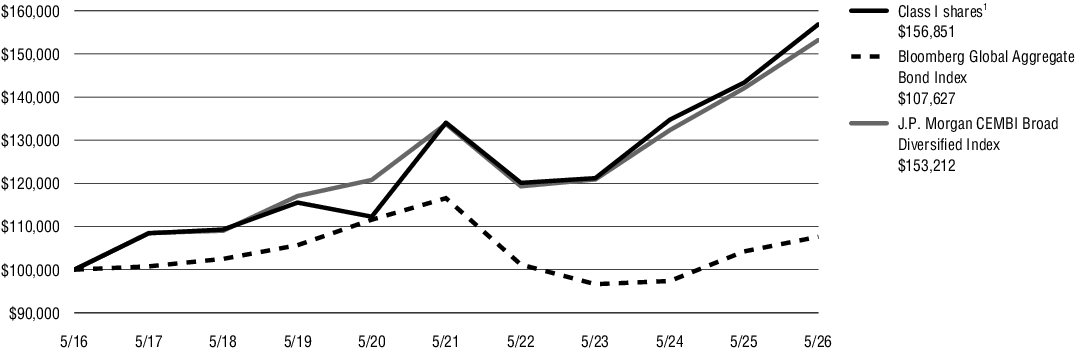
The following graph compares the initial and subsequent account values at the end of each of the most recently completed 10 fiscal years of Class I shares. It assumes a $100,000 initial investment at the beginning of the first fiscal year, in appropriate broad-based securities market and style-specific indexes for the same period. Performance assumes reinvestment of dividends and capital gain distributions.
GROWTH OF $100,000
| (1) |
“NAV” (Net Asset Value) total returns do not include the effect of any sales charge. |
| AVERAGE ANNUAL TOTAL RETURNS for periods ended 5/31/26 | 1 Year | 5 Years | 10 Years |
| Virtus Stone Harbor Emerging Markets Bond Fund (Class I/SHCDX) at NAV(1) | 9.55% | 3.19% | 4.60% |
| Bloomberg Global Aggregate Bond Index | 3.26 | (1.58) | 0.74 |
| J.P. Morgan CEMBI Broad Diversified Index | 7.86 | 2.75 | 4.36 |
| (1) |
“NAV” (Net Asset Value) total returns do not include the effect of any sales charge. |
KEY FUND STATISTICS (as of May 31, 2026)
| Fund net assets (‘000s) | $6,966 |
| Total number of portfolio holdings | 189 |
| Total advisory fee paid (‘000s) | $- |
| Portfolio turnover rate as of the end of the reporting period | 51% |
Asset Allocation(1)
| Corporate Bonds and Notes | 98 | % | ||
| Financial & Lease | 19 | |||
| Electric | 17 | |||
| Exploration & Production | 14 | |||
| Wireless | 8 | |||
| Gaming | 6 | |||
| Metals, Mining & Steel | 6 | |||
| Food, Beverages & Tobacco | 4 | |||
| Industrial Other | 3 | |||
| Refining | 3 | |||
| Chemicals | 3 | |||
| All other Corporate Bonds and Notes | 15 | |||
| Short-Term Investment | 2 | |||
| Total | 100 | % |
| (1) |
Percentage of total investments as of May 31, 2026. |
Material Fund Changes
Effective January 1, 2026, a new expense limitation of 0.89% went into effect for Class I shares.
Effective January 1, 2026, a new expense limitation of 0.89% went into effect for Class I shares.
What were the Fund costs for the last year?
(Based on a hypothetical $10,000 investment)
| Fund (Class) | Costs of a $10,000 investment | Costs paid as a percentage of a $10,000 investment |
| Virtus Stone Harbor Emerging Markets Bond Fund Class A / VSHAX |
$122 | 1.17% |
What factors impacted Fund performance over the reporting period?
Country exposures and issue selection contributed positively to performance relative to the J.P. Morgan CEMBI Broad Diversified Index (the "Index") for the 12 months ended May 31, 2026. Exposures in Asia contributed most to relative performance. In other regions, issue selection in Argentina and Colombia and overweights in Ghana and Ukraine enhanced performance. In terms of industry attribution, an underweight to and issue selection within financial/lease contributed, as did an overweight to and issue selection in exploration & production ("E&P"). Underweight exposures in higher-rated credits and overweight exposures in lower-quality credits contributed to relative performance for the period. Some of the positive performance attribution was offset by an overweight to Brazil and an underweight to Trinidad.
| FACTOR | IMPACT | SUMMARY |
| Argentina |
Positive |
Issue selection, particularly in Albanesi, a thermal power and gas generator in Argentina, contributed to performance relative to the Index. |
| Colombia |
Positive |
Issue selection, particularly in Gran Tierra, an international oil and gas E&P company with main operations in Colombia and Ecuador, contributed to relative performance. |
| Trinidad |
Negative |
Issue selection, particularly in Consolidated Energy, a global natural gas-based petrochemical producer with core operations in Trinidad and Tobago, detracted from relative performance. |
| Brazil | Negative | Issue selection, particularly in Ambipar, a global environmental solutions provider based in Brazil, detracted from relative performance. |
The preceding information is the opinion of portfolio management only through the end of the period stated. Any such opinions are subject to change at any time based upon market or other conditions and should not be relied upon as investment advice. Performance figures assume reinvestment of distributions and exclude the effect of sales charges. Performance data quoted represents past results. Past performance is no guarantee of future results, and there is no guarantee that market forecasts will be realized.
How has the Fund historically performed?
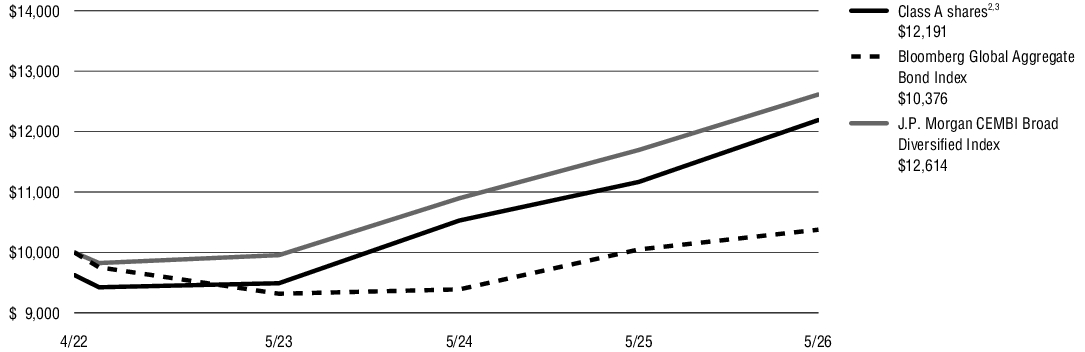
The following graph compares the initial and subsequent account values at the end of each of the most recently completed fiscal years of Class A shares from inception (April 11, 2022) including any applicable sales charges or fees. It assumes a $10,000 initial investment from inception, in appropriate broad-based securities market and style-specific indexes for the same period. Performance assumes reinvestment of dividends and capital gain distributions.
GROWTH OF $10,000
| AVERAGE ANNUAL TOTAL RETURNS for periods ended 5/31/26 | 1 Year | Since Inception |
| Virtus Stone Harbor Emerging Markets Bond Fund (Class A/VSHAX) at NAV(1) | 9.31% | 5.88% |
| Virtus Stone Harbor Emerging Markets Bond Fund (Class A/VSHAX) at POP(2),(3) | 5.08 | 4.91 |
| Bloomberg Global Aggregate Bond Index | 3.26 | 0.90 |
| J.P. Morgan CEMBI Broad Diversified Index | 7.86 | 5.78 |
| (1) |
“NAV” (Net Asset Value) total returns do not include the effect of any sales charge. |
| (2) |
“POP” (Public Offering Price) total returns include the effect of the maximum front-end 3.75% sales charge. |
| (3) |
“CDSC” (contingent deferred sales charge) is applied to redemptions of certain classes of shares that do not have a sales charge applied at the time of purchase. A CDSC may be imposed on certain redemptions of Class A shares made within 18 months of a finder’s fee being paid. |
KEY FUND STATISTICS (as of May 31, 2026)
| Fund net assets (‘000s) | $6,966 |
| Total number of portfolio holdings | 189 |
| Total advisory fee paid (‘000s) | $- |
| Portfolio turnover rate as of the end of the reporting period | 51% |
Asset Allocation(1)
| Corporate Bonds and Notes | 98 | % | ||
| Financial & Lease | 19 | |||
| Electric | 17 | |||
| Exploration & Production | 14 | |||
| Wireless | 8 | |||
| Gaming | 6 | |||
| Metals, Mining & Steel | 6 | |||
| Food, Beverages & Tobacco | 4 | |||
| Industrial Other | 3 | |||
| Refining | 3 | |||
| Chemicals | 3 | |||
| All other Corporate Bonds and Notes | 15 | |||
| Short-Term Investment | 2 | |||
| Total | 100 | % |
| (1) |
Percentage of total investments as of May 31, 2026. |
Material Fund Changes
Effective January 1, 2026, a new expense limitation of 1.14% went into effect for Class A shares.
Effective January 1, 2026, a new expense limitation of 1.14% went into effect for Class A shares.
What were the Fund costs for the last year?
(Based on a hypothetical $10,000 investment)
| Fund (Class) | Costs of a $10,000 investment | Costs paid as a percentage of a $10,000 investment |
| Virtus Stone Harbor Emerging Markets Debt Income Fund Class A / VSHCX |
$108 | 1.00% |
What factors impacted Fund performance over the reporting period?
Country selection decisions were the largest contributor to performance relative to the J.P. Morgan EMBI Global Diversified Index (the "Index") for the 12 months ended May 31, 2026. Issue selection within hard currency-denominated debt was also a contributor. Hard currency bonds are debt securities issued in foreign currencies, typically U.S. dollars, rather than their local currency. Additionally, out of benchmark allocations to hard currency corporate debt in certain countries enhanced performance, while out of benchmark local currency exposure was a small detractor. Attribution from movements in U.S. Treasuries was negative during the period. In terms of regional performance, Latin America, namely an overweight and issue selection in Venezuela, was a considerable contributor to relative performance. In Europe, Middle East, and Africa, an underweight to and issue selection in Bahrain were large contributors to performance, as was an underweight to China in the Fund’s Asia allocation.
| FACTOR | IMPACT | SUMMARY |
| Venezuela |
Positive |
Overweight exposure and issue selection in Venezuela enhanced performance relative to the Index for the period. |
| China |
Positive |
Underweight exposure in China enhanced relative returns. |
| Senegal |
Negative |
An overweight to Senegal detracted from relative performance. Delays in securing funding from the International Monetary Fund amid fiscal concerns and previously misreported deficit data weakened investor confidence. |
| Pakistan | Negative | An underweight to Pakistan detracted from relative performance. |
The preceding information is the opinion of portfolio management only through the end of the period stated. Any such opinions are subject to change at any time based upon market or other conditions and should not be relied upon as investment advice. Performance figures assume reinvestment of distributions and exclude the effect of sales charges. Performance data quoted represents past results. Past performance is no guarantee of future results, and there is no guarantee that market forecasts will be realized.
How has the Fund historically performed?
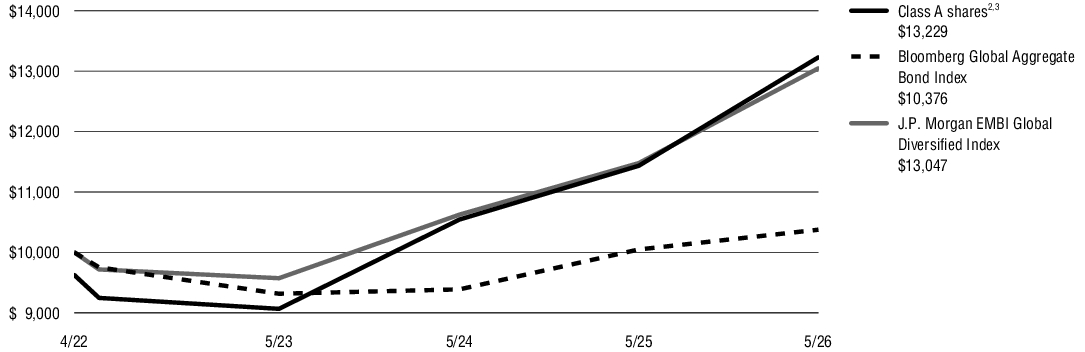
The following graph compares the initial and subsequent account values at the end of each of the most recently completed fiscal years of Class A shares from inception (April 11, 2022) including any applicable sales charges or fees. It assumes a $10,000 initial investment from inception, in an appropriate broad-based securities market index and style-specific index for the same period. Performance assumes reinvestment of dividends and capital gain distributions.
GROWTH OF $10,000
| AVERAGE ANNUAL TOTAL RETURNS for periods ended 5/31/26 | 1 Year | Since Inception |
| Virtus Stone Harbor Emerging Markets Debt Income Fund (Class A/VSHCX) at NAV(1) | 15.69% | 8.00% |
| Virtus Stone Harbor Emerging Markets Debt Income Fund (Class A/VSHCX) at POP(2),(3) | 11.36 | 7.00 |
| Bloomberg Global Aggregate Bond Index | 3.26 | 0.90 |
| J.P. Morgan EMBI Global Diversified Index | 13.66 | 6.65 |
| (1) |
“NAV” (Net Asset Value) total returns do not include the effect of any sales charge. |
| (2) |
“POP” (Public Offering Price) total returns include the effect of the maximum front-end 3.75% sales charge. |
| (3) |
“CDSC” (contingent deferred sales charge) is applied to redemptions of certain classes of shares that do not have a sales charge applied at the time of purchase. A CDSC may be imposed on certain redemptions of Class A shares made within 18 months of a finder’s fee being paid. |
KEY FUND STATISTICS (as of May 31, 2026)
| Fund net assets (‘000s) | $339,117 |
| Total number of portfolio holdings | 330 |
| Total advisory fee paid (‘000s) | $1,060 |
| Portfolio turnover rate as of the end of the reporting period | 124% |
Asset Allocation(1)
| Foreign Government Securities | 79 | % | ||
| Corporate Bonds and Notes | 17 | |||
| Exploration & Production | 8 | |||
| Electric | 3 | |||
| Financial & Lease | 2 | |||
| Metals, Mining & Steel | 2 | |||
| All other Corporate Bonds and Notes | 2 | |||
| Affiliated Mutual Funds | 3 | |||
| Credit Linked Notes | 1 | |||
| Total | 100 | % |
| (1) |
Percentage of total investments as of May 31, 2026. |
What were the Fund costs for the last year?
(Based on a hypothetical $10,000 investment)
| Fund (Class) | Costs of a $10,000 investment | Costs paid as a percentage of a $10,000 investment |
| Virtus Stone Harbor Emerging Markets Debt Income Fund Class I / SHMDX |
$78 | 0.72% |
What factors impacted Fund performance over the reporting period?
Country selection decisions were the largest contributor to performance relative to the J.P. Morgan EMBI Global Diversified Index (the "Index") for the 12 months ended May 31, 2026. Issue selection within hard currency-denominated debt was also a contributor. Hard currency bonds are debt securities issued in foreign currencies, typically U.S. dollars, rather than their local currency. Additionally, out of benchmark allocations to hard currency corporate debt in certain countries enhanced performance, while out of benchmark local currency exposure was a small detractor. Attribution from movements in U.S. Treasuries was negative during the period. In terms of regional performance, Latin America, namely an overweight and issue selection in Venezuela, was a considerable contributor to relative performance. In Europe, Middle East, and Africa, an underweight to and issue selection in Bahrain were large contributors to performance, as was an underweight to China in the Fund’s Asia allocation.
| FACTOR | IMPACT | SUMMARY |
| Venezuela |
Positive |
Overweight exposure and issue selection in Venezuela enhanced performance relative to the Index for the period. |
| China |
Positive |
Underweight exposure in China enhanced relative returns. |
| Senegal |
Negative |
An overweight to Senegal detracted from relative performance. Delays in securing funding from the International Monetary Fund amid fiscal concerns and previously misreported deficit data weakened investor confidence. |
| Pakistan | Negative | An underweight to Pakistan detracted from relative performance. |
The preceding information is the opinion of portfolio management only through the end of the period stated. Any such opinions are subject to change at any time based upon market or other conditions and should not be relied upon as investment advice. Performance figures assume reinvestment of distributions and exclude the effect of sales charges. Performance data quoted represents past results. Past performance is no guarantee of future results, and there is no guarantee that market forecasts will be realized.
How has the Fund historically performed?
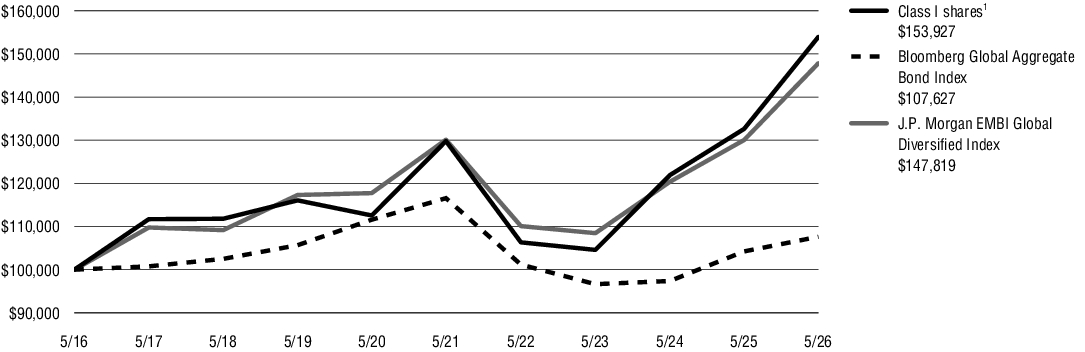
The following graph compares the initial and subsequent account values at the end of each of the most recently completed 10 fiscal years of Class I shares. It assumes a $100,000 initial investment at the beginning of the first fiscal year, in an appropriate broad-based securities market index and style-specific index for the same period. Performance assumes reinvestment of dividends and capital gain distributions.
GROWTH OF $100,000
| (1) |
“NAV” (Net Asset Value) total returns do not include the effect of any sales charge. |
| AVERAGE ANNUAL TOTAL RETURNS for periods ended 5/31/26 | 1 Year | 5 Years | 10 Years |
| Virtus Stone Harbor Emerging Markets Debt Income Fund (Class I/SHMDX) at NAV(1) | 16.06% | 3.47% | 4.41% |
| Bloomberg Global Aggregate Bond Index | 3.26 | (1.58) | 0.74 |
| J.P. Morgan EMBI Global Diversified Index | 13.66 | 2.59 | 3.99 |
| (1) |
“NAV” (Net Asset Value) total returns do not include the effect of any sales charge. |
KEY FUND STATISTICS (as of May 31, 2026)
| Fund net assets (‘000s) | $339,117 |
| Total number of portfolio holdings | 330 |
| Total advisory fee paid (‘000s) | $1,060 |
| Portfolio turnover rate as of the end of the reporting period | 124% |
Asset Allocation(1)
| Foreign Government Securities | 79 | % | ||
| Corporate Bonds and Notes | 17 | |||
| Exploration & Production | 8 | |||
| Electric | 3 | |||
| Financial & Lease | 2 | |||
| Metals, Mining & Steel | 2 | |||
| All other Corporate Bonds and Notes | 2 | |||
| Affiliated Mutual Funds | 3 | |||
| Credit Linked Notes | 1 | |||
| Total | 100 | % |
| (1) |
Percentage of total investments as of May 31, 2026. |
What were the Fund costs for the last year?
(Based on a hypothetical $10,000 investment)
| Fund (Class) | Costs of a $10,000 investment | Costs paid as a percentage of a $10,000 investment |
| Virtus Stone Harbor Local Markets Fund Class I / SHLMX |
$107 | 1.02% |
What factors impacted Fund performance over the reporting period?
Foreign exchange ("FX") exposure (a measurement of currency risk) and duration positioning (a measurement of adjusting the portfolio’s sensitivity to changes in interest rates), as well as security selection and taxes, all contributed to performance relative to the J.P. Morgan GBI-EM Global Diversified Index (the "Index") for the 12 months ended May 31, 2026. In FX, overweights in the Hungarian forint and Brazilian real and underweights in the Indonesian rupiah and Thai baht all enhanced performance. An overweight exposure in the Egyptian pound and underweight in the Colombian peso detracted from performance. Within duration positioning we continued to emphasize countries with attractive real (after-inflation) yields that we believe have sufficient space to further ease policy interest rates. Overweights in South Africa and Mexico were the biggest contributors, while an overweight to Paraguay was a small detractor. Within the Fund’s underweight positions, Thailand was the notable outperformer, while India underperformed.
| FACTOR | IMPACT | SUMMARY |
| South Africa |
Positive |
The Fund’s overweight duration position relative to the Index, as well as issue selection, contributed to relative performance. |
| Mexico |
Positive |
FX and duration overweights, as well as issue selection, contributed to relative performance. |
| India |
Negative |
The Fund’s underweight duration relative to the Index, along with security selection and taxes, detracted from relative performance. |
| Poland | Negative | A duration underweight, as well as issue selection and taxes, all detracted from relative performance. |
The preceding information is the opinion of portfolio management only through the end of the period stated. Any such opinions are subject to change at any time based upon market or other conditions and should not be relied upon as investment advice. Performance figures assume reinvestment of distributions and exclude the effect of sales charges. Performance data quoted represents past results. Past performance is no guarantee of future results, and there is no guarantee that market forecasts will be realized.
How has the Fund historically performed?
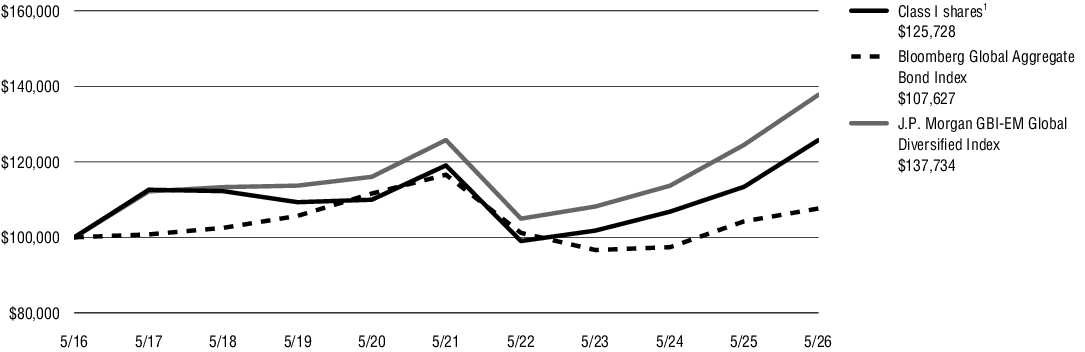
The following graph compares the initial and subsequent account values at the end of each of the most recently completed 10 fiscal years of Class I shares. It assumes a $100,000 initial investment at the beginning of the first fiscal year, in appropriate broad-based securities market and style-specific indexes for the same period. Performance assumes reinvestment of dividends and capital gain distributions.
GROWTH OF $100,000
| (1) |
“NAV” (Net Asset Value) total returns do not include the effect of any sales charge. |
| AVERAGE ANNUAL TOTAL RETURNS for periods ended 5/31/26 | 1 Year | 5 Years | 10 Years |
| Virtus Stone Harbor Local Markets Fund (Class I/SHLMX) at NAV(1) | 10.76% | 1.10% | 2.32% |
| Bloomberg Global Aggregate Bond Index | 3.26 | (1.58) | 0.74 |
| J.P. Morgan GBI-EM Global Diversified Index | 10.63 | 1.84 | 3.25 |
| (1) |
“NAV” (Net Asset Value) total returns do not include the effect of any sales charge. |
KEY FUND STATISTICS (as of May 31, 2026)
| Fund net assets (‘000s) | $14,494 |
| Total number of portfolio holdings | 54 |
| Total advisory fee paid (‘000s) | $34 |
| Portfolio turnover rate as of the end of the reporting period | 150% |
Asset Allocation(1)
| Foreign Government Securities | 99 | % | |
| Commercial Paper | 1 | ||
| Total | 100 | % |
| (1) |
Percentage of total investments as of May 31, 2026. |
What were the Fund costs for the last year?
(Based on a hypothetical $10,000 investment)
| Fund (Class) | Costs of a $10,000 investment | Costs paid as a percentage of a $10,000 investment |
| Virtus Stone Harbor Local Markets Fund Class A / VSHEX |
$134 | 1.27% |
What factors impacted Fund performance over the reporting period?
Foreign exchange ("FX") exposure (a measurement of currency risk) and duration positioning (a measurement of adjusting the portfolio’s sensitivity to changes in interest rates), as well as security selection and taxes, all contributed to performance relative to the J.P. Morgan GBI-EM Global Diversified Index (the "Index") for the 12 months ended May 31, 2026. In FX, overweights in the Hungarian forint and Brazilian real and underweights in the Indonesian rupiah and Thai baht all enhanced performance. An overweight exposure in the Egyptian pound and underweight in the Colombian peso detracted from performance. Within duration positioning we continued to emphasize countries with attractive real (after-inflation) yields that we believe have sufficient space to further ease policy interest rates. Overweights in South Africa and Mexico were the biggest contributors, while an overweight to Paraguay was a small detractor. Within the Fund’s underweight positions, Thailand was the notable outperformer, while India underperformed.
| FACTOR | IMPACT | SUMMARY |
| South Africa |
Positive |
The Fund’s overweight duration position relative to the Index, as well as issue selection, contributed to relative performance. |
| Mexico |
Positive |
FX and duration overweights, as well as issue selection, contributed to relative performance. |
| India |
Negative |
The Fund’s underweight duration relative to the Index, along with security selection and taxes, detracted from relative performance. |
| Poland | Negative | A duration underweight, as well as issue selection and taxes, all detracted from relative performance. |
The preceding information is the opinion of portfolio management only through the end of the period stated. Any such opinions are subject to change at any time based upon market or other conditions and should not be relied upon as investment advice. Performance figures assume reinvestment of distributions and exclude the effect of sales charges. Performance data quoted represents past results. Past performance is no guarantee of future results, and there is no guarantee that market forecasts will be realized.
How has the Fund historically performed?
The following graph compares the initial and subsequent account values at the end of each of the most recently completed fiscal years of Class A shares from inception (April 11, 2022) including any applicable sales charges or fees. It assumes a $10,000 initial investment from inception, in appropriate broad-based securities market and style-specific indexes for the same period. Performance assumes reinvestment of dividends and capital gain distributions.
GROWTH OF $10,000
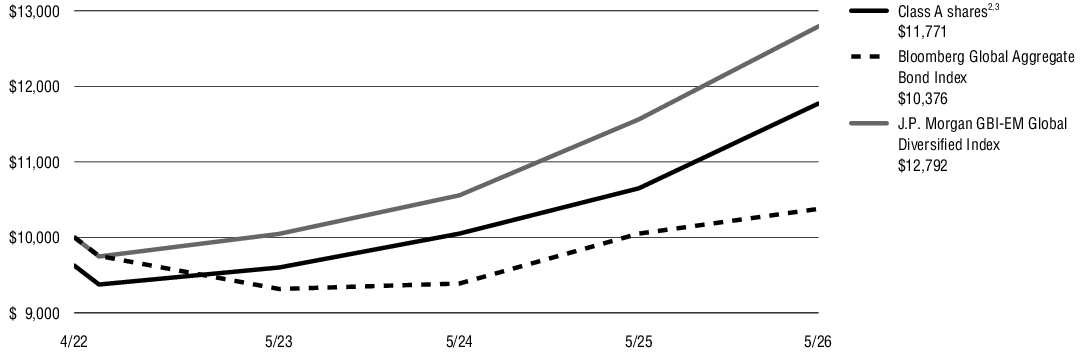
| AVERAGE ANNUAL TOTAL RETURNS for periods ended 5/31/26 | 1 Year | Since Inception |
| Virtus Stone Harbor Local Markets Fund (Class A/VSHEX) at NAV(1) | 10.54% | 4.99% |
| Virtus Stone Harbor Local Markets Fund (Class A/VSHEX) at POP(2),(3) | 6.39 | 4.02 |
| Bloomberg Global Aggregate Bond Index | 3.26 | 0.90 |
| J.P. Morgan GBI-EM Global Diversified Index | 10.63 | 6.14 |
| (1) |
“NAV” (Net Asset Value) total returns do not include the effect of any sales charge. |
| (2) |
“POP” (Public Offering Price) total returns include the effect of the maximum front-end 3.75% sales charge. |
| (3) |
“CDSC” (contingent deferred sales charge) is applied to redemptions of certain classes of shares that do not have a sales charge applied at the time of purchase. A CDSC may be imposed on certain redemptions of Class A shares made within 18 months of a finder’s fee being paid. |
KEY FUND STATISTICS (as of May 31, 2026)
| Fund net assets (‘000s) | $14,494 |
| Total number of portfolio holdings | 54 |
| Total advisory fee paid (‘000s) | $34 |
| Portfolio turnover rate as of the end of the reporting period | 150% |
Asset Allocation(1)
| Foreign Government Securities | 99 | % | |
| Commercial Paper | 1 | ||
| Total | 100 | % |
| (1) |
Percentage of total investments as of May 31, 2026. |