CNA Financial Corporation Second Quarter 2026 Results August 3, 2026
Notices and Disclaimers Forward Looking Statements The statements made in the course of this presentation and/or contained in the presentation materials may include statements that relate to anticipated future events (forward-looking statements) rather than actual present conditions or historical events. These statements are made pursuant to the safe harbor provisions of the Private Securities Litigation Reform Act of 1995 and generally include words such as “believes,” “expects,” “intends,” “anticipates,” “estimates” and similar expressions. Forward-looking statements, by their nature, are subject to a variety of inherent risks and uncertainties that could cause actual results to differ materially from the results projected. Many of these risks and uncertainties cannot be controlled by CNA. For a detailed description of these risks and uncertainties, please refer to CNA’s filings with the Securities and Exchange Commission available at cna.com. Any forward-looking statements and other financial information contained in this presentation speak only as of the date hereof. Further, CNA does not have any obligation to update or revise any forward-looking statement made in the course of this presentation and/or contained in the presentation materials even if CNA’s expectations or any related events, conditions or circumstances change. Reconciliation of GAAP Measures to Non-GAAP Measures This earnings presentation contains financial measures that are not in accordance with accounting principles generally accepted in the United States of America (GAAP). Management utilizes these financial measures to monitor the Company's insurance operations and investment portfolio. The Company believes the presentation of these measures provides investors with a better understanding of the significant factors that comprise the Company's operating performance. Reconciliations of these measures to the most comparable GAAP measures can be found in the Appendix to this presentation. For additional information, please refer to CNA's filings with the Securities and Exchange Commission, available at cna.com Available Information and Risk Factors CNA files annual, quarterly and current reports and other information with the SEC. The SEC filings are available on the CNA website (cna.com) and at the SEC's website (sec.gov). These filings describe some of the more material risks we face and how these risks could lead to events or circumstances that may have a material adverse effect on our business, financial condition, results of operations or cash flows. You should review these filings as they contain important information about CNA and its business. "CNA" is a registered trademark of CNA Financial Corporation. Certain CNA Financial Corporation subsidiaries use the "CNA" trademark in connection with insurance underwriting and claims activities. Copyright © 2026 CNA. All rights reserved. 2
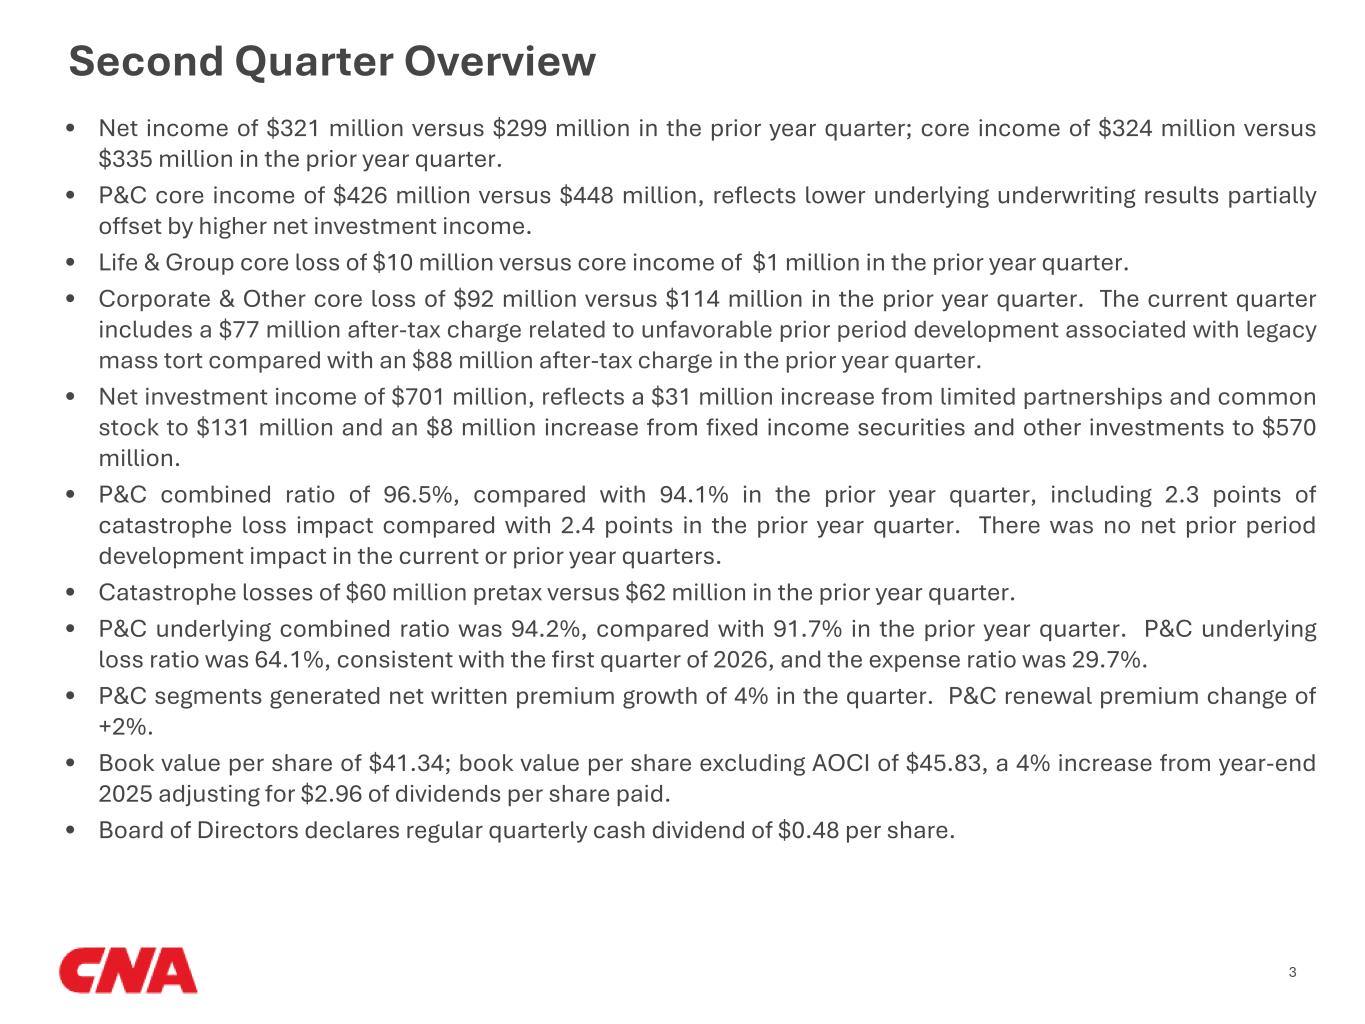
Second Quarter Overview • Net income of $321 million versus $299 million in the prior year quarter; core income of $324 million versus $335 million in the prior year quarter. • P&C core income of $426 million versus $448 million, reflects lower underlying underwriting results partially offset by higher net investment income. • Life & Group core loss of $10 million versus core income of $1 million in the prior year quarter. • Corporate & Other core loss of $92 million versus $114 million in the prior year quarter. The current quarter includes a $77 million after-tax charge related to unfavorable prior period development associated with legacy mass tort compared with an $88 million after-tax charge in the prior year quarter. • Net investment income of $701 million, reflects a $31 million increase from limited partnerships and common stock to $131 million and an $8 million increase from fixed income securities and other investments to $570 million. • P&C combined ratio of 96.5%, compared with 94.1% in the prior year quarter, including 2.3 points of catastrophe loss impact compared with 2.4 points in the prior year quarter. There was no net prior period development impact in the current or prior year quarters. • Catastrophe losses of $60 million pretax versus $62 million in the prior year quarter. • P&C underlying combined ratio was 94.2%, compared with 91.7% in the prior year quarter. P&C underlying loss ratio was 64.1%, consistent with the first quarter of 2026, and the expense ratio was 29.7%. • P&C segments generated net written premium growth of 4% in the quarter. P&C renewal premium change of +2%. • Book value per share of $41.34; book value per share excluding AOCI of $45.83, a 4% increase from year-end 2025 adjusting for $2.96 of dividends per share paid. • Board of Directors declares regular quarterly cash dividend of $0.48 per share. 3
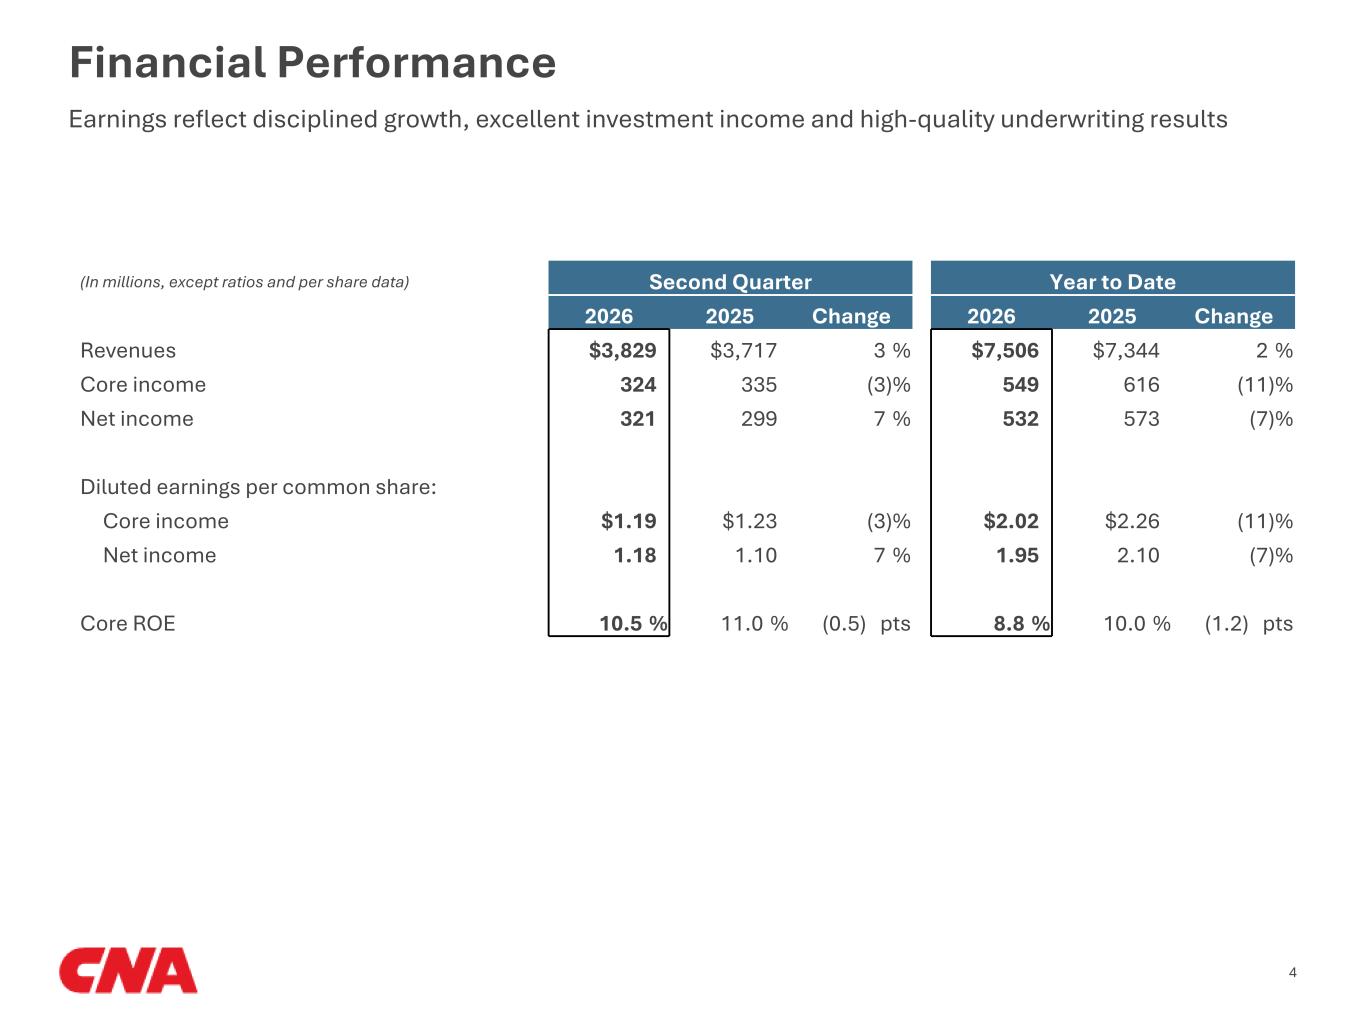
Financial Performance 4 (In millions, except ratios and per share data) Second Quarter Year to Date 2026 2025 Change 2026 2025 Change Revenues $3,829 $3,717 3 % $7,506 $7,344 2 % Core income 324 335 (3) % 549 616 (11) % Net income 321 299 7 % 532 573 (7) % Diluted earnings per common share: Core income $1.19 $1.23 (3) % $2.02 $2.26 (11) % Net income 1.18 1.10 7 % 1.95 2.10 (7) % Core ROE 10.5 % 11.0 % (0.5) pts 8.8 % 10.0 % (1.2) pts Earnings reflect disciplined growth, excellent investment income and high-quality underwriting results
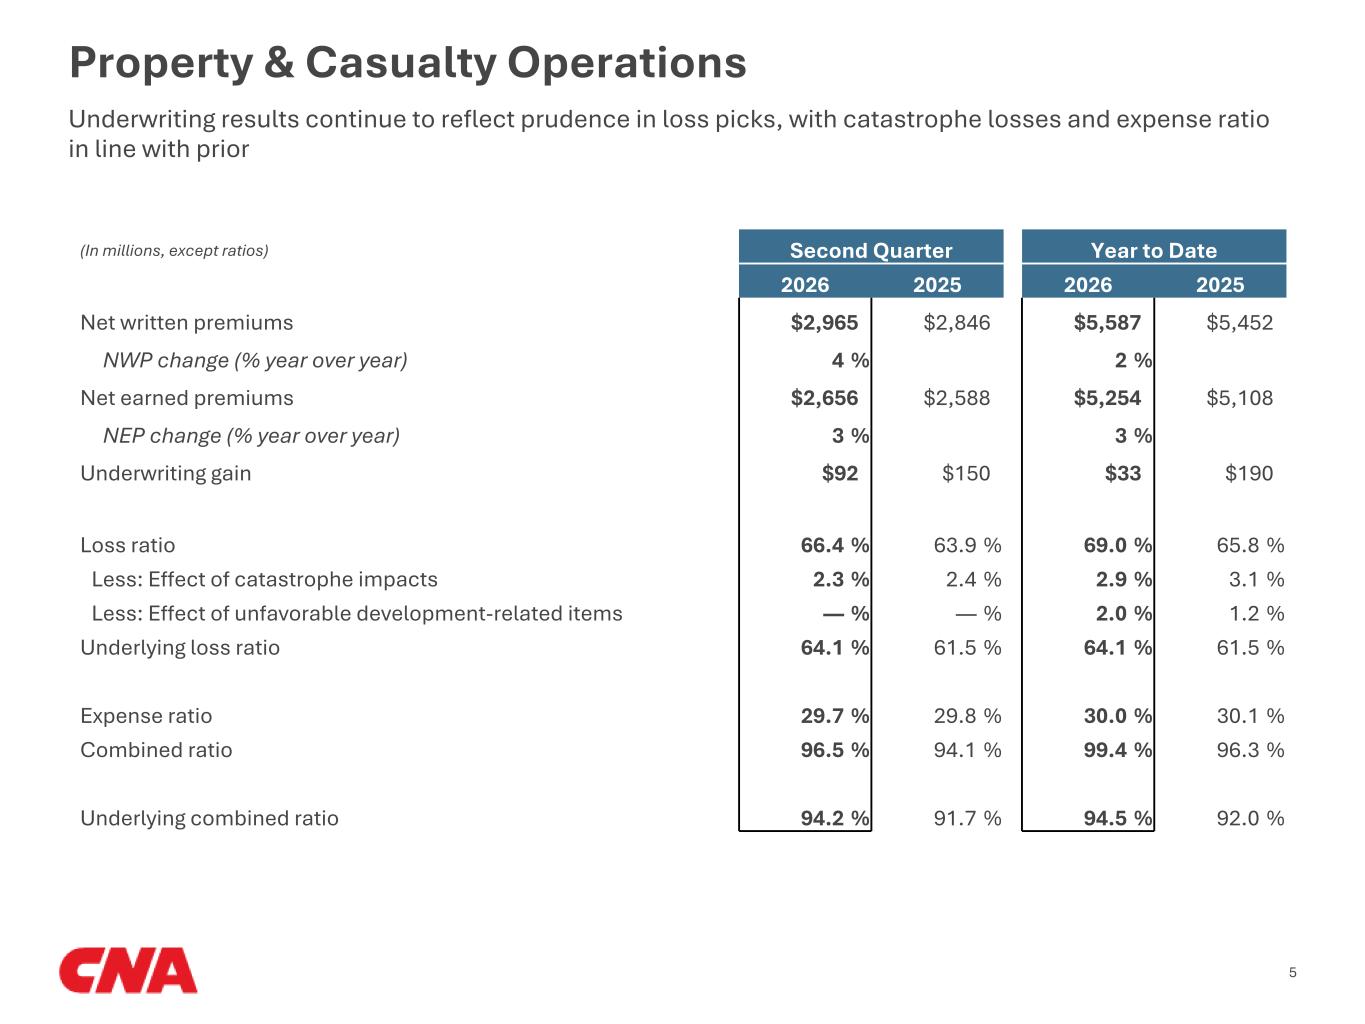
Underwriting results continue to reflect prudence in loss picks, with catastrophe losses and expense ratio in line with prior Property & Casualty Operations 5 (In millions, except ratios) Second Quarter Year to Date 2026 2025 2026 2025 Net written premiums $2,965 $2,846 $5,587 $5,452 NWP change (% year over year) 4 % 2 % Net earned premiums $2,656 $2,588 $5,254 $5,108 NEP change (% year over year) 3 % 3 % Underwriting gain $92 $150 $33 $190 Loss ratio 66.4 % 63.9 % 69.0 % 65.8 % Less: Effect of catastrophe impacts 2.3 % 2.4 % 2.9 % 3.1 % Less: Effect of unfavorable development-related items — % — % 2.0 % 1.2 % Underlying loss ratio 64.1 % 61.5 % 64.1 % 61.5 % Expense ratio 29.7 % 29.8 % 30.0 % 30.1 % Combined ratio 96.5 % 94.1 % 99.4 % 96.3 % Underlying combined ratio 94.2 % 91.7 % 94.5 % 92.0 %
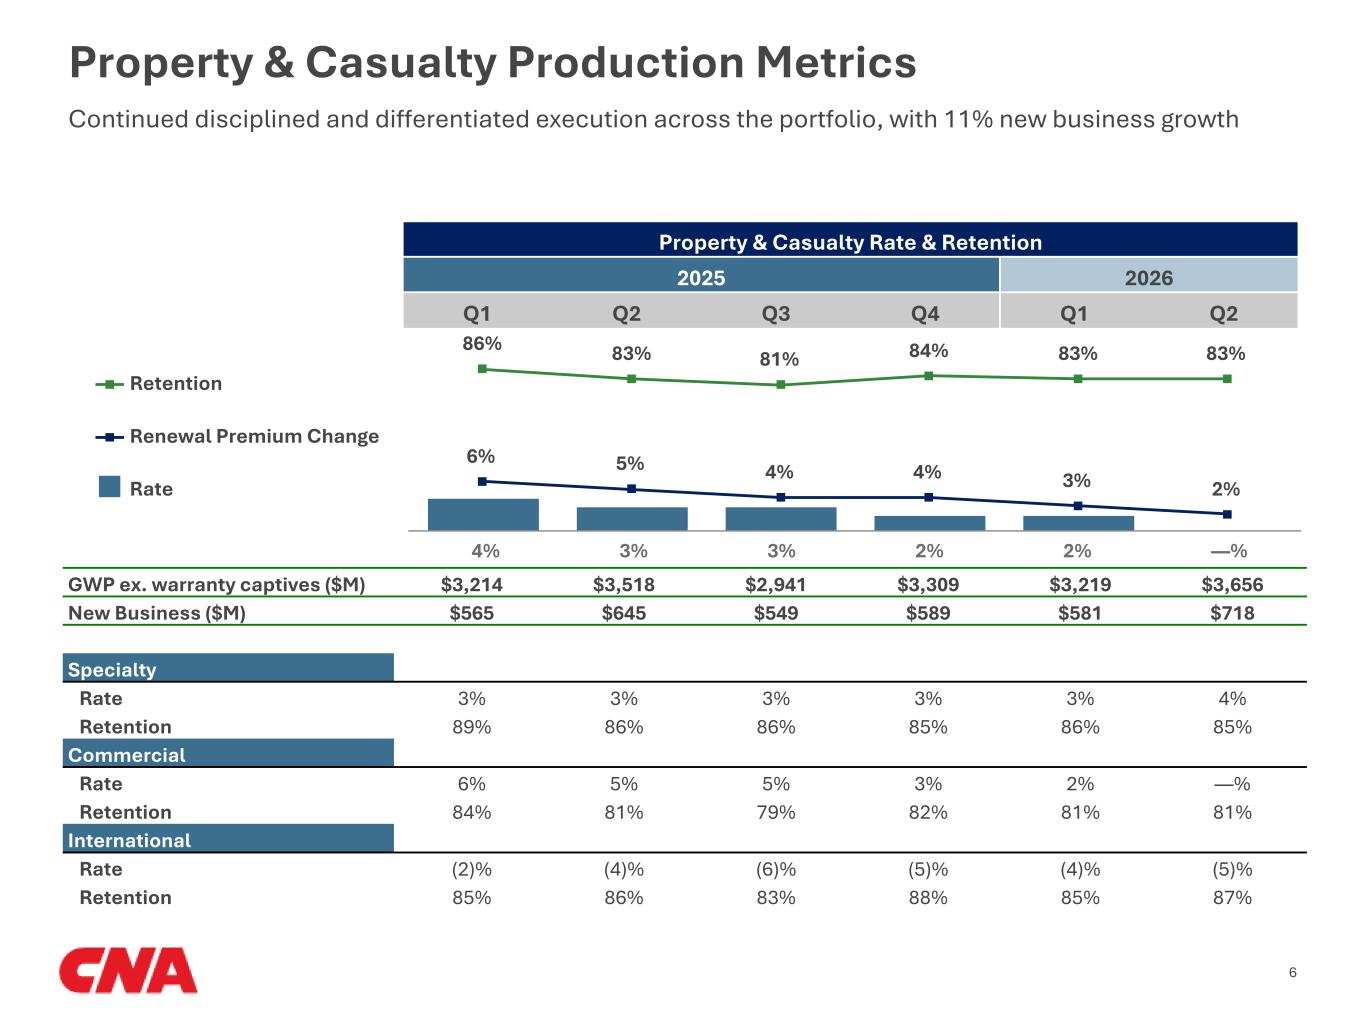
Property & Casualty Production Metrics Continued disciplined and differentiated execution across the portfolio, with 11% new business growth 6 Property & Casualty Rate & Retention 2025 2026 Q1 Q2 Q3 Q4 Q1 Q2 6% 5% 4% 4% 3% 2% 86% 83% 81% 84% 83% 83% Retention Renewal Premium Change Rate GWP ex. warranty captives ($M) $3,214 $3,518 $2,941 $3,309 $3,219 $3,656 New Business ($M) $565 $645 $549 $589 $581 $718 Specialty Rate 3% 3% 3% 3% 3% 4% Retention 89% 86% 86% 85% 86% 85% Commercial Rate 6% 5% 5% 3% 2% —% Retention 84% 81% 79% 82% 81% 81% International Rate (2)% (4)% (6)% (5)% (4)% (5)% Retention 85% 86% 83% 88% 85% 87% 4% 3% 3% 2% 2% —%
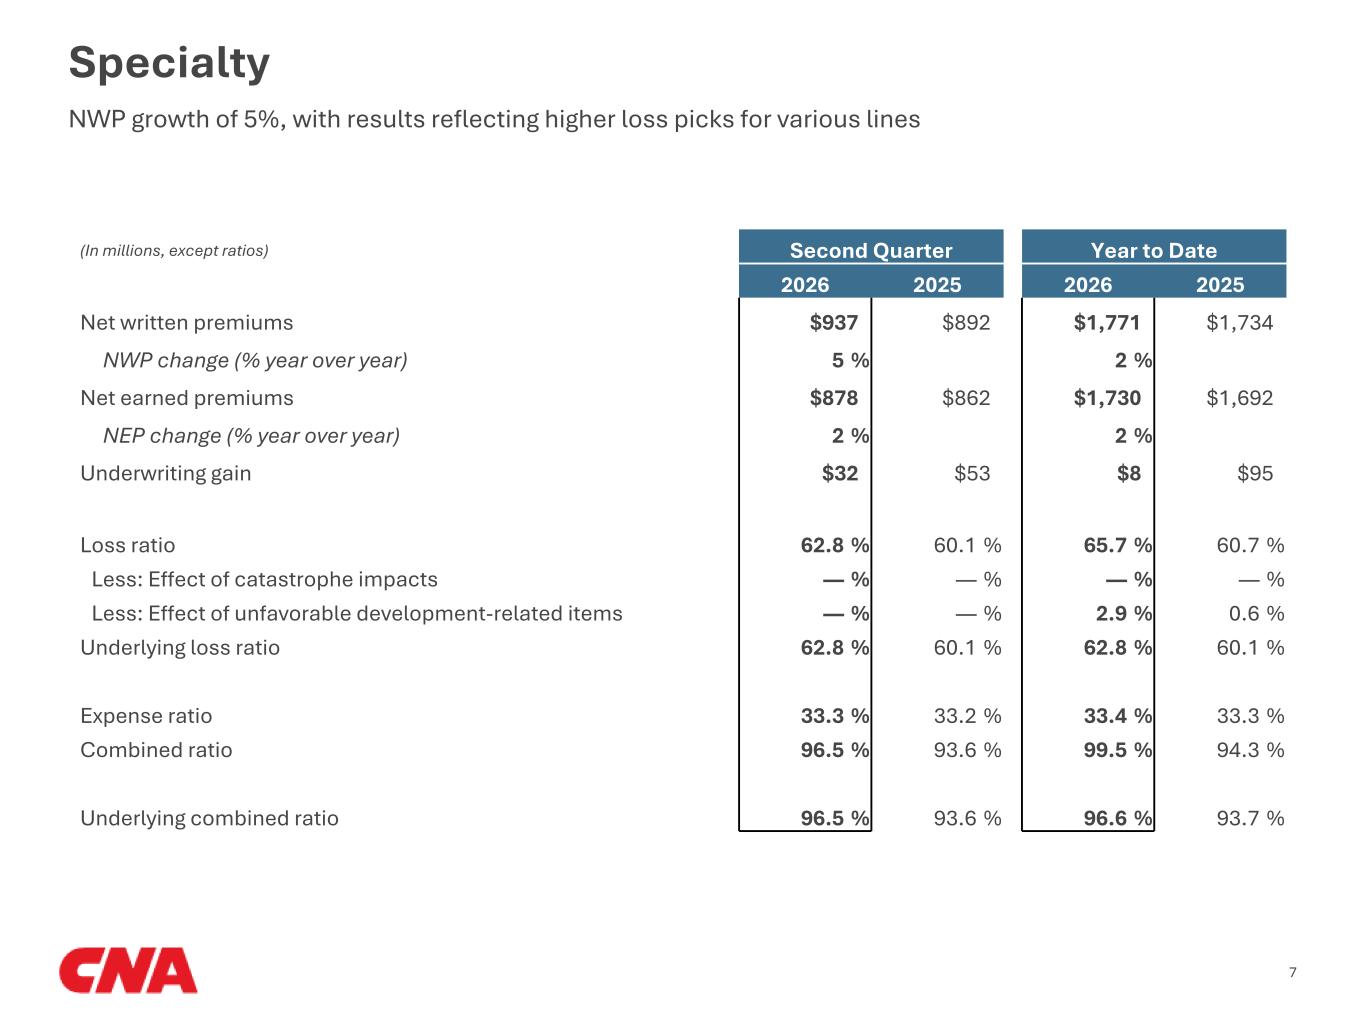
NWP growth of 5%, with results reflecting higher loss picks for various lines Specialty 7 (In millions, except ratios) Second Quarter Year to Date 2026 2025 2026 2025 Net written premiums $937 $892 $1,771 $1,734 NWP change (% year over year) 5 % 2 % Net earned premiums $878 $862 $1,730 $1,692 NEP change (% year over year) 2 % 2 % Underwriting gain $32 $53 $8 $95 Loss ratio 62.8 % 60.1 % 65.7 % 60.7 % Less: Effect of catastrophe impacts — % — % — % — % Less: Effect of unfavorable development-related items — % — % 2.9 % 0.6 % Underlying loss ratio 62.8 % 60.1 % 62.8 % 60.1 % Expense ratio 33.3 % 33.2 % 33.4 % 33.3 % Combined ratio 96.5 % 93.6 % 99.5 % 94.3 % Underlying combined ratio 96.5 % 93.6 % 96.6 % 93.7 %
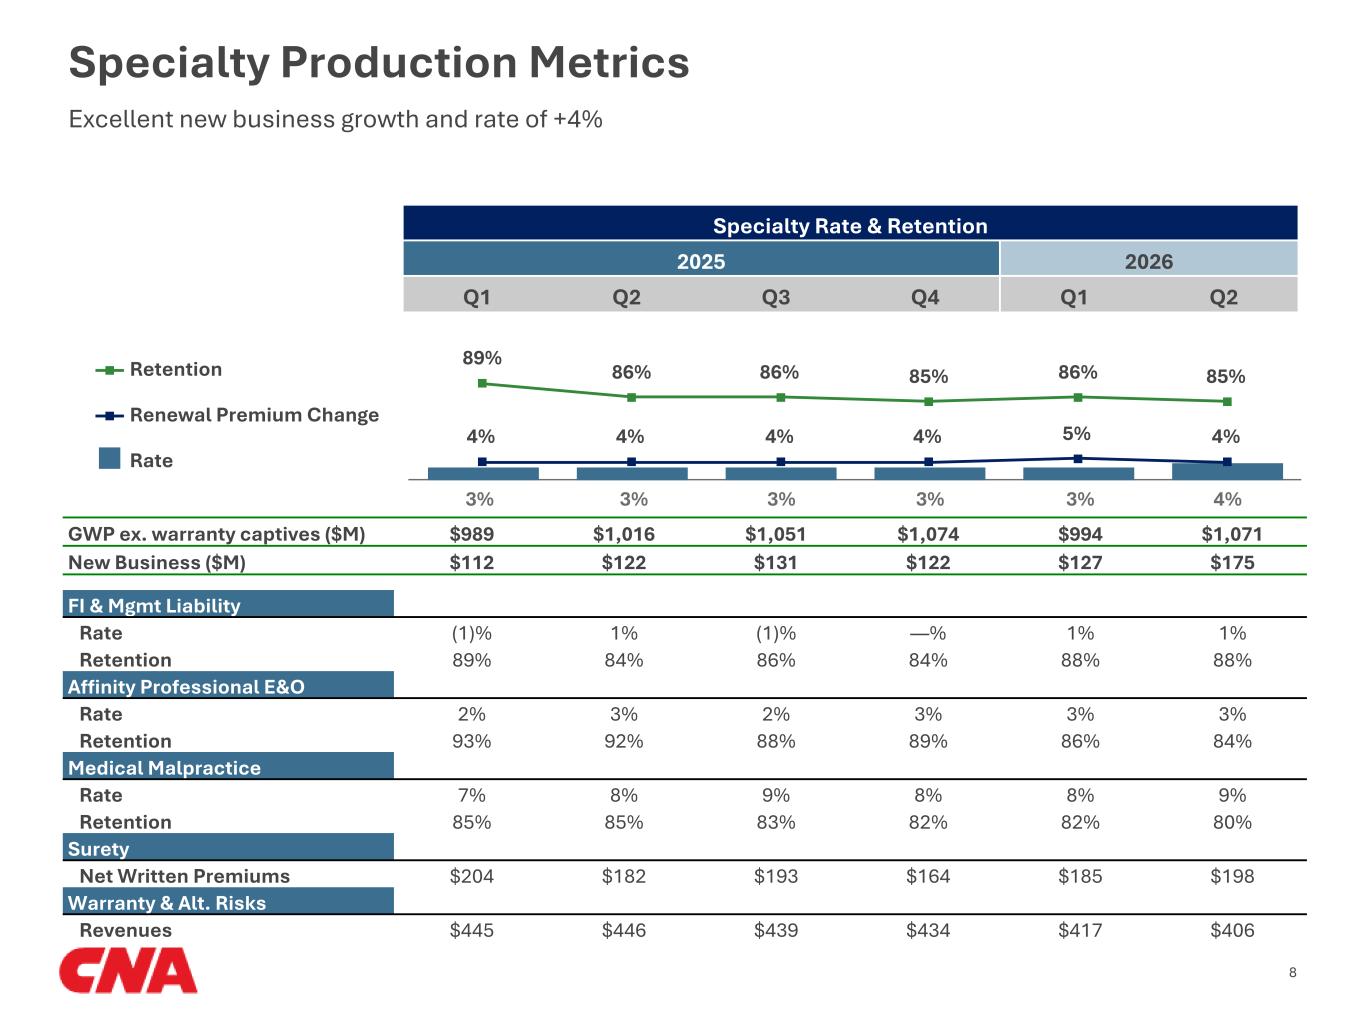
Specialty Production Metrics Excellent new business growth and rate of +4% 8 Specialty Rate & Retention 2025 2026 Q1 Q2 Q3 Q4 Q1 Q2 4% 4% 4% 4% 5% 4% 89% 86% 86% 85% 86% 85%Retention Renewal Premium Change Rate GWP ex. warranty captives ($M) $989 $1,016 $1,051 $1,074 $994 $1,071 New Business ($M) $112 $122 $131 $122 $127 $175 FI & Mgmt Liability Rate (1)% 1% (1)% —% 1% 1% Retention 89% 84% 86% 84% 88% 88% Affinity Professional E&O Rate 2% 3% 2% 3% 3% 3% Retention 93% 92% 88% 89% 86% 84% Medical Malpractice Rate 7% 8% 9% 8% 8% 9% Retention 85% 85% 83% 82% 82% 80% Surety Net Written Premiums $204 $182 $193 $164 $185 $198 Warranty & Alt. Risks Revenues $445 $446 $439 $434 $417 $406 3%3% 3% 3% 3% 4%
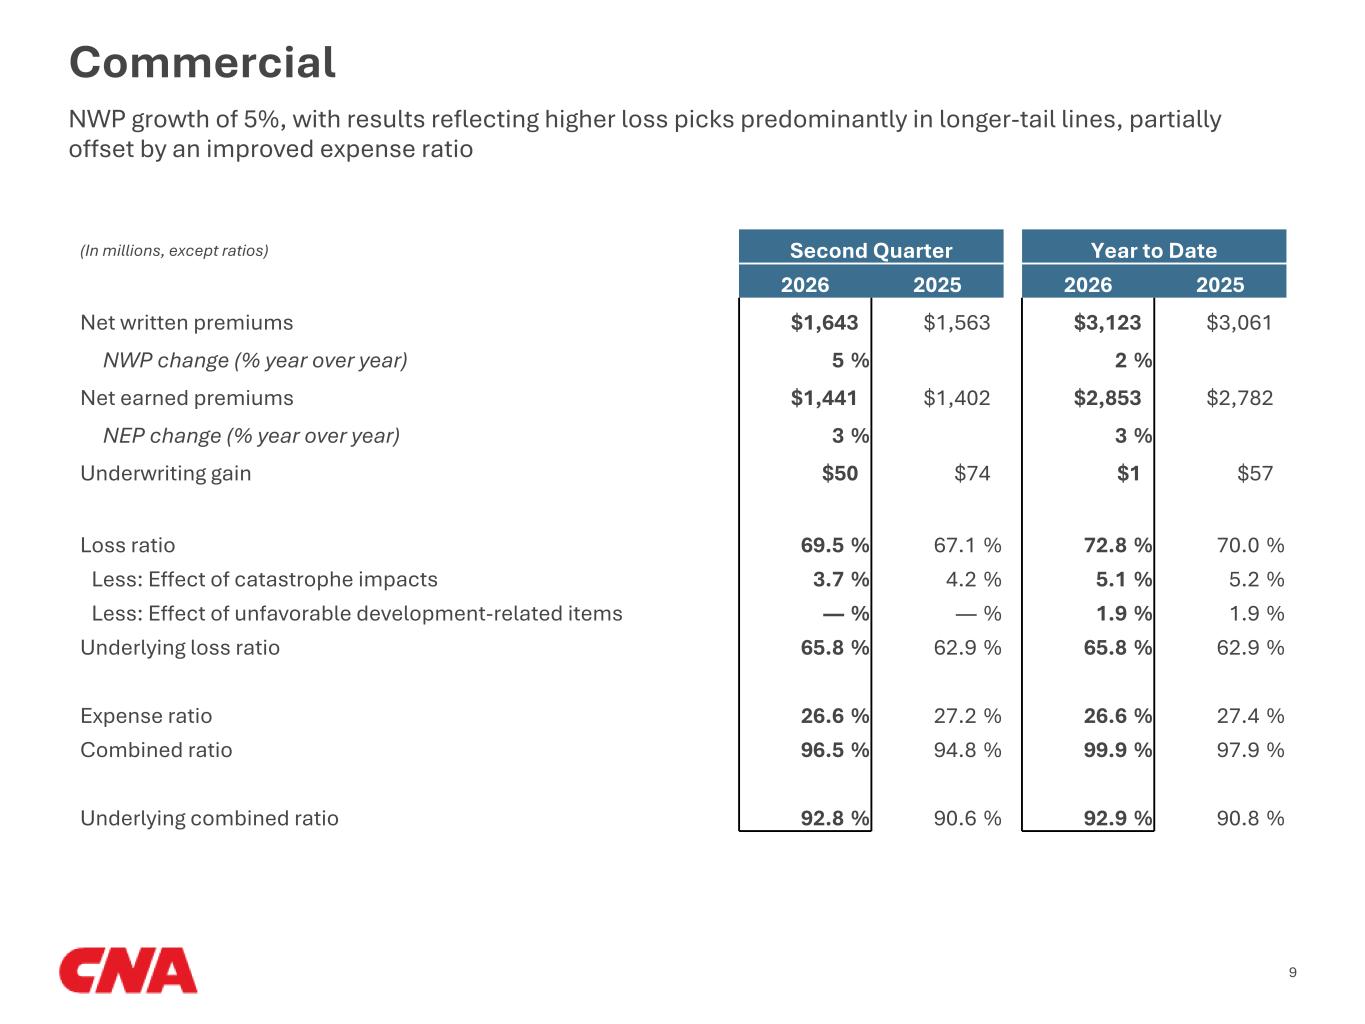
Commercial 9 (In millions, except ratios) Second Quarter Year to Date 2026 2025 2026 2025 Net written premiums $1,643 $1,563 $3,123 $3,061 NWP change (% year over year) 5 % 2 % Net earned premiums $1,441 $1,402 $2,853 $2,782 NEP change (% year over year) 3 % 3 % Underwriting gain $50 $74 $1 $57 Loss ratio 69.5 % 67.1 % 72.8 % 70.0 % Less: Effect of catastrophe impacts 3.7 % 4.2 % 5.1 % 5.2 % Less: Effect of unfavorable development-related items — % — % 1.9 % 1.9 % Underlying loss ratio 65.8 % 62.9 % 65.8 % 62.9 % Expense ratio 26.6 % 27.2 % 26.6 % 27.4 % Combined ratio 96.5 % 94.8 % 99.9 % 97.9 % Underlying combined ratio 92.8 % 90.6 % 92.9 % 90.8 % NWP growth of 5%, with results reflecting higher loss picks predominantly in longer-tail lines, partially offset by an improved expense ratio
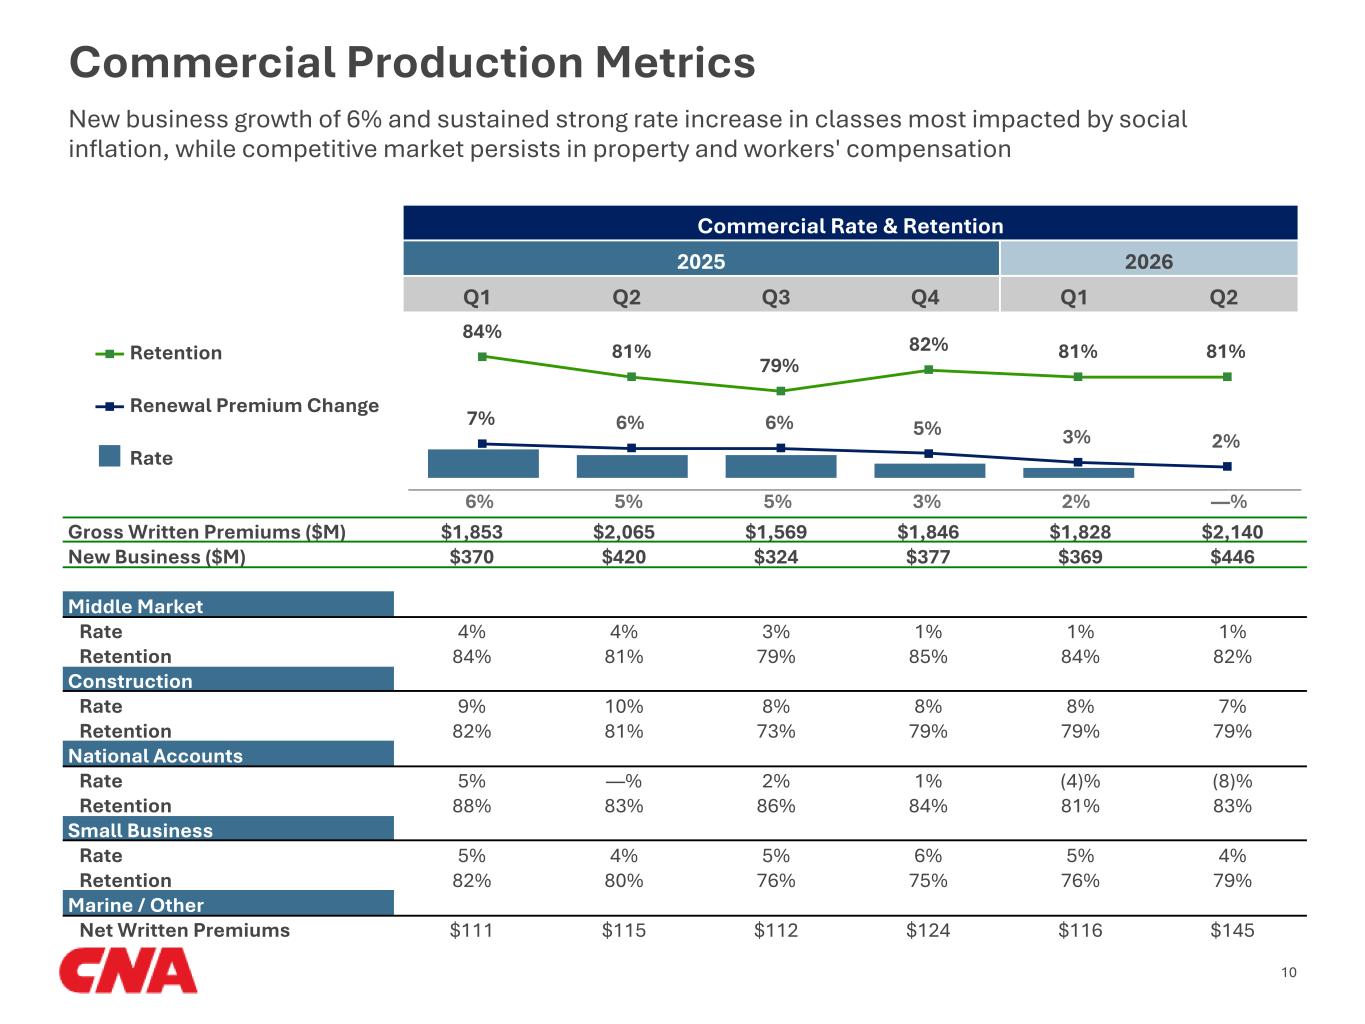
Commercial Production Metrics 10 Commercial Rate & Retention 2025 2026 Q1 Q2 Q3 Q4 Q1 Q2 7% 6% 6% 5% 3% 2% 84% 81% 79% 82% 81% 81%Retention Renewal Premium Change Rate Gross Written Premiums ($M) $1,853 $2,065 $1,569 $1,846 $1,828 $2,140 New Business ($M) $370 $420 $324 $377 $369 $446 Middle Market Rate 4% 4% 3% 1% 1% 1% Retention 84% 81% 79% 85% 84% 82% Construction Rate 9% 10% 8% 8% 8% 7% Retention 82% 81% 73% 79% 79% 79% National Accounts Rate 5% —% 2% 1% (4)% (8)% Retention 88% 83% 86% 84% 81% 83% Small Business Rate 5% 4% 5% 6% 5% 4% Retention 82% 80% 76% 75% 76% 79% Marine / Other Net Written Premiums $111 $115 $112 $124 $116 $145 New business growth of 6% and sustained strong rate increase in classes most impacted by social inflation, while competitive market persists in property and workers' compensation 6% —%5% 5% 3% 2%
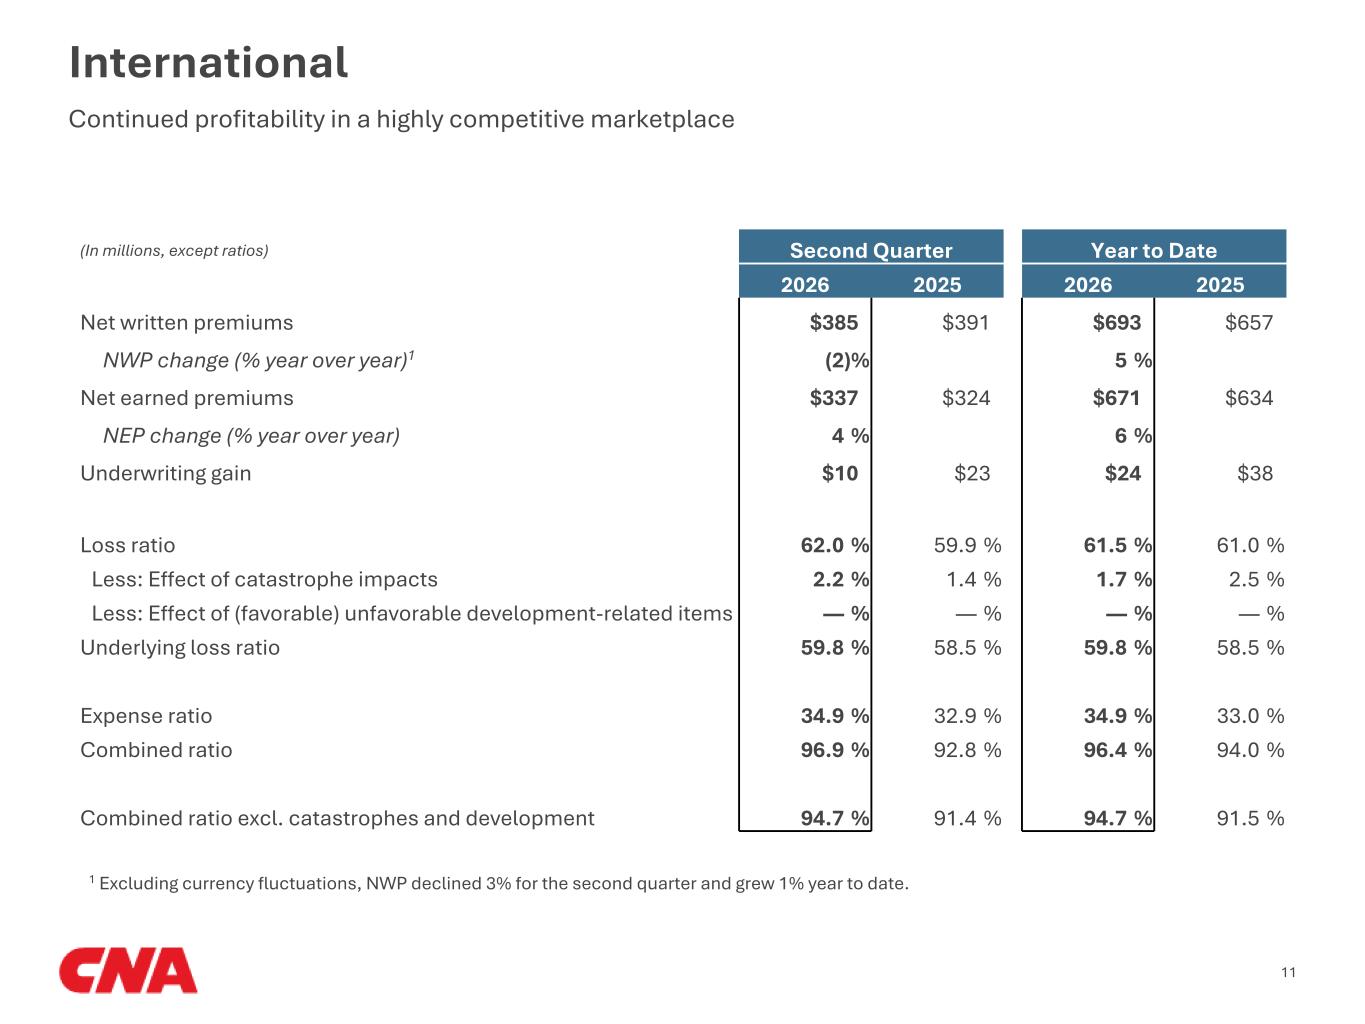
International Continued profitability in a highly competitive marketplace 11 (In millions, except ratios) Second Quarter Year to Date 2026 2025 2026 2025 Net written premiums $385 $391 $693 $657 NWP change (% year over year)1 (2) % 5 % Net earned premiums $337 $324 $671 $634 NEP change (% year over year) 4 % 6 % Underwriting gain $10 $23 $24 $38 Loss ratio 62.0 % 59.9 % 61.5 % 61.0 % Less: Effect of catastrophe impacts 2.2 % 1.4 % 1.7 % 2.5 % Less: Effect of (favorable) unfavorable development-related items — % — % — % — % Underlying loss ratio 59.8 % 58.5 % 59.8 % 58.5 % Expense ratio 34.9 % 32.9 % 34.9 % 33.0 % Combined ratio 96.9 % 92.8 % 96.4 % 94.0 % Combined ratio excl. catastrophes and development 94.7 % 91.4 % 94.7 % 91.5 % 1 Excluding currency fluctuations, NWP declined 3% for the second quarter and grew 1% year to date.
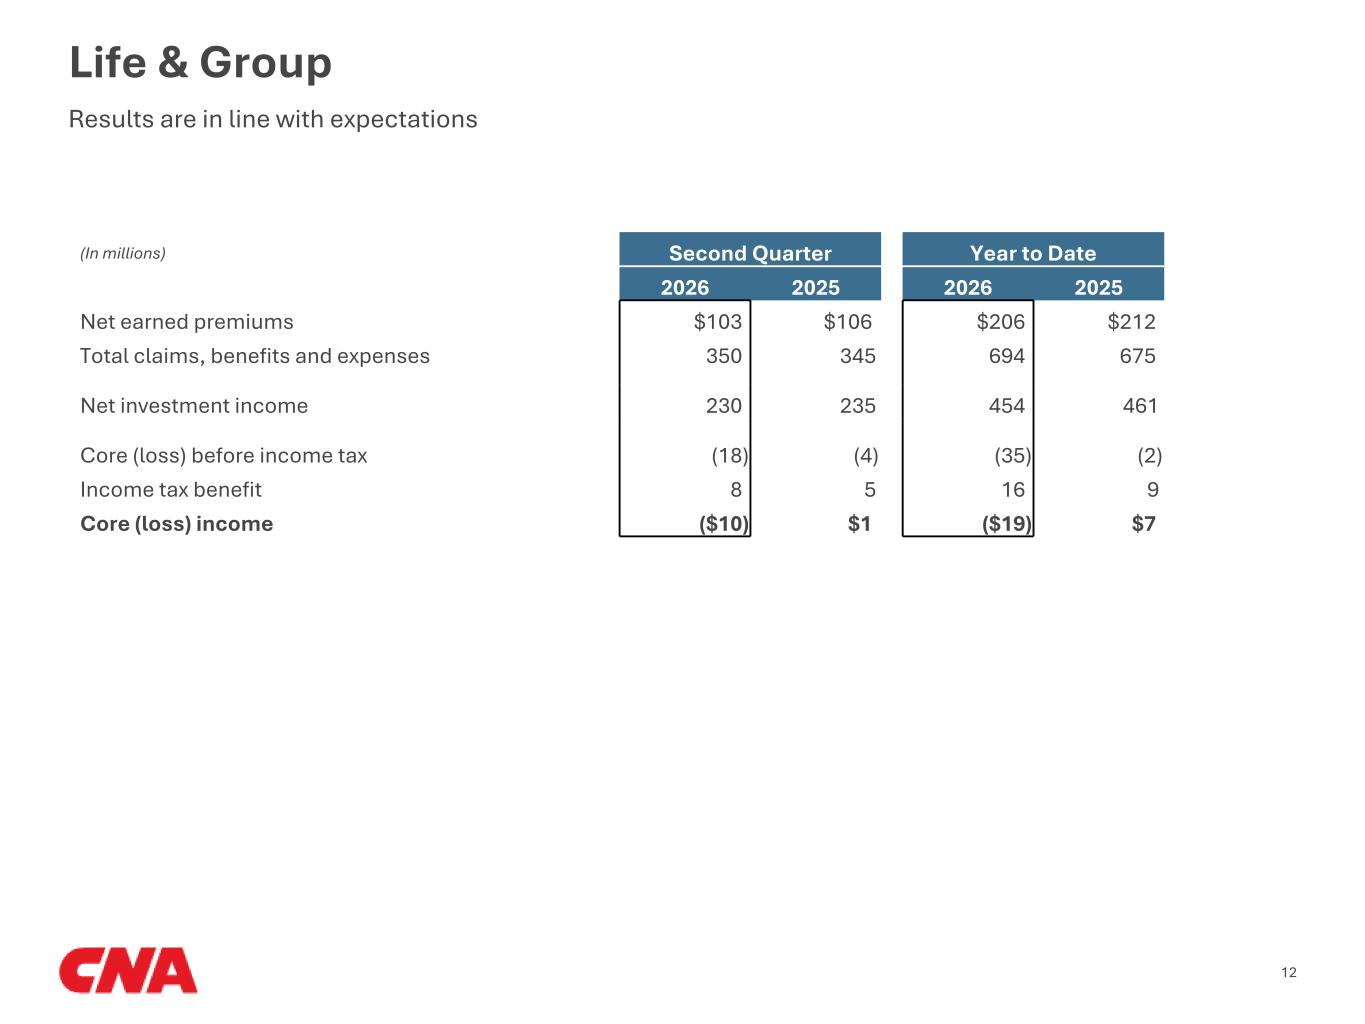
Results are in line with expectations Life & Group 12 (In millions) Second Quarter Year to Date 2026 2025 2026 2025 Net earned premiums $103 $106 $206 $212 Total claims, benefits and expenses 350 345 694 675 Net investment income 230 235 454 461 Core (loss) before income tax (18) (4) (35) (2) Income tax benefit 8 5 16 9 Core (loss) income ($10) $1 ($19) $7
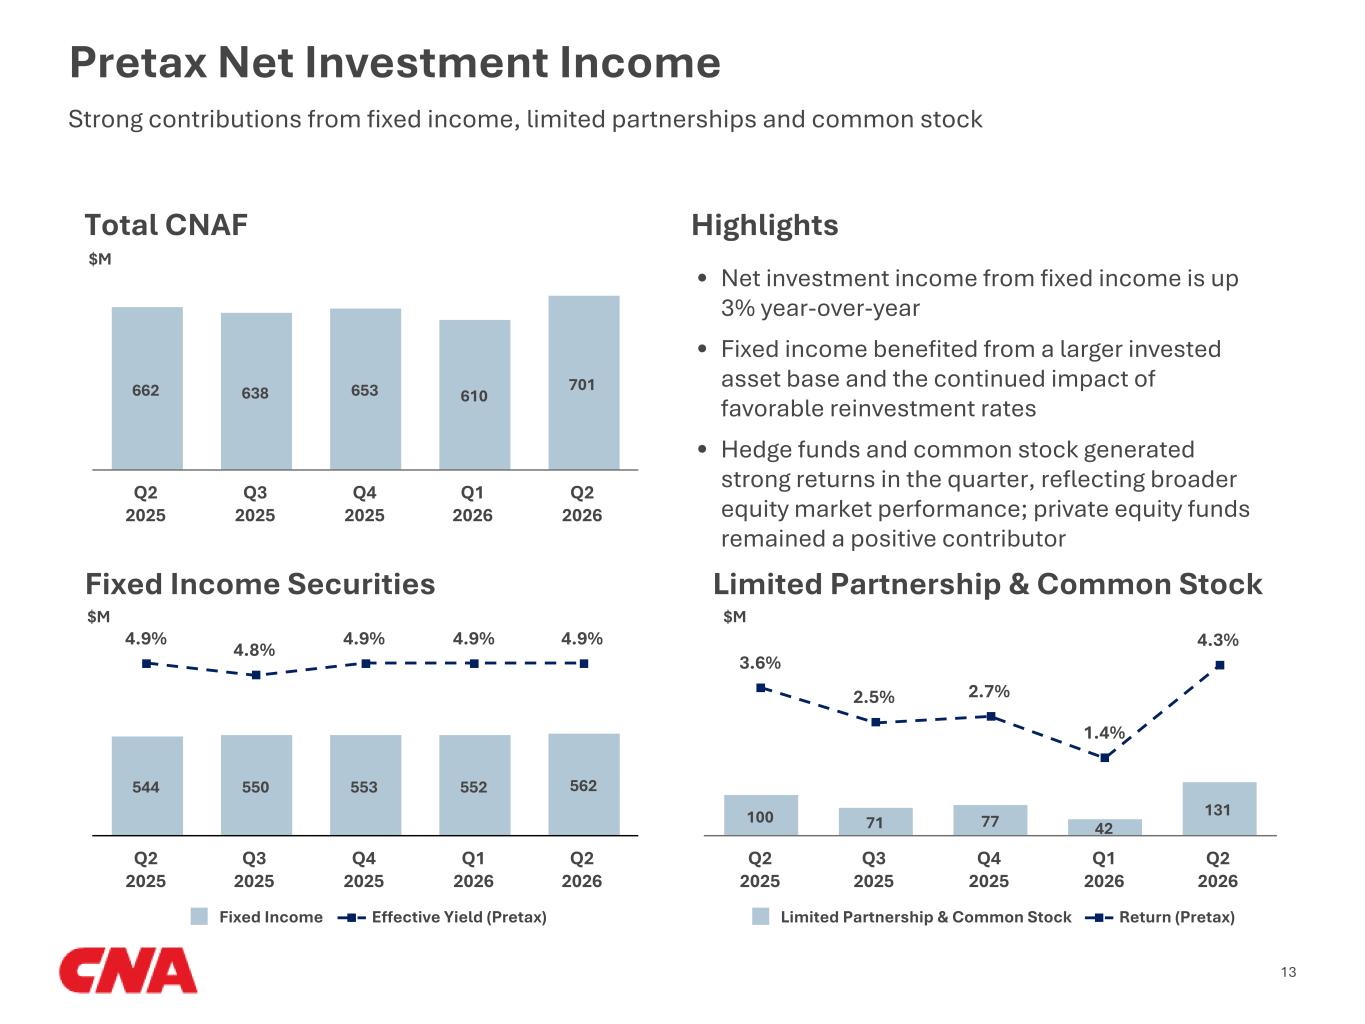
Pretax Net Investment Income Strong contributions from fixed income, limited partnerships and common stock 662 638 653 610 701 Q2 2025 Q3 2025 Q4 2025 Q1 2026 Q2 2026 Total CNAF Limited Partnership & Common Stock Highlights Fixed Income Securities 544 550 553 552 562 4.9% 4.8% 4.9% 4.9% 4.9% Fixed Income Effective Yield (Pretax) Q2 2025 Q3 2025 Q4 2025 Q1 2026 Q2 2026 100 71 77 42 131 3.6% 2.5% 2.7% 1.4% 4.3% Limited Partnership & Common Stock Return (Pretax) Q2 2025 Q3 2025 Q4 2025 Q1 2026 Q2 2026 $M $M $M 13 • Net investment income from fixed income is up 3% year-over-year • Fixed income benefited from a larger invested asset base and the continued impact of favorable reinvestment rates • Hedge funds and common stock generated strong returns in the quarter, reflecting broader equity market performance; private equity funds remained a positive contributor
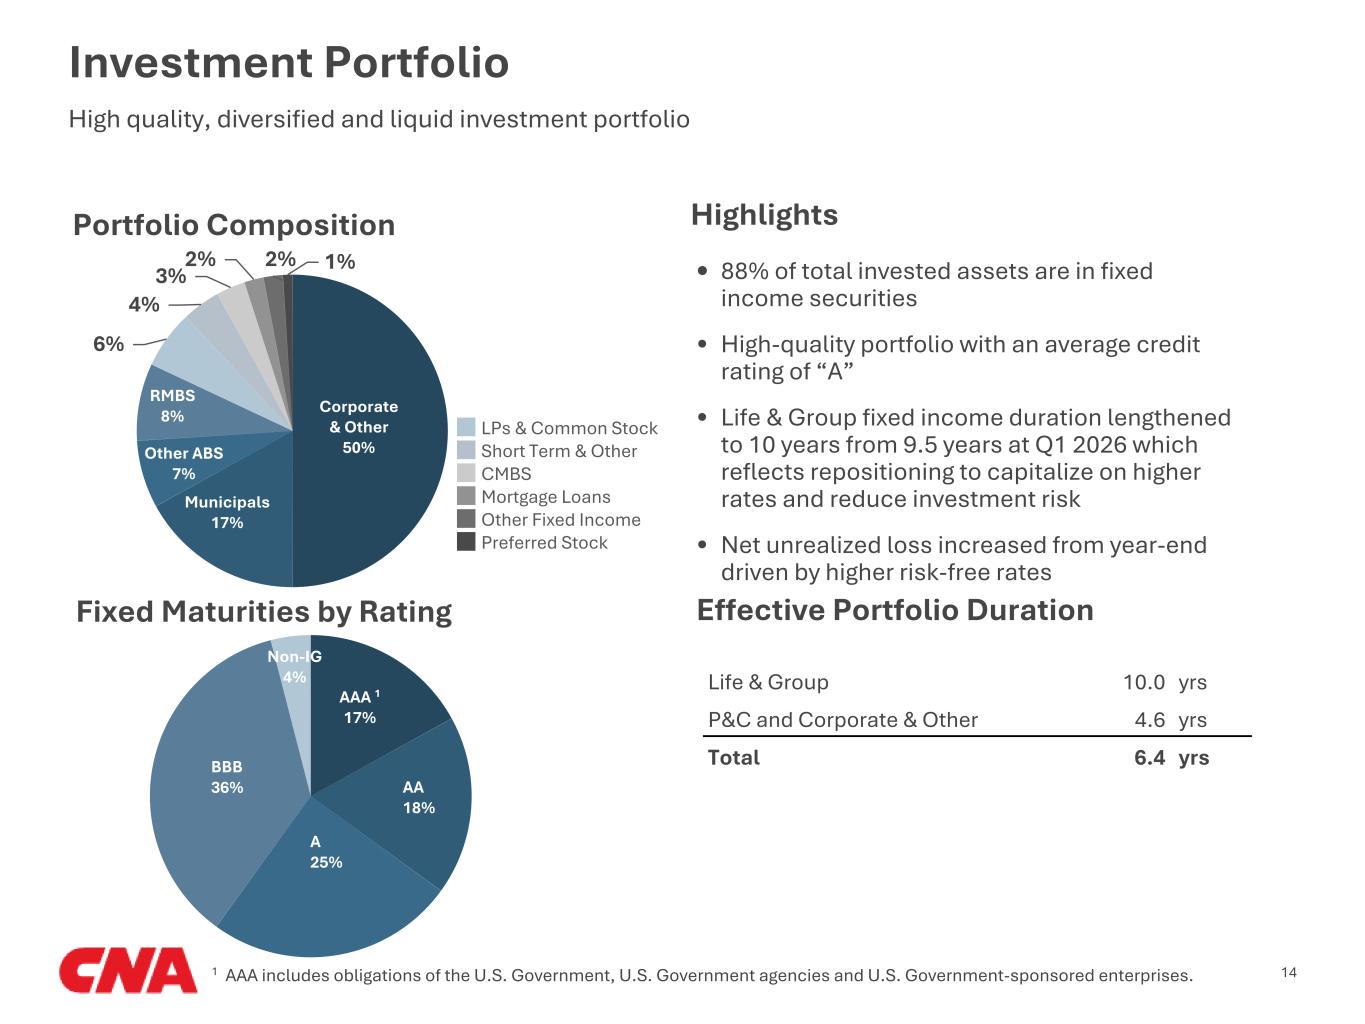
Investment Portfolio 141 AAA includes obligations of the U.S. Government, U.S. Government agencies and U.S. Government-sponsored enterprises. High quality, diversified and liquid investment portfolio • 88% of total invested assets are in fixed income securities • High-quality portfolio with an average credit rating of “A” • Life & Group fixed income duration lengthened to 10 years from 9.5 years at Q1 2026 which reflects repositioning to capitalize on higher rates and reduce investment risk • Net unrealized loss increased from year-end driven by higher risk-free rates 6% 4% 3% 2% 2% 1% LPs & Common Stock Short Term & Other CMBS Mortgage Loans Other Fixed Income Preferred Stock Corporate & Other 50% Municipals 17% Other ABS 7% RMBS 8% Portfolio Composition Highlights Fixed Maturities by Rating AA 18% A 25% BBB 36% AAA 1 17% Non-IG 4% Effective Portfolio Duration Life & Group 10.0 yrs P&C and Corporate & Other 4.6 yrs Total 6.4 yrs
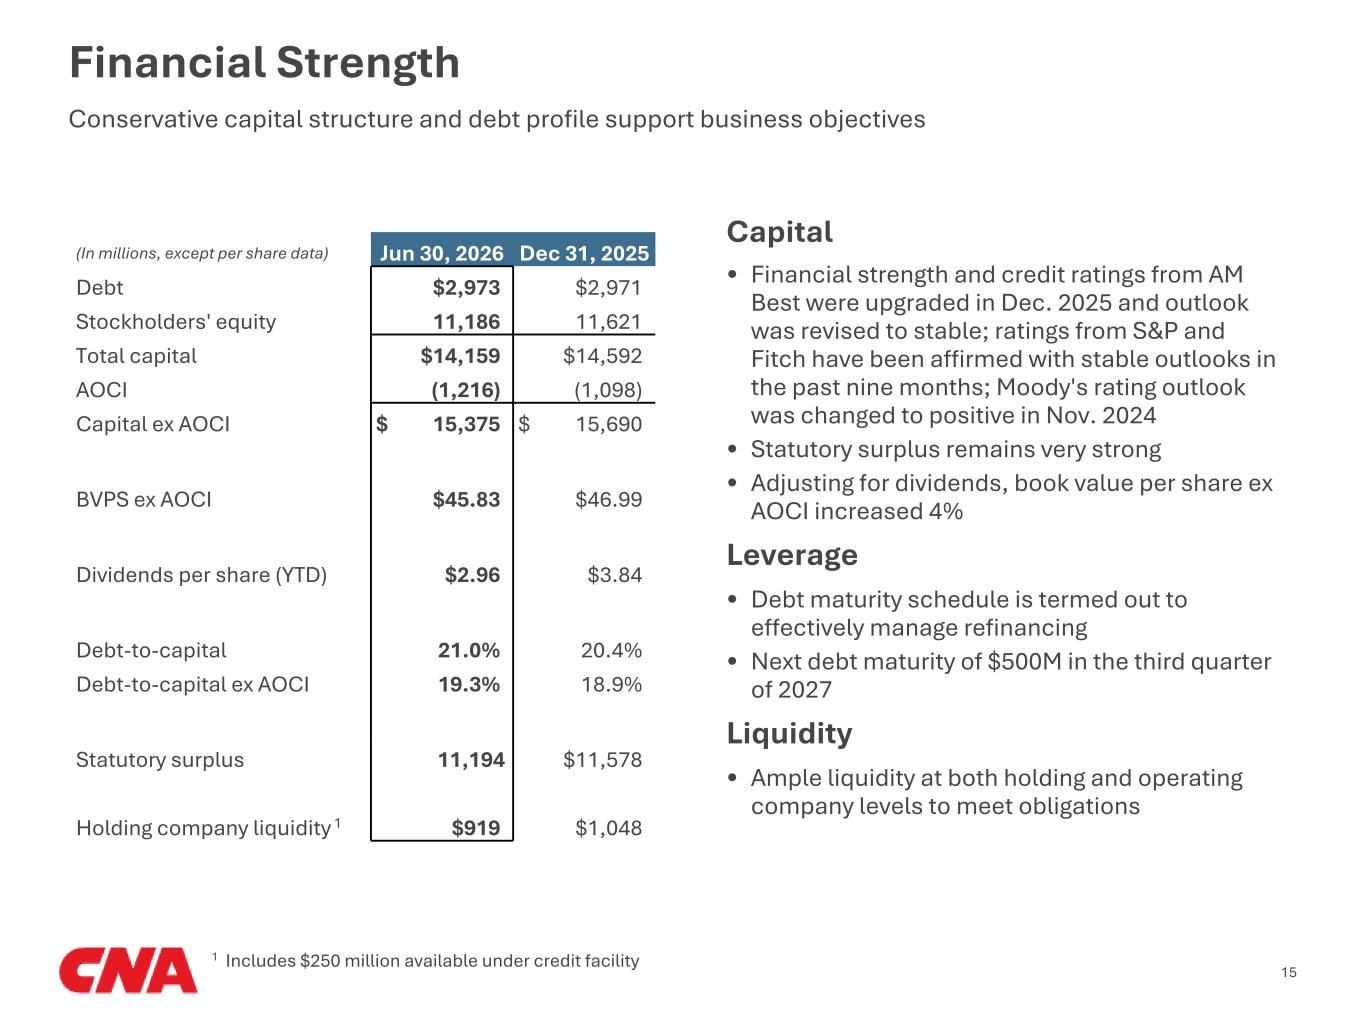
Capital • Financial strength and credit ratings from AM Best were upgraded in Dec. 2025 and outlook was revised to stable; ratings from S&P and Fitch have been affirmed with stable outlooks in the past nine months; Moody's rating outlook was changed to positive in Nov. 2024 • Statutory surplus remains very strong • Adjusting for dividends, book value per share ex AOCI increased 4% Leverage • Debt maturity schedule is termed out to effectively manage refinancing • Next debt maturity of $500M in the third quarter of 2027 Liquidity • Ample liquidity at both holding and operating company levels to meet obligations Financial Strength Conservative capital structure and debt profile support business objectives (In millions, except per share data) Jun 30, 2026 Dec 31, 2025 Debt $2,973 $2,971 Stockholders' equity 11,186 11,621 Total capital $14,159 $14,592 AOCI (1,216) (1,098) Capital ex AOCI $ 15,375 $ 15,690 BVPS ex AOCI $45.83 $46.99 Dividends per share (YTD) $2.96 $3.84 Debt-to-capital 21.0 % 20.4 % Debt-to-capital ex AOCI 19.3 % 18.9 % Statutory surplus 11,194 $11,578 Holding company liquidity 1 $919 $1,048 15 1 Includes $250 million available under credit facility
APPENDIX 16
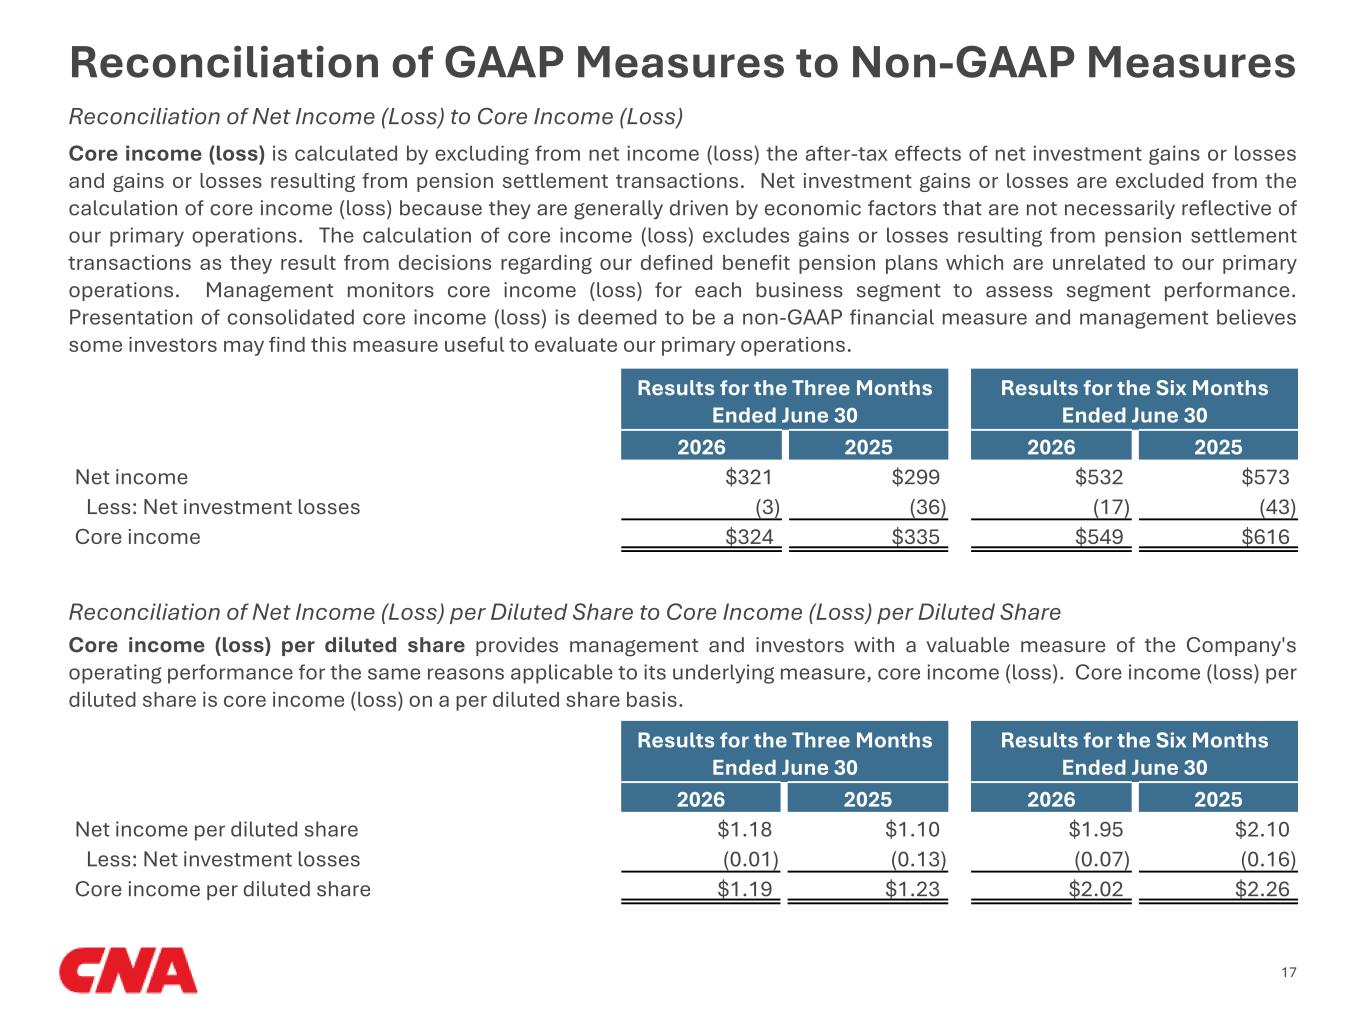
Results for the Three Months Ended June 30 Results for the Six Months Ended June 30 2026 2025 2026 2025 Net income $321 $299 $532 $573 Less: Net investment losses (3) (36) (17) (43) Core income $324 $335 $549 $616 Core income (loss) is calculated by excluding from net income (loss) the after-tax effects of net investment gains or losses and gains or losses resulting from pension settlement transactions. Net investment gains or losses are excluded from the calculation of core income (loss) because they are generally driven by economic factors that are not necessarily reflective of our primary operations. The calculation of core income (loss) excludes gains or losses resulting from pension settlement transactions as they result from decisions regarding our defined benefit pension plans which are unrelated to our primary operations. Management monitors core income (loss) for each business segment to assess segment performance. Presentation of consolidated core income (loss) is deemed to be a non-GAAP financial measure and management believes some investors may find this measure useful to evaluate our primary operations. Reconciliation of Net Income (Loss) per Diluted Share to Core Income (Loss) per Diluted Share Results for the Three Months Ended June 30 Results for the Six Months Ended June 30 2026 2025 2026 2025 Net income per diluted share $1.18 $1.10 $1.95 $2.10 Less: Net investment losses (0.01) (0.13) (0.07) (0.16) Core income per diluted share $1.19 $1.23 $2.02 $2.26 Core income (loss) per diluted share provides management and investors with a valuable measure of the Company's operating performance for the same reasons applicable to its underlying measure, core income (loss). Core income (loss) per diluted share is core income (loss) on a per diluted share basis. 17 Reconciliation of Net Income (Loss) to Core Income (Loss) Reconciliation of GAAP Measures to Non-GAAP Measures
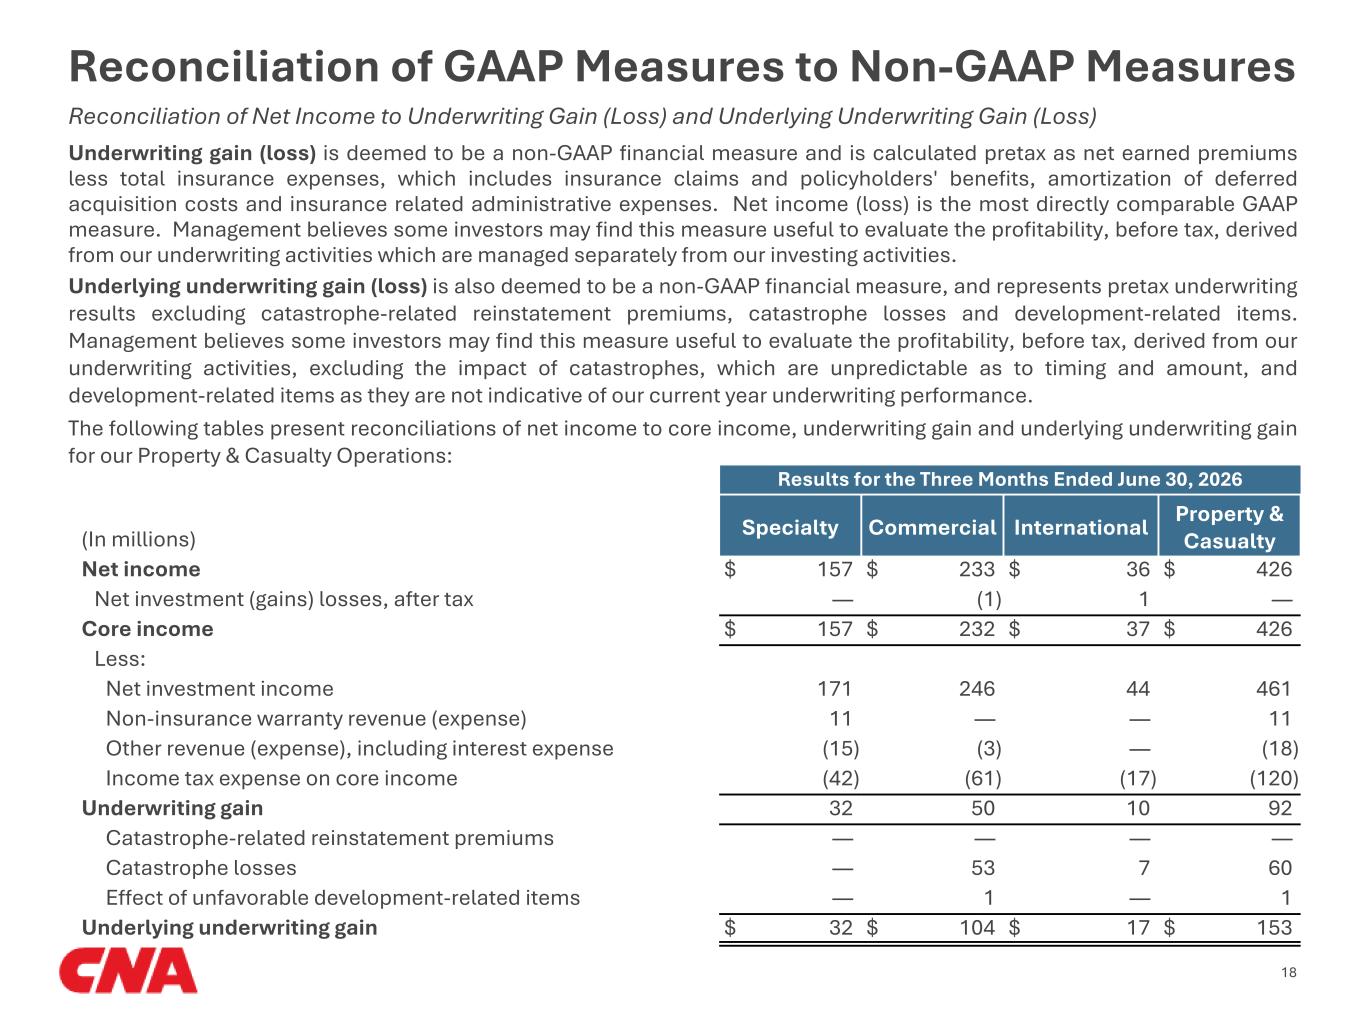
18 Underwriting gain (loss) is deemed to be a non-GAAP financial measure and is calculated pretax as net earned premiums less total insurance expenses, which includes insurance claims and policyholders' benefits, amortization of deferred acquisition costs and insurance related administrative expenses. Net income (loss) is the most directly comparable GAAP measure. Management believes some investors may find this measure useful to evaluate the profitability, before tax, derived from our underwriting activities which are managed separately from our investing activities. Underlying underwriting gain (loss) is also deemed to be a non-GAAP financial measure, and represents pretax underwriting results excluding catastrophe-related reinstatement premiums, catastrophe losses and development-related items. Management believes some investors may find this measure useful to evaluate the profitability, before tax, derived from our underwriting activities, excluding the impact of catastrophes, which are unpredictable as to timing and amount, and development-related items as they are not indicative of our current year underwriting performance. The following tables present reconciliations of net income to core income, underwriting gain and underlying underwriting gain for our Property & Casualty Operations: Results for the Three Months Ended June 30, 2026 (In millions) Specialty Commercial International Property & Casualty Net income $ 157 $ 233 $ 36 $ 426 Net investment (gains) losses, after tax — (1) 1 — Core income $ 157 $ 232 $ 37 $ 426 Less: Net investment income 171 246 44 461 Non-insurance warranty revenue (expense) 11 — — 11 Other revenue (expense), including interest expense (15) (3) — (18) Income tax expense on core income (42) (61) (17) (120) Underwriting gain 32 50 10 92 Catastrophe-related reinstatement premiums — — — — Catastrophe losses — 53 7 60 Effect of unfavorable development-related items — 1 — 1 Underlying underwriting gain $ 32 $ 104 $ 17 $ 153 Reconciliation of Net Income to Underwriting Gain (Loss) and Underlying Underwriting Gain (Loss) Reconciliation of GAAP Measures to Non-GAAP Measures
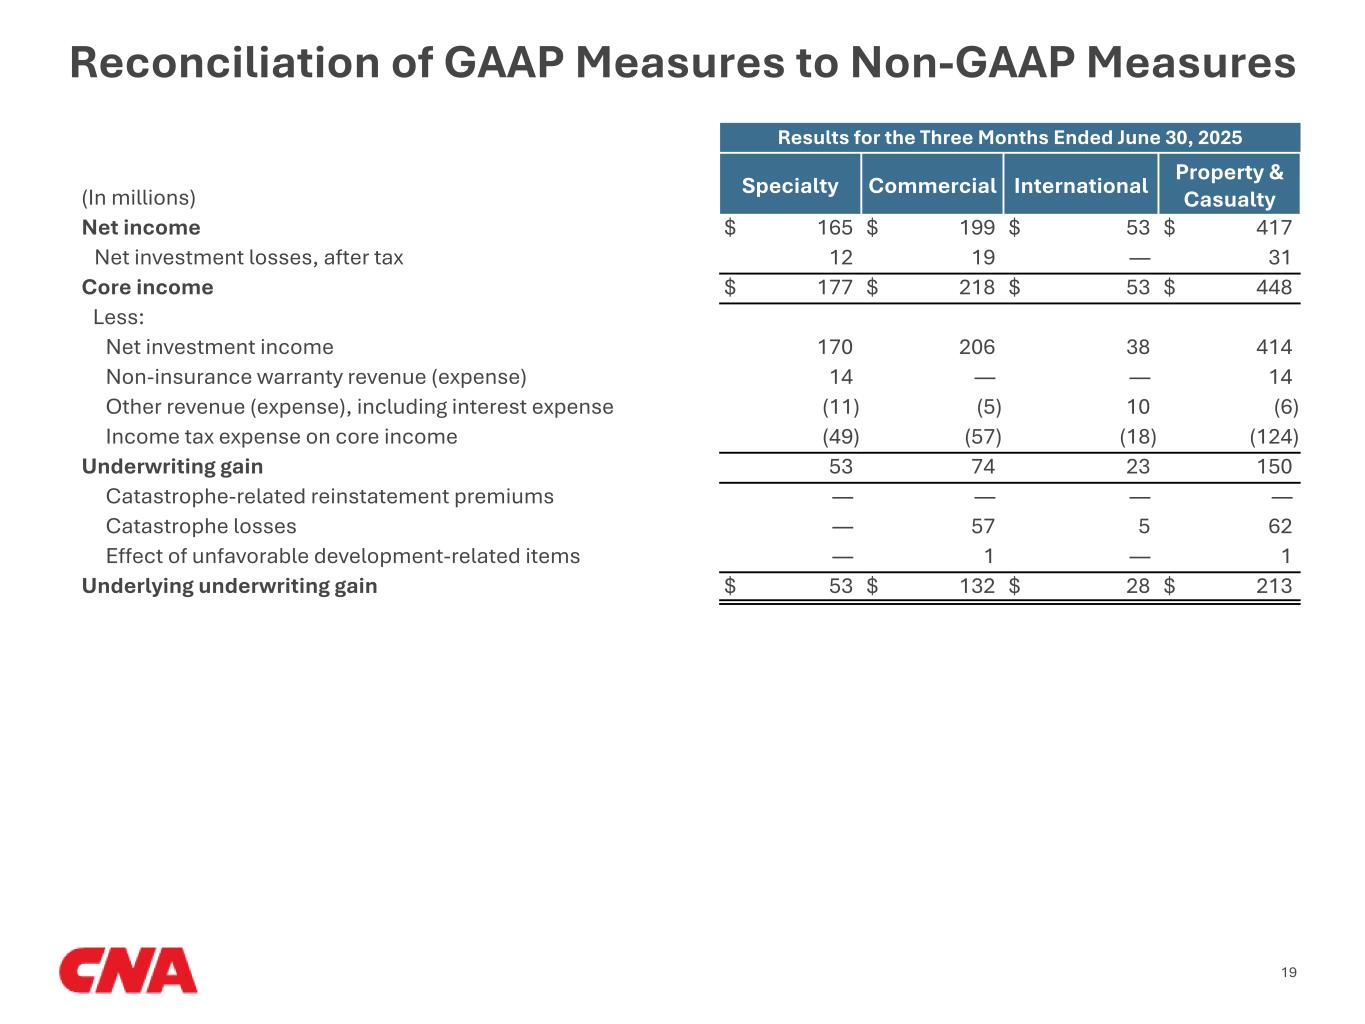
19 Results for the Three Months Ended June 30, 2025 (In millions) Specialty Commercial International Property & Casualty Net income $ 165 $ 199 $ 53 $ 417 Net investment losses, after tax 12 19 — 31 Core income $ 177 $ 218 $ 53 $ 448 Less: Net investment income 170 206 38 414 Non-insurance warranty revenue (expense) 14 — — 14 Other revenue (expense), including interest expense (11) (5) 10 (6) Income tax expense on core income (49) (57) (18) (124) Underwriting gain 53 74 23 150 Catastrophe-related reinstatement premiums — — — — Catastrophe losses — 57 5 62 Effect of unfavorable development-related items — 1 — 1 Underlying underwriting gain $ 53 $ 132 $ 28 $ 213 Reconciliation of GAAP Measures to Non-GAAP Measures
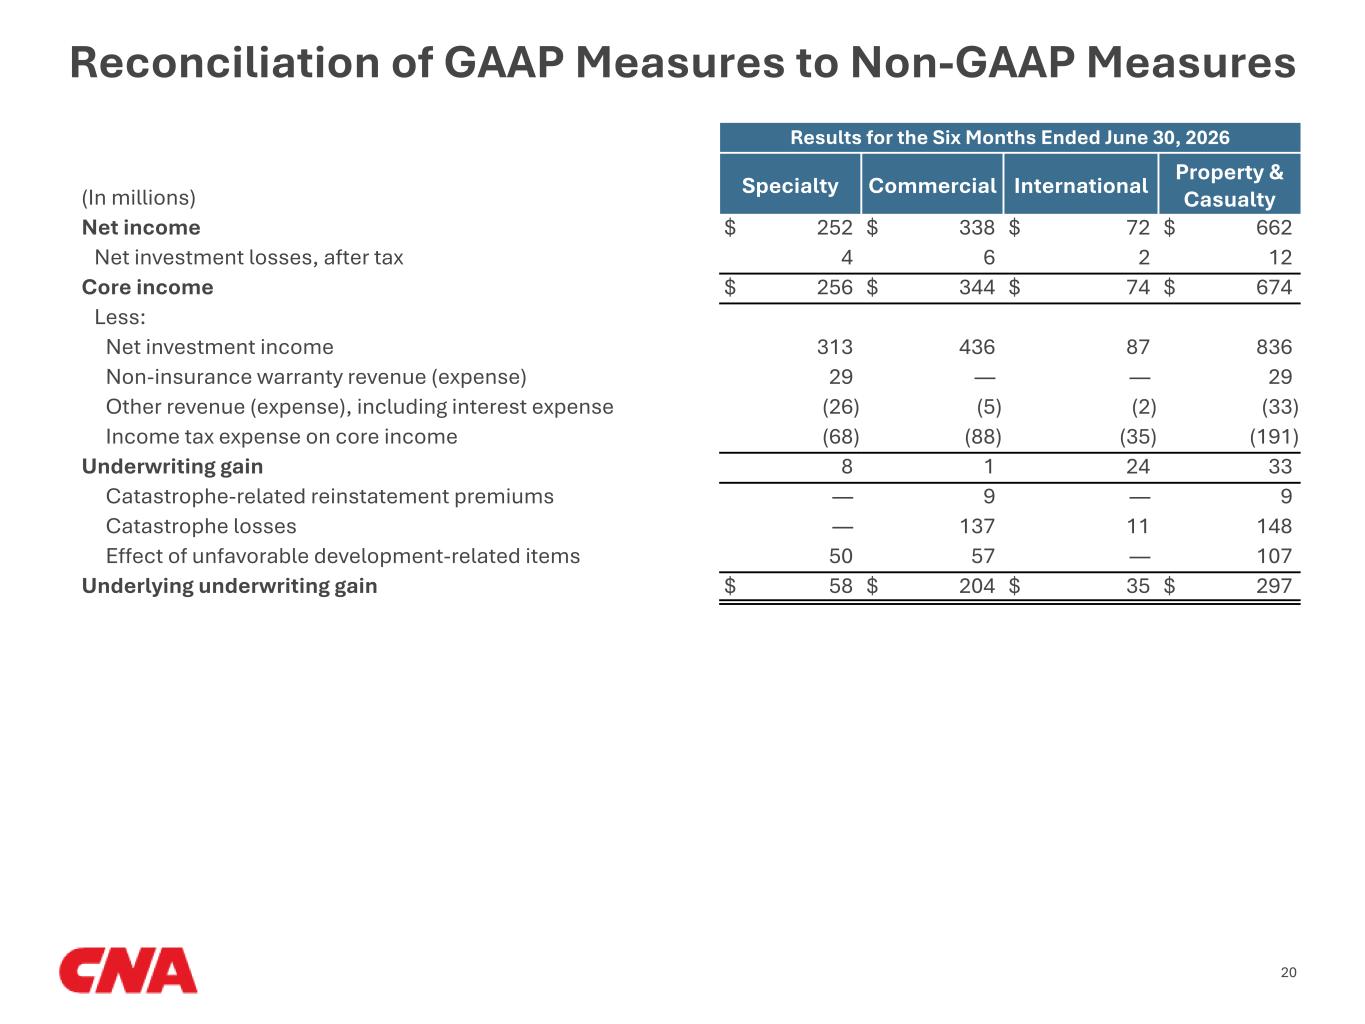
20 Results for the Six Months Ended June 30, 2026 (In millions) Specialty Commercial International Property & Casualty Net income $ 252 $ 338 $ 72 $ 662 Net investment losses, after tax 4 6 2 12 Core income $ 256 $ 344 $ 74 $ 674 Less: Net investment income 313 436 87 836 Non-insurance warranty revenue (expense) 29 — — 29 Other revenue (expense), including interest expense (26) (5) (2) (33) Income tax expense on core income (68) (88) (35) (191) Underwriting gain 8 1 24 33 Catastrophe-related reinstatement premiums — 9 — 9 Catastrophe losses — 137 11 148 Effect of unfavorable development-related items 50 57 — 107 Underlying underwriting gain $ 58 $ 204 $ 35 $ 297 Reconciliation of GAAP Measures to Non-GAAP Measures
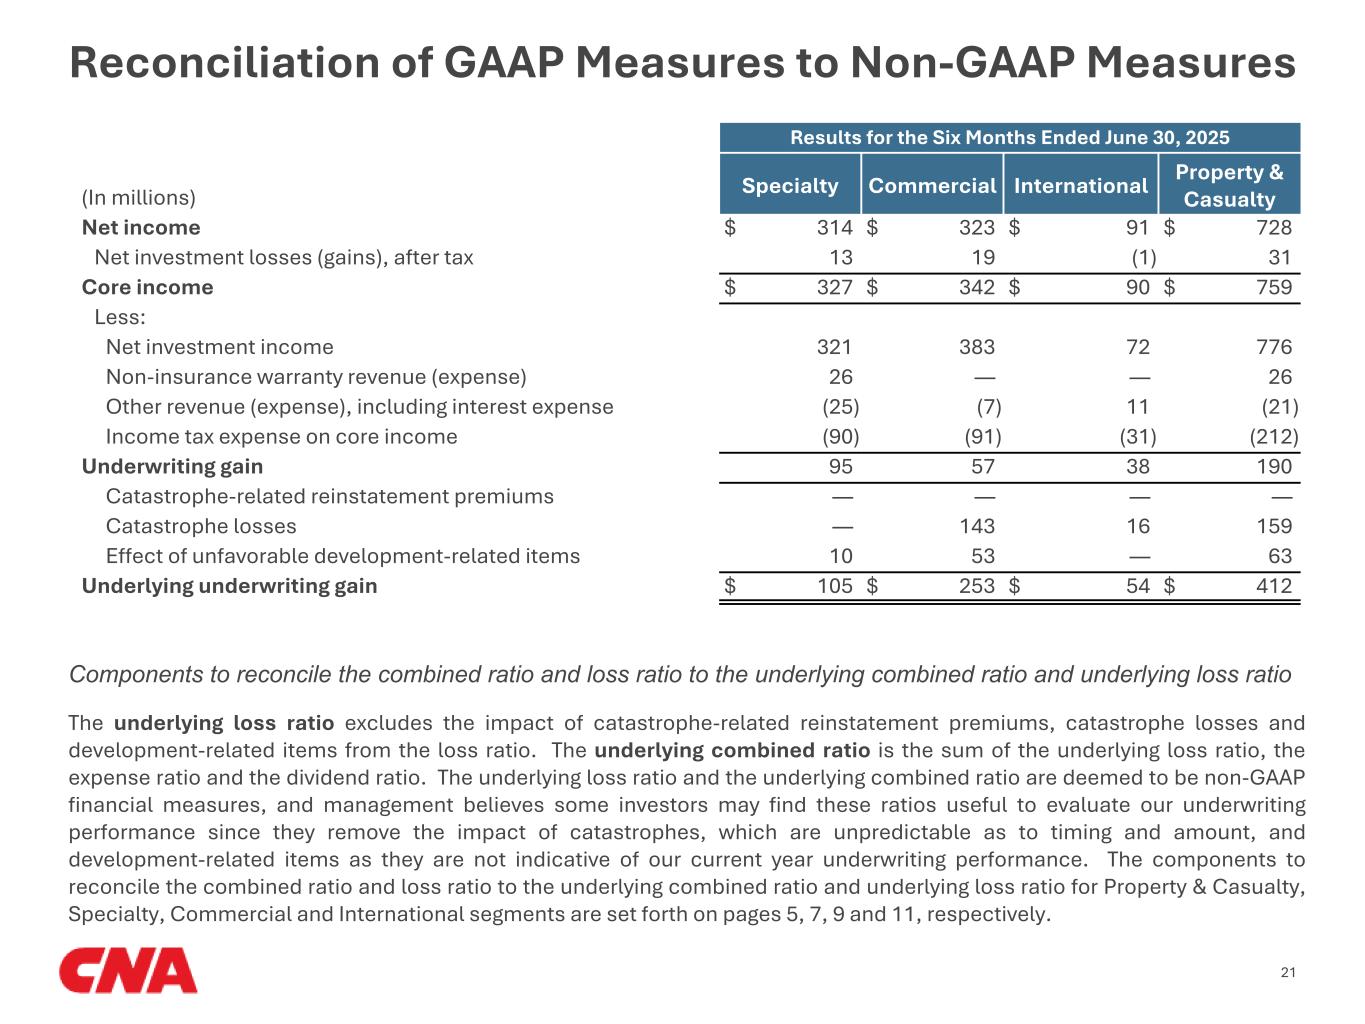
21 Results for the Six Months Ended June 30, 2025 (In millions) Specialty Commercial International Property & Casualty Net income $ 314 $ 323 $ 91 $ 728 Net investment losses (gains), after tax 13 19 (1) 31 Core income $ 327 $ 342 $ 90 $ 759 Less: Net investment income 321 383 72 776 Non-insurance warranty revenue (expense) 26 — — 26 Other revenue (expense), including interest expense (25) (7) 11 (21) Income tax expense on core income (90) (91) (31) (212) Underwriting gain 95 57 38 190 Catastrophe-related reinstatement premiums — — — — Catastrophe losses — 143 16 159 Effect of unfavorable development-related items 10 53 — 63 Underlying underwriting gain $ 105 $ 253 $ 54 $ 412 The underlying loss ratio excludes the impact of catastrophe-related reinstatement premiums, catastrophe losses and development-related items from the loss ratio. The underlying combined ratio is the sum of the underlying loss ratio, the expense ratio and the dividend ratio. The underlying loss ratio and the underlying combined ratio are deemed to be non-GAAP financial measures, and management believes some investors may find these ratios useful to evaluate our underwriting performance since they remove the impact of catastrophes, which are unpredictable as to timing and amount, and development-related items as they are not indicative of our current year underwriting performance. The components to reconcile the combined ratio and loss ratio to the underlying combined ratio and underlying loss ratio for Property & Casualty, Specialty, Commercial and International segments are set forth on pages 5, 7, 9 and 11, respectively. Components to reconcile the combined ratio and loss ratio to the underlying combined ratio and underlying loss ratio Reconciliation of GAAP Measures to Non-GAAP Measures
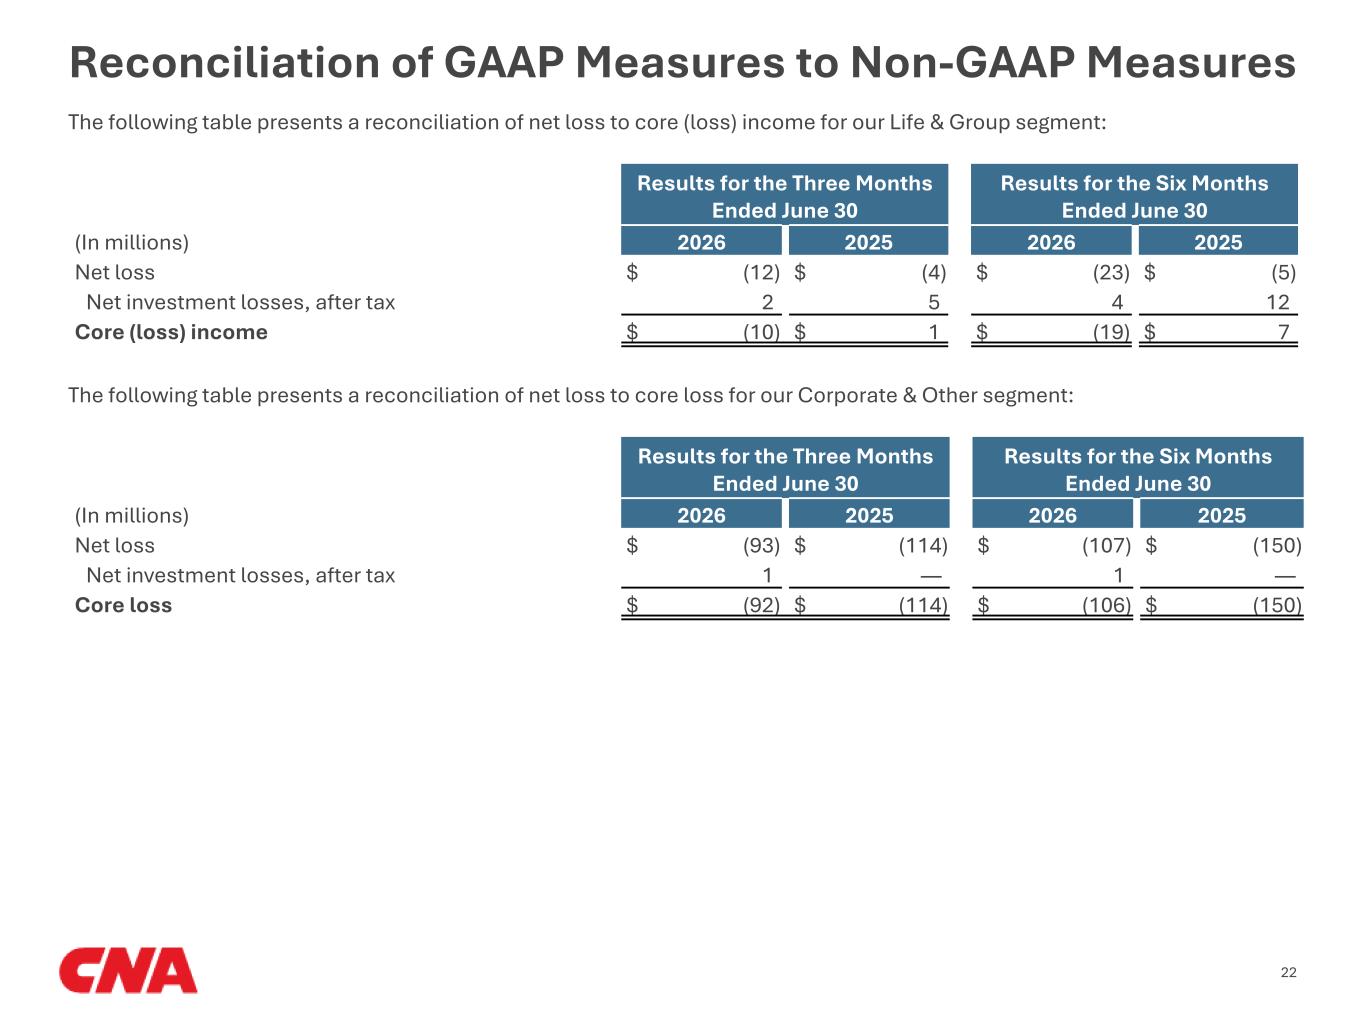
Reconciliation of GAAP Measures to Non-GAAP Measures The following table presents a reconciliation of net loss to core (loss) income for our Life & Group segment: Results for the Three Months Ended June 30 Results for the Six Months Ended June 30 (In millions) 2026 2025 2026 2025 Net loss $ (12) $ (4) $ (23) $ (5) Net investment losses, after tax 2 5 4 12 Core (loss) income $ (10) $ 1 $ (19) $ 7 The following table presents a reconciliation of net loss to core loss for our Corporate & Other segment: Results for the Three Months Ended June 30 Results for the Six Months Ended June 30 (In millions) 2026 2025 2026 2025 Net loss $ (93) $ (114) $ (107) $ (150) Net investment losses, after tax 1 — 1 — Core loss $ (92) $ (114) $ (106) $ (150) 22
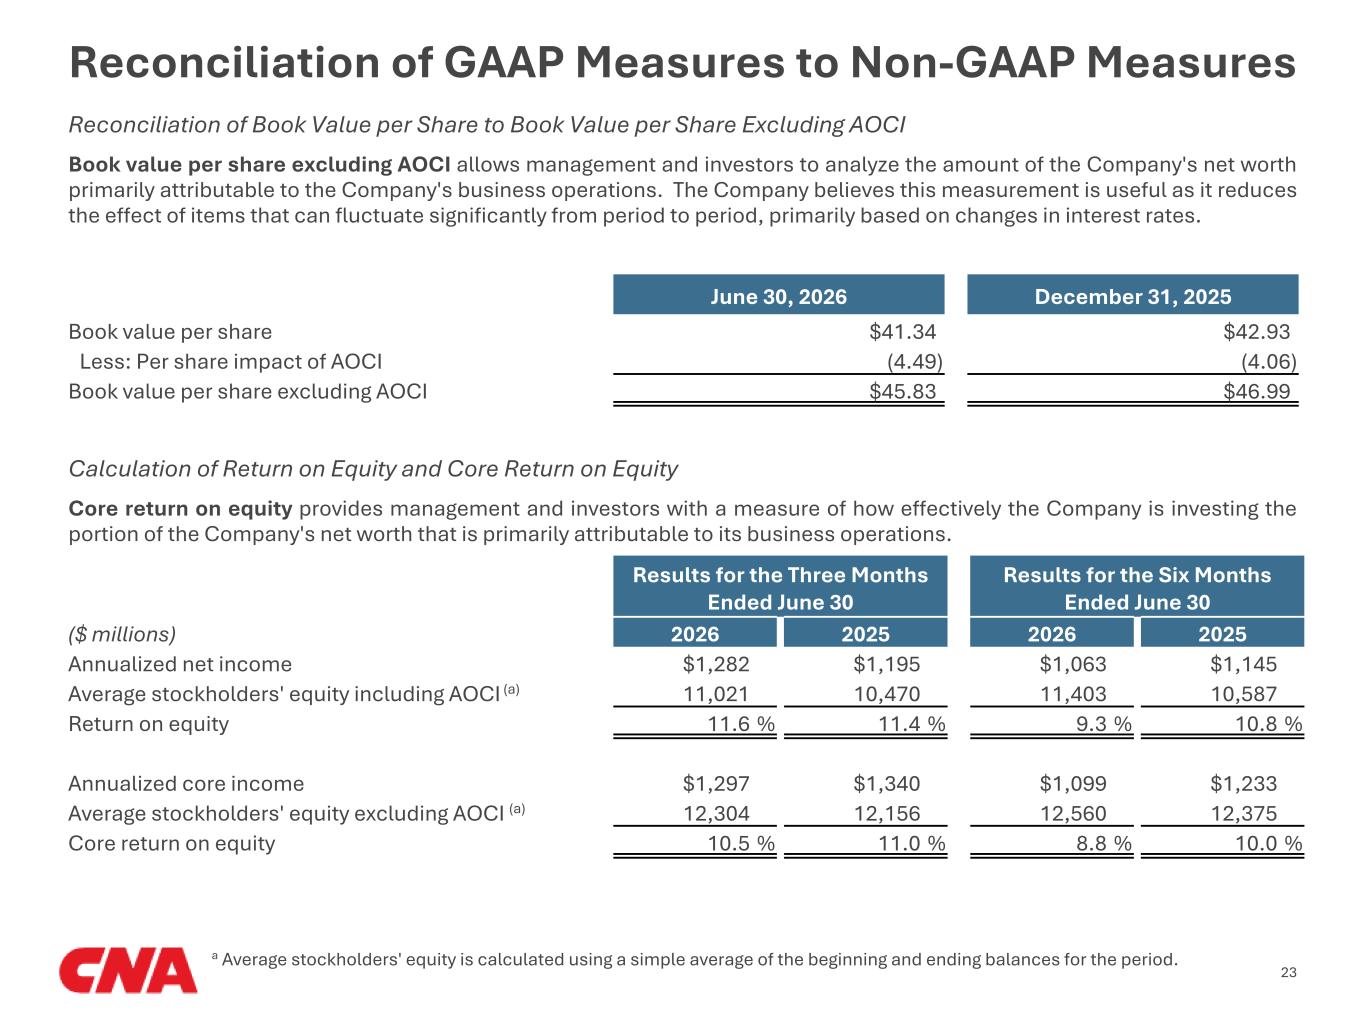
June 30, 2026 December 31, 2025 Book value per share $41.34 $42.93 Less: Per share impact of AOCI (4.49) (4.06) Book value per share excluding AOCI $45.83 $46.99 Book value per share excluding AOCI allows management and investors to analyze the amount of the Company's net worth primarily attributable to the Company's business operations. The Company believes this measurement is useful as it reduces the effect of items that can fluctuate significantly from period to period, primarily based on changes in interest rates. Calculation of Return on Equity and Core Return on Equity Results for the Three Months Ended June 30 Results for the Six Months Ended June 30 ($ millions) 2026 2025 2026 2025 Annualized net income $1,282 $1,195 $1,063 $1,145 Average stockholders' equity including AOCI (a) 11,021 10,470 11,403 10,587 Return on equity 11.6 % 11.4 % 9.3 % 10.8 % Annualized core income $1,297 $1,340 $1,099 $1,233 Average stockholders' equity excluding AOCI (a) 12,304 12,156 12,560 12,375 Core return on equity 10.5 % 11.0 % 8.8 % 10.0 % Core return on equity provides management and investors with a measure of how effectively the Company is investing the portion of the Company's net worth that is primarily attributable to its business operations. a Average stockholders' equity is calculated using a simple average of the beginning and ending balances for the period. 23 Reconciliation of Book Value per Share to Book Value per Share Excluding AOCI Reconciliation of GAAP Measures to Non-GAAP Measures