Pay vs Performance Disclosure
May 31, 2026
USD ($)
May 25, 2025
USD ($)
May 26, 2024
USD ($)
May 28, 2023
USD ($)
May 29, 2022
USD ($)
Year | Summary Compensation Table Total for PEO(1) | Compensation Actually Paid to PEO(2) | Average Summary Compensation Table Total for Non-PEO NEOs(1) | Average Compensation Actually Paid to Non-PEO NEOs(2) | Total Shareholder Return | Peer Group Total Shareholder Return(3) | GAAP Net Income (in millions) | Organic Net Sales Growth(4) | ||||||||
2026 | $14,018,052 | $764,454 | $4,106,382 | $1,157,410 | $64.81 | $88.36 | ($85) | (1.8%) | ||||||||
2025 | $12,492,830 | ($751,091) | $4,013,163 | $743,947 | $96.83 | $95.40 | $2,319 | (1.8%) | ||||||||
2024 | $16,056,114 | ($2,738,708) | $3,836,800 | $402,979 | $119.25 | $104.28 | $2,519 | (1.1%) | ||||||||
2023 | $16,385,646 | $33,137,997 | $4,607,312 | $7,806,270 | $141.93 | $115.69 | $2,610 | 10.8% | ||||||||
2022 | $12,266,195 | $27,692,522 | $3,574,805 | $6,900,889 | $114.75 | $104.74 | $2,735 | 5.1% |
years), Karen Wilson Thissen (2023, 2024, and 2026), Jon Nudi (2022-2025), John Church (2022), and Richard Allendorf (2022).
Report. Total shareholder return is calculated based on a fixed investment of $100 measured from the market close on the last trading day of fiscal 2021
through and including the end of the fiscal year for each fiscal year reported in the table.
amounts and the CAP amounts do not reflect the actual amount of compensation earned by or paid to our executives during the applicable years, but rather
are amounts determined in accordance with Item 402(v) of Regulation S-K under the Exchange Act. Pursuant to the applicable rules, the amounts in the
“Stock Awards” and “Option Awards” columns from the SCT and the amount of the change in the actuarial present value of the NEO’s accumulated benefit
under all defined benefit and actuarial pension plans are subtracted from the SCT amounts and the values reflected in the table below are added or
subtracted as applicable:
RECONCILIATION OF SUMMARY COMPENSATION TABLE TOTAL TO COMPENSATION ACTUALLY PAID(a)
Year | 2026 | |||
PEO | Other NEOs | |||
Summary Compensation Table Total | $14,018,052 | $4,106,382 | ||
(Minus): Grant Date Fair Value of Equity Awards Granted in Fiscal Year | ($9,606,378) | ($2,473,659) | ||
(Minus): Change in Pension Value | ($1,574,513) | ($254,428) | ||
Plus: Pension Service Cost and Associated Prior Service Cost | $6,421 | $99,755 | ||
Plus: Fair Value at Fiscal Year End of Outstanding and Unvested Equity Awards Granted in the Fiscal Year | $2,955,496 | $761,046 | ||
Plus/(Minus): Change in Fair Value of Outstanding and Unvested Equity Awards Granted in Prior Fiscal Years | ($5,443,104) | ($1,198,389) | ||
Plus: Fair Value at Vesting of Equity Awards Granted and Vested in the Fiscal Year | $— | $— | ||
Plus/(Minus): Change in Fair Value as of the Vesting Date of Equity Awards Granted in Prior Fiscal Years that Vested in the Fiscal Year | ($484,716) | ($95,001) | ||
(Minus): Fair Value as of the Prior Fiscal Year End of Equity Awards Granted in Prior Fiscal Years that Failed to Meet Vesting Conditions in the Fiscal Year | $— | $— | ||
Plus: Value of Dividends or Other Earnings Paid on Equity Awards Not Otherwise Reflected in Total Compensation | $893,196 | $211,704 | ||
Compensation Actually Paid | $764,454 | $1,157,410 | ||
(a)The fair value of equity awards was determined using methodologies and assumptions developed in a manner substantively consistent with those used
to determine the grant date fair value of such awards. For our financial PSUs, we assumed payouts ranging between 20% and 39% for the fiscal 2026
CAP calculations.
amounts and the CAP amounts do not reflect the actual amount of compensation earned by or paid to our executives during the applicable years, but rather
are amounts determined in accordance with Item 402(v) of Regulation S-K under the Exchange Act. Pursuant to the applicable rules, the amounts in the
“Stock Awards” and “Option Awards” columns from the SCT and the amount of the change in the actuarial present value of the NEO’s accumulated benefit
under all defined benefit and actuarial pension plans are subtracted from the SCT amounts and the values reflected in the table below are added or
subtracted as applicable:
RECONCILIATION OF SUMMARY COMPENSATION TABLE TOTAL TO COMPENSATION ACTUALLY PAID(a)
Year | 2026 | |||
PEO | Other NEOs | |||
Summary Compensation Table Total | $14,018,052 | $4,106,382 | ||
(Minus): Grant Date Fair Value of Equity Awards Granted in Fiscal Year | ($9,606,378) | ($2,473,659) | ||
(Minus): Change in Pension Value | ($1,574,513) | ($254,428) | ||
Plus: Pension Service Cost and Associated Prior Service Cost | $6,421 | $99,755 | ||
Plus: Fair Value at Fiscal Year End of Outstanding and Unvested Equity Awards Granted in the Fiscal Year | $2,955,496 | $761,046 | ||
Plus/(Minus): Change in Fair Value of Outstanding and Unvested Equity Awards Granted in Prior Fiscal Years | ($5,443,104) | ($1,198,389) | ||
Plus: Fair Value at Vesting of Equity Awards Granted and Vested in the Fiscal Year | $— | $— | ||
Plus/(Minus): Change in Fair Value as of the Vesting Date of Equity Awards Granted in Prior Fiscal Years that Vested in the Fiscal Year | ($484,716) | ($95,001) | ||
(Minus): Fair Value as of the Prior Fiscal Year End of Equity Awards Granted in Prior Fiscal Years that Failed to Meet Vesting Conditions in the Fiscal Year | $— | $— | ||
Plus: Value of Dividends or Other Earnings Paid on Equity Awards Not Otherwise Reflected in Total Compensation | $893,196 | $211,704 | ||
Compensation Actually Paid | $764,454 | $1,157,410 | ||
(a)The fair value of equity awards was determined using methodologies and assumptions developed in a manner substantively consistent with those used
to determine the grant date fair value of such awards. For our financial PSUs, we assumed payouts ranging between 20% and 39% for the fiscal 2026
CAP calculations.
Organic Net Sales Growth* |
Adjusted Operating Profit* |
Cumulative Operating Cash Flow* |
Relative Total Shareholder Return |
S-K, we are providing the following information about the relationship between executive compensation actually paid and certain
financial performance measures of the company. For further information concerning our pay for performance philosophy and how we
align executive compensation with the company’s performance, please review the Compensation Discussion and Analysis beginning
The following tables and related disclosures provide information about (i) the total compensation of our principal executive officer
(“PEO”) and our non-PEO NEOs (collectively, the “Other NEOs”) as presented in the Summary Compensation Table (“SCT”) on
page 62, (ii) the “compensation actually paid” (“CAP”) to our PEO and our Other NEOs, as calculated pursuant to Item 402(v) of
Regulation S-K, (iii) certain financial performance measures, and (iv) the relationship of the CAP to those financial performance
measures.
Financial Performance MeasuresThe following table lists the four performance measures that, in our assessment, represent the most important performance measures
we used to link compensation actually paid in fiscal 2026 to company performance.
*Non-GAAP measure. For more information on the use of non-GAAP measures in the Proxy Statement, and a reconciliation of non-GAAP measures to the most directly comparable GAAP measures, see Appendix A.
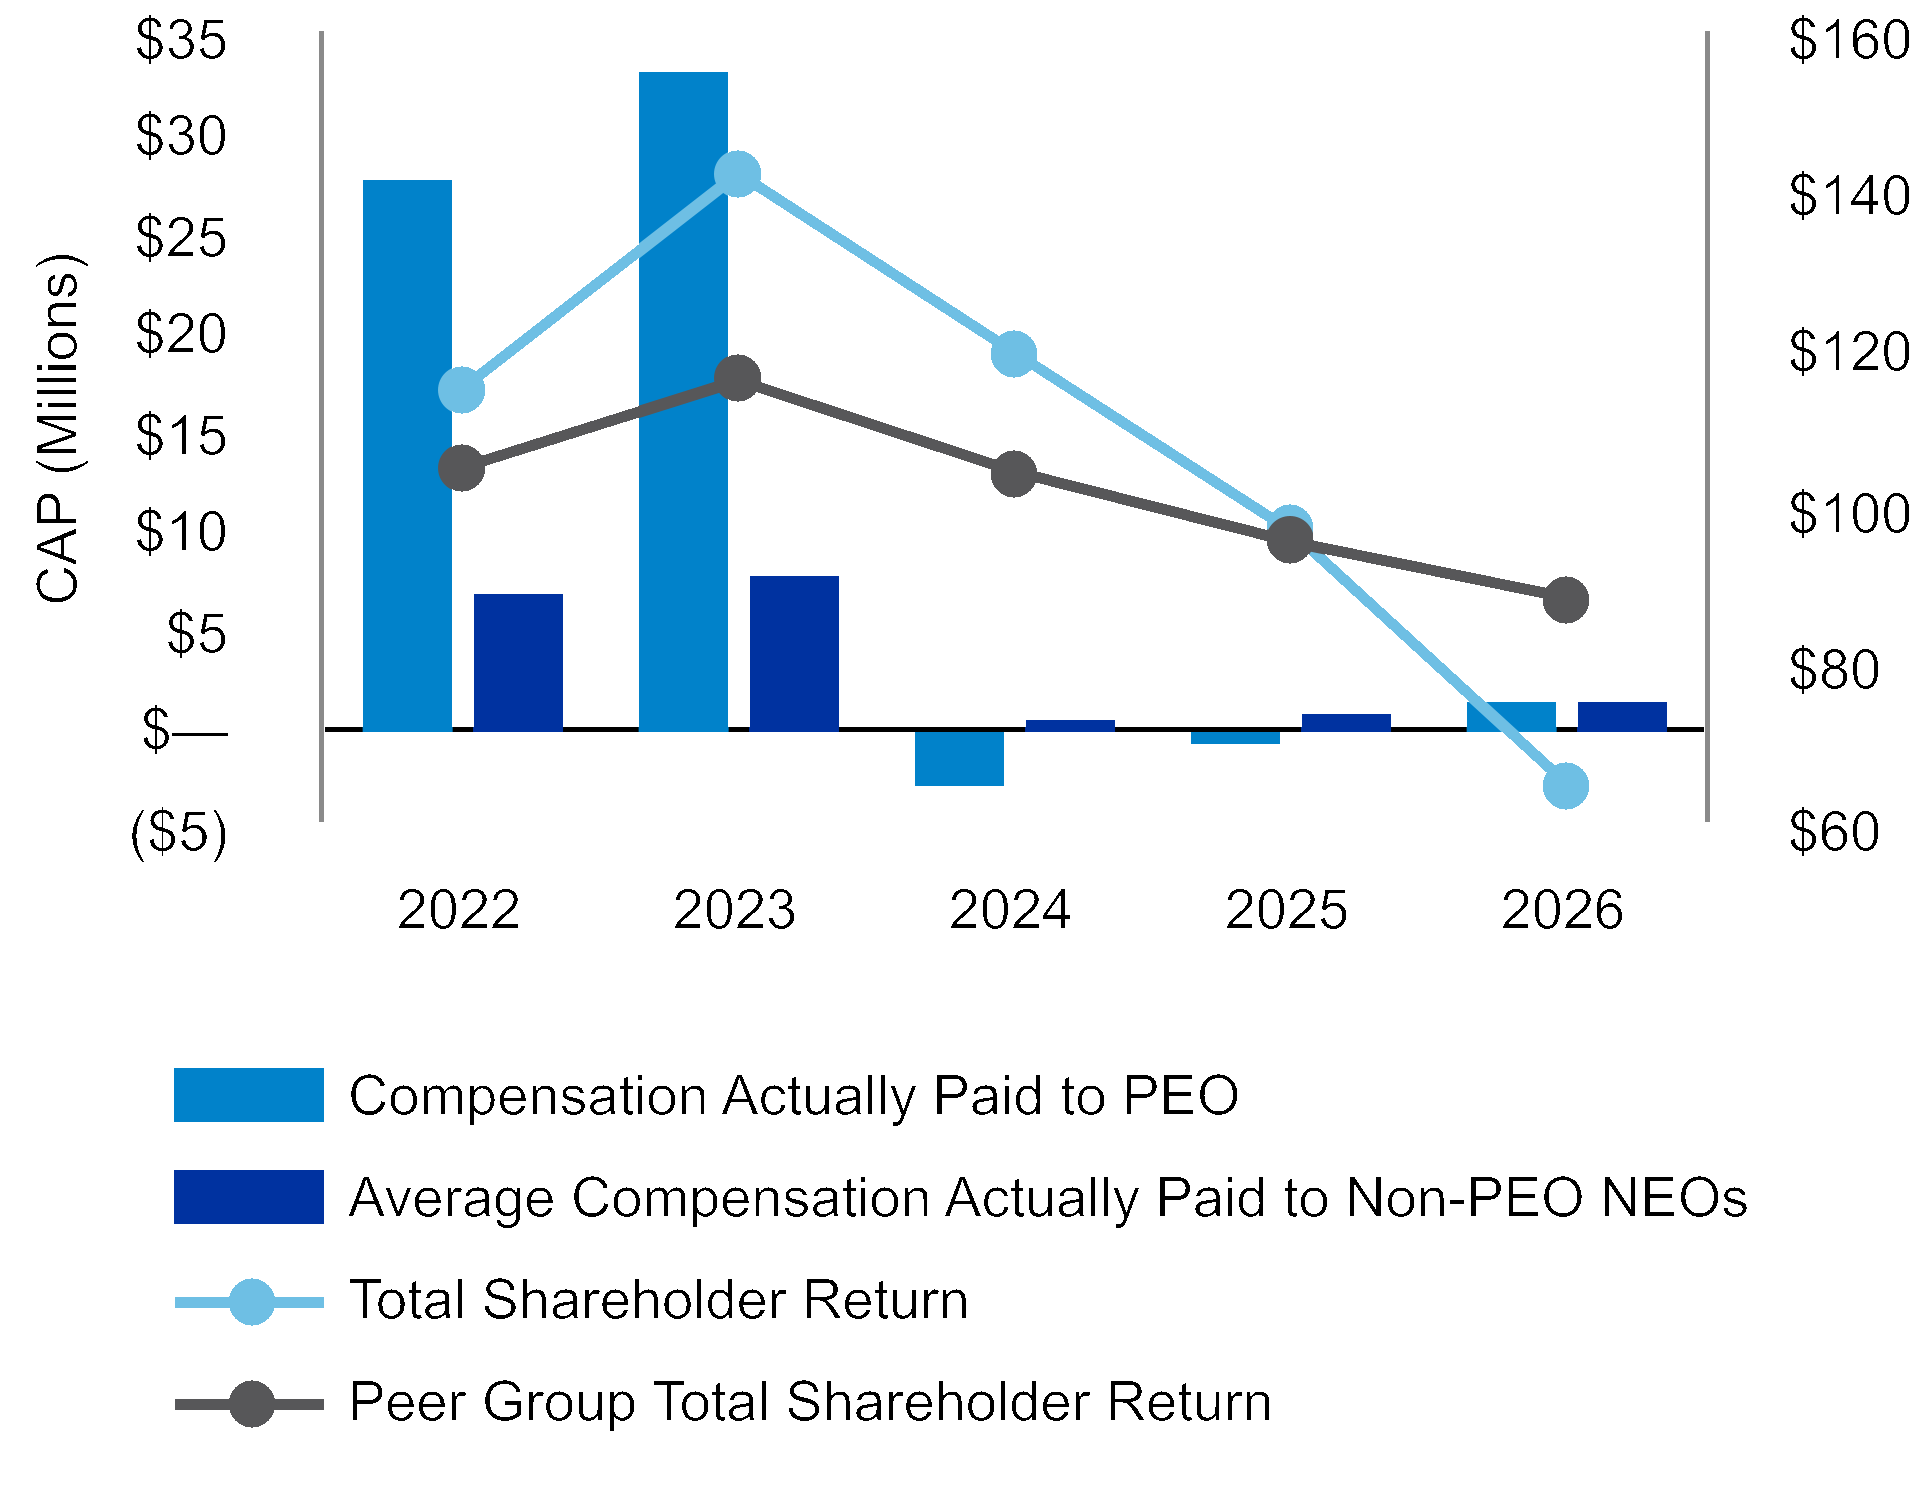
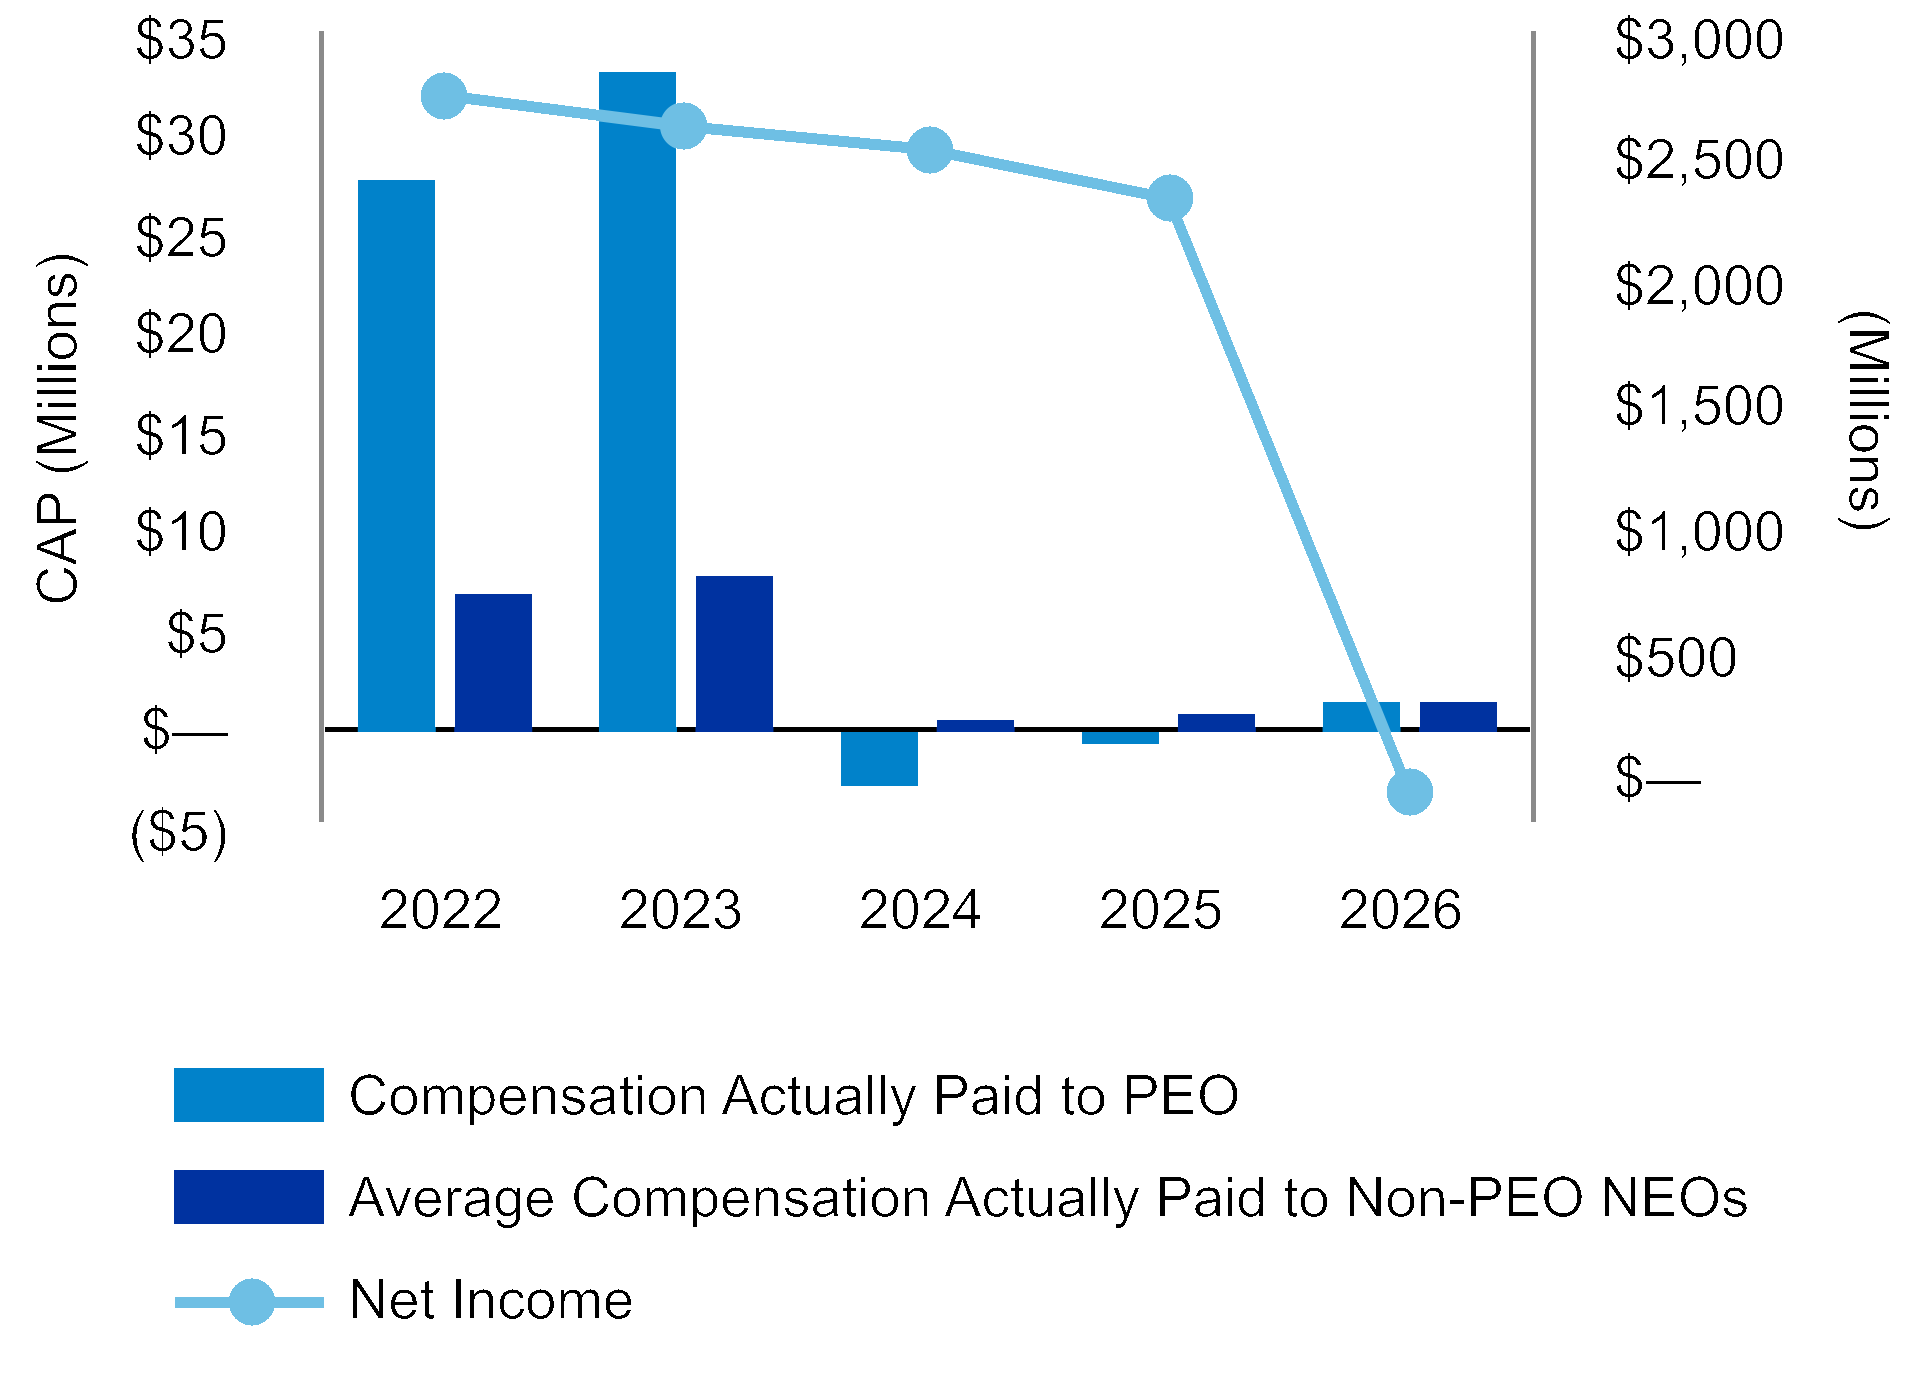
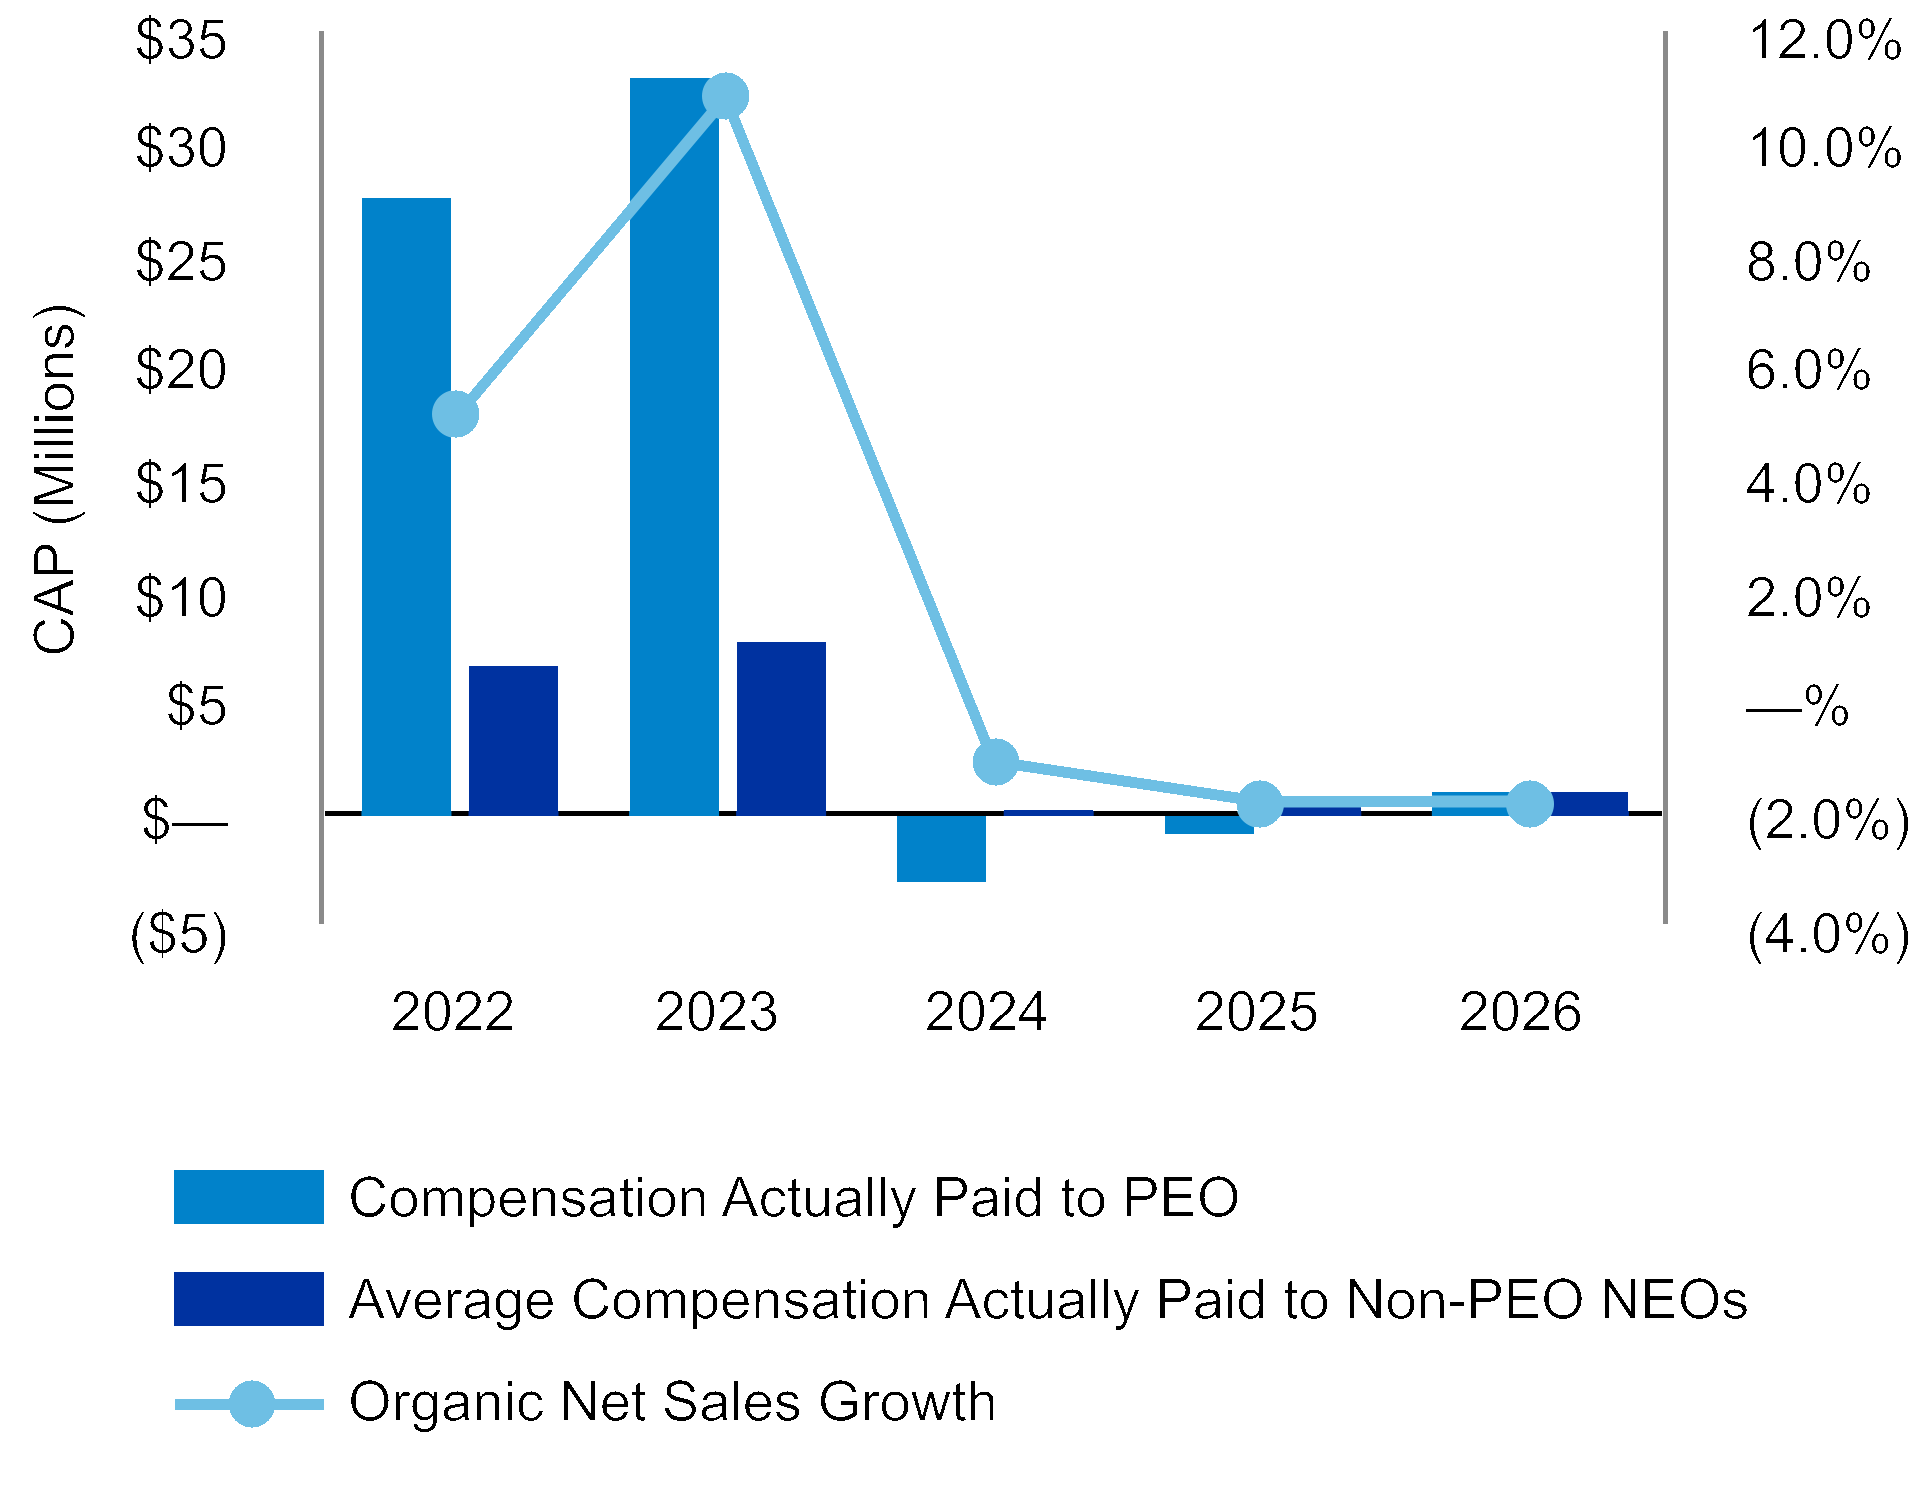
Relationship Between Compensation Actually Paid and PerformanceThe following charts show graphically the relationships over the past five years of the CAP amounts for our PEO and Other NEOs as
compared to our cumulative TSR, Peer Group TSR, GAAP Net Income, and Organic Net Sales Growth*, as well as the relationship
between TSR and Peer Group TSR.
As described in more detail in the Compensation Discussion & Analysis, a significant portion of our NEO’s total compensation is tied to company performance in the form of annual and long-term incentives. Overall, our executive compensation is closely aligned with
shareholder returns. We do not use net income as a financial performance measure that determines compensation levels or incentive
plan payouts for our NEOs; therefore, CAP and net income do not have a direct relationship. We have chosen Organic Net Sales
Growth as our company-selected metric because it is measured in both our annual and long-term incentive plans, and therefore has
the largest impact on our CAP for fiscal 2026.
It is important to note that the CAP amounts paid to our NEOs do not necessarily reflect the actual value that an NEO will receive in
the stated fiscal year as such value will depend on a variety of factors. For example, the value of PSUs that an NEO will receive will
ultimately depend on the company’s stock price at the time of vesting along with the financial performance metrics achieved during
the applicable three-year performance cycle, and therefore, remains at risk of forfeiture or reduction until the time of vesting.
The information contained in this Pay Versus Performance section will not be incorporated into any filings under the Securities Act of
1933 or the Exchange Act, except to the extent that the company specifically incorporates such information by reference.
*Non-GAAP measure. For more information on the use of non-GAAP measures in the Proxy Statement, and a reconciliation of non-GAAP measures to the
most directly comparable GAAP measures, see Appendix A.
otherwise presented in the table above that we use to link CAP to our NEOs for fiscal 2026 to the company’s performance.