| Year | SCT Total for PEO Ludlum (1) | CAP to PEO Ludlum(2) | SCT Total for PEO Raad(1) | CAP to PEO Raad(2) | Average SCT Total for Non- PEO Named Executive Officers(3) | Average CAP to Non-PEO Named Executive Officers(4) | Value of Initial Fixed $100 Investment Based on TSR(5) | Net Loss (in thousands)(6) | ||||||||||||||||||||||||
| 2025 | $ | 715,225 | $ | 715,225 | $ | 57 | $ | (5,162 | ) | |||||||||||||||||||||||
| 2024 | $ | 780,877 | $ | 780,877 | $ | 1,723,126 | $ | 1,697,244 | $ | 432,916 | $ | 426,076 | $ | 180 | $ | (9,559 | ) | |||||||||||||||
| 2023 | $ | N/A | $ | N/A | $ | 691,888 | $ | 545,728 | $ | 509,915 | $ | 481,934 | $ | 48 | $ | (14,121 | ) | |||||||||||||||
Compensation Actually Paid and Cumulative TSR
The following chart sets forth the relationship between CAP to our PEO, the average CAP to our Non-PEO Named Executive Officers, and the Company’s cumulative TSR over the three most recently completed fiscal years.
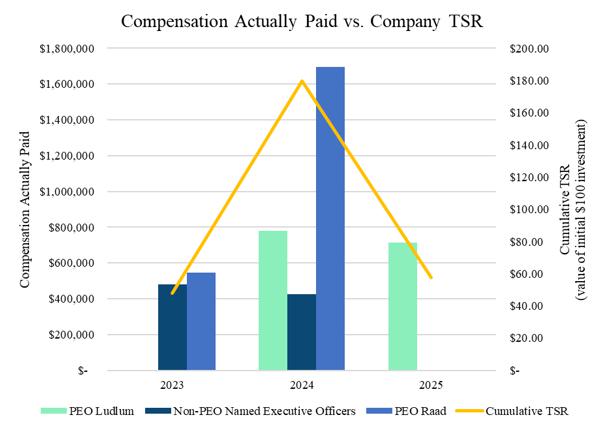
From 2023 to 2025, the value of an initial fixed $100 investment in our common stock based on cumulative TSR increased. Between these years, the CAP to our PEOs increased and the CAP to our Non-PEO Named Executive Officers decreased, as we had no Non-PEO Named Executive Officers in 2025. Although equity awards have historically been a significant component of our executive compensation program, compensation for Mr. Ludlum, our 2025 PEO, does not include equity awards. We have not directly used TSR in our executive compensation program.
Compensation Actually Paid and Net Income (Loss)
The following chart sets forth the relationship between CAP to our PEO, the average CAP to our Non-PEO Named Executive Officers, and our net income (loss) during the three most recently completed fiscal years.
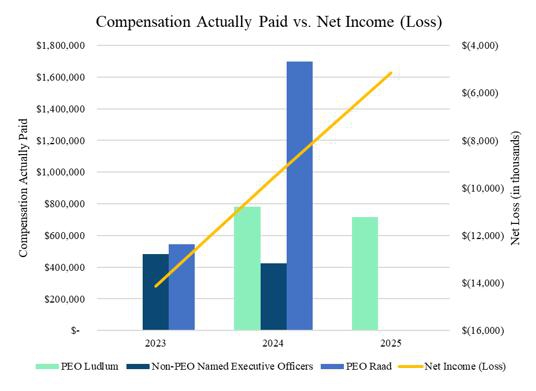
From 2023 to 2024, our net income increased and the CAP to our PEOs increased, while the CAP to our Non-PEO Named Executive Officers decreased. The increase in net income is primarily related to the Company’s cost saving efforts implemented during the year as it searched for strategic alternatives. CAP to our PEOs increased in 2024 related to severance payments made to Mr. Raad following his separation from the Company effective July 19, 2024, and the appointment of Mr. Ludlum effective July 20, 2024 as PEO, thereby classifying him as a PEO during the entirety of 2024.
From 2024 to 2025, our net income increased, while the CAP to our PEO decreased, as we only had one PEO during 2025, Mr. Ludlum.
Compensation Actually Paid and Cumulative TSR
The following chart sets forth the relationship between CAP to our PEO, the average CAP to our Non-PEO Named Executive Officers, and the Company’s cumulative TSR over the three most recently completed fiscal years.
From 2023 to 2025, the value of an initial fixed $100 investment in our common stock based on cumulative TSR increased. Between these years, the CAP to our PEOs increased and the CAP to our Non-PEO Named Executive Officers decreased, as we had no Non-PEO Named Executive Officers in 2025. Although equity awards have historically been a significant component of our executive compensation program, compensation for Mr. Ludlum, our 2025 PEO, does not include equity awards. We have not directly used TSR in our executive compensation program.
Compensation Actually Paid and Net Income (Loss)
The following chart sets forth the relationship between CAP to our PEO, the average CAP to our Non-PEO Named Executive Officers, and our net income (loss) during the three most recently completed fiscal years.
From 2023 to 2024, our net income increased and the CAP to our PEOs increased, while the CAP to our Non-PEO Named Executive Officers decreased. The increase in net income is primarily related to the Company’s cost saving efforts implemented during the year as it searched for strategic alternatives. CAP to our PEOs increased in 2024 related to severance payments made to Mr. Raad following his separation from the Company effective July 19, 2024, and the appointment of Mr. Ludlum effective July 20, 2024 as PEO, thereby classifying him as a PEO during the entirety of 2024.
From 2024 to 2025, our net income increased, while the CAP to our PEO decreased, as we only had one PEO during 2025, Mr. Ludlum.
| [1] | For the 2024 fiscal year, our only Non-PEO Named Executive Officer was Margaret Wasilewski, M.D. (prior to her termination effective April 1, 2024). As Peter Ludlum was appointed PEO effective July 20, 2024, he is presented in this table as a PEO for the full 2024 fiscal year. For the 2023 fiscal year, the Pulmatrix Non-PEO Named Executive Officers were Peter Ludlum and Margaret Wasilewski. |
| [2] | The amounts disclosed reflect the adjustments to the total amount reported in the SCT for the Pulmatrix Non-PEO Named Executive Officers based on stock-based compensation. Equity values are calculated in accordance with FASB ASC Topic 718. |
| [3] | Pulmatrix’s cumulative TSR assumes $100 was invested in Pulmatrix for the period starting December 31, 2022, through the end of each listed year. Pulmatrix did not pay dividends during the period. |
| [4] | The dollar amounts reported represent the amount of net loss, in thousands, reflected in Pulmatrix’s consolidated audited financial statements for each applicable year. |
| [5] | Teofilo Raad was the Principal Executive Officer (“PEO”) for each of the 2022 and 2023 fiscal years, and in 2024 through July 19, 2024. Peter Ludlum replaced Teofilo Raad as the PEO effective July 20, 2024. The amount shown for Peter Ludlum includes $715,225 and $730,877 in fees paid to Danforth Advisors for his services for the fiscal years ended December 31, 2025 and 2024, respectively. |
| [6] | The amounts disclosed reflect the adjustments to the total amount reported in the SCT for the PEOs based on stock-based compensation. Equity values are calculated in accordance with FASB ASC Topic 718. No such adjustments were necessary for Peter Ludlum. |