PAY VERSUS PERFORMANCE TABLE
As required by Section 953(a) of the Dodd-Frank Wall Street Reform and Consumer Protection Act, and Item 402(v) of Regulation S-K, we are providing the following information about the relationship between executive compensation actually paid to our Chief Executive Officer and our other NEOs and certain financial performance of the Company for each of Fiscal 2025, the fiscal year ended December 31, 2025 and the fiscal year ended December 31, 2024.
| Fiscal Year | Summary | Compensation | Average | Average | Value of | Net | ||||||||||||||
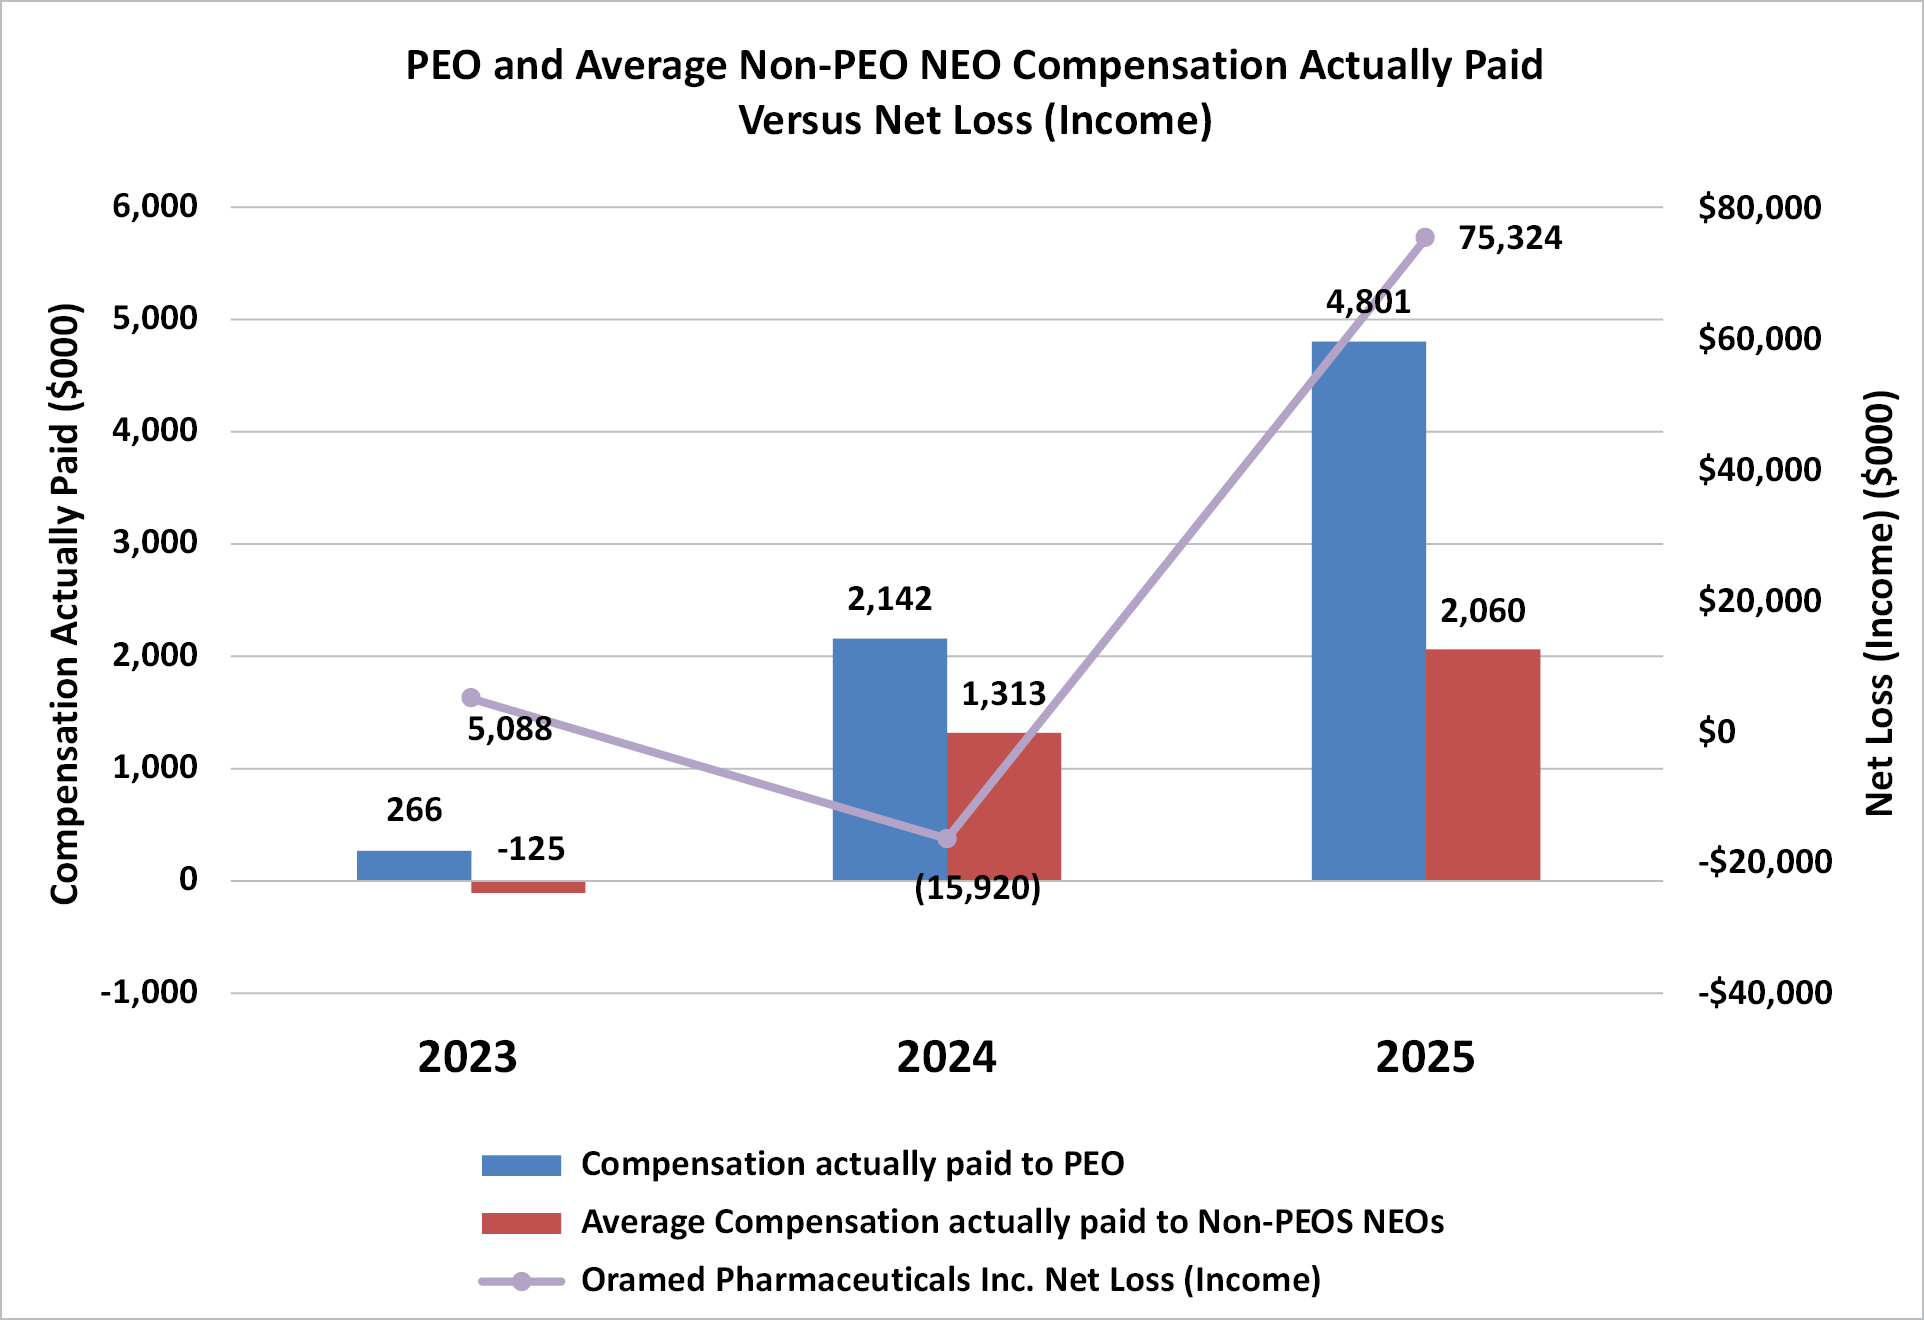
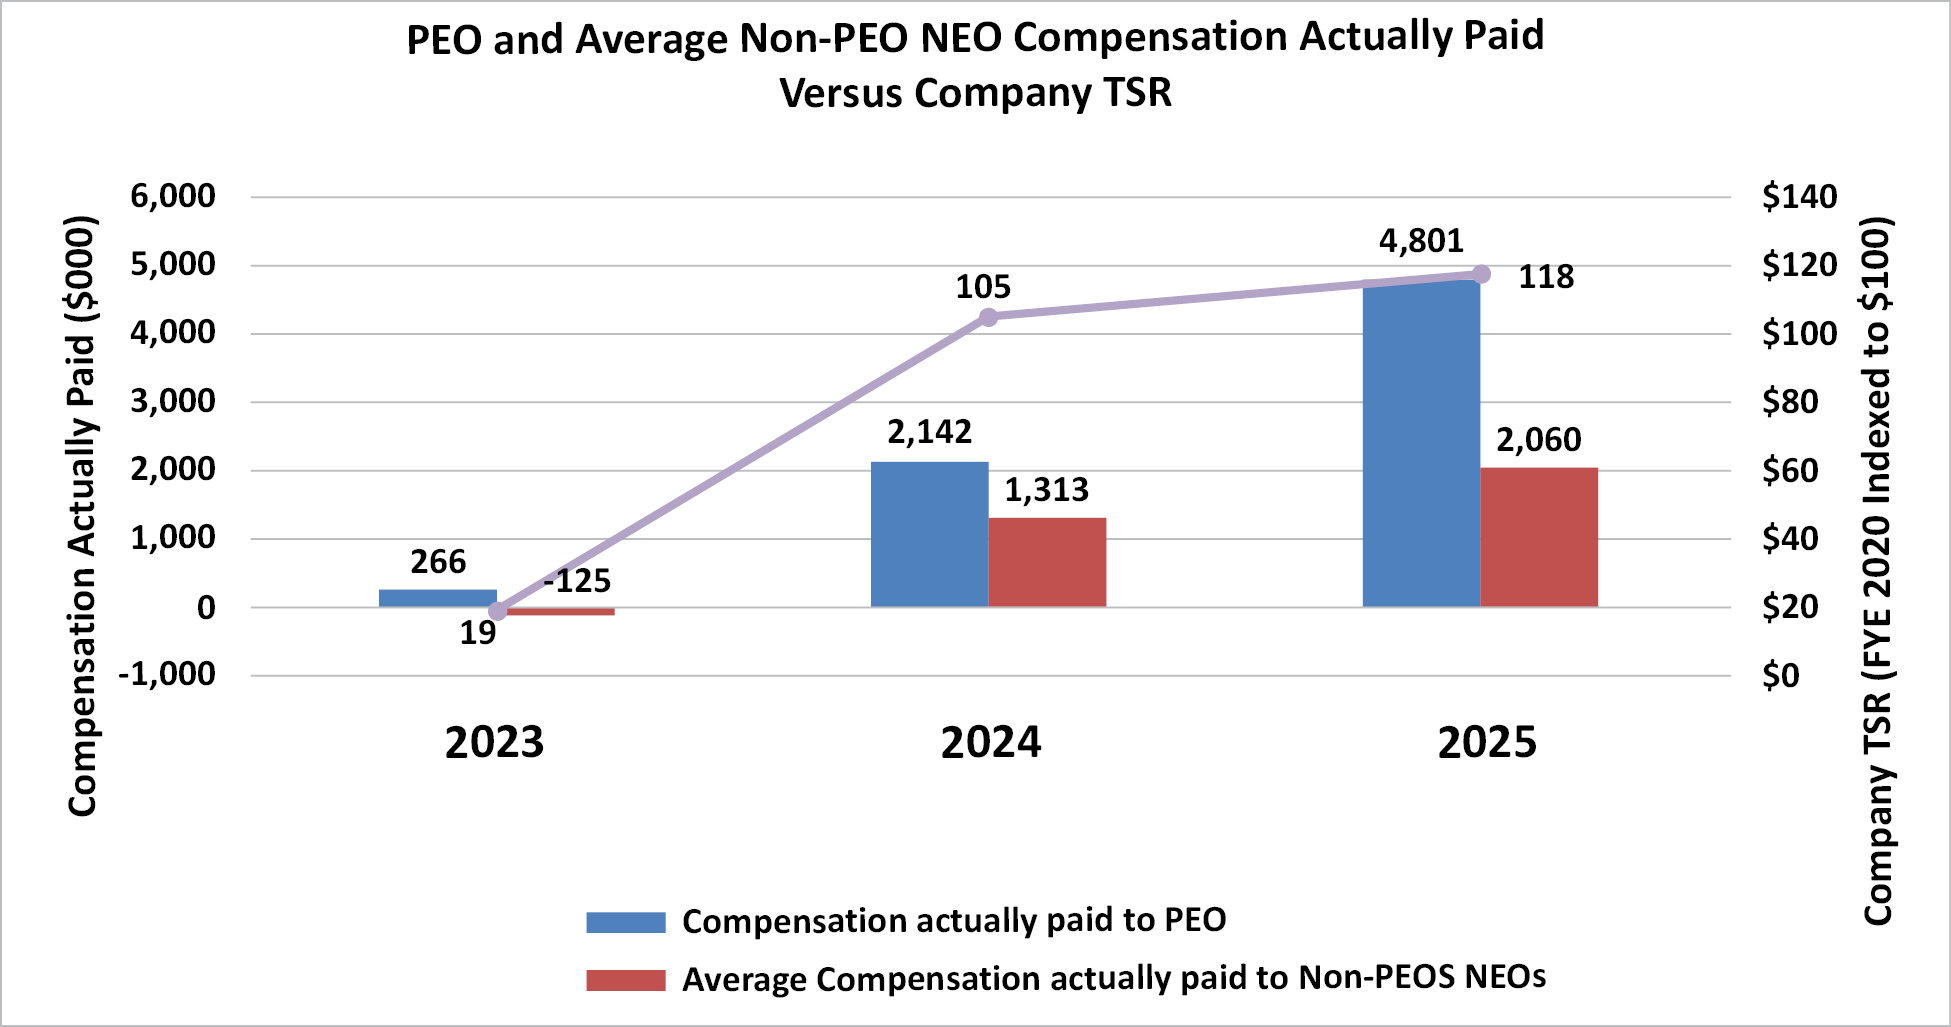
| 2025 | $ | 4,774,660 | $ | 4,801,325 | $ | 2,024,392 | $ | 2,059,945 |
| $ | 118 | $ | 75,324 |
| ||||||
| 2024 | $ | 2,097,689 | $ | 2,141,803 | $ | 1,282,999 | $ | 1,313,317 |
| $ | 105 | $ | (15,920 | ) | ||||||
| 2023 | $ | 1,659,222 | $ | 265,813 | $ | 918,936 | $ | (125,099 | ) | $ | 19 | $ | 5,088 |
| ||||||
____________
(1) Amounts represent compensation actually paid to the following persons: (a) for 2025 — Mr. Nadav Kidron, our President, Chief Executive Officer and Chairman, Dr. Miriam Kidron, our Chief Scientific Officer and a director, and Mr. Joshua Hexter, our Chief Operating Officer; (b) for 2024 — Mr. Nadav Kidron, our President, Chief Executive Officer and Chairman, Dr. Miriam Kidron, our Chief Scientific Officer and a director, and Mr. Joshua Hexter, our Chief Operating Officer; and (c) for 2023 — Mr. Nadav Kidron, our President, Chief Executive Officer and Chairman, Dr. Miriam Kidron, our Chief Scientific Officer and a director, and Mr. Joshua Hexter, our Chief Operating Officer. As determined under SEC rules, the amounts reported in the “Compensation Actually Paid to CEO” and “Compensation Actually Paid to other NEOs” columns do not reflect the actual compensation paid to or realized by our Chief Executive Officer or our other NEOs during each applicable year. The calculation of compensation actually paid for purposes of this table includes point-in-time fair values of stock awards and these values will fluctuate based on our stock price, various accounting valuation assumptions and projected performance related to our performance awards. See “Summary Compensation Table” above for certain other compensation of our Chief Executive Officer and our other NEOs for each applicable fiscal year.
Compensation actually paid to our Chief Executive Officer represents the total compensation reported in the Summary Compensation Table for the applicable fiscal year, as adjusted as follows:
| Adjustments to Determine Compensation “Actually Paid” to | 2025 | 2024 | 2023 | |||||||||
| Total Compensation in the Summary Compensation Table | $ | 4,774,660 |
| $ | 2,097,689 |
| $ | 1,659,222 |
| |||
| Deduction for Amounts Reported under the “Stock Awards” Column in the Summary Compensation Table | $ | (3,709,269 | ) | $ | (1,224,760 | ) | $ | (904,920 | ) | |||
| Deduction for Amounts Reported under “Option Awards” Column in the Summary Compensation Table | $ |
|
| $ |
|
| $ |
|
| |||
| Increase for Fair Value of Awards Granted During Fiscal Year that Remain Unvested as of Year End, Determined as of Applicable Fiscal Year End(1) | $ | 3,039,924 |
| $ | 872,006 |
| $ | 483,368 |
| |||
| Increase for Fair Value of Awards Granted During Fiscal Year that Vested during Applicable Fiscal Year, Determined as of Vesting Date(1) | $ | 735,970 |
| $ | 382,364 |
| $ | 656,078 |
| |||
| Increase/deduction for Awards Granted During Prior Fiscal Year that were Outstanding and Unvested as of Applicable Fiscal Year End | $ | 57,294 |
| $ | 8,752 |
| $ | (768,999 | ) | |||
| Increase/deduction for Awards Granted During Prior Fiscal Year that Vested During Applicable Fiscal Year | $ | (97,254 | ) | $ | 5,753 |
| $ | (858,935 | ) | |||
| Total Adjustments | $ | 26,665 |
| $ | 44,114 |
| $ | (1,393,409 | ) | |||
| Compensation Actually Paid to the CEO | $ | 4,801,325 |
| $ | 2,141,803 |
| $ | 265,813 |
| |||
____________
(1) All fair value amounts are computed in accordance with Financial Accounting Standards Board (FASB) Accounting Standards Codification (ASC) Topic 718.
| Adjustments to Determine Compensation “Actually Paid” to | 2025 | 2024 | 2023 | |||||||||
| Average Total Compensation in the Summary Compensation Table | $ | 2,024,392 |
| $ | 1,282,999 |
| $ | 918,936 |
| |||
| Deduction for Amounts Reported under the “Stock Awards” Column in the Summary Compensation Table | $ | (1,352,549 | ) | $ | (780,045 | ) | $ | (456,100 | ) | |||
| Deduction for Amounts Reported under “Option Awards” Column in the Summary Compensation Table | $ |
|
| $ |
|
| $ |
|
| |||
| Increase for Fair Value of Awards Granted During Fiscal Year that Remain Unvested as of Year End, Determined as of Applicable Fiscal Year End(2) | $ | 1,129,060 |
| $ | 527,963 |
| $ | 401,363 |
| |||
| Increase for Fair Value of Awards Granted During Fiscal Year that Vested during Applicable Fiscal Year, Determined as of Vesting Date | $ | 262,954 |
| $ | 270,527 |
| $ | 87,885 |
| |||
| Increase/deduction for Awards Granted During Prior Fiscal Year that were Outstanding and Unvested as of Applicable Fiscal Year End | $ | 39,819 |
| $ | 8,523 |
| $ | (812,057 | ) | |||
| Increase/deduction for Awards Granted During Prior Fiscal Year that Vested During Applicable Fiscal Year | $ | (43,731 | ) | $ | 3,351 |
| $ | (265,125 | ) | |||
| Total Adjustments | $ | 35,553 |
| $ | 30,319 |
| $ | (1,044,035 | ) | |||
| Compensation Actually Paid to the Other Named Executive Officers | $ | 2,059,945 |
| $ | 1,313,317 |
| $ | (125,099 | ) | |||
| [1] | Amounts represent compensation actually paid to the following persons: (a) for 2025 — Mr. Nadav Kidron, our President, Chief Executive Officer and Chairman, Dr. Miriam Kidron, our Chief Scientific Officer and a director, and Mr. Joshua Hexter, our Chief Operating Officer; (b) for 2024 — Mr. Nadav Kidron, our President, Chief Executive Officer and Chairman, Dr. Miriam Kidron, our Chief Scientific Officer and a director, and Mr. Joshua Hexter, our Chief Operating Officer; and (c) for 2023 — Mr. Nadav Kidron, our President, Chief Executive Officer and Chairman, Dr. Miriam Kidron, our Chief Scientific Officer and a director, and Mr. Joshua Hexter, our Chief Operating Officer. As determined under SEC rules, the amounts reported in the “Compensation Actually Paid to CEO” and “Compensation Actually Paid to other NEOs” columns do not reflect the actual compensation paid to or realized by our Chief Executive Officer or our other NEOs during each applicable year. The calculation of compensation actually paid for purposes of this table includes point-in-time fair values of stock awards and these values will fluctuate based on our stock price, various accounting valuation assumptions and projected performance related to our performance awards. See “Summary Compensation Table” above for certain other compensation of our Chief Executive Officer and our other NEOs for each applicable fiscal year. |
| [2] | All fair value amounts are computed in accordance with Financial Accounting Standards Board (FASB) Accounting Standards Codification (ASC) Topic 718. |