
Innovative Industrial Properties 1 INNOVATIVE INDUSTRIAL PROPERTIES NYSE: IIPR INNOVATIVEINDUSTRIALPROPERTIES.COM COMPANY PRESENTATION – AUGUST 2026
Innovative Industrial Properties 2 This presentation and our associated comments includes "forward-looking statements" (within the meaning of the Private Securities Litigation Reform Act of 1995, Section 27A of the Securities Act of 1933, as amended, and Section 21E of the Securities Exchange Act of 1934, as amended) that are subject to risks and uncertainties. In particular, statements pertaining to our capital resources, portfolio performance and results of operations contain forward-looking statements. Likewise, our statements regarding anticipated growth in our funds from operations and anticipated market and regulatory conditions, our strategic direction, demographics, results of operations, plans and objectives are forward-looking statements. Forward-looking statements involve numerous risks and uncertainties, and you should not rely on them as predictions of future events. Forward-looking statements depend on assumptions, data or methods which may be incorrect or imprecise, and we may not be able to realize them. We do not guarantee that the transactions and events described will happen as described (or that they will happen at all). You can identify forward-looking statements by the use of forward-looking terminology such as “believes,” “expects,” “may,” “will,” “should,” “seeks,” “approximately,” “intends,” “plans,” “estimates” or “anticipates” or the negative of these words and phrases or similar words or phrases. However, the absence of these or similar words or expressions does not mean a statement is not forward-looking. You can also identify forward-looking statements by discussions of strategy, plans or intentions. The following factors, among others, could cause actual results and future events to differ materially from those set forth or contemplated in the forward-looking statements: rates of default on leases for our assets; our ability to re-lease properties upon tenant defaults or lease terminations for the rent we currently receive, or at all; concentration of our portfolio of assets and limited number of tenants; the estimated growth in and evolving market dynamics of the regulated cannabis market; defaults on our investments in real estate-related assets, such as the IQHQ credit facility and IQHQ preferred stock; our ability to identify, acquire or profitably operate life science properties; market dynamics in the life science sector; the demand for regulated cannabis cultivation and processing facilities; decreased economic activity due to fluctuations in trade policies, tariffs, and related government actions; inflation dynamics; the impact of pandemics on us, our business, our tenants, or the economy generally; war and other hostilities, including the conflicts in Ukraine and Iran; our business and investment strategy; our projected operating results; actions and initiatives of the U.S. or state governments and changes to government policies and the execution and impact of these actions, initiatives and policies, including the fact that cannabis remains illegal under federal law; availability of suitable investment opportunities in the regulated cannabis industry; our understanding of our competition and our potential tenants’ alternative financing sources; the expected medical-use or adult-use cannabis legalization in certain states; shifts in public opinion regarding regulated cannabis; the potential impact on us from litigation matters, and governmental inquiries, investigations, subpoenas, or enforcement actions, including rising liability and insurance costs; the additional risks that may be associated with certain of our tenants cultivating, processing and/or dispensing adult-use cannabis in our facilities; the state of the U.S. economy generally or in specific geographic areas; economic trends and economic recoveries; our ability to access equity or debt capital; financing rates for our target assets; our level of indebtedness, which could reduce funds available for other business purposes and reduce our operational flexibility; covenants in our debt instruments, which may limit our flexibility and adversely affect our financial condition; our ability to maintain our investment grade credit rating; changes in the values of our assets; our expected portfolio of assets; our expected investments; interest rate mismatches between our assets and our borrowings used to fund such investments; changes in interest rates and the market value of our assets; the degree to which any interest rate or other hedging strategies may or may not protect us from interest rate volatility; the impact of and changes in governmental regulations, tax law and rates, accounting guidance and similar matters; how and when any forward equity sales may settle; our ability to maintain our qualification as a real estate investment trust (“REIT”) for U.S. federal income tax purposes; our ability to maintain our exemption from registration under the Investment Company Act of 1940; availability of qualified personnel; and market trends in our industry, interest rates, real estate values, the securities markets or the general economy. The risks included here are not exhaustive, and additional factors could adversely affect our business and financial performance, including, but not limited to, those risk factors described in our Securities and Exchange Commission (“SEC”) filings, our Annual Report on Form 10-K for the year ended December 31, 2025 (“2025 Form 10-K”) under Item 1A, as supplemented by the discussion in Item 1A of Part II of our subsequent Quarterly Reports on Form 10-Q. Those risks continue to be relevant to our performance and financial condition. Moreover, we operate in a very competitive and rapidly changing environment. New risk factors emerge from time to time and it is not possible for management to predict all such risk factors, nor can it assess the impact of all such risk factors on our business or the extent to which any factor, or combination of factors, may cause actual results to differ materially from those contained in any forward-looking statements. Any forward-looking statement made by us speaks only of the date on which we make it. We undertake no obligation to publicly update or revise any forward-looking statements, whether as a result of new information, future events or otherwise, except as may be required by law. Stockholders and investors are cautioned not to unduly rely on such forward-looking statements when evaluating the information presented in our filings and reports. This presentation includes certain non-GAAP financial measures. These non-GAAP measures are presented for supplemental information and should not be considered a substitute for financial information presented in accordance with GAAP. A reconciliation of these non-GAAP measures to the most directly comparable GAAP measures is set forth in the Appendix to this presentation. Market and industry data are included in this presentation. We have obtained substantially all of this information from internal studies, public filings, other independent published industry sources and market studies prepared by third parties. We believe these internal studies, public filings, other independent published industry sources and market studies prepared by third parties are reliable. However, this information may prove to be inaccurate. No representation or warranty is made as to the accuracy of such information. All amounts shown in this presentation are unaudited. This is not an offer to sell or solicitation to buy securities of Innovative Industrial Properties, Inc. Any offers to sell or solicitations to buy securities of Innovative Industrial Properties, Inc. shall be made only by means of a prospectus approved for that purpose. FORWARD LOOKING STATEMENTS
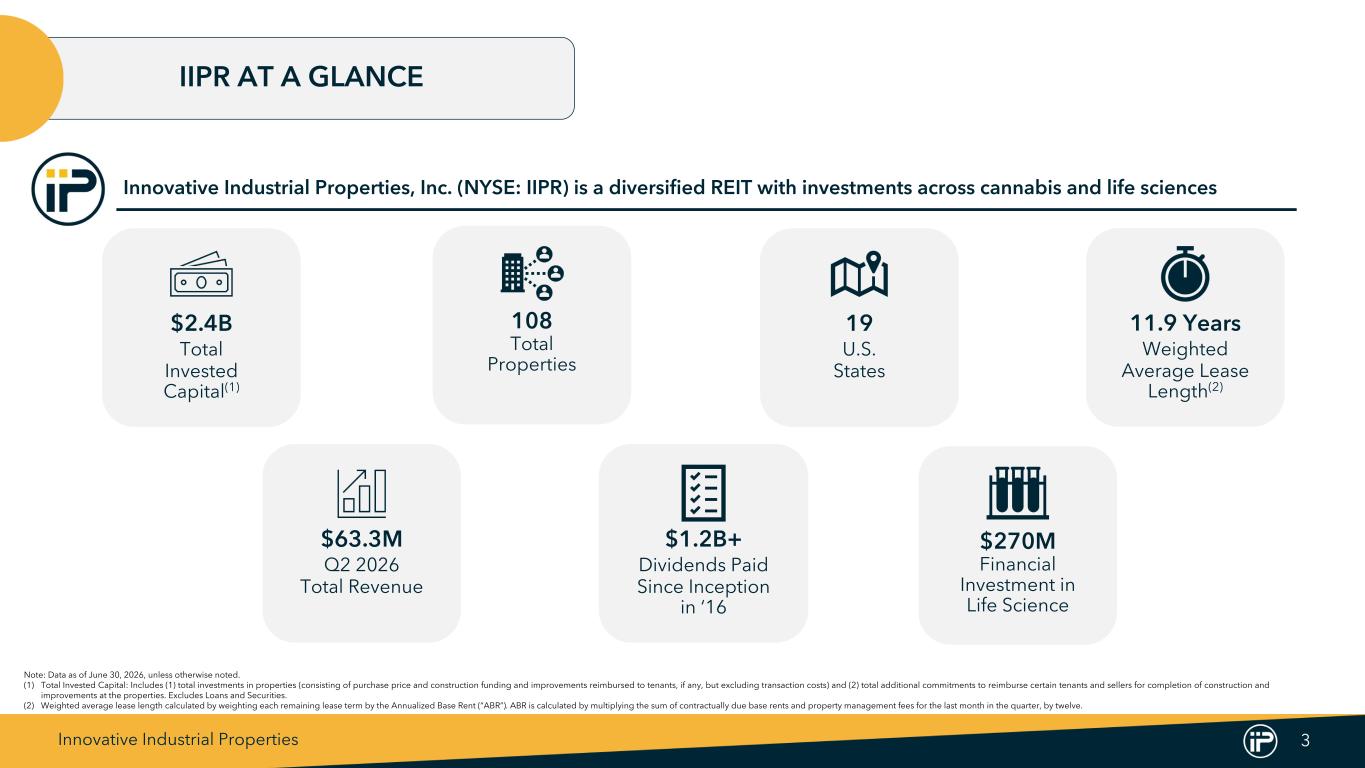
Innovative Industrial Properties 3 Note: Data as of June 30, 2026, unless otherwise noted. (1) Total Invested Capital: Includes (1) total investments in properties (consisting of purchase price and construction funding and improvements reimbursed to tenants, if any, but excluding transaction costs) and (2) total additional commitments to reimburse certain tenants and sellers for completion of construction and improvements at the properties. Excludes Loans and Securities. (2) Weighted average lease length calculated by weighting each remaining lease term by the Annualized Base Rent (“ABR”). ABR is calculated by multiplying the sum of contractually due base rents and property management fees for the last month in the quarter, by twelve. IIPR AT A GLANCE $2.4B Total Invested Capital(1) 108 Total Properties 11.9 Years Weighted Average Lease Length(2) $63.3M Q2 2026 Total Revenue $270M Financial Investment in Life Science 19 U.S. States $1.2B+ Dividends Paid Since Inception in ‘16 Innovative Industrial Properties, Inc. (NYSE: IIPR) is a diversified REIT with investments across cannabis and life sciences
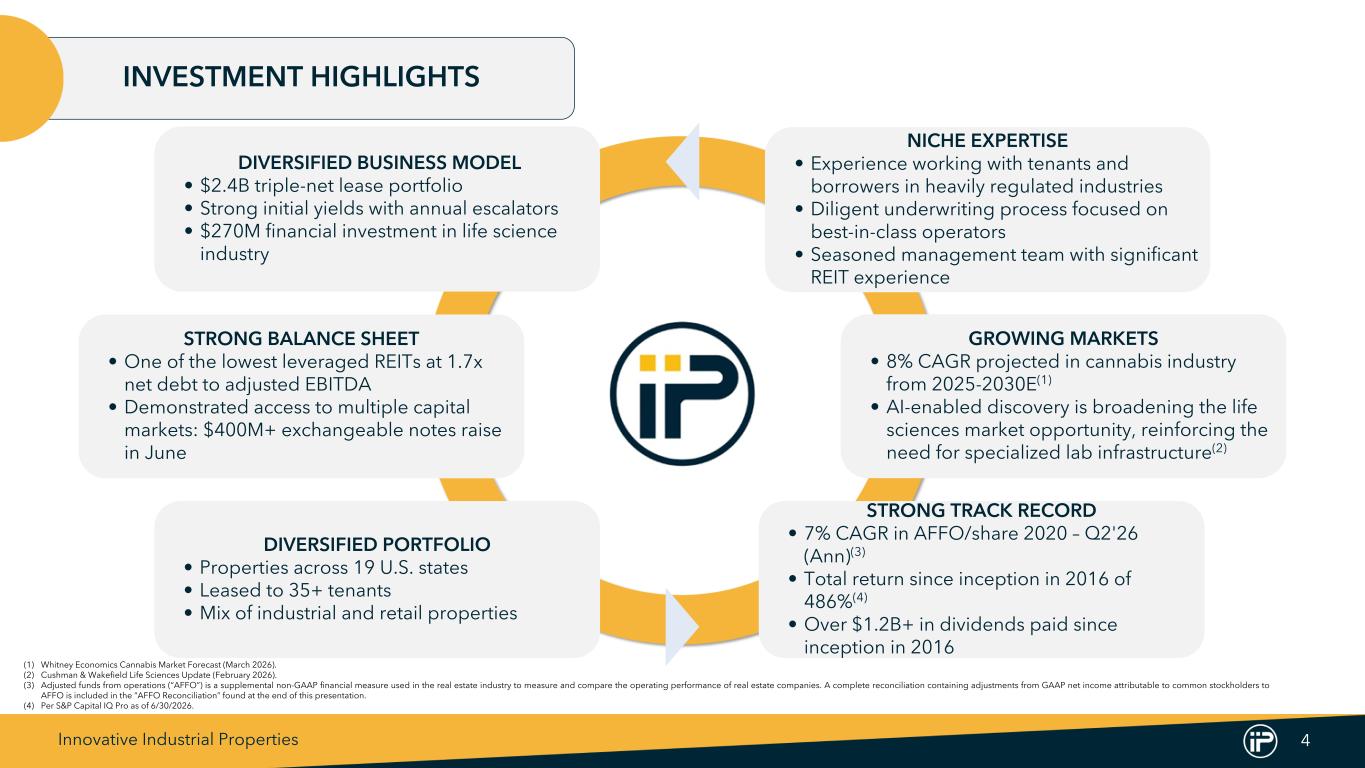
Innovative Industrial Properties 4 INVESTMENT HIGHLIGHTS DIVERSIFIED BUSINESS MODEL • $2.4B triple-net lease portfolio • Strong initial yields with annual escalators • $270M financial investment in life science industry STRONG BALANCE SHEET • One of the lowest leveraged REITs at 1.7x net debt to adjusted EBITDA • Demonstrated access to multiple capital markets: $400M+ exchangeable notes raise in June DIVERSIFIED PORTFOLIO • Properties across 19 U.S. states • Leased to 35+ tenants • Mix of industrial and retail properties NICHE EXPERTISE • Experience working with tenants and borrowers in heavily regulated industries • Diligent underwriting process focused on best-in-class operators • Seasoned management team with significant REIT experience STRONG TRACK RECORD • 7% CAGR in AFFO/share 2020 – Q2'26 (Ann)(3) • Total return since inception in 2016 of 486%(4) • Over $1.2B+ in dividends paid since inception in 2016 (1) Whitney Economics Cannabis Market Forecast (March 2026). (2) Cushman & Wakefield Life Sciences Update (February 2026). (3) Adjusted funds from operations (“AFFO”) is a supplemental non-GAAP financial measure used in the real estate industry to measure and compare the operating performance of real estate companies. A complete reconciliation containing adjustments from GAAP net income attributable to common stockholders to AFFO is included in the “AFFO Reconciliation” found at the end of this presentation. (4) Per S&P Capital IQ Pro as of 6/30/2026. GROWING MARKETS • 8% CAGR projected in cannabis industry from 2025-2030E(1) • AI-enabled discovery is broadening the life sciences market opportunity, reinforcing the need for specialized lab infrastructure(2)
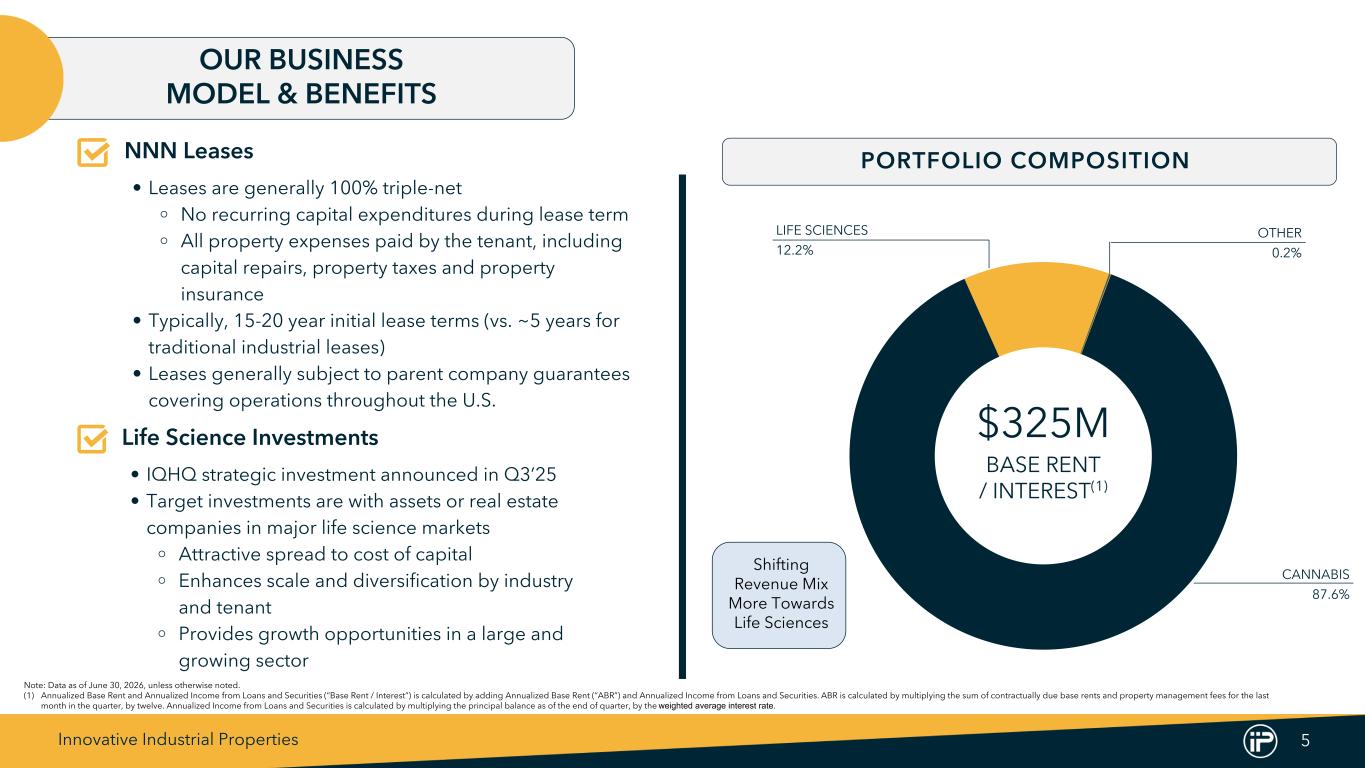
Innovative Industrial Properties 5 NNN Leases • Leases are generally 100% triple-net ⚬ No recurring capital expenditures during lease term ⚬ All property expenses paid by the tenant, including capital repairs, property taxes and property insurance • Typically, 15-20 year initial lease terms (vs. ~5 years for traditional industrial leases) • Leases generally subject to parent company guarantees covering operations throughout the U.S. Life Science Investments • IQHQ strategic investment announced in Q3’25 • Target investments are with assets or real estate companies in major life science markets ⚬ Attractive spread to cost of capital ⚬ Enhances scale and diversification by industry and tenant ⚬ Provides growth opportunities in a large and growing sector OUR BUSINESS MODEL & BENEFITS PORTFOLIO COMPOSITION CANNABIS 87.6% LIFE SCIENCES 12.2% $325M BASE RENT / INTEREST(1) OTHER 0.2% Shifting Revenue Mix More Towards Life Sciences Note: Data as of June 30, 2026, unless otherwise noted. (1) Annualized Base Rent and Annualized Income from Loans and Securities (“Base Rent / Interest”) is calculated by adding Annualized Base Rent (“ABR”) and Annualized Income from Loans and Securities. ABR is calculated by multiplying the sum of contractually due base rents and property management fees for the last month in the quarter, by twelve. Annualized Income from Loans and Securities is calculated by multiplying the principal balance as of the end of quarter, by the weighted average interest rate.
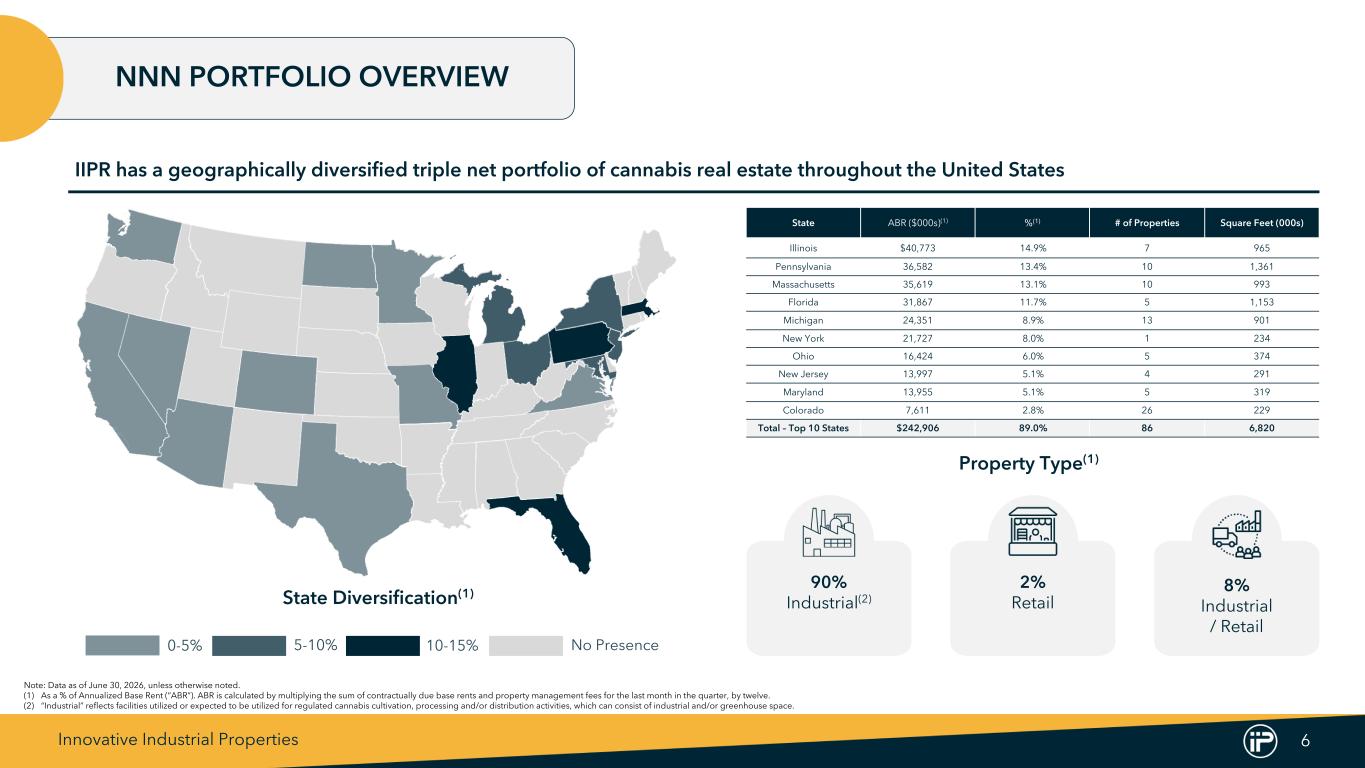
Innovative Industrial Properties 6 NNN PORTFOLIO OVERVIEW IIPR has a geographically diversified triple net portfolio of cannabis real estate throughout the United States Note: Data as of June 30, 2026, unless otherwise noted. (1) As a % of Annualized Base Rent (“ABR”). ABR is calculated by multiplying the sum of contractually due base rents and property management fees for the last month in the quarter, by twelve. (2) “Industrial” reflects facilities utilized or expected to be utilized for regulated cannabis cultivation, processing and/or distribution activities, which can consist of industrial and/or greenhouse space. Property Type(1) State Diversification(1) State ABR ($000s)(1) %(1) # of Properties Square Feet (000s) Illinois $40,773 14.9% 7 965 Pennsylvania 36,582 13.4% 10 1,361 Massachusetts 35,619 13.1% 10 993 Florida 31,867 11.7% 5 1,153 Michigan 24,351 8.9% 13 901 New York 21,727 8.0% 1 234 Ohio 16,424 6.0% 5 374 New Jersey 13,997 5.1% 4 291 Maryland 13,955 5.1% 5 319 Colorado 7,611 2.8% 26 229 Total – Top 10 States $242,906 89.0% 86 6,820 10-15% No Presence0-5% 5-10% 2% Retail 90% Industrial(2) 8% Industrial / Retail
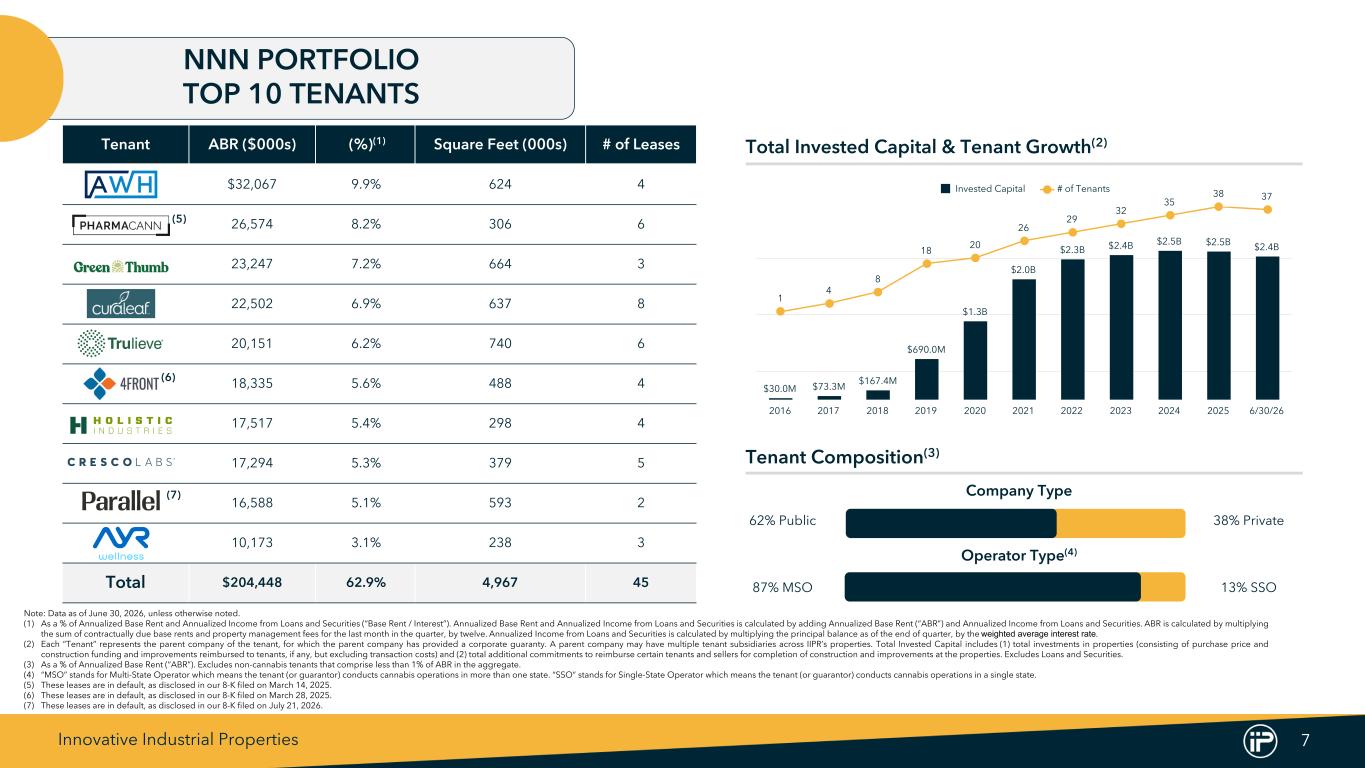
Innovative Industrial Properties 7 Tenant ABR ($000s) (%)(1) Square Feet (000s) # of Leases $32,067 9.9% 624 4 26,574 8.2% 306 6 23,247 7.2% 664 3 22,502 6.9% 637 8 20,151 6.2% 740 6 18,335 5.6% 488 4 17,517 5.4% 298 4 17,294 5.3% 379 5 16,588 5.1% 593 2 10,173 3.1% 238 3 Total $204,448 62.9% 4,967 45 $30.0M $73.3M $167.4M $690.0M $1.3B $2.0B $2.3B $2.4B $2.5B $2.5B $2.4B 1 4 8 18 20 26 29 32 35 38 37 Invested Capital # of Tenants 2016 2017 2018 2019 2020 2021 2022 2023 2024 2025 6/30/26 NNN PORTFOLIO TOP 10 TENANTS Note: Data as of June 30, 2026, unless otherwise noted. (1) As a % of Annualized Base Rent and Annualized Income from Loans and Securities (“Base Rent / Interest”). Annualized Base Rent and Annualized Income from Loans and Securities is calculated by adding Annualized Base Rent (“ABR”) and Annualized Income from Loans and Securities. ABR is calculated by multiplying the sum of contractually due base rents and property management fees for the last month in the quarter, by twelve. Annualized Income from Loans and Securities is calculated by multiplying the principal balance as of the end of quarter, by the weighted average interest rate. (2) Each “Tenant” represents the parent company of the tenant, for which the parent company has provided a corporate guaranty. A parent company may have multiple tenant subsidiaries across IIPR’s properties. Total Invested Capital includes (1) total investments in properties (consisting of purchase price and construction funding and improvements reimbursed to tenants, if any, but excluding transaction costs) and (2) total additional commitments to reimburse certain tenants and sellers for completion of construction and improvements at the properties. Excludes Loans and Securities. (3) As a % of Annualized Base Rent (“ABR”). Excludes non-cannabis tenants that comprise less than 1% of ABR in the aggregate. (4) “MSO” stands for Multi-State Operator which means the tenant (or guarantor) conducts cannabis operations in more than one state. “SSO” stands for Single-State Operator which means the tenant (or guarantor) conducts cannabis operations in a single state. (5) These leases are in default, as disclosed in our 8-K filed on March 14, 2025. (6) These leases are in default, as disclosed in our 8-K filed on March 28, 2025. (7) These leases are in default, as disclosed in our 8-K filed on July 21, 2026. Company Type 62% Public 38% Private Total Invested Capital & Tenant Growth(2) Tenant Composition(3) Operator Type(4) 87% MSO 13% SSO (5) (6) (7)
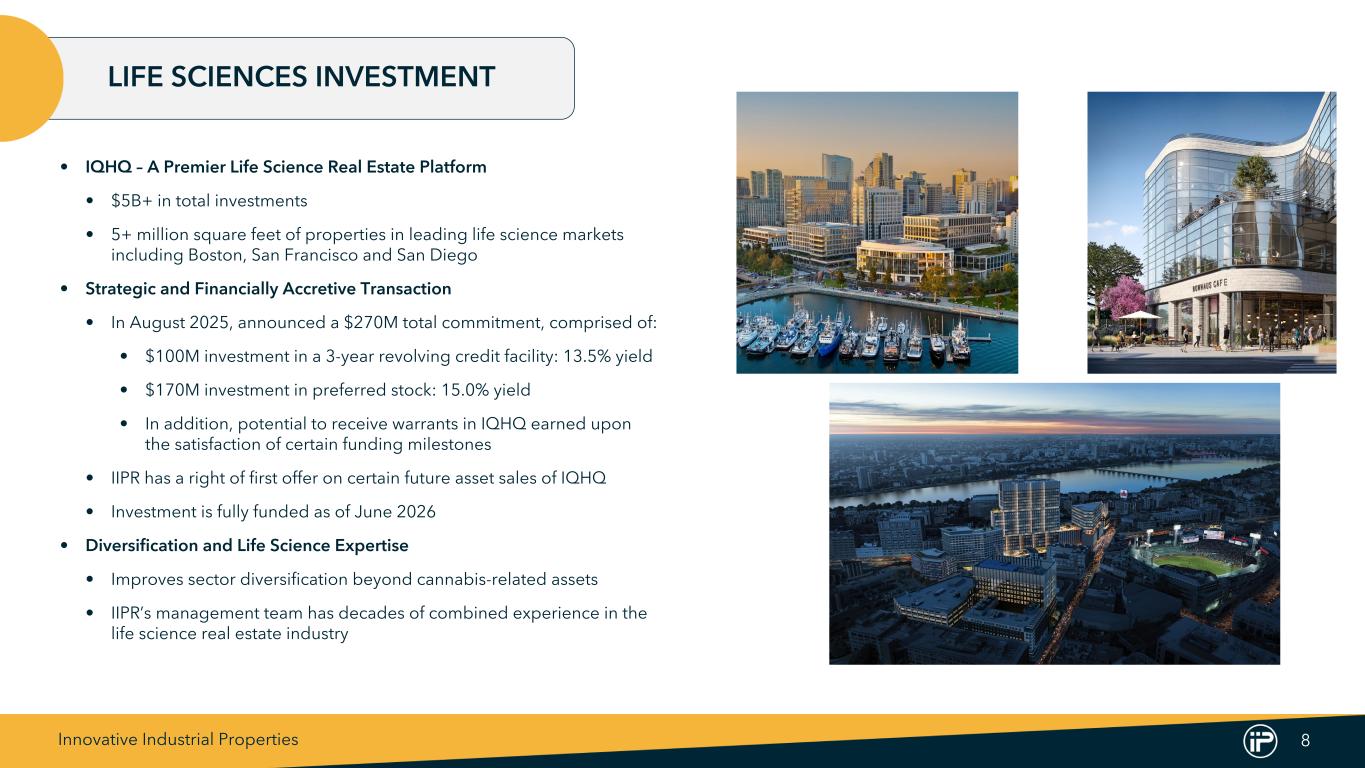
Innovative Industrial Properties 8 LIFE SCIENCES INVESTMENT • IQHQ – A Premier Life Science Real Estate Platform • $5B+ in total investments • 5+ million square feet of properties in leading life science markets including Boston, San Francisco and San Diego • Strategic and Financially Accretive Transaction • In August 2025, announced a $270M total commitment, comprised of: • $100M investment in a 3-year revolving credit facility: 13.5% yield • $170M investment in preferred stock: 15.0% yield • In addition, potential to receive warrants in IQHQ earned upon the satisfaction of certain funding milestones • IIPR has a right of first offer on certain future asset sales of IQHQ • Investment is fully funded as of June 2026 • Diversification and Life Science Expertise • Improves sector diversification beyond cannabis-related assets • IIPR’s management team has decades of combined experience in the life science real estate industry
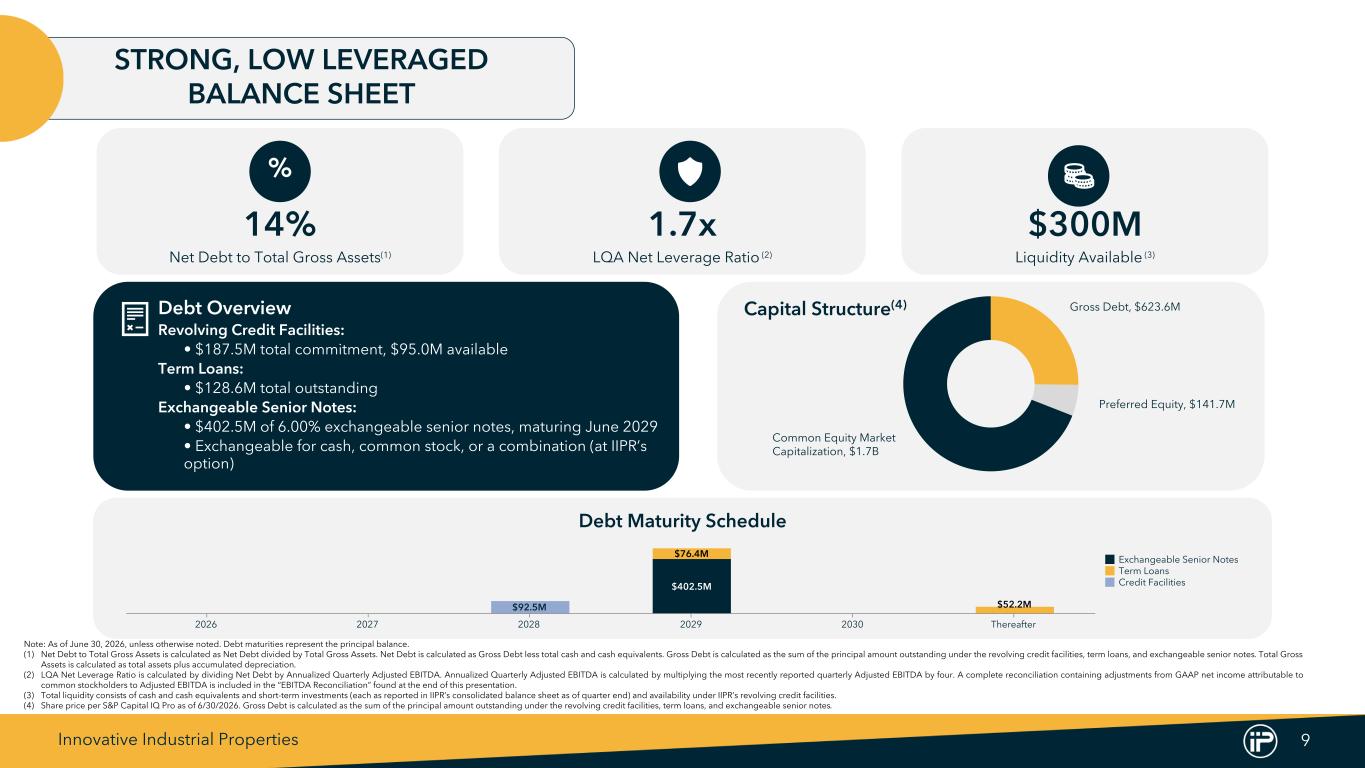
Innovative Industrial Properties 9 Gross Debt, $623.6M Preferred Equity, $141.7M Common Equity Market Capitalization, $1.7B STRONG, LOW LEVERAGED BALANCE SHEET Debt Overview Revolving Credit Facilities: • • $187.5M total commitment, $95.0M available Term Loans: • • $128.6M total outstanding Exchangeable Senior Notes: • • $402.5M of 6.00% exchangeable senior notes, maturing June 2029 • • Exchangeable for cash, common stock, or a combination (at IIPR’s option) 14% Net Debt to Total Gross Assets(1) 1.7x LQA Net Leverage Ratio (2) $300M Liquidity Available (3) % $402.5M $76.4M $52.2M$92.5M Exchangeable Senior Notes Term Loans Credit Facilities 2026 2027 2028 2029 2030 Thereafter Note: As of June 30, 2026, unless otherwise noted. Debt maturities represent the principal balance. (1) Net Debt to Total Gross Assets is calculated as Net Debt divided by Total Gross Assets. Net Debt is calculated as Gross Debt less total cash and cash equivalents. Gross Debt is calculated as the sum of the principal amount outstanding under the revolving credit facilities, term loans, and exchangeable senior notes. Total Gross Assets is calculated as total assets plus accumulated depreciation. (2) LQA Net Leverage Ratio is calculated by dividing Net Debt by Annualized Quarterly Adjusted EBITDA. Annualized Quarterly Adjusted EBITDA is calculated by multiplying the most recently reported quarterly Adjusted EBITDA by four. A complete reconciliation containing adjustments from GAAP net income attributable to common stockholders to Adjusted EBITDA is included in the “EBITDA Reconciliation” found at the end of this presentation. (3) Total liquidity consists of cash and cash equivalents and short-term investments (each as reported in IIPR’s consolidated balance sheet as of quarter end) and availability under IIPR’s revolving credit facilities. (4) Share price per S&P Capital IQ Pro as of 6/30/2026. Gross Debt is calculated as the sum of the principal amount outstanding under the revolving credit facilities, term loans, and exchangeable senior notes. Debt Maturity Schedule Capital Structure(4)
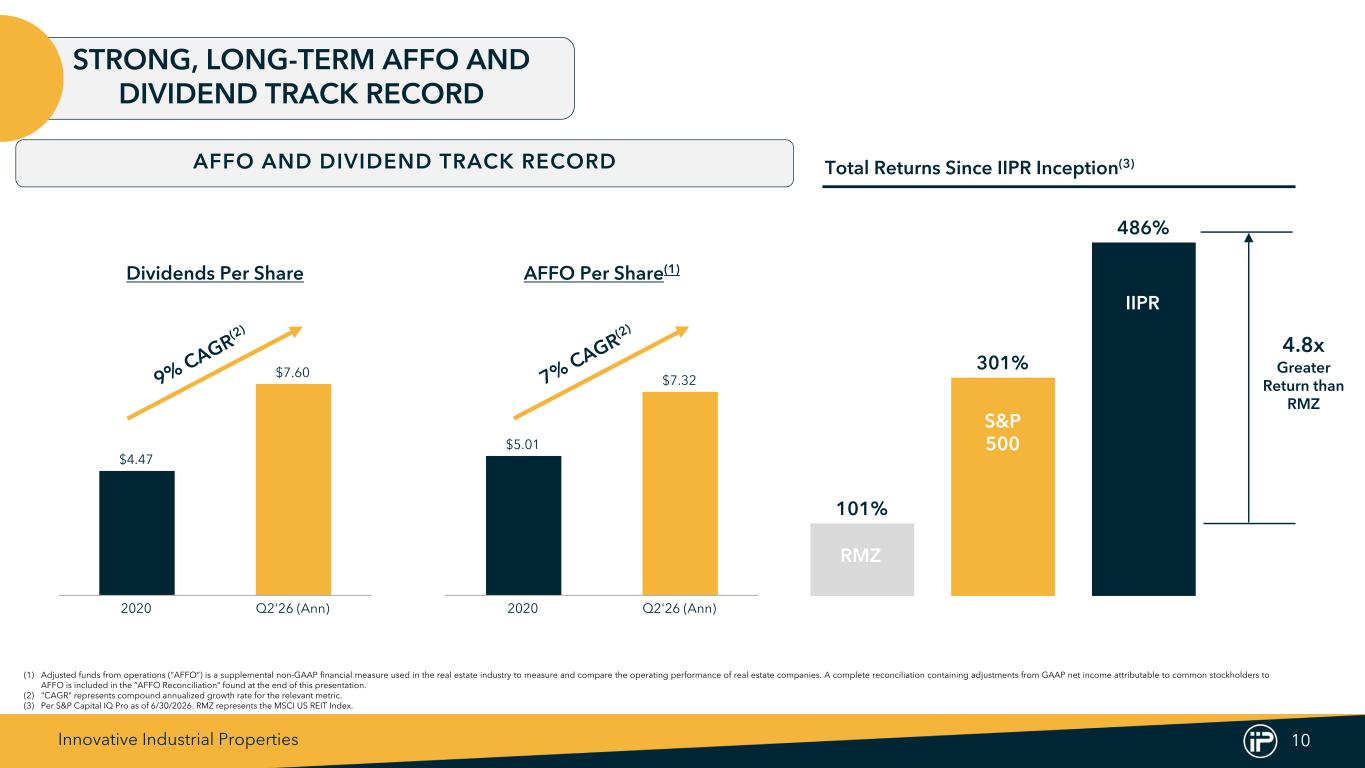
Innovative Industrial Properties 10 101% 301% 486% STRONG, LONG-TERM AFFO AND DIVIDEND TRACK RECORD (1) Adjusted funds from operations (“AFFO”) is a supplemental non-GAAP financial measure used in the real estate industry to measure and compare the operating performance of real estate companies. A complete reconciliation containing adjustments from GAAP net income attributable to common stockholders to AFFO is included in the “AFFO Reconciliation” found at the end of this presentation. (2) "CAGR" represents compound annualized growth rate for the relevant metric. (3) Per S&P Capital IQ Pro as of 6/30/2026. RMZ represents the MSCI US REIT Index. 9% CAGR(2) Total Returns Since IIPR Inception(3) 4.8x Greater Return than RMZ AFFO AND DIVIDEND TRACK RECORD $4.47 $7.60 2020 Q2'26 (Ann) Dividends Per Share 7% CAGR(2) $5.01 $7.32 2020 Q2'26 (Ann) AFFO Per Share(1) RMZ S&P 500 IIPR
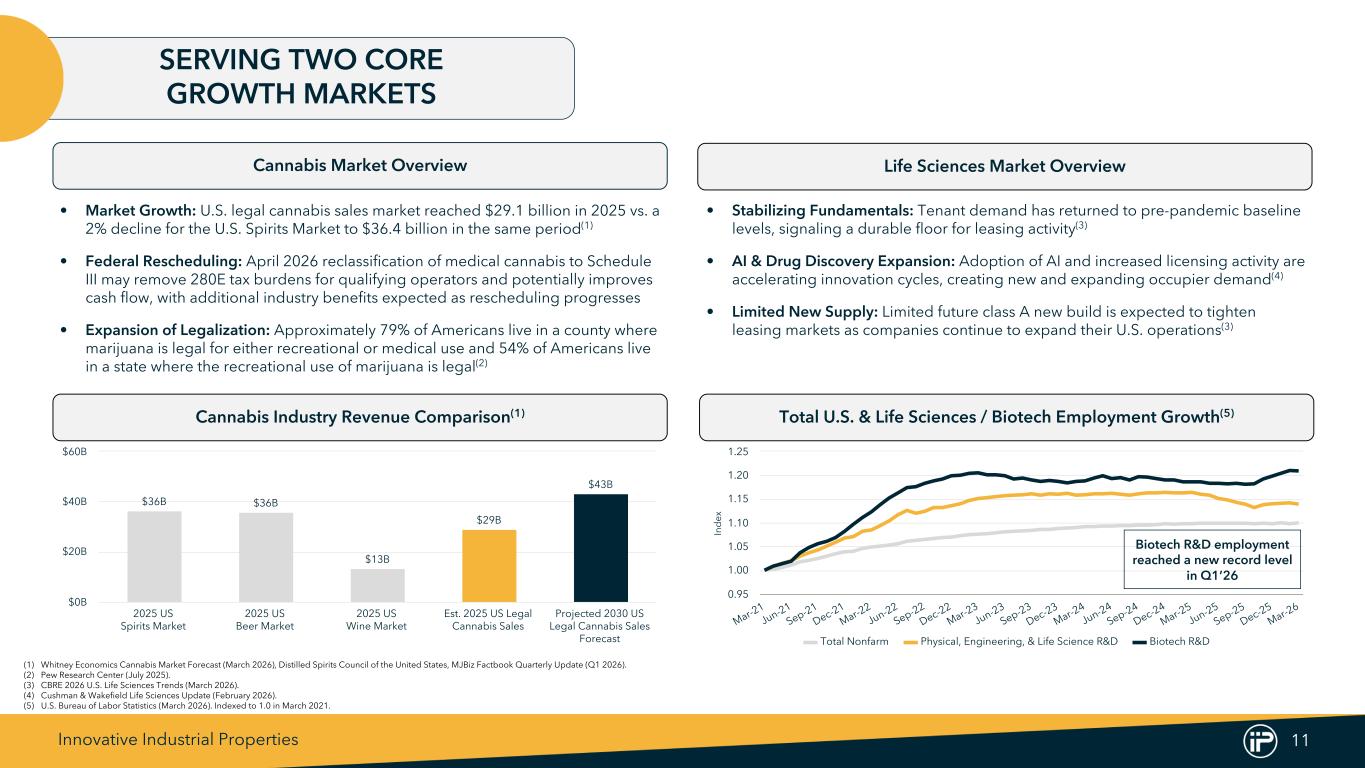
Innovative Industrial Properties 11 In d ex Total Nonfarm Physical, Engineering, & Life Science R&D Biotech R&D Mar-2 1 Jun-21 Sep-21 Dec-21 Mar-2 2 Jun-22 Sep-22 Dec-22 Mar-2 3 Jun-23 Sep-23 Dec-23 Mar-2 4 Jun-24 Sep-24 Dec-24 Mar-2 5 Jun-25 Sep-25 Dec-25 Mar-2 6 0.95 1.00 1.05 1.10 1.15 1.20 1.25 $36B $36B $13B $29B $43B 2025 US Spirits Market 2025 US Beer Market 2025 US Wine Market Est. 2025 US Legal Cannabis Sales Projected 2030 US Legal Cannabis Sales Forecast $0B $20B $40B $60B Cannabis Market Overview SERVING TWO CORE GROWTH MARKETS Life Sciences Market Overview Cannabis Industry Revenue Comparison(1) Total U.S. & Life Sciences / Biotech Employment Growth(5) • Market Growth: U.S. legal cannabis sales market reached $29.1 billion in 2025 vs. a 2% decline for the U.S. Spirits Market to $36.4 billion in the same period(1) • Federal Rescheduling: April 2026 reclassification of medical cannabis to Schedule III may remove 280E tax burdens for qualifying operators and potentially improves cash flow, with additional industry benefits expected as rescheduling progresses • Expansion of Legalization: Approximately 79% of Americans live in a county where marijuana is legal for either recreational or medical use and 54% of Americans live in a state where the recreational use of marijuana is legal(2) Biotech R&D employment reached a new record level in Q1’26 (1) Whitney Economics Cannabis Market Forecast (March 2026), Distilled Spirits Council of the United States, MJBiz Factbook Quarterly Update (Q1 2026). (2) Pew Research Center (July 2025). (3) CBRE 2026 U.S. Life Sciences Trends (March 2026). (4) Cushman & Wakefield Life Sciences Update (February 2026). (5) U.S. Bureau of Labor Statistics (March 2026). Indexed to 1.0 in March 2021. • Stabilizing Fundamentals: Tenant demand has returned to pre-pandemic baseline levels, signaling a durable floor for leasing activity(3) • AI & Drug Discovery Expansion: Adoption of AI and increased licensing activity are accelerating innovation cycles, creating new and expanding occupier demand(4) • Limited New Supply: Limited future class A new build is expected to tighten leasing markets as companies continue to expand their U.S. operations(3)
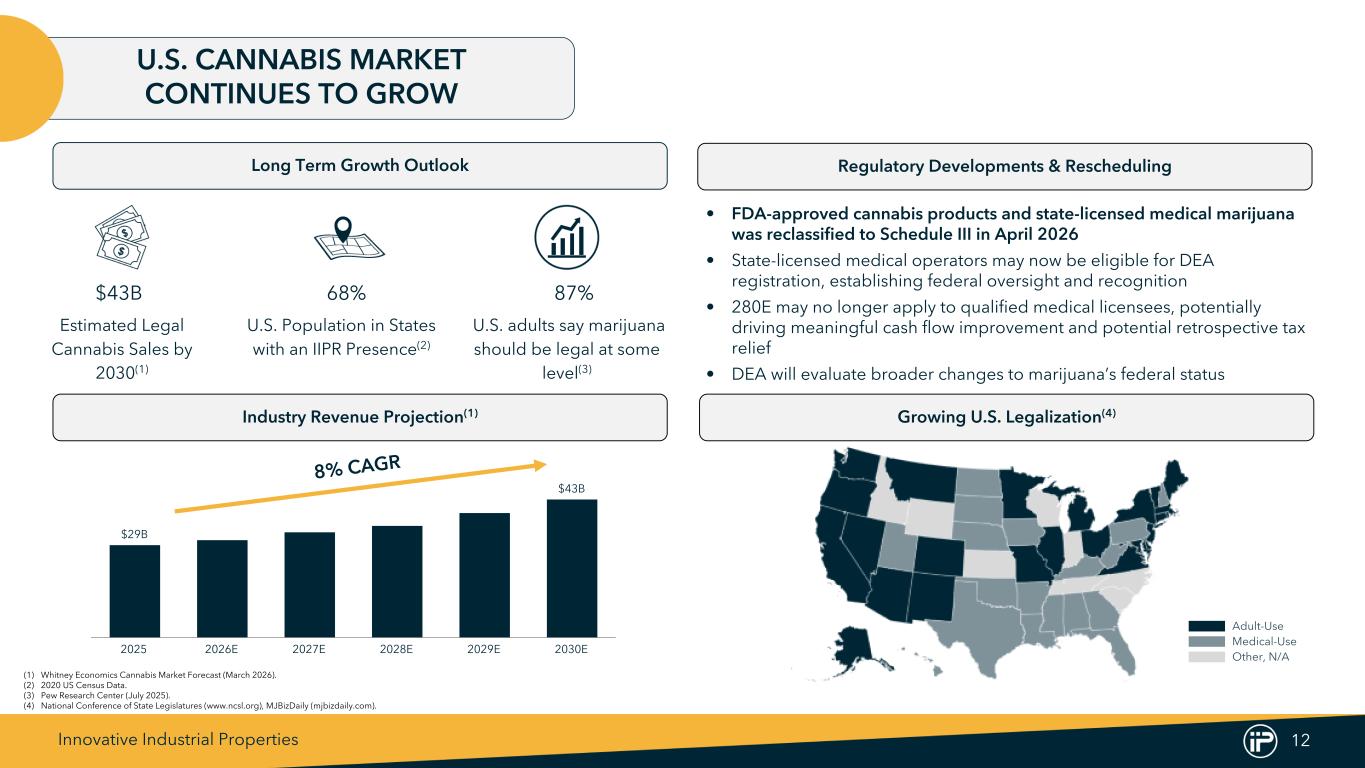
Innovative Industrial Properties 12 Long Term Growth Outlook U.S. CANNABIS MARKET CONTINUES TO GROW Regulatory Developments & Rescheduling Industry Revenue Projection(1) Growing U.S. Legalization(4) (1) Whitney Economics Cannabis Market Forecast (March 2026). (2) 2020 US Census Data. (3) Pew Research Center (July 2025). (4) National Conference of State Legislatures (www.ncsl.org), MJBizDaily (mjbizdaily.com). Other, N/A Adult-Use Medical-Use 8% CAGR $43B Estimated Legal Cannabis Sales by 2030(1) 68% U.S. Population in States with an IIPR Presence(2) 87% U.S. adults say marijuana should be legal at some level(3) • FDA-approved cannabis products and state-licensed medical marijuana was reclassified to Schedule III in April 2026 • State-licensed medical operators may now be eligible for DEA registration, establishing federal oversight and recognition • 280E may no longer apply to qualified medical licensees, potentially driving meaningful cash flow improvement and potential retrospective tax relief • DEA will evaluate broader changes to marijuana’s federal status $29B $43B 2025 2026E 2027E 2028E 2029E 2030E
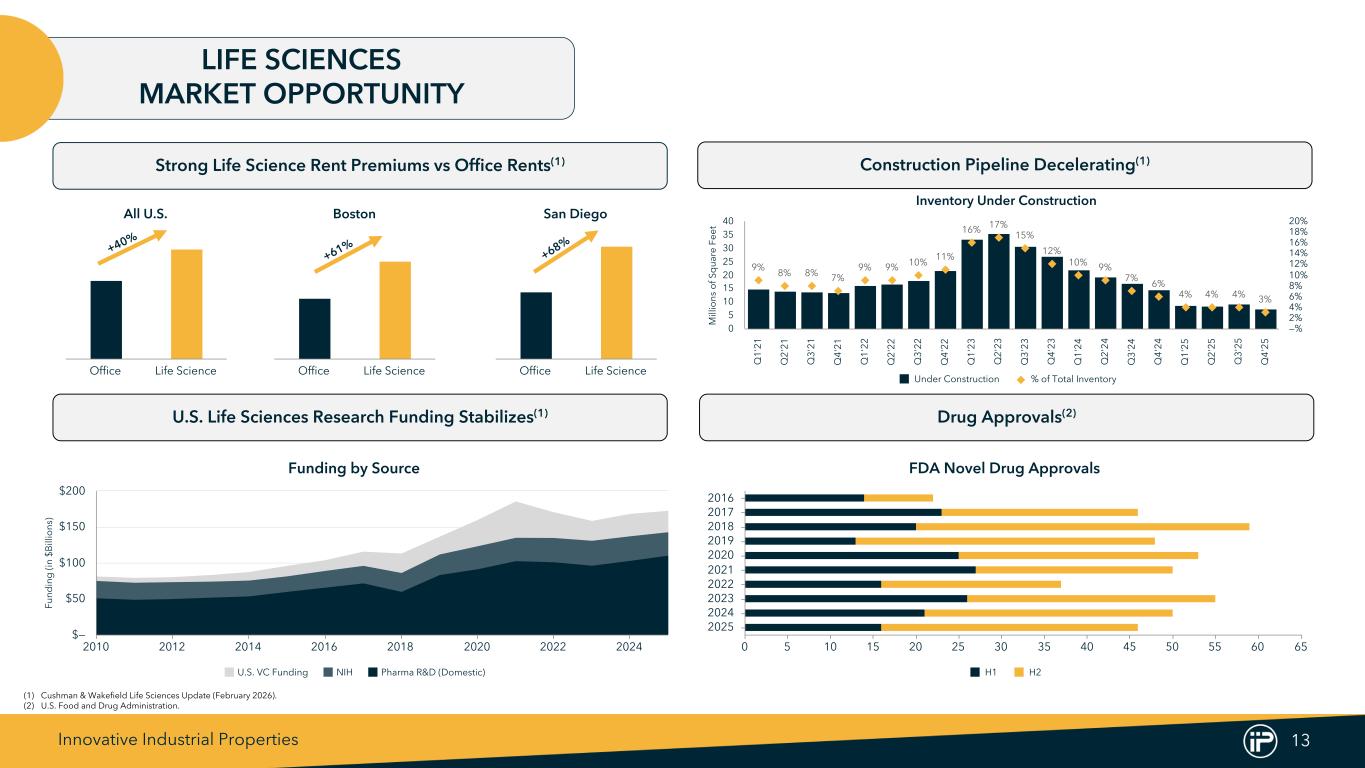
Innovative Industrial Properties 13 All U.S. Office Life Science Boston Office Life Science San Diego Office Life Science Strong Life Science Rent Premiums vs Office Rents(1) LIFE SCIENCES MARKET OPPORTUNITY Construction Pipeline Decelerating(1) U.S. Life Sciences Research Funding Stabilizes(1) Drug Approvals(2) (1) Cushman & Wakefield Life Sciences Update (February 2026). (2) U.S. Food and Drug Administration. +40% +68% +61% M ill io ns o f S q ua re F ee t Inventory Under Construction 9% 8% 8% 7% 9% 9% 10% 11% 16% 17% 15% 12% 10% 9% 7% 6% 4% 4% 4% 3% Under Construction % of Total Inventory Q 1' 21 Q 2' 21 Q 3' 21 Q 4' 21 Q 1' 22 Q 2' 22 Q 3' 22 Q 4' 22 Q 1' 23 Q 2' 23 Q 3' 23 Q 4' 23 Q 1' 24 Q 2' 24 Q 3' 24 Q 4' 24 Q 1' 25 Q 2' 25 Q 3' 25 Q 4' 25 0 5 10 15 20 25 30 35 40 —% 2% 4% 6% 8% 10% 12% 14% 16% 18% 20% FDA Novel Drug Approvals H1 H2 0 5 10 15 20 25 30 35 40 45 50 55 60 65 2016 2017 2018 2019 2020 2021 2022 2023 2024 2025 Fu nd in g (i n $B ill io ns ) Funding by Source U.S. VC Funding NIH Pharma R&D (Domestic) 2010 2012 2014 2016 2018 2020 2022 2024 $— $50 $100 $150 $200
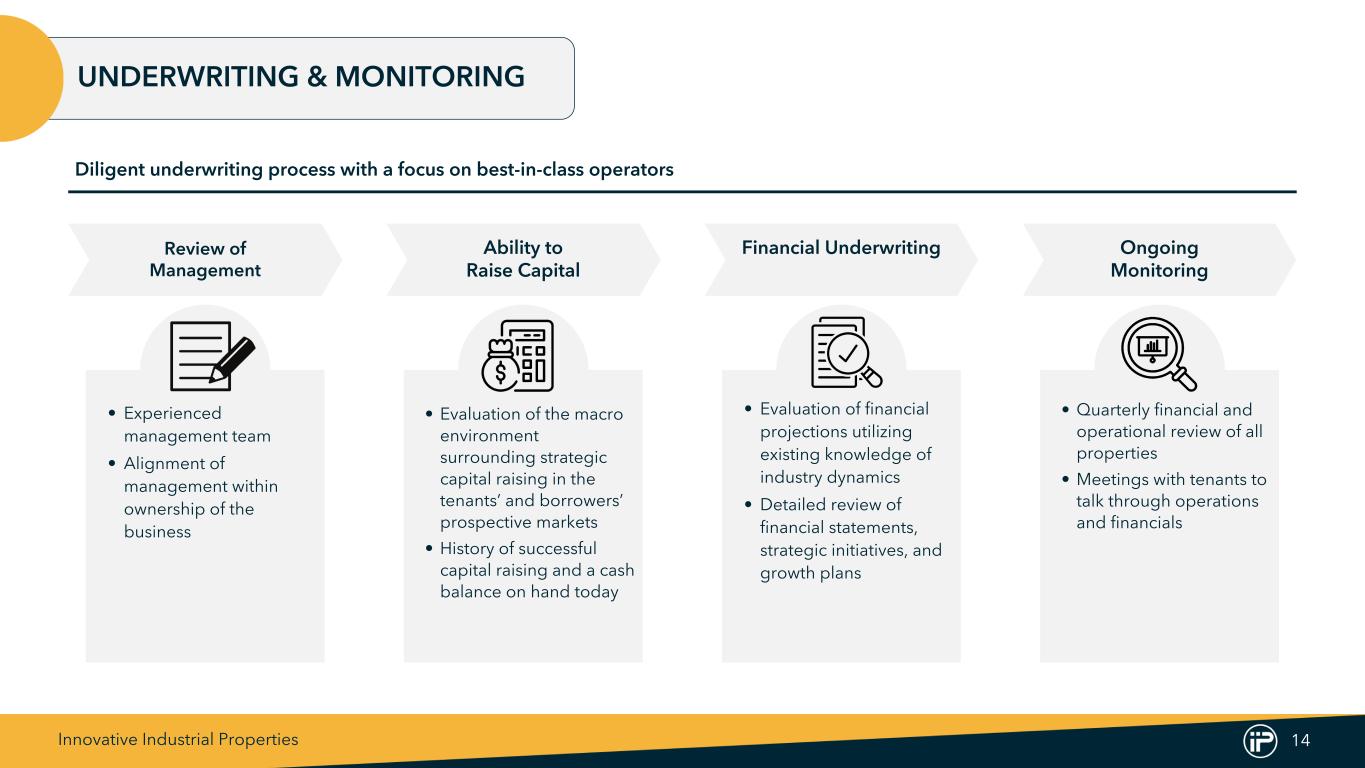
Innovative Industrial Properties 14 UNDERWRITING & MONITORING Diligent underwriting process with a focus on best-in-class operators Review of Management • Experienced management team • Alignment of management within ownership of the business Ability to Raise Capital • Evaluation of the macro environment surrounding strategic capital raising in the tenants’ and borrowers’ prospective markets • History of successful capital raising and a cash balance on hand today Financial Underwriting • Evaluation of financial projections utilizing existing knowledge of industry dynamics • Detailed review of financial statements, strategic initiatives, and growth plans Ongoing Monitoring • Quarterly financial and operational review of all properties • Meetings with tenants to talk through operations and financials
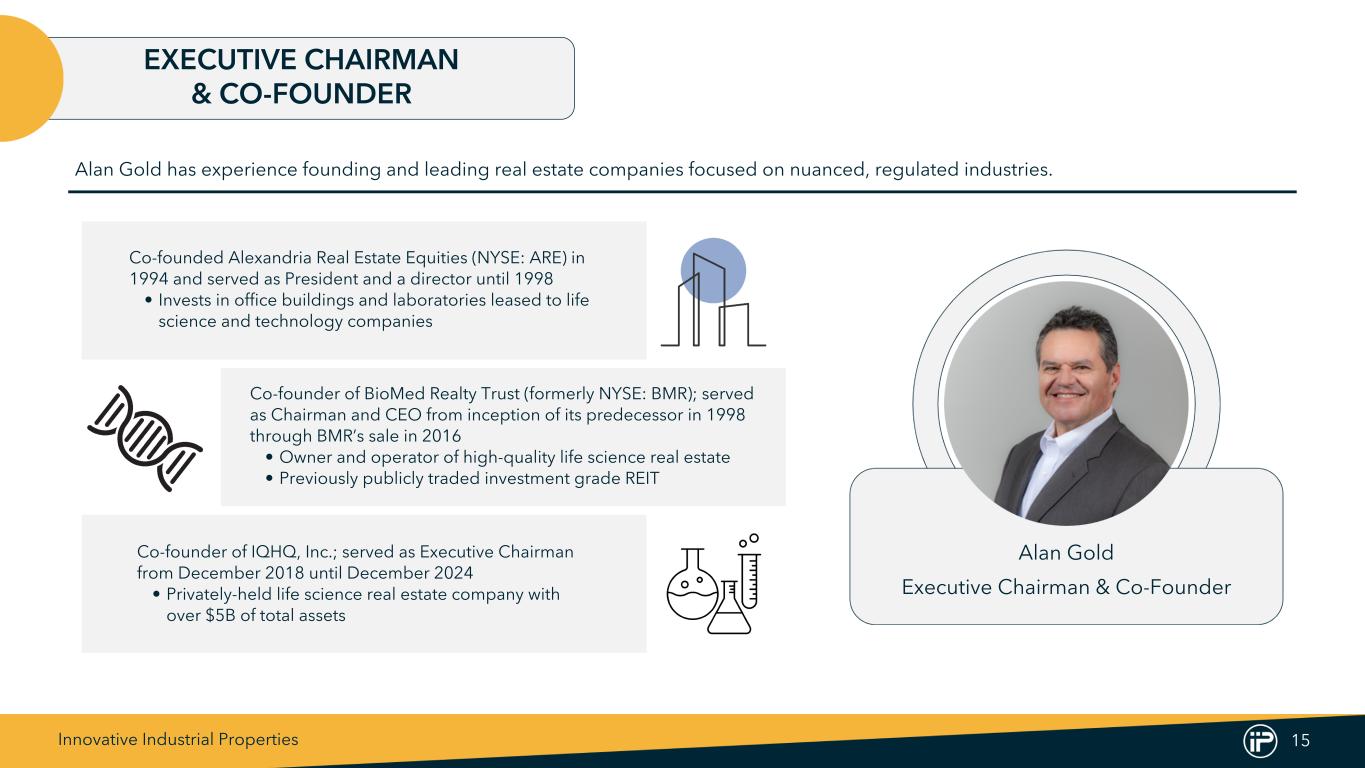
Innovative Industrial Properties 15 Alan Gold Executive Chairman & Co-Founder Co-founder of BioMed Realty Trust (formerly NYSE: BMR); served as Chairman and CEO from inception of its predecessor in 1998 through BMR’s sale in 2016 • Owner and operator of high-quality life science real estate • Previously publicly traded investment grade REIT Co-founded Alexandria Real Estate Equities (NYSE: ARE) in 1994 and served as President and a director until 1998 • Invests in office buildings and laboratories leased to life science and technology companies Co-founder of IQHQ, Inc.; served as Executive Chairman from December 2018 until December 2024 • Privately-held life science real estate company with over $5B of total assets EXECUTIVE CHAIRMAN & CO-FOUNDER Alan Gold has experience founding and leading real estate companies focused on nuanced, regulated industries.
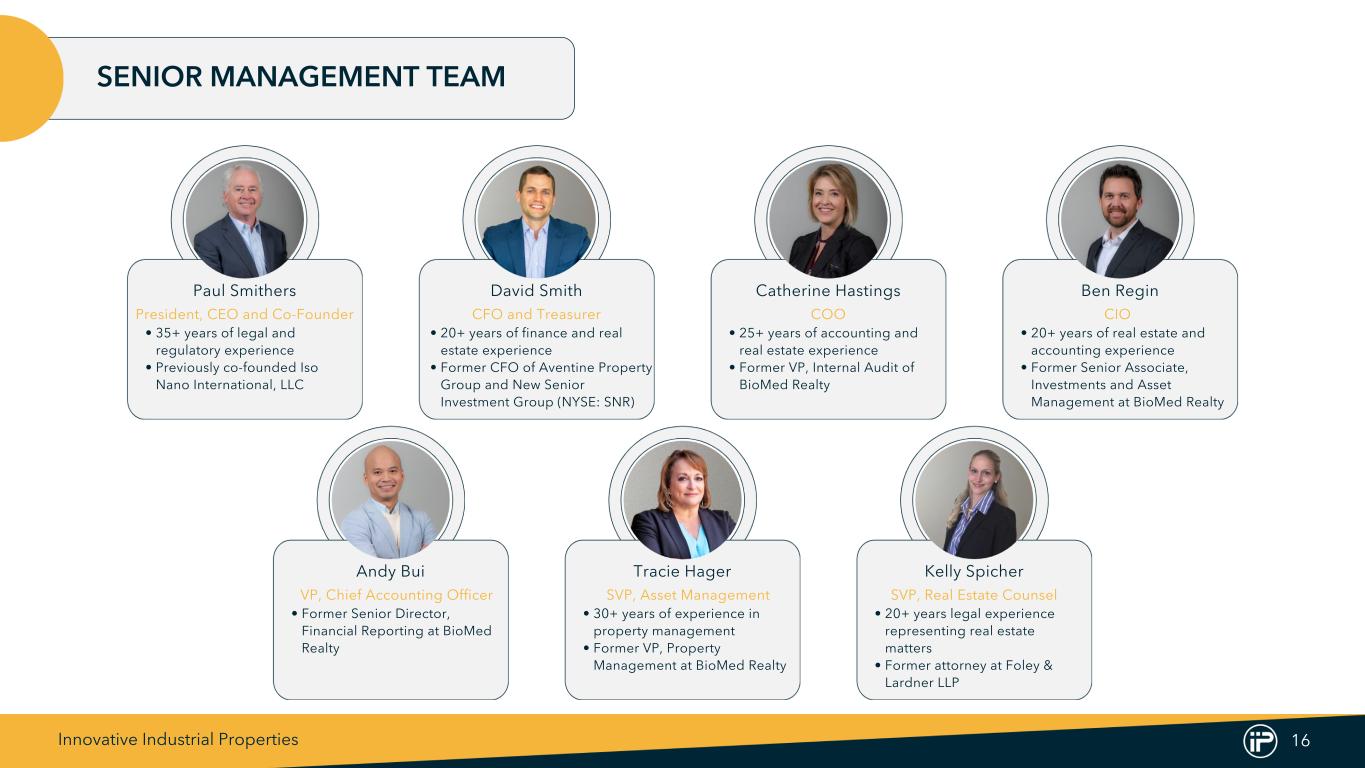
Innovative Industrial Properties 16 David Smith • 20+ years of finance and real estate experience • Former CFO of Aventine Property Group and New Senior Investment Group (NYSE: SNR) CFO and Treasurer • 35+ years of legal and regulatory experience • Previously co-founded Iso Nano International, LLC Paul Smithers President, CEO and Co-Founder • 20+ years of real estate and accounting experience • Former Senior Associate, Investments and Asset Management at BioMed Realty CIO Ben ReginCatherine Hastings • 25+ years of accounting and real estate experience • Former VP, Internal Audit of BioMed Realty COO Andy Bui • Former Senior Director, Financial Reporting at BioMed Realty VP, Chief Accounting Officer • 20+ years legal experience representing real estate matters • Former attorney at Foley & Lardner LLP SVP, Real Estate Counsel Kelly SpicherTracie Hager • 30+ years of experience in property management • Former VP, Property Management at BioMed Realty SVP, Asset Management SENIOR MANAGEMENT TEAM
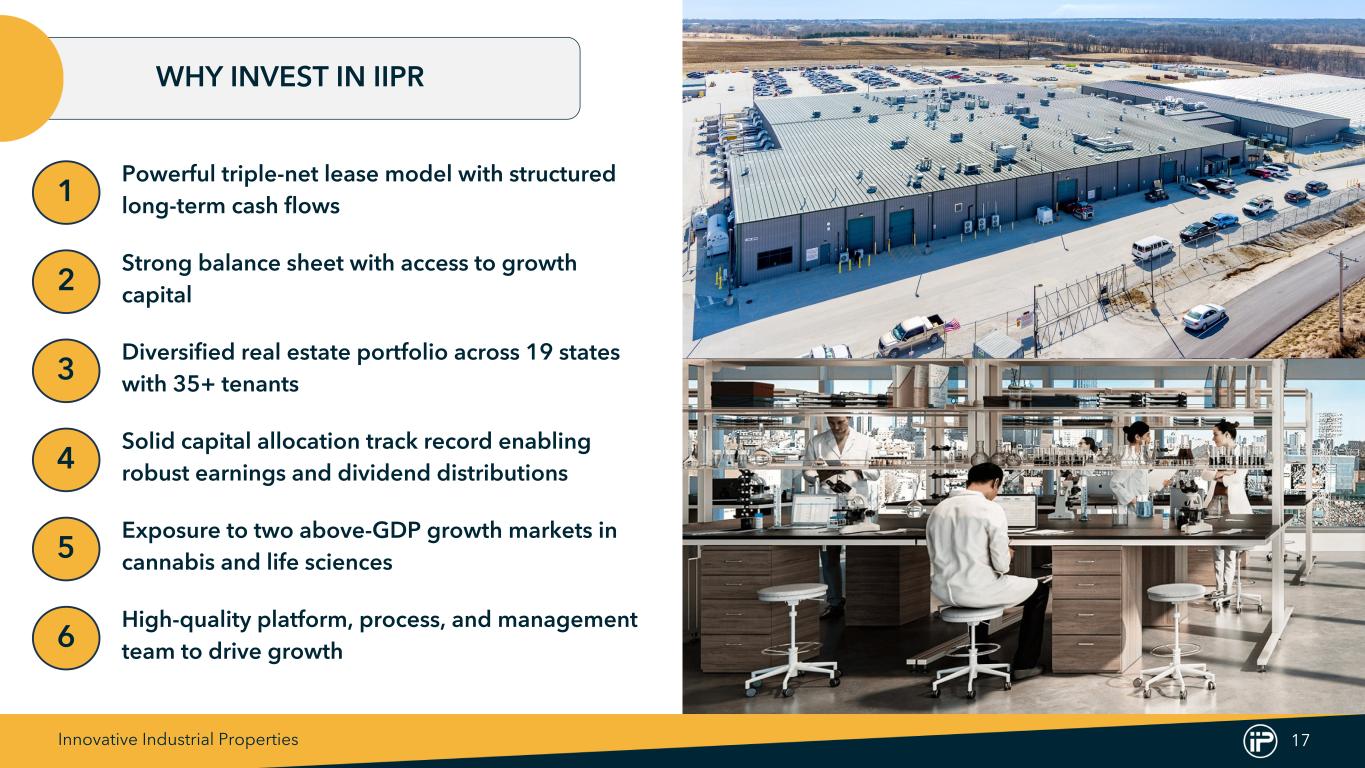
Innovative Industrial Properties 17 WHY INVEST IN IIPR Powerful triple-net lease model with structured long-term cash flows Strong balance sheet with access to growth capital Diversified real estate portfolio across 19 states with 35+ tenants Solid capital allocation track record enabling robust earnings and dividend distributions Exposure to two above-GDP growth markets in cannabis and life sciences High-quality platform, process, and management team to drive growth 1 2 3 4 5 6
Innovative Industrial Properties 18 APPENDIX
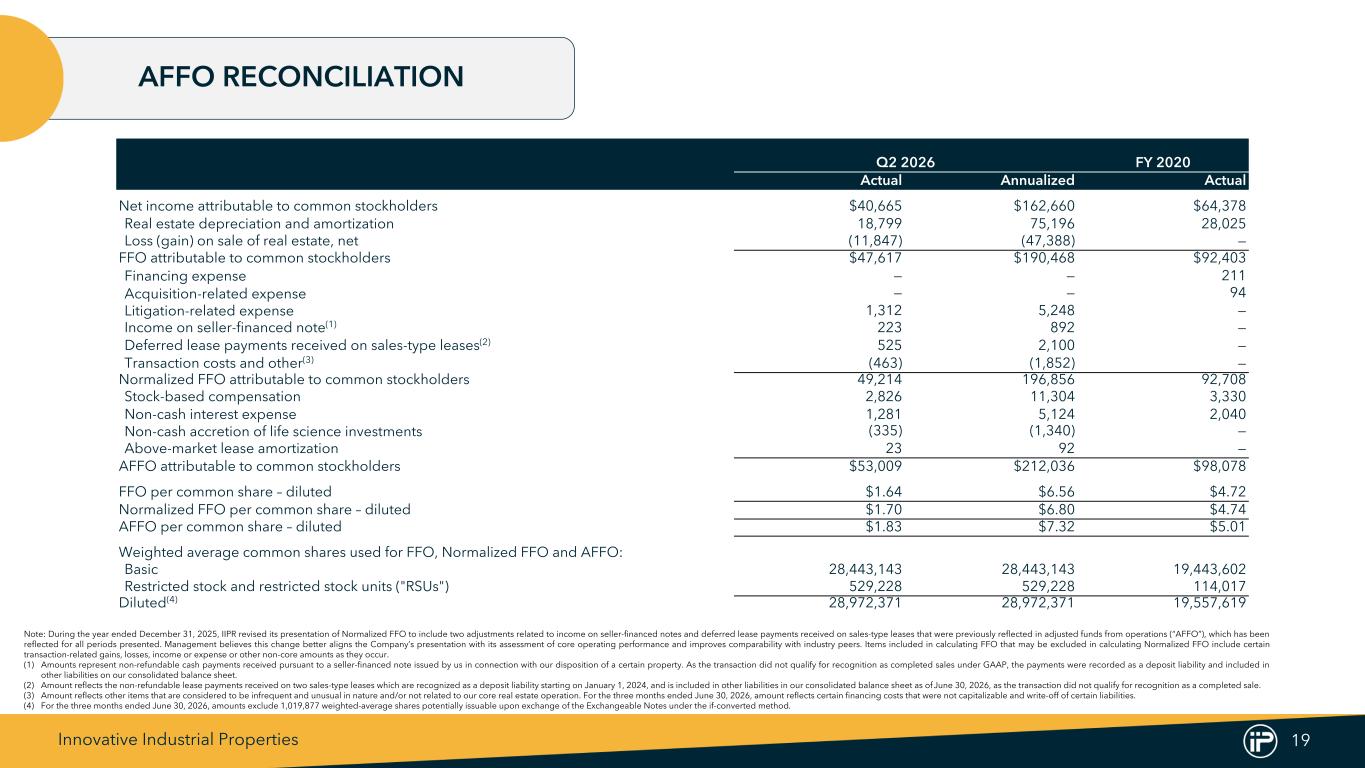
Innovative Industrial Properties 19 Q2 2026 FY 2020 Actual Annualized Actual Net income attributable to common stockholders $40,665 $162,660 $64,378 Real estate depreciation and amortization 18,799 75,196 28,025 Loss (gain) on sale of real estate, net (11,847) (47,388) — FFO attributable to common stockholders $47,617 $190,468 $92,403 Financing expense — — 211 Acquisition-related expense — — 94 Litigation-related expense 1,312 5,248 — Income on seller-financed note(1) 223 892 — Deferred lease payments received on sales-type leases(2) 525 2,100 — Transaction costs and other(3) (463) (1,852) — Normalized FFO attributable to common stockholders 49,214 196,856 92,708 Stock-based compensation 2,826 11,304 3,330 Non-cash interest expense 1,281 5,124 2,040 Non-cash accretion of life science investments (335) (1,340) — Above-market lease amortization 23 92 — AFFO attributable to common stockholders $53,009 $212,036 $98,078 FFO per common share – diluted $1.64 $6.56 $4.72 Normalized FFO per common share – diluted $1.70 $6.80 $4.74 AFFO per common share – diluted $1.83 $7.32 $5.01 Weighted average common shares used for FFO, Normalized FFO and AFFO: Basic 28,443,143 28,443,143 19,443,602 Restricted stock and restricted stock units ("RSUs") 529,228 529,228 114,017 Diluted(4) 28,972,371 28,972,371 19,557,619 AFFO RECONCILIATION Note: During the year ended December 31, 2025, IIPR revised its presentation of Normalized FFO to include two adjustments related to income on seller-financed notes and deferred lease payments received on sales-type leases that were previously reflected in adjusted funds from operations (“AFFO”), which has been reflected for all periods presented. Management believes this change better aligns the Company’s presentation with its assessment of core operating performance and improves comparability with industry peers. Items included in calculating FFO that may be excluded in calculating Normalized FFO include certain transaction-related gains, losses, income or expense or other non-core amounts as they occur. (1) Amounts represent non-refundable cash payments received pursuant to a seller-financed note issued by us in connection with our disposition of a certain property. As the transaction did not qualify for recognition as completed sales under GAAP, the payments were recorded as a deposit liability and included in other liabilities on our consolidated balance sheet. (2) Amount reflects the non-refundable lease payments received on two sales-type leases which are recognized as a deposit liability starting on January 1, 2024, and is included in other liabilities in our consolidated balance sheet as of June 30, 2026, as the transaction did not qualify for recognition as a completed sale. (3) Amount reflects other items that are considered to be infrequent and unusual in nature and/or not related to our core real estate operation. For the three months ended June 30, 2026, amount reflects certain financing costs that were not capitalizable and write-off of certain liabilities. (4) For the three months ended June 30, 2026, amounts exclude 1,019,877 weighted-average shares potentially issuable upon exchange of the Exchangeable Notes under the if-converted method.
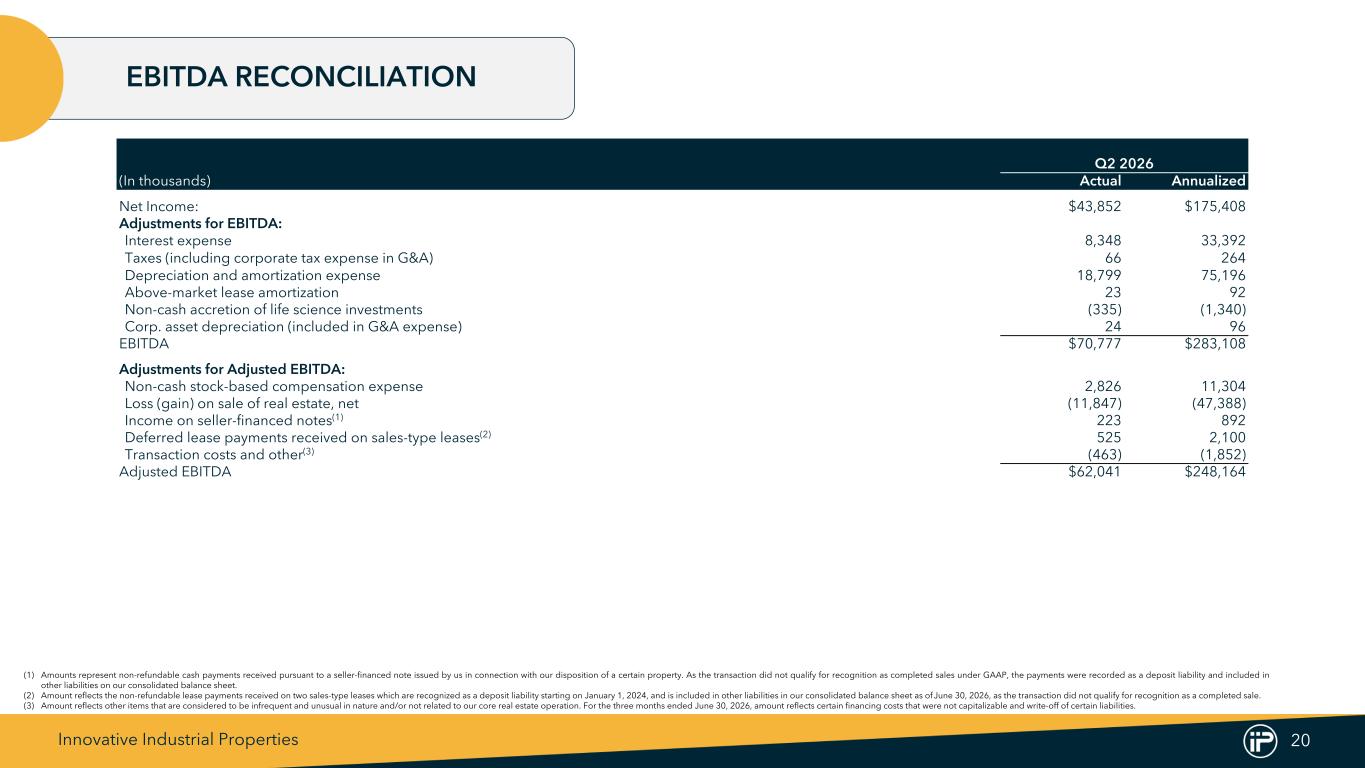
Innovative Industrial Properties 20 EBITDA RECONCILIATION (1) Amounts represent non-refundable cash payments received pursuant to a seller-financed note issued by us in connection with our disposition of a certain property. As the transaction did not qualify for recognition as completed sales under GAAP, the payments were recorded as a deposit liability and included in other liabilities on our consolidated balance sheet. (2) Amount reflects the non-refundable lease payments received on two sales-type leases which are recognized as a deposit liability starting on January 1, 2024, and is included in other liabilities in our consolidated balance sheet as of June 30, 2026, as the transaction did not qualify for recognition as a completed sale. (3) Amount reflects other items that are considered to be infrequent and unusual in nature and/or not related to our core real estate operation. For the three months ended June 30, 2026, amount reflects certain financing costs that were not capitalizable and write-off of certain liabilities. Q2 2026 (In thousands) Actual Annualized Net Income: $43,852 $175,408 Adjustments for EBITDA: Interest expense 8,348 33,392 Taxes (including corporate tax expense in G&A) 66 264 Depreciation and amortization expense 18,799 75,196 Above-market lease amortization 23 92 Non-cash accretion of life science investments (335) (1,340) Corp. asset depreciation (included in G&A expense) 24 96 EBITDA $70,777 $283,108 Adjustments for Adjusted EBITDA: Non-cash stock-based compensation expense 2,826 11,304 Loss (gain) on sale of real estate, net (11,847) (47,388) Income on seller-financed notes(1) 223 892 Deferred lease payments received on sales-type leases(2) 525 2,100 Transaction costs and other(3) (463) (1,852) Adjusted EBITDA $62,041 $248,164