Pay vs Performance Disclosure - USD ($)
Mar. 31, 2026
Mar. 31, 2025
Mar. 31, 2024
| Year | Summary Compensation Table Total for PEO(1) | Compensation Actually Paid to PEO(2) | Average Summary Compensation Total for Non- PEO Named Executive Officers(3) | Average Compensation Actually Paid to Non-PEO Named Executive Officers(4) | Value of Initial $100 Investment based on Total Stockholder Return(5) | Net Income (Loss) Attributable to Common Stockholders ($) | ||||||||||||||||||||||||||||||||
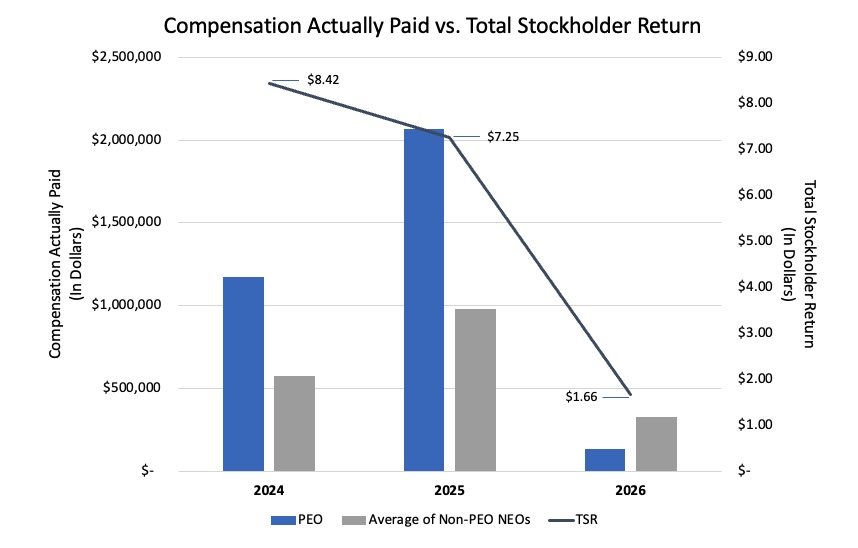
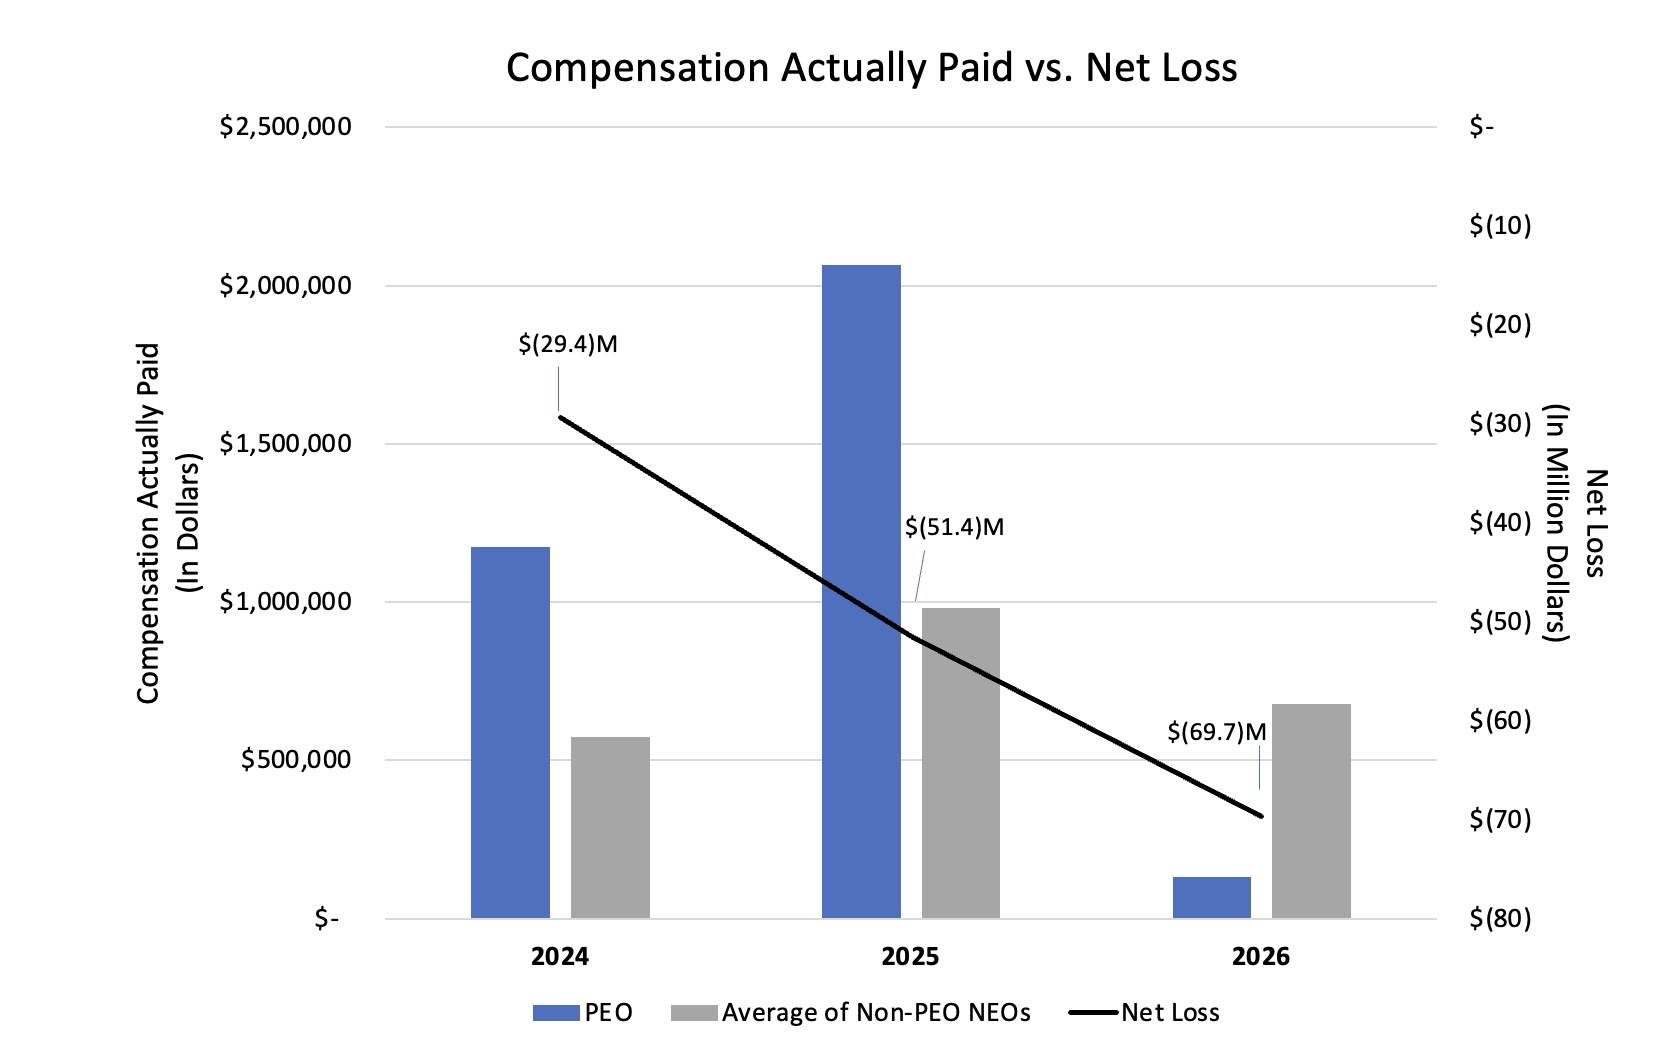
| Fiscal 2026 | $ | 1,212,560 | $ | 132,446 | $ | 700,672 | $ | 326,777 | $ | 1.66 | $ | (69,692,000) | ||||||||||||||||||||||||||
| Fiscal 2025 | $ | 2,477,682 | $ | 2,063,866 | $ | 1,113,838 | $ | 982,081 | $ | 7.25 | $ | (51,418,000) | ||||||||||||||||||||||||||
| Fiscal 2024 | $ | 947,917 | $ | 1,175,054 | $ | 559,209 | $ | 575,433 | $ | 8.42 | $ | (29,362,000) | ||||||||||||||||||||||||||
(1) | Shawn K. Singh, J.D. served as our PEO for each of Fiscal 2026, Fiscal 2025 and Fiscal 2024. | ||||
(3) | For Fiscal 2026, our other NEOs consisted of Nick B. Tressler, Reid G. Adler, Elissa S. Cote and Joshua S. Prince. For Fiscal 2025 and Fiscal 2024, our other NEOs consisted of Cynthia L. Anderson, our former Chief Financial Officer, Mr. Adler and Mr. Prince. | ||||
(2) | The following amounts were added to and deducted from the Summary Compensation Table (SCT) amount to determine the compensation actually paid to the PEO as determined in accordance with SEC regulations: | ||||
Adjustments to Determine Compensation “Actually Paid” | Fiscal 2026 | Fiscal 2025 | Fiscal 2024 | |||||||||||||||||
| Deduction for amount reported under the “Stock Awards” column in the SCT | $ | - | $ | - | $ | - | ||||||||||||||
| Deduction for amount reported under the “Option Awards” column in the SCT | (562,560) | (1,551,432) | - | |||||||||||||||||
| Increase for the fair value of awards granted during year that remain unvested as of year-end | 118,534 | 865,150 | - | |||||||||||||||||
| Increase for the fair value of awards granted during year that remain vested as of year-end | 39,511 | 288,223 | - | |||||||||||||||||
| Increase/deduction for change in fair value from prior year-end to current year-end of awards granted prior to year-end that were outstanding and unvested as of year-end | (759,845) | - | 222,115 | |||||||||||||||||
| Increase/deduction for change in fair value from prior year-end to vesting date of awards granted prior to year-end that vested during year | 84,245 | (15,758) | 5,022 | |||||||||||||||||
| Deduction of fair value of awards granted prior to year-end that were forfeited during year | - | - | - | |||||||||||||||||
| Increase based upon incremental fair value of awards modified during year | - | - | - | |||||||||||||||||
| Increase based on dividends or other earnings paid during year prior to vesting date of award. | - | - | - | |||||||||||||||||
| Total Adjustments | $ | (1,080,115) | $ | (413,817) | $ | 227,137 | ||||||||||||||
(4) | For our other NEOs, the following amounts were added and deducted to the SCT amount to determine the average compensation “actually paid” as determined in accordance with SEC regulations. | ||||
Adjustments to Determine Compensation “Actually Paid” | Fiscal 2026 | Fiscal 2025 | Fiscal 2024 | |||||||||||||||||||||||
| Deduction for amount reported under the “Stock Awards” column in the SCT | $ | - | $ | - | $ | - | ||||||||||||||||||||
| Deduction for amount reported under the “Option Awards” column in the SCT | (324,689) | (485,949) | (14,331) | |||||||||||||||||||||||
| Increase for the fair value of awards granted during year that remain unvested as of year-end | 59,613 | 275,840 | 14,331 | |||||||||||||||||||||||
| Increase for the fair value of awards granted during year that remain vested as of year-end | 6,585 | 91,798 | - | |||||||||||||||||||||||
| Increase/deduction for change in fair value from prior year-end to current year-end of awards granted prior to year-end that were outstanding and unvested as of year-end | (127,180) | (6,885) | 7,945 | |||||||||||||||||||||||
| Increase/deduction for change in fair value from prior year-end to vesting date of awards granted prior to year-end that vested during year | 11,775 | (6,560) | 8,279 | |||||||||||||||||||||||
| Deduction of fair value of awards granted prior to year-end that were forfeited during year | - | - | - | |||||||||||||||||||||||
| Increase based upon incremental fair value of awards modified during year | - | - | - | |||||||||||||||||||||||
| Increase based on dividends or other earnings paid during year prior to vesting date of award. | - | - | - | |||||||||||||||||||||||
| Total Adjustments | $ | (373,895) | $ | (131,756) | $ | 16,224 | ||||||||||||||||||||
| Fair values used in the determination of CAP are determined using the same methodology as used for determining grant date fair values in our financial statements. Specifically, the fair value of option awards was calculated in accordance with the Financial Accounting Standards Board’s Accounting Standards Codification Topic 718, Compensation - Stock Compensation, and does not reflect any amounts actually paid to or actually realized by any of our NEOs. The fair value of the option awards used in the determination of CAP was estimated using the Black-Scholes option pricing model and valuation assumptions reflecting the closing price of our common stock and related assumptions on the respective valuation dates. The grant date valuation assumptions used in the valuation of option awards may be found in the applicable footnotes to the SCT on page 25 above. | |||||
Compensation Actually Paid and Total Stockholder Return
Compensation Actually Paid and Net Loss
(5) | Assumes $100 invested in our common stock on March 31, 2023, and calculated based on the difference between the closing price of our common stock, as reported on The Nasdaq Capital Market, on March 31, 2026, March 31, 2025 and 2024, the end and beginning of the measurement period, respectively. | ||||
We generally seek to incentivize a mix between current and long-term performance and therefore do not specifically align our performance measures with “compensation actually paid” (as computed in accordance with Item 402(v) of Regulation S-K) for a particular year. In accordance with Item 402(v) of Regulation S-K, we are providing the following descriptions of the relationships between the information presented in the Pay Versus Performance table. The disclosure included in this section is prescribed by SEC rules and does not necessarily align with how the Company or the Compensation Committee views the relationship between the Company’s performance and the compensation of our NEOs.