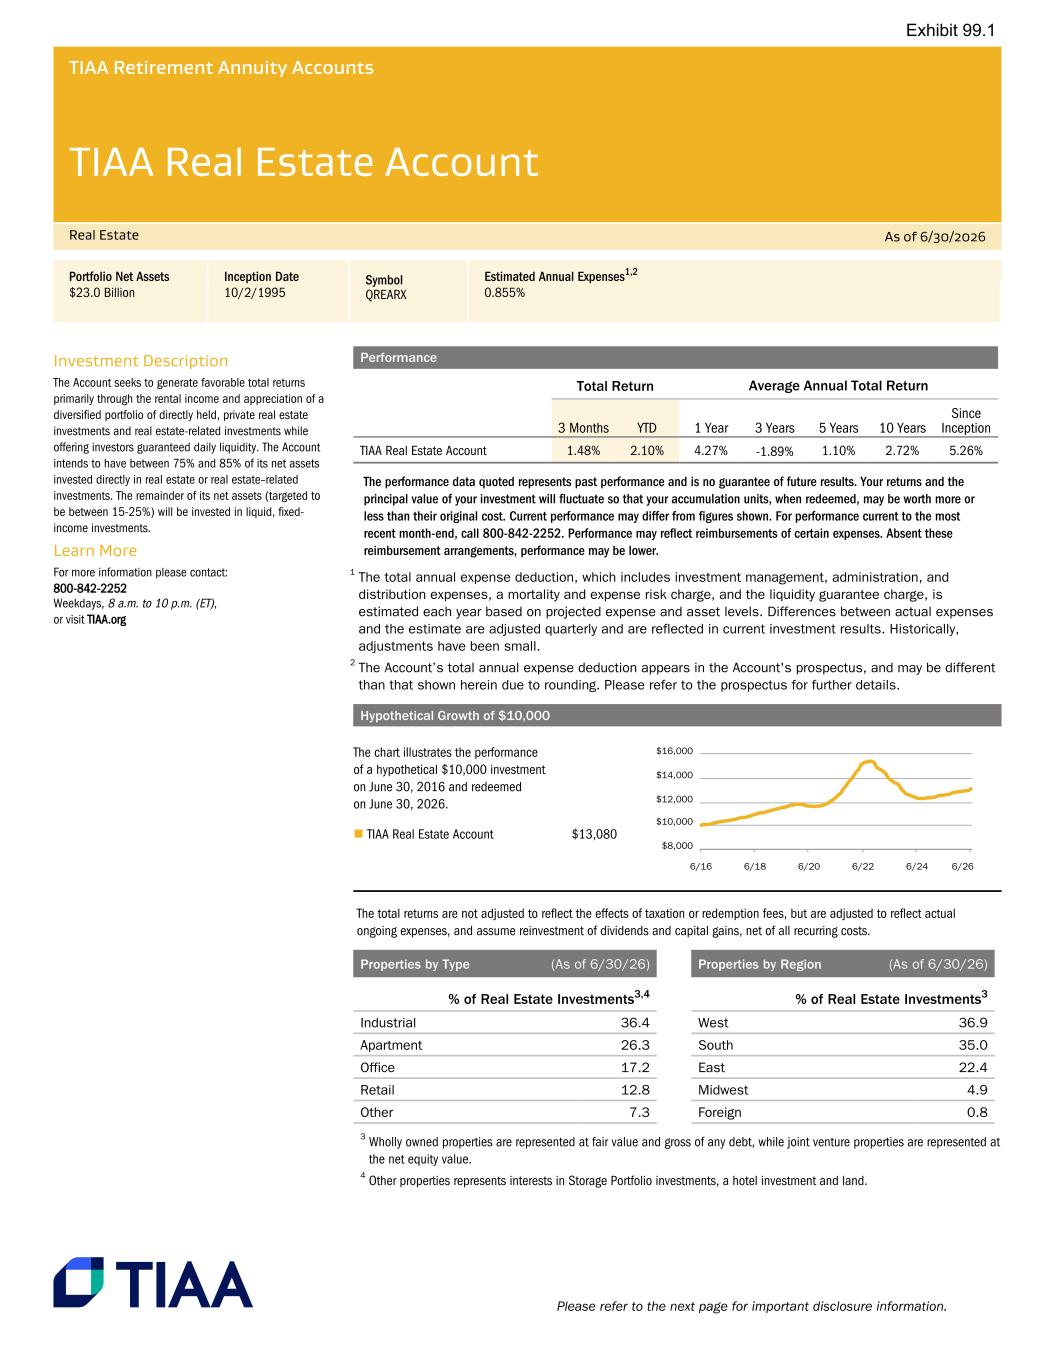
TIAA Retirement Annuity Accounts TIAA Real Estate Account Real Estate As of 6/30/2026 Portfolio Net Assets Inception Date Symbol Estimated Annual Expenses1,2 $23.0 Billion 10/2/1995 QREARX 0.855% Investment Description The Account seeks to generate favorable total returns primarily through the rental income and appreciation of a diversified portfolio of directly held, private real estate investments and real estate-related investments while offering investors guaranteed daily liquidity. The Account intends to have between 75% and 85% of its net assets invested directly in real estate or real estate–related investments. The remainder of its net assets (targeted to be between 15-25%) will be invested in liquid, fixed- income investments. Learn More For more information please contact: 800-842-2252 Weekdays, 8 a.m. to 10 p.m. (ET), or visit TIAA.org Please refer to the next page for important disclosure information. Performance Total Return Average Annual Total Return 3 Months YTD 1 Year 3 Years 5 Years 10 Years Since Inception TIAA Real Estate Account 1.48% 2.10% 4.27% -1.89% 1.10% 2.72% 5.26% The performance data quoted represents past performance and is no guarantee of future results. Your returns and the principal value of your investment will fluctuate so that your accumulation units, when redeemed, may be worth more or less than their original cost. Current performance may differ from figures shown. For performance current to the most recent month-end, call 800-842-2252. Performance may reflect reimbursements of certain expenses. Absent these reimbursement arrangements, performance may be lower. 1 The total annual expense deduction, which includes investment management, administration, and distribution expenses, a mortality and expense risk charge, and the liquidity guarantee charge, is estimated each year based on projected expense and asset levels. Differences between actual expenses and the estimate are adjusted quarterly and are reflected in current investment results. Historically, adjustments have been small. 2 The Account’s total annual expense deduction appears in the Account's prospectus, and may be different than that shown herein due to rounding. Please refer to the prospectus for further details. Hypothetical Growth of $10,000 The chart illustrates the performance of a hypothetical $10,000 investment on June 30, 2016 and redeemed on June 30, 2026. n TIAA Real Estate Account $13,080 The total returns are not adjusted to reflect the effects of taxation or redemption fees, but are adjusted to reflect actual ongoing expenses, and assume reinvestment of dividends and capital gains, net of all recurring costs. Properties by Type (As of 6/30/26) % of Real Estate Investments3,4 Industrial 36.4 Apartment 26.3 Office 17.2 Retail 12.8 Other 7.3 3 Wholly owned properties are represented at fair value and gross of any debt, while joint venture properties are represented at the net equity value. 4 Other properties represents interests in Storage Portfolio investments, a hotel investment and land. Properties by Region (As of 6/30/26) % of Real Estate Investments3 West 36.9 South 35.0 East 22.4 Midwest 4.9 Foreign 0.8 Exhibit 99.1
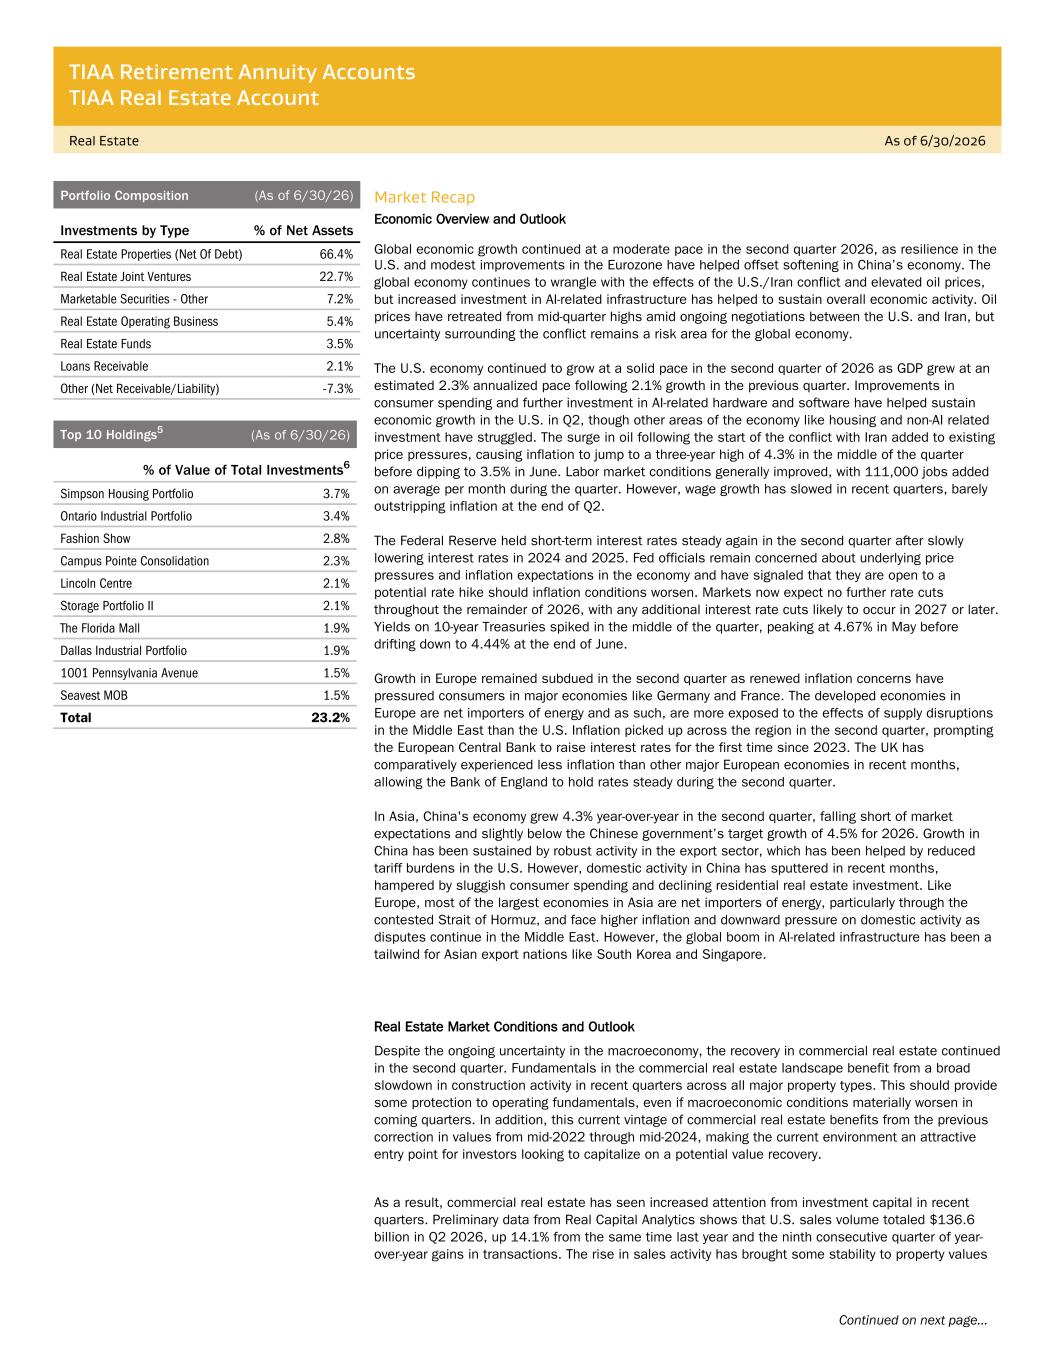
TIAA Retirement Annuity Accounts TIAA Real Estate Account Real Estate As of 6/30/2026 Continued on next page... Portfolio Composition (As of 6/30/26) Investments by Type % of Net Assets Real Estate Properties (Net Of Debt) 66.4% Real Estate Joint Ventures 22.7% Marketable Securities - Other 7.2% Real Estate Operating Business 5.4% Real Estate Funds 3.5% Loans Receivable 2.1% Other (Net Receivable/Liability) -7.3% Top 10 Holdings5 (As of 6/30/26) % of Value of Total Investments6 Simpson Housing Portfolio 3.7% Ontario Industrial Portfolio 3.4% Fashion Show 2.8% Campus Pointe Consolidation 2.3% Lincoln Centre 2.1% Storage Portfolio II 2.1% The Florida Mall 1.9% Dallas Industrial Portfolio 1.9% 1001 Pennsylvania Avenue 1.5% Seavest MOB 1.5% Total 23.2% Market Recap Economic Overview and Outlook Global economic growth continued at a moderate pace in the second quarter 2026, as resilience in the U.S. and modest improvements in the Eurozone have helped offset softening in China’s economy. The global economy continues to wrangle with the effects of the U.S./Iran conflict and elevated oil prices, but increased investment in AI-related infrastructure has helped to sustain overall economic activity. Oil prices have retreated from mid-quarter highs amid ongoing negotiations between the U.S. and Iran, but uncertainty surrounding the conflict remains a risk area for the global economy. The U.S. economy continued to grow at a solid pace in the second quarter of 2026 as GDP grew at an estimated 2.3% annualized pace following 2.1% growth in the previous quarter. Improvements in consumer spending and further investment in AI-related hardware and software have helped sustain economic growth in the U.S. in Q2, though other areas of the economy like housing and non-AI related investment have struggled. The surge in oil following the start of the conflict with Iran added to existing price pressures, causing inflation to jump to a three-year high of 4.3% in the middle of the quarter before dipping to 3.5% in June. Labor market conditions generally improved, with 111,000 jobs added on average per month during the quarter. However, wage growth has slowed in recent quarters, barely outstripping inflation at the end of Q2. The Federal Reserve held short-term interest rates steady again in the second quarter after slowly lowering interest rates in 2024 and 2025. Fed officials remain concerned about underlying price pressures and inflation expectations in the economy and have signaled that they are open to a potential rate hike should inflation conditions worsen. Markets now expect no further rate cuts throughout the remainder of 2026, with any additional interest rate cuts likely to occur in 2027 or later. Yields on 10-year Treasuries spiked in the middle of the quarter, peaking at 4.67% in May before drifting down to 4.44% at the end of June. Growth in Europe remained subdued in the second quarter as renewed inflation concerns have pressured consumers in major economies like Germany and France. The developed economies in Europe are net importers of energy and as such, are more exposed to the effects of supply disruptions in the Middle East than the U.S. Inflation picked up across the region in the second quarter, prompting the European Central Bank to raise interest rates for the first time since 2023. The UK has comparatively experienced less inflation than other major European economies in recent months, allowing the Bank of England to hold rates steady during the second quarter. In Asia, China's economy grew 4.3% year-over-year in the second quarter, falling short of market expectations and slightly below the Chinese government’s target growth of 4.5% for 2026. Growth in China has been sustained by robust activity in the export sector, which has been helped by reduced tariff burdens in the U.S. However, domestic activity in China has sputtered in recent months, hampered by sluggish consumer spending and declining residential real estate investment. Like Europe, most of the largest economies in Asia are net importers of energy, particularly through the contested Strait of Hormuz, and face higher inflation and downward pressure on domestic activity as disputes continue in the Middle East. However, the global boom in AI-related infrastructure has been a tailwind for Asian export nations like South Korea and Singapore. Real Estate Market Conditions and Outlook Despite the ongoing uncertainty in the macroeconomy, the recovery in commercial real estate continued in the second quarter. Fundamentals in the commercial real estate landscape benefit from a broad slowdown in construction activity in recent quarters across all major property types. This should provide some protection to operating fundamentals, even if macroeconomic conditions materially worsen in coming quarters. In addition, this current vintage of commercial real estate benefits from the previous correction in values from mid-2022 through mid-2024, making the current environment an attractive entry point for investors looking to capitalize on a potential value recovery. As a result, commercial real estate has seen increased attention from investment capital in recent quarters. Preliminary data from Real Capital Analytics shows that U.S. sales volume totaled $136.6 billion in Q2 2026, up 14.1% from the same time last year and the ninth consecutive quarter of year- over-year gains in transactions. The rise in sales activity has brought some stability to property values
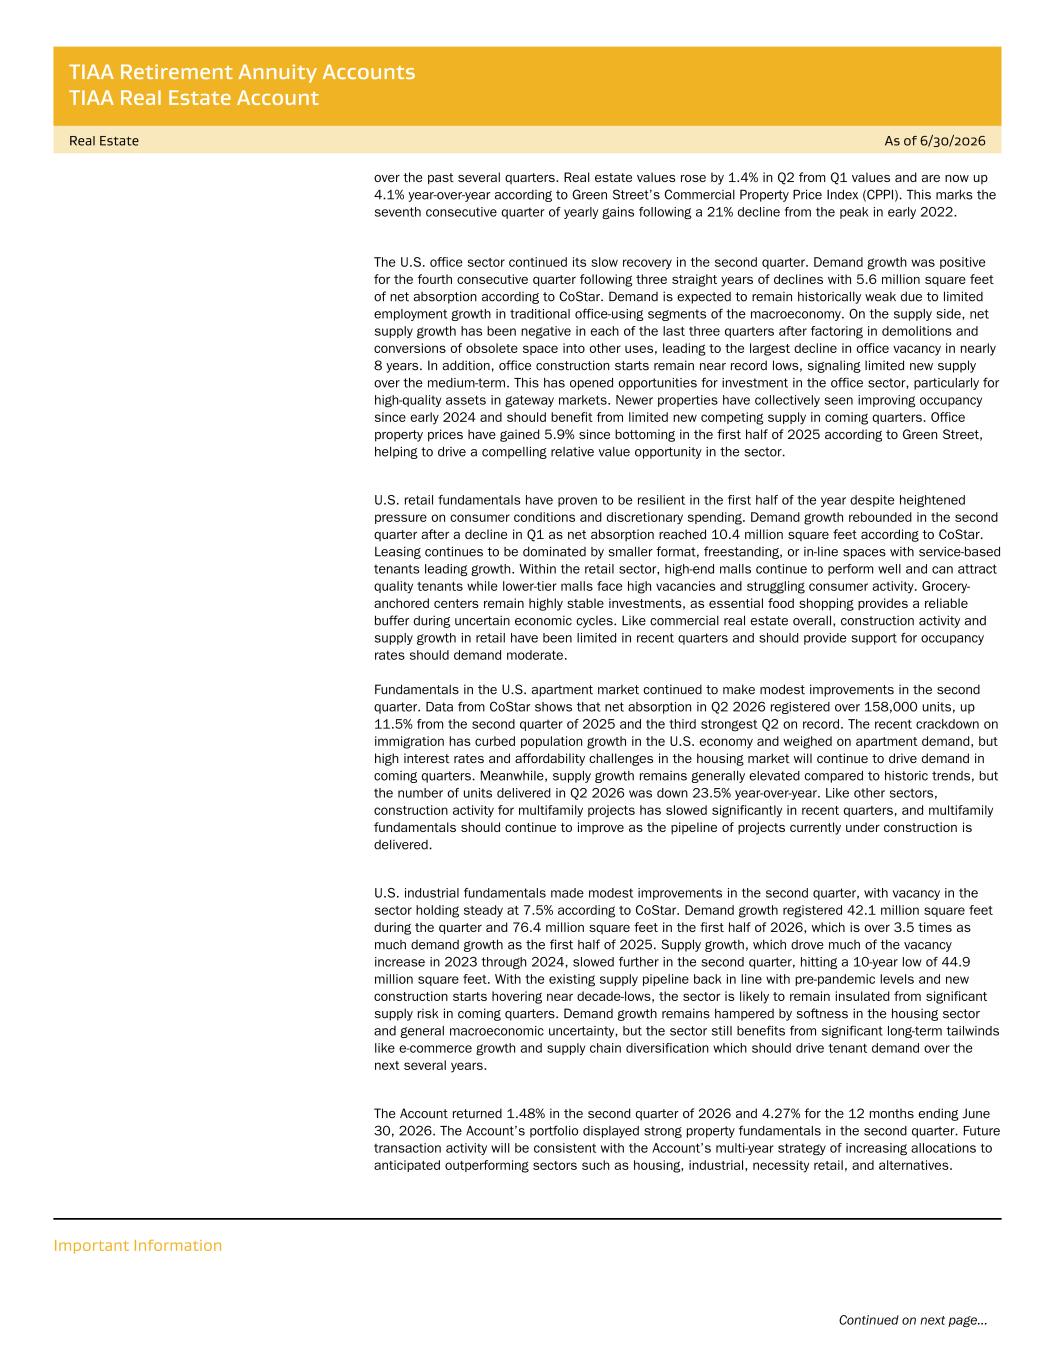
TIAA Retirement Annuity Accounts TIAA Real Estate Account Real Estate As of 6/30/2026 Continued on next page... over the past several quarters. Real estate values rose by 1.4% in Q2 from Q1 values and are now up 4.1% year-over-year according to Green Street’s Commercial Property Price Index (CPPI). This marks the seventh consecutive quarter of yearly gains following a 21% decline from the peak in early 2022. The U.S. office sector continued its slow recovery in the second quarter. Demand growth was positive for the fourth consecutive quarter following three straight years of declines with 5.6 million square feet of net absorption according to CoStar. Demand is expected to remain historically weak due to limited employment growth in traditional office-using segments of the macroeconomy. On the supply side, net supply growth has been negative in each of the last three quarters after factoring in demolitions and conversions of obsolete space into other uses, leading to the largest decline in office vacancy in nearly 8 years. In addition, office construction starts remain near record lows, signaling limited new supply over the medium-term. This has opened opportunities for investment in the office sector, particularly for high-quality assets in gateway markets. Newer properties have collectively seen improving occupancy since early 2024 and should benefit from limited new competing supply in coming quarters. Office property prices have gained 5.9% since bottoming in the first half of 2025 according to Green Street, helping to drive a compelling relative value opportunity in the sector. U.S. retail fundamentals have proven to be resilient in the first half of the year despite heightened pressure on consumer conditions and discretionary spending. Demand growth rebounded in the second quarter after a decline in Q1 as net absorption reached 10.4 million square feet according to CoStar. Leasing continues to be dominated by smaller format, freestanding, or in-line spaces with service-based tenants leading growth. Within the retail sector, high-end malls continue to perform well and can attract quality tenants while lower-tier malls face high vacancies and struggling consumer activity. Grocery- anchored centers remain highly stable investments, as essential food shopping provides a reliable buffer during uncertain economic cycles. Like commercial real estate overall, construction activity and supply growth in retail have been limited in recent quarters and should provide support for occupancy rates should demand moderate. Fundamentals in the U.S. apartment market continued to make modest improvements in the second quarter. Data from CoStar shows that net absorption in Q2 2026 registered over 158,000 units, up 11.5% from the second quarter of 2025 and the third strongest Q2 on record. The recent crackdown on immigration has curbed population growth in the U.S. economy and weighed on apartment demand, but high interest rates and affordability challenges in the housing market will continue to drive demand in coming quarters. Meanwhile, supply growth remains generally elevated compared to historic trends, but the number of units delivered in Q2 2026 was down 23.5% year-over-year. Like other sectors, construction activity for multifamily projects has slowed significantly in recent quarters, and multifamily fundamentals should continue to improve as the pipeline of projects currently under construction is delivered. U.S. industrial fundamentals made modest improvements in the second quarter, with vacancy in the sector holding steady at 7.5% according to CoStar. Demand growth registered 42.1 million square feet during the quarter and 76.4 million square feet in the first half of 2026, which is over 3.5 times as much demand growth as the first half of 2025. Supply growth, which drove much of the vacancy increase in 2023 through 2024, slowed further in the second quarter, hitting a 10-year low of 44.9 million square feet. With the existing supply pipeline back in line with pre-pandemic levels and new construction starts hovering near decade-lows, the sector is likely to remain insulated from significant supply risk in coming quarters. Demand growth remains hampered by softness in the housing sector and general macroeconomic uncertainty, but the sector still benefits from significant long-term tailwinds like e-commerce growth and supply chain diversification which should drive tenant demand over the next several years. The Account returned 1.48% in the second quarter of 2026 and 4.27% for the 12 months ending June 30, 2026. The Account’s portfolio displayed strong property fundamentals in the second quarter. Future transaction activity will be consistent with the Account’s multi-year strategy of increasing allocations to anticipated outperforming sectors such as housing, industrial, necessity retail, and alternatives. Important Information
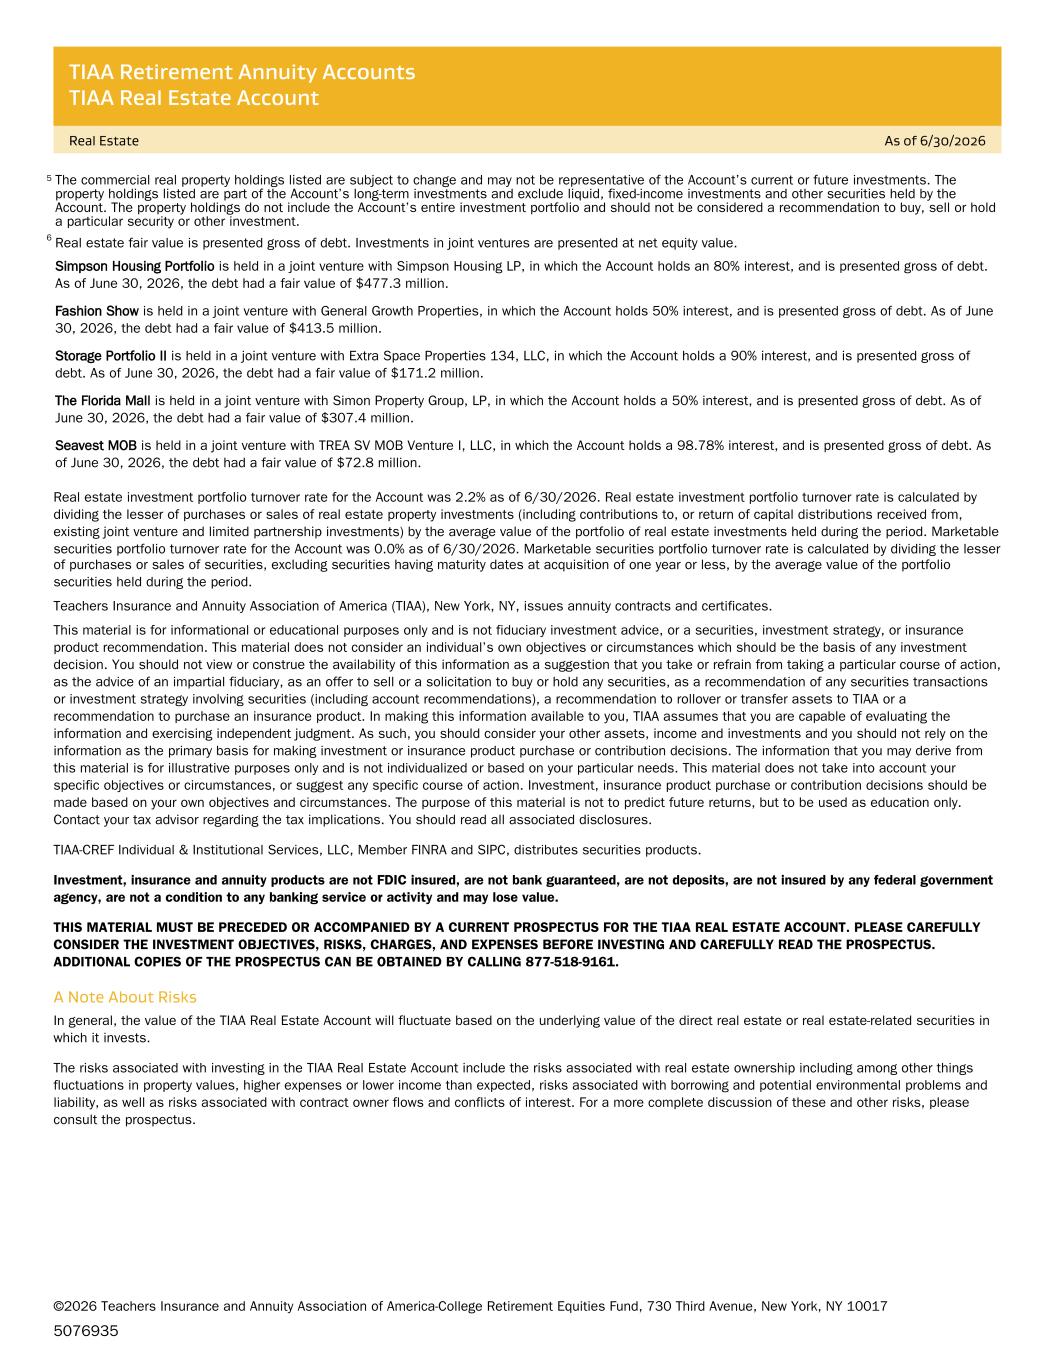
TIAA Retirement Annuity Accounts TIAA Real Estate Account Real Estate As of 6/30/2026 Continued on next page... 5 The commercial real property holdings listed are subject to change and may not be representative of the Account’s current or future investments. The property holdings listed are part of the Account’s long-term investments and exclude liquid, fixed-income investments and other securities held by the Account. The property holdings do not include the Account’s entire investment portfolio and should not be considered a recommendation to buy, sell or hold a particular security or other investment. 6 Real estate fair value is presented gross of debt. Investments in joint ventures are presented at net equity value. Simpson Housing Portfolio is held in a joint venture with Simpson Housing LP, in which the Account holds an 80% interest, and is presented gross of debt. As of June 30, 2026, the debt had a fair value of $477.3 million. Fashion Show is held in a joint venture with General Growth Properties, in which the Account holds 50% interest, and is presented gross of debt. As of June 30, 2026, the debt had a fair value of $413.5 million. Storage Portfolio II is held in a joint venture with Extra Space Properties 134, LLC, in which the Account holds a 90% interest, and is presented gross of debt. As of June 30, 2026, the debt had a fair value of $171.2 million. The Florida Mall is held in a joint venture with Simon Property Group, LP, in which the Account holds a 50% interest, and is presented gross of debt. As of June 30, 2026, the debt had a fair value of $307.4 million. Seavest MOB is held in a joint venture with TREA SV MOB Venture I, LLC, in which the Account holds a 98.78% interest, and is presented gross of debt. As of June 30, 2026, the debt had a fair value of $72.8 million. Real estate investment portfolio turnover rate for the Account was 2.2% as of 6/30/2026. Real estate investment portfolio turnover rate is calculated by dividing the lesser of purchases or sales of real estate property investments (including contributions to, or return of capital distributions received from, existing joint venture and limited partnership investments) by the average value of the portfolio of real estate investments held during the period. Marketable securities portfolio turnover rate for the Account was 0.0% as of 6/30/2026. Marketable securities portfolio turnover rate is calculated by dividing the lesser of purchases or sales of securities, excluding securities having maturity dates at acquisition of one year or less, by the average value of the portfolio securities held during the period. Teachers Insurance and Annuity Association of America (TIAA), New York, NY, issues annuity contracts and certificates. This material is for informational or educational purposes only and is not fiduciary investment advice, or a securities, investment strategy, or insurance product recommendation. This material does not consider an individual’s own objectives or circumstances which should be the basis of any investment decision. You should not view or construe the availability of this information as a suggestion that you take or refrain from taking a particular course of action, as the advice of an impartial fiduciary, as an offer to sell or a solicitation to buy or hold any securities, as a recommendation of any securities transactions or investment strategy involving securities (including account recommendations), a recommendation to rollover or transfer assets to TIAA or a recommendation to purchase an insurance product. In making this information available to you, TIAA assumes that you are capable of evaluating the information and exercising independent judgment. As such, you should consider your other assets, income and investments and you should not rely on the information as the primary basis for making investment or insurance product purchase or contribution decisions. The information that you may derive from this material is for illustrative purposes only and is not individualized or based on your particular needs. This material does not take into account your specific objectives or circumstances, or suggest any specific course of action. Investment, insurance product purchase or contribution decisions should be made based on your own objectives and circumstances. The purpose of this material is not to predict future returns, but to be used as education only. Contact your tax advisor regarding the tax implications. You should read all associated disclosures. TIAA-CREF Individual & Institutional Services, LLC, Member FINRA and SIPC, distributes securities products. Investment, insurance and annuity products are not FDIC insured, are not bank guaranteed, are not deposits, are not insured by any federal government agency, are not a condition to any banking service or activity and may lose value. THIS MATERIAL MUST BE PRECEDED OR ACCOMPANIED BY A CURRENT PROSPECTUS FOR THE TIAA REAL ESTATE ACCOUNT. PLEASE CAREFULLY CONSIDER THE INVESTMENT OBJECTIVES, RISKS, CHARGES, AND EXPENSES BEFORE INVESTING AND CAREFULLY READ THE PROSPECTUS. ADDITIONAL COPIES OF THE PROSPECTUS CAN BE OBTAINED BY CALLING 877-518-9161. A Note About Risks In general, the value of the TIAA Real Estate Account will fluctuate based on the underlying value of the direct real estate or real estate-related securities in which it invests. The risks associated with investing in the TIAA Real Estate Account include the risks associated with real estate ownership including among other things fluctuations in property values, higher expenses or lower income than expected, risks associated with borrowing and potential environmental problems and liability, as well as risks associated with contract owner flows and conflicts of interest. For a more complete discussion of these and other risks, please consult the prospectus. ©2026 Teachers Insurance and Annuity Association of America-College Retirement Equities Fund, 730 Third Avenue, New York, NY 10017 5076935