Exhibit 99.1
| 1 Financial Management Review 2Q26 | July 2026 Quarterly & Year- to-Date Report
Table of Contents | 2 I. About Banco de Chile 6 • Our History • Financial Snapshot on Banco de Chile II. Corporate Governance 8 • Equity Composition and Ownership Structure • Board of Directors, Committees and Managerial Structure III. Business Strategy 11 • Corporate Statements and Commitments • Stakeholders Engagement • Competitive Landscape, Business Trends and Regulation • Strategy of Banco de Chile At a Glance • Business Segments Description • Snapshot on Strategic Advances IV. Economic and Business Environment 24 • Economic Outlook • Banking Industry Performance and Projections • Competitive Position V. Management Discussion & Analysis 29 • Income Statement Analysis • Business Segments Performance • Balance Sheet Analysis VI. Risk & Capital Management 55 • Risk Management Approach • Funding Concentration and Liquidity • Market Risk • Operational Risk • Capital Adequacy and Credit Ratings
About this Report | 3 Basis for Presentation This financial report, which accompanies our quarterly financial statements, has been prepared as requested by the Chilean Financial Market Commission (CMF) in the Compendium of Accounting Standards for Banks while being prepared in accordance with the IFRS Practice Statement 1 – Management Commentary as issued by the International Accounting Standards Board (IASB). Figures included in this report "Financial Management Review", for purposes of analysis, are based on both the financial statements and management information systems of Banco de Chile. Forward - Looking Information The information contained herein incorporates by reference statements comprising "forward-looking statements" that include statements regarding the intent, belief or current expectations of our directors and officers with respect to our future operating performance. Such statements include any forecasts, projections and descriptions of anticipated cost savings or other synergies. You should be aware that any such forward-looking statements are not guarantees of future performance and may involve risks and uncertainties, and that actual results may differ from those set forth in the forward-looking statements as a result of several factors (including, without limitations, the actions of competitors, future global economic conditions, market conditions, foreign exchange rates, and operating and financial risks related to managing growth and integrating acquired businesses), many of which are beyond our control. The occurrence of any such factors not currently expected by us would significantly alter the results set forth in these statements. Factors that could cause actual results to differ materially and adversely include, but are not limited to: changes in general economic, business or political or other conditions in Chile or changes in general economic or business conditions in Latin America; changes in capital markets in general that may affect policies or attitudes toward lending to Chile or Chilean companies; unexpected developments in certain existing litigation; increased costs; unanticipated increases in financing and other costs or the inability to obtain additional debt or equity financing on attractive terms; natural disasters or pandemics; the effect of tax laws or other kind of regulation on our business; other risk factors as reported in our form 20F filed with the U.S. SEC. Undue reliance should not be placed on such statements, which only address as of the date that they were made. Our independent public accountants have not examined or compiled the forward-looking statements and, accordingly, do not provide any assurance with respect to such statements. These cautionary statements should be considered in connection with any written or oral forward-looking statements that we may issue in the future. We do not undertake any obligation to release publicly any revisions to such forward-looking statements to reflect later events or circumstances or to reflect the occurrence of unanticipated events. Contacts Pablo Mejia Head of Investor Relations Investor Relations | Banco de Chile pmejiar@bancochile.cl Daniel Galarce Head of Financial Control & Capital Management Financial Control & Capital Area | Banco de Chile dgalarce@bancochile.cl
© KPMG Auditores Consultores Limitada, a Chilean limited liability company (sociedad de responsabilidad limitada) and a member firm of the KPMG global organization of independent member firms affiliated with KPMG International Limited, a private English company limited by guarantee. All rights reserved. Santiago Av. Presidente Riesco 5685, piso 15, Las Condes Independent Practitioner's Review Report Shareholders and Directors of Banco de Chile: We have reviewed the presentation of the accompanying "Management Commentary" financial report for the six-month period ended June 30, 2026, of Banco de Chile and its Subsidiaries , taken as a whole. In conjunction with such review, we have conducted an interim review, in accordance with International Standard on Review Engagements 2410, "Review of Interim Financial Information Performed by the Independent Auditor of the Entity" applicable to the reviews of interim consolidated financial statements of Banco de Chile and its Subsidiaries as of June 30, 2026, and for the six-month and three-month periods then ended and the related notes to the interim consolidated financial statements. We expressed an unmodified opinion on the consolidated interim financial statements in our interim review report dated July 30, 2026. Management's Responsibility Management is responsible for the preparation and presentation of the "Management Commentary" of Banco de Chile and its Subsidiaries in accordance with the Standards and Instructions issued by the Financial Market Commission (CMF), established in Chapter C-2 of the Compendium of Accounting Standards for Banks. Accountant´s Responsibility Our review was conducted in accordance with the Attestation Standard Section AT 395 "Management Commentary" and Audit Circular No. 37(R) established by Colegio de Contadores de Chile A.G. A review consists mainly of applying analytical procedures, making inquiries of those individuals responsible for financial and accounting matters. This review is significantly less in scope than that of an examination, the objective of which would be to express an opinion on the "Management Commentary". Accordingly, no such opinion is expressed. "Management Commentary" includes such non-financial information as operational and commercial information, sustainability ratios, macroeconomic forecasts, management and other information. Although such information may provide other additional elements for the analysis of the financial position and results of operations of Banco de Chile and its Subsidiaries, our review does not extend to such information. The preparation and presentation of "Management Commentary" of Banco de Chile and its Subsidiaries as of June 30, 2026, requires that the Management of Banco de Chile and its Subsidiaries interpret certain criteria, determines the appropriateness of the information to be included, and make estimates and assumptions that affect the information presented. The "Management Commentary" of Banco de Chile and its Subsidiaries as of June 30, 2026 includes current and forward-looking information that estimates the future impact of transactions and events that have occurred or are expected to occur, estimates expected future sources of liquidity and financial resources, and estimates operating and macroeconomic trends and commitments and uncertainties. Future results may differ significantly from the current assessment of this information presented by the Management of Banco de Chile and its Subsidiaries because events and circumstances frequently do not occur as expected. Our review has considered such information only to the extent that it has been used for the preparation and presentation
© KPMG Auditores Consultores Limitada, a Chilean limited liability company (sociedad de responsabilidad limitada) and a member firm of the KPMG global organization of independent member firms affiliated with KPMG International Limited, a private English company limited by guarantee. All rights reserved. of the financial information contained in the "Management Commentary" financial report and not for the purpose of expressing a conclusion on such information. Conclusion Based on our review, we are not aware of any significant modifications that should be made to the presentation of Management Commentary of Banco de Chile and its Subsidiaries for such presentation to: (i) be in accordance with the elements required by the standards and instructions issued by the Financial Market Commission (CMF); (ii) the historical financial amounts included in the presentation have been properly derived from the interim consolidated financial statements of Banco de Chile and its Subsidiaries as of June 30, 2026, and (iii) the information, determinations, estimates and underlying assumptions of Banco de Chile and its Subsidiaries are consistent with the bases used for the preparation of the financial information contained in such presentation. Ernesto Guzmán V. KPMG Ltda. Santiago, July 30, 2026.
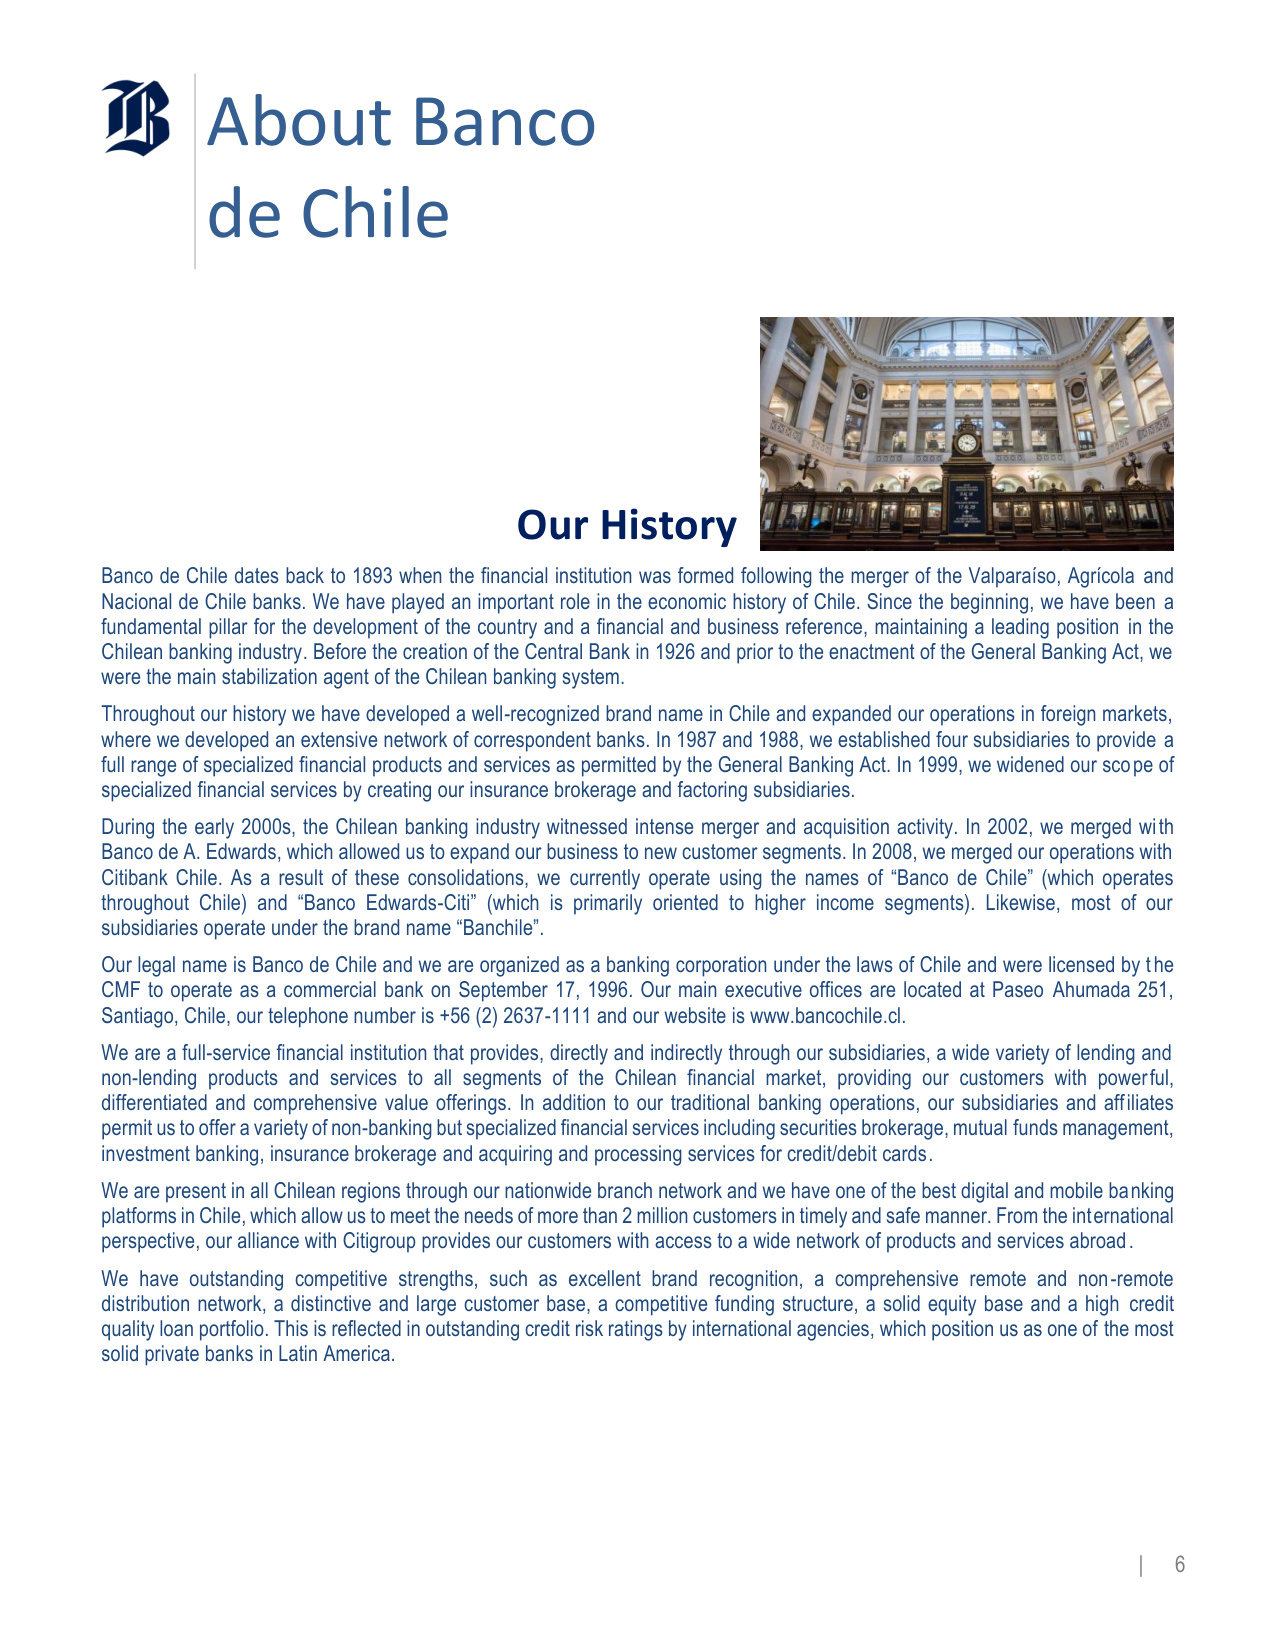
About Banco de Chile | 6 Our History Banco de Chile dates back to 1893 when the financial institution was formed following the merger of the Valparaíso, Agrícola and Nacional de Chile banks. We have played an important role in the economic history of Chile. Since the beginning, we have been a fundamental pillar for the development of the country and a financial and business reference, maintaining a leading position in the Chilean banking industry. Before the creation of the Central Bank in 1926 and prior to the enactment of the General Banking Act, we were the main stabilization agent of the Chilean banking system. Throughout our history we have developed a well-recognized brand name in Chile and expanded our operations in foreign markets, where we developed an extensive network of correspondent banks. In 1987 and 1988, we established four subsidiaries to provide a full range of specialized financial products and services as permitted by the General Banking Act. In 1999, we widened our scope of specialized financial services by creating our insurance brokerage and factoring subsidiaries. During the early 2000s, the Chilean banking industry witnessed intense merger and acquisition activity. In 2002, we merged with Banco de A. Edwards, which allowed us to expand our business to new customer segments. In 2008, we merged our operations with Citibank Chile. As a result of these consolidations, we currently operate using the names of "Banco de Chile" (which operates throughout Chile) and "Banco Edwards-Citi" (which is primarily oriented to higher income segments). Likewise, most of our subsidiaries operate under the brand name "Banchile". Our legal name is Banco de Chile and we are organized as a banking corporation under the laws of Chile and were licensed by the CMF to operate as a commercial bank on September 17, 1996. Our main executive offices are located at Paseo Ahumada 251, Santiago, Chile, our telephone number is +56 (2) 2637-1111 and our website is www.bancochile.cl. We are a full-service financial institution that provides, directly and indirectly through our subsidiaries, a wide variety of lending and non-lending products and services to all segments of the Chilean financial market, providing our customers with powerful, differentiated and comprehensive value offerings. In addition to our traditional banking operations, our subsidiaries and affiliates permit us to offer a variety of non-banking but specialized financial services including securities brokerage, mutual funds management, investment banking, insurance brokerage and acquiring and processing services for credit/debit cards. We are present in all Chilean regions through our nationwide branch network and we have one of the best digital and mobile banking platforms in Chile, which allow us to meet the needs of more than 2 million customers in timely and safe manner. From the international perspective, our alliance with Citigroup provides our customers with access to a wide network of products and services abroad. We have outstanding competitive strengths, such as excellent brand recognition, a comprehensive remote and non-remote distribution network, a distinctive and large customer base, a competitive funding structure, a solid equity base and a high credit quality loan portfolio. This is reflected in outstanding credit risk ratings by international agencies, which position us as one of the most solid private banks in Latin America.
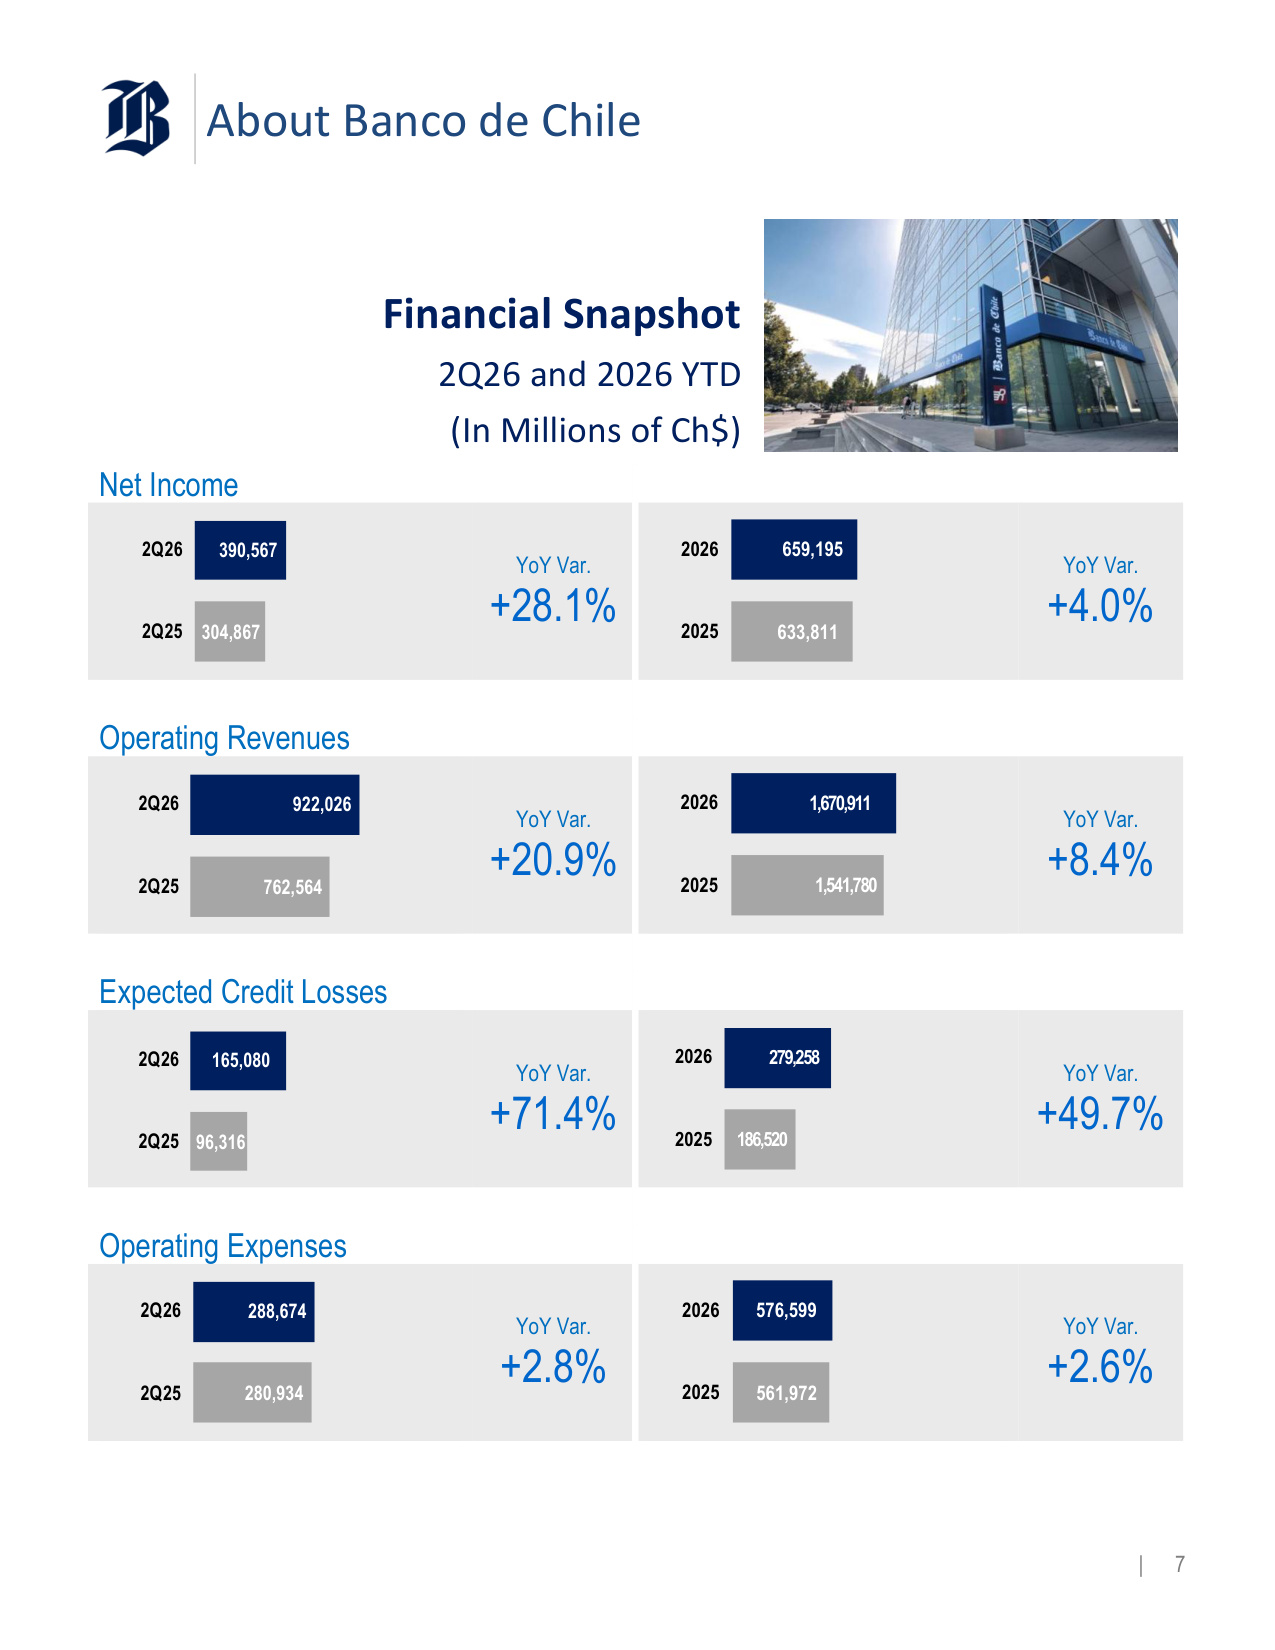
About Banco de Chile | 7 Financial Snapshot 2Q26 and 2026 YTD (In Millions of Ch$) Net Income 304,867 390,567 2Q25 2Q26 YoY Var. +28.1% 633,811 659,195 2025 2026 YoY Var. +4.0% Operating Revenues 762,564 922,026 2Q25 2Q26 YoY Var. +20.9% 1,541,780 1,670,911 2025 2026 YoY Var. +8.4% Expected Credit Losses 96,316 165,080 2Q25 2Q26 YoY Var. +71.4% 186,520 279,258 2025 2026 YoY Var. +49.7% Operating Expenses 280,934 288,674 2Q25 2Q26 YoY Var. +2.8% 561,972 576,599 2025 2026 YoY Var. +2.6%
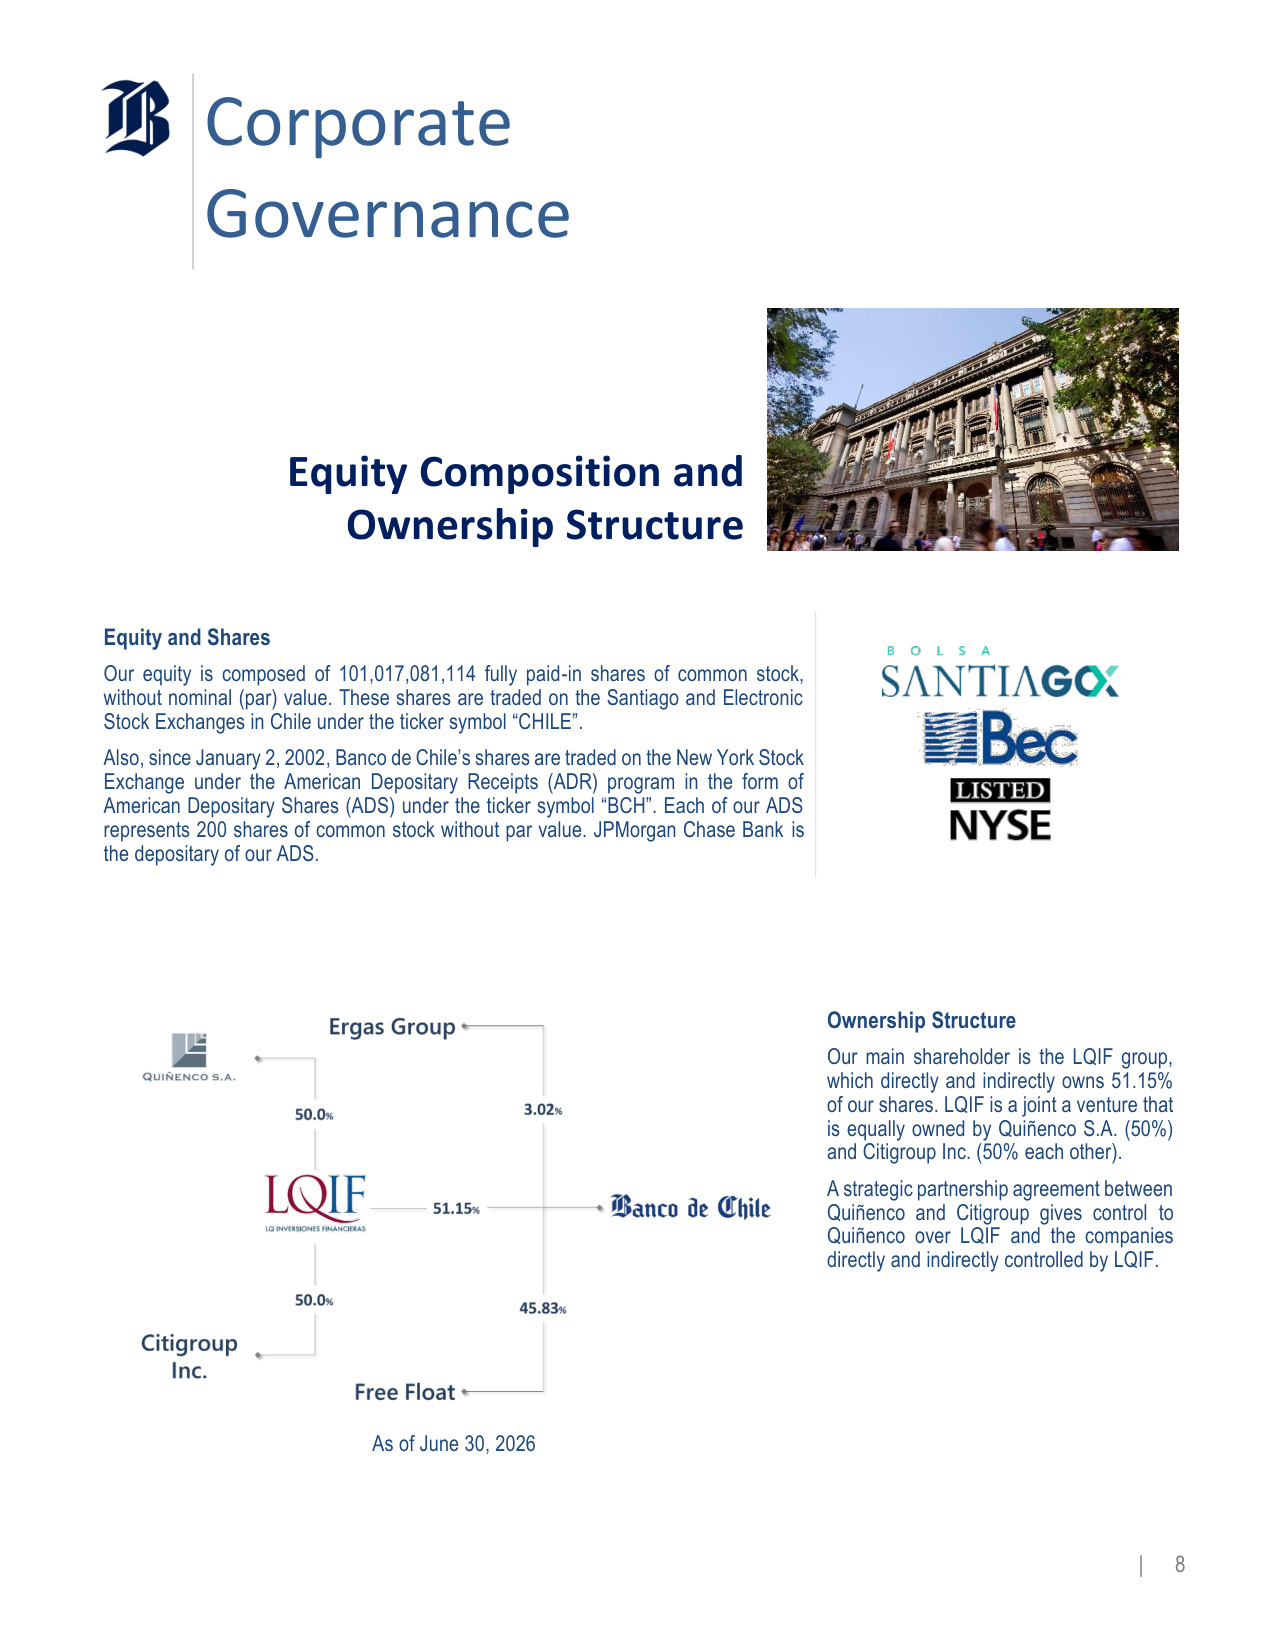
Corporate Governance | 8 Equity Composition and Ownership Structure Equity and Shares Our equity is composed of 101,017,081,114 fully paid-in shares of common stock, without nominal (par) value. These shares are traded on the Santiago and Electronic Stock Exchanges in Chile under the ticker symbol "CHILE". Also, since January 2, 2002, Banco de Chile's shares are traded on the New York Stock Exchange under the American Depositary Receipts (ADR) program in the form of American Depositary Shares (ADS) under the ticker symbol "BCH". Each of our ADS represents 200 shares of common stock without par value. JPMorgan Chase Bank is the depositary of our ADS. As of June 30, 2026 Ownership Structure Our main shareholder is the LQIF group, which directly and indirectly owns 51.15% of our shares. LQIF is a joint a venture that is equally owned by Quiñenco S.A. (50%) and Citigroup Inc. (50% each other). A strategic partnership agreement between Quiñenco and Citigroup gives control to Quiñenco over LQIF and the companies directly and indirectly controlled by LQIF.
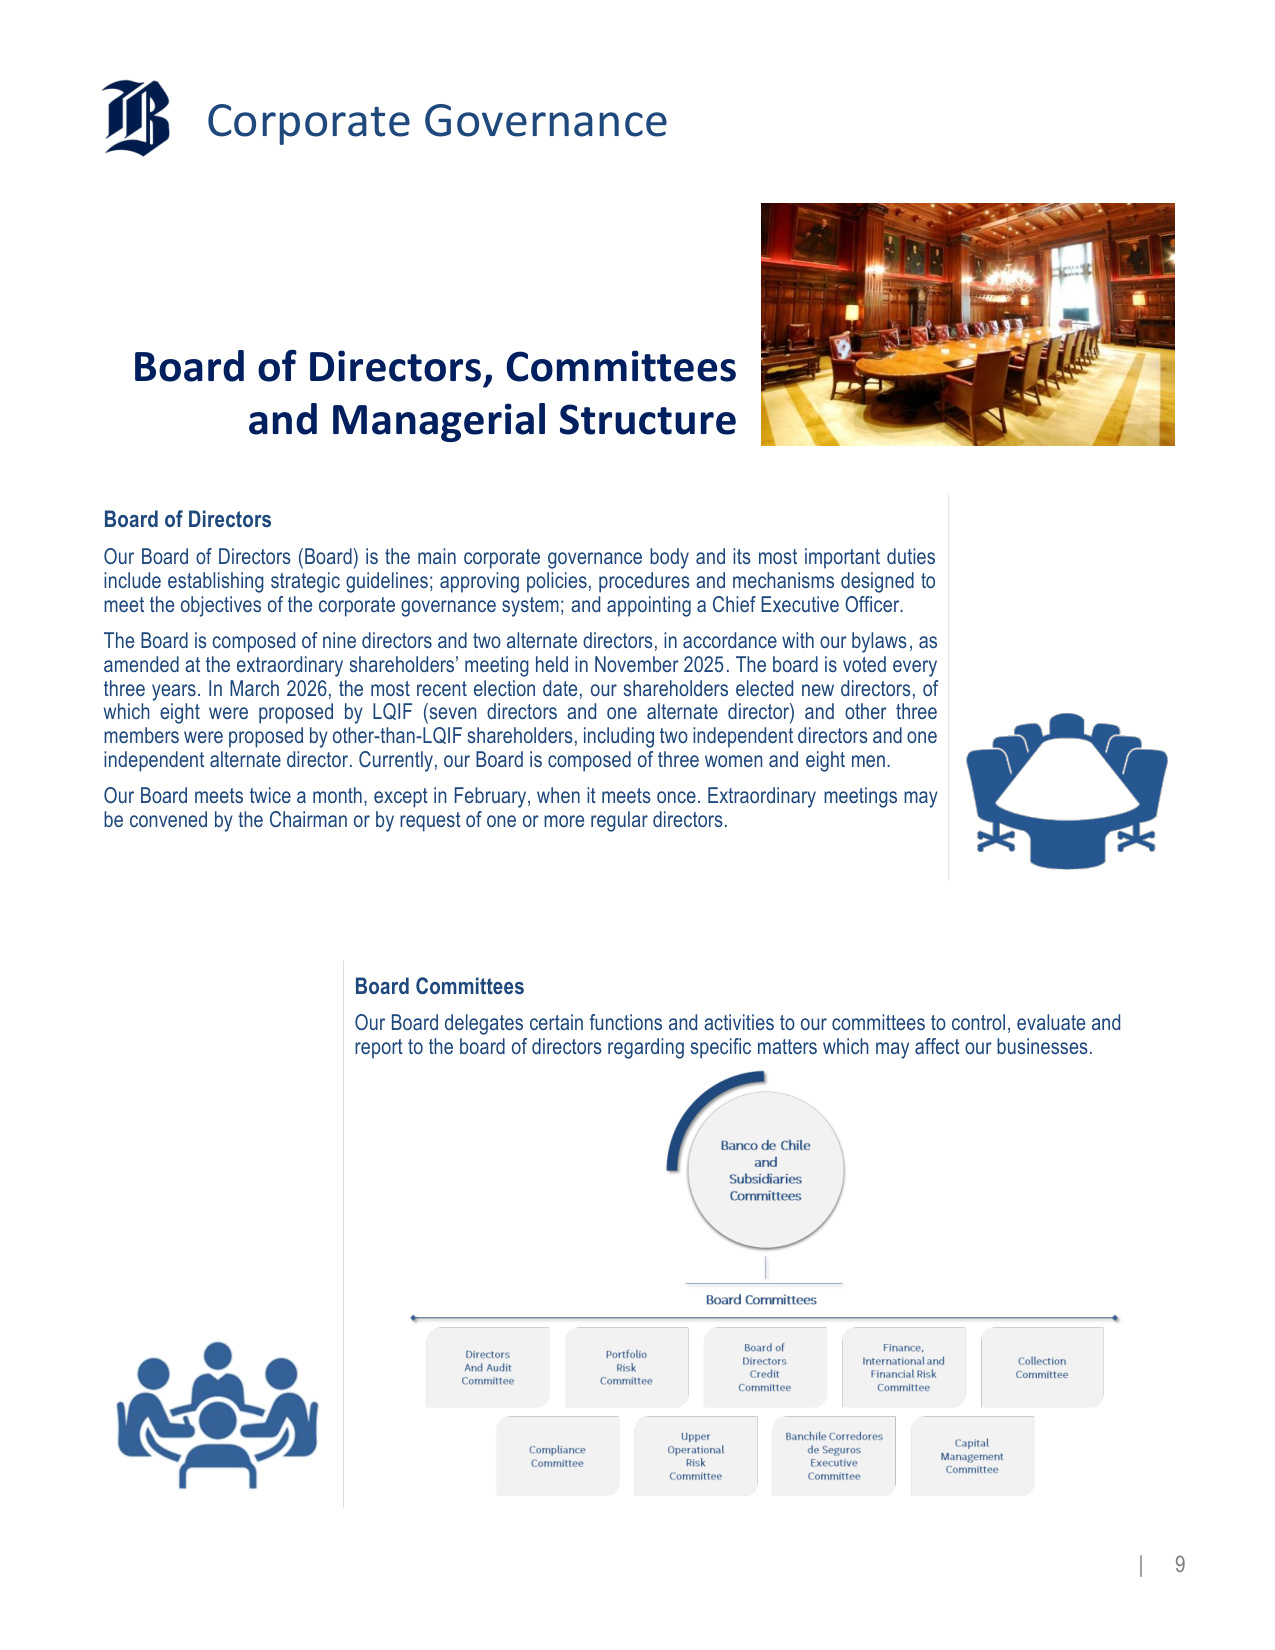
Corporate Governance | 9 Board of Directors, Committees and Managerial Structure Board of Directors Our Board of Directors (Board) is the main corporate governance body and its most important duties include establishing strategic guidelines; approving policies, procedures and mechanisms designed to meet the objectives of the corporate governance system; and appointing a Chief Executive Officer. The Board is composed of nine directors and two alternate directors, in accordance with our bylaws, as amended at the extraordinary shareholders' meeting held in November 2025. The board is voted every three years. In March 2026, the most recent election date, our shareholders elected new directors, of which eight were proposed by LQIF (seven directors and one alternate director) and other three members were proposed by other-than-LQIF shareholders, including two independent directors and one independent alternate director. Currently, our Board is composed of three women and eight men. Our Board meets twice a month, except in February, when it meets once. Extraordinary meetings may be convened by the Chairman or by request of one or more regular directors. Board Committees Our Board delegates certain functions and activities to our committees to control, evaluate and report to the board of directors regarding specific matters which may affect our businesses.
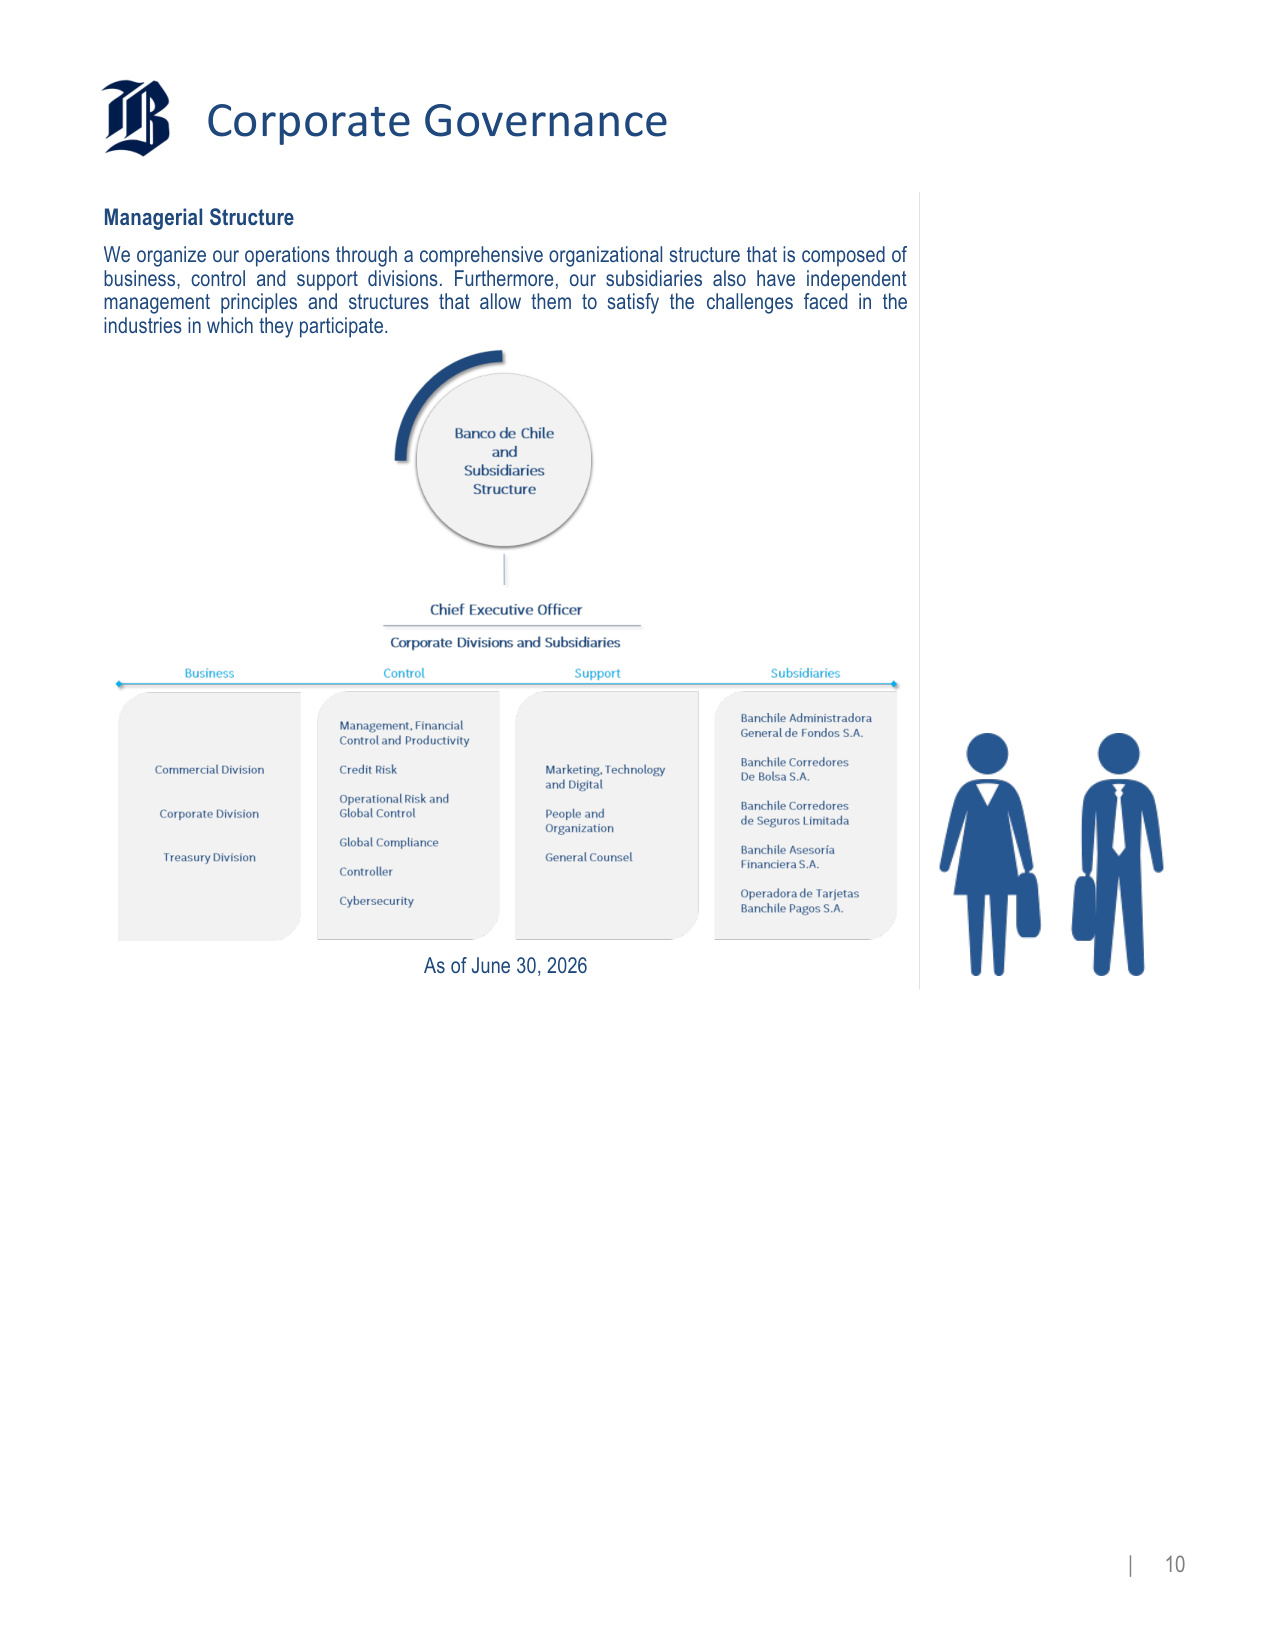
Corporate Governance | 10 Managerial Structure We organize our operations through a comprehensive organizational structure that is composed of business, control and support divisions. Furthermore, our subsidiaries also have independent management principles and structures that allow them to satisfy the challenges faced in the industries in which they participate. As of June 30, 2026

Business Strategy | 11 Corporate Statements and Commitments Purpose Mission To contribute to the development of the country, people and companies. We are a leading, globally-connected financial corporation with a prestigious business tradition. We provide financial services of excellence to each customer segment, offering creative, agile and effective solutions; thus ensuring value creation for our shareholders, our employees and the community at large. Vision Corporate Values In everything we do, we constantly strive to be the best bank for our customers, the best place to work, and the best investment for our shareholders. We do so in a way that demonstrates our commitment to the people in our organization and the community in general.

Business Strategy | 12 Commitments Our Customers We pursue to be the bank with the best service quality, offering innovative, simple and secure products and services designed to meet the needs and aspirations of each segment, with timely, agile and proactive service in order to build trusted and long-term relationships. To achieve this we strive to continuously develop always- available service channels that allow fluid and timely communication, while counting on employees devoted to customer service that also have digital knowledge. Our Staff We are certain that our team is a distinctive asset and a solid competitive advantage in the industry. This is based on their commitment, dedication and excellence. For this reason, we offer development and growth opportunities based on merit, providing competitive compensation and economic and welfare benefits. At the same time, we seek to promote a respectful, friendly and collaborative work environment in a place that has suitable technological tools and infrastructure. We build a homogeneous and distinctive culture, based on corporate commitments and values through the involvement in social activities, in order to become a Corporation distinguished as the best place to work and the best team in Chilean banking industry. Our Shareholders We honor our shareholders' confidence by maximizing the company's value, with responsibility, prudence and a long-term business vision. We deploy our business strategy based on appropriate risk management and a culture of operational excellence that allows us to project the sustainable leadership of the corporation. Our Community We are convinced that our success is linked to the sustainable development of our country and the community. That is why in our daily actions we reflect our commitment to community by supporting diverse initiatives to overcome adversity, through the development of internal policies and being present in emblematic solidarity crusades. We are committed to respecting diversity and inclusion, entrepreneurship, environmental care and equality and governance dimensions.
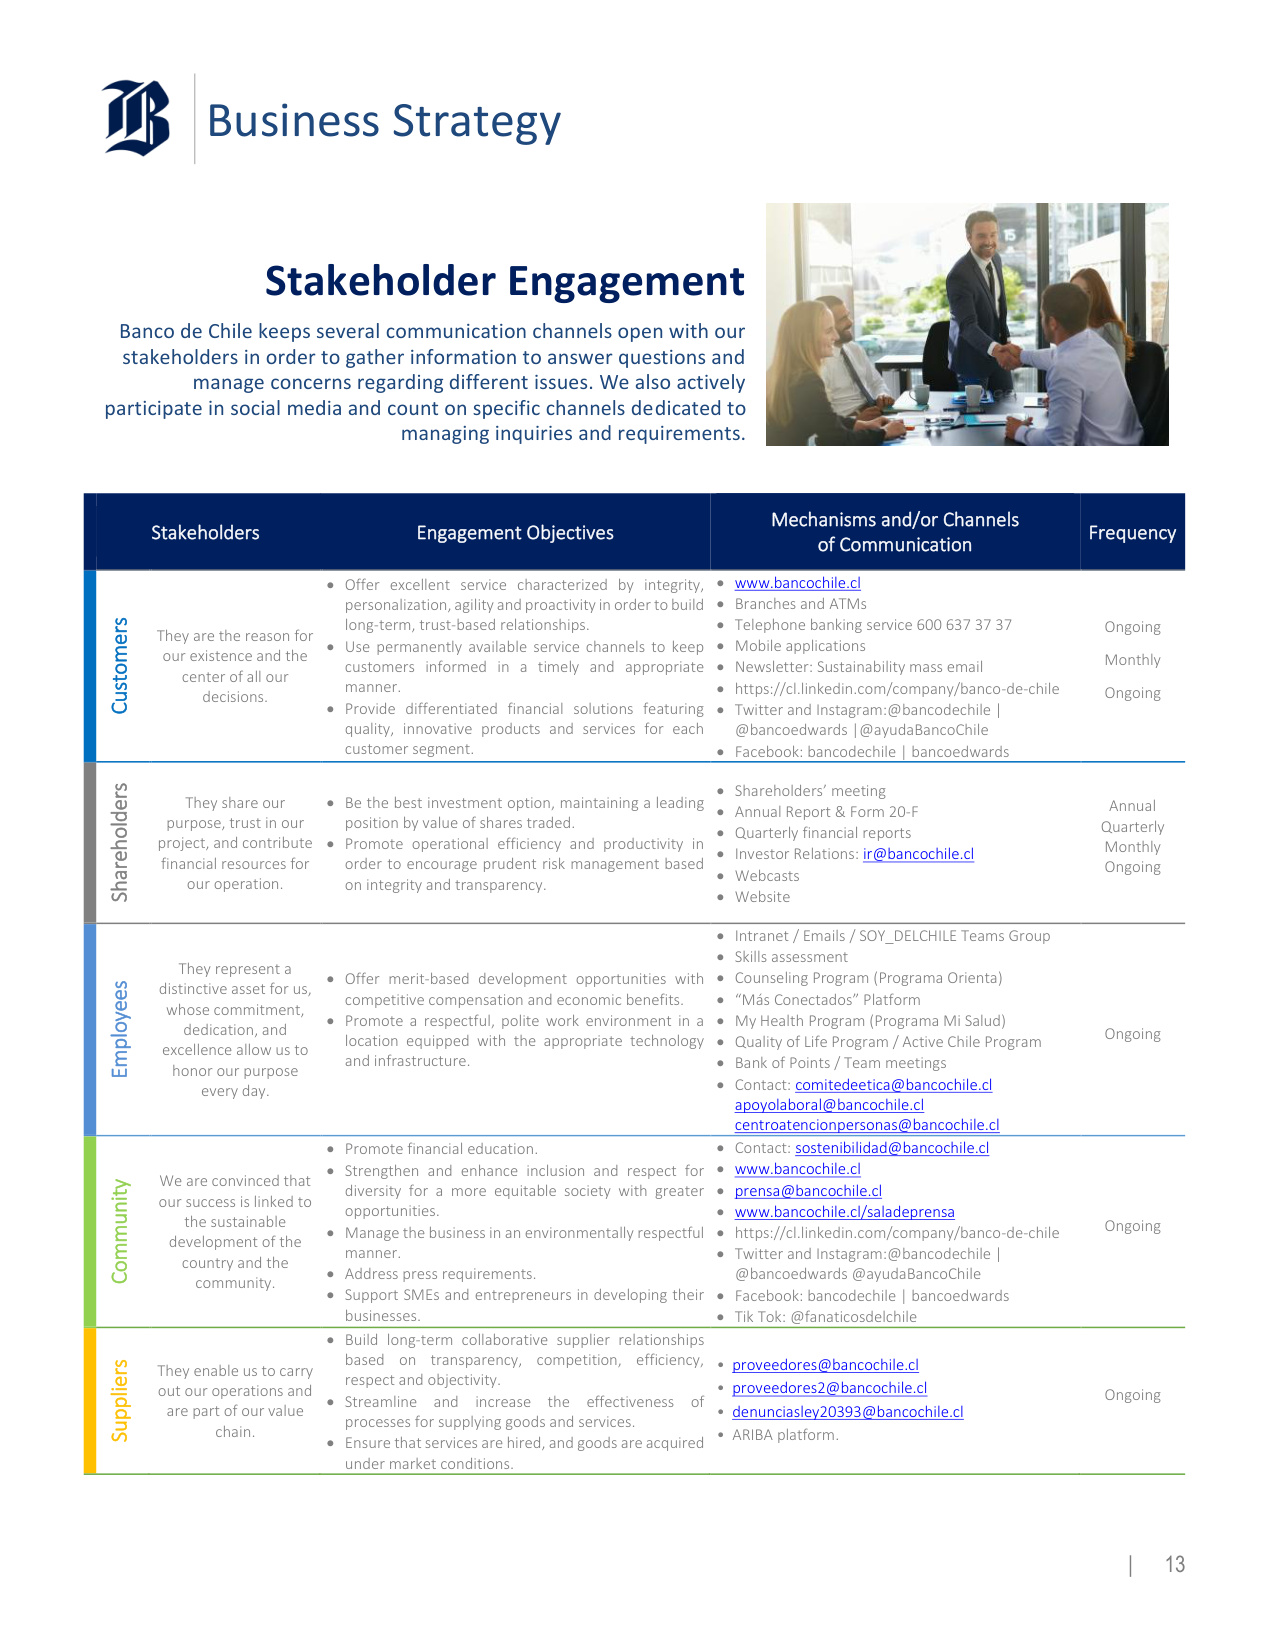
Business Strategy | 13 Stakeholder Engagement Banco de Chile keeps several communication channels open with our stakeholders in order to gather information to answer questions and manage concerns regarding different issues. We also actively participate in social media and count on specific channels dedicated to managing inquiries and requirements. Stakeholders Engagement Objectives Mechanisms and/or Channels of Communication Frequency Customers They are the reason for our existence and the center of all our decisions. • Offer excellent service characterized by integrity, personalization, agility and proactivity in order to build long-term, trust-based relationships. • Use permanently available service channels to keep customers informed in a timely and appropriate manner. • Provide differentiated financial solutions featuring quality, innovative products and services for each customer segment. • www.bancochile.cl • Branches and ATMs • Telephone banking service 600 637 37 37 • Mobile applications • Newsletter: Sustainability mass email • https://cl.linkedin.com/company/banco-de-chile • Twitter and Instagram:@bancodechile | @bancoedwards |@ayudaBancoChile • Facebook: bancodechile | bancoedwards Ongoing Monthly Ongoing Shareholders They share our purpose, trust in our project, and contribute financial resources for our operation. • Be the best investment option, maintaining a leading position by value of shares traded. • Promote operational efficiency and productivity in order to encourage prudent risk management based on integrity and transparency. • Shareholders' meeting • Annual Report & Form 20-F • Quarterly financial reports • Investor Relations: ir@bancochile.cl • Webcasts • Website Annual Quarterly Monthly Ongoing Employees They represent a distinctive asset for us, whose commitment, dedication, and excellence allow us to honor our purpose every day. • Offer merit-based development opportunities with competitive compensation and economic benefits. • Promote a respectful, polite work environment in a location equipped with the appropriate technology and infrastructure. • Intranet / Emails / SOY_DELCHILE Teams Group • Skills assessment • Counseling Program (Programa Orienta) • "Más Conectados" Platform • My Health Program (Programa Mi Salud) • Quality of Life Program / Active Chile Program • Bank of Points / Team meetings • Contact: comitedeetica@bancochile.cl apoyolaboral@bancochile.cl centroatencionpersonas@bancochile.cl Ongoing Community We are convinced that our success is linked to the sustainable development of the country and the community. • Promote financial education. • Strengthen and enhance inclusion and respect for diversity for a more equitable society with greater opportunities. • Manage the business in an environmentally respectful manner. • Address press requirements. • Support SMEs and entrepreneurs in developing their businesses. • Contact: sostenibilidad@bancochile.cl • www.bancochile.cl • prensa@bancochile.cl • www.bancochile.cl/saladeprensa • https://cl.linkedin.com/company/banco-de-chile • Twitter and Instagram:@bancodechile | @bancoedwards @ayudaBancoChile • Facebook: bancodechile | bancoedwards • Tik Tok: @fanaticosdelchile Ongoing Suppliers They enable us to carry out our operations and are part of our value chain. • Build long-term collaborative supplier relationships based on transparency, competition, efficiency, respect and objectivity. • Streamline and increase the effectiveness of processes for supplying goods and services. • Ensure that services are hired, and goods are acquired under market conditions. • proveedores@bancochile.cl • proveedores2@bancochile.cl • denunciasley20393@bancochile.cl • ARIBA platform. Ongoing
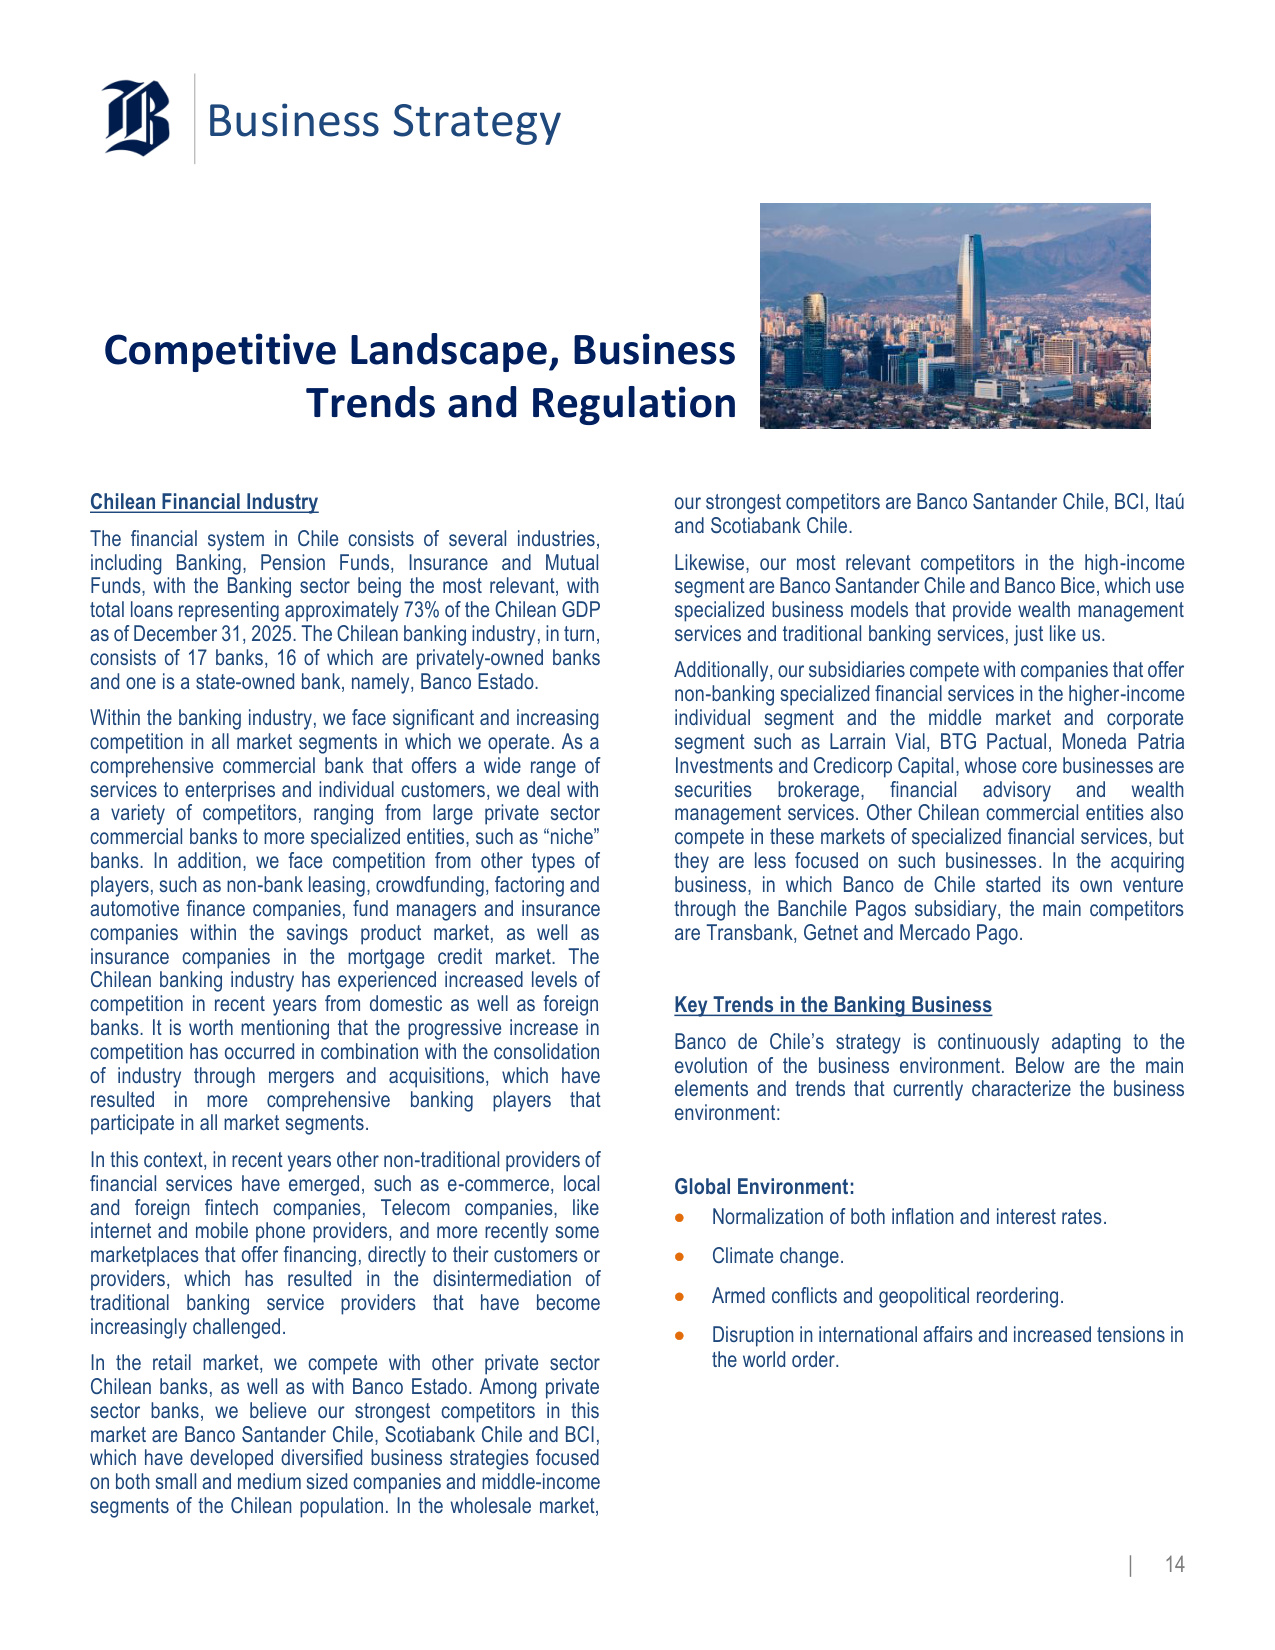
Business Strategy | 14 Competitive Landscape, Business Trends and Regulation Chilean Financial Industry The financial system in Chile consists of several industries, including Banking, Pension Funds, Insurance and Mutual Funds, with the Banking sector being the most relevant, with total loans representing approximately 73% of the Chilean GDP as of December 31, 2025. The Chilean banking industry, in turn, consists of 17 banks, 16 of which are privately-owned banks and one is a state-owned bank, namely, Banco Estado. Within the banking industry, we face significant and increasing competition in all market segments in which we operate. As a comprehensive commercial bank that offers a wide range of services to enterprises and individual customers, we deal with a variety of competitors, ranging from large private sector commercial banks to more specialized entities, such as "niche" banks. In addition, we face competition from other types of players, such as non-bank leasing, crowdfunding, factoring and automotive finance companies, fund managers and insurance companies within the savings product market, as well as insurance companies in the mortgage credit market. The Chilean banking industry has experienced increased levels of competition in recent years from domestic as well as foreign banks. It is worth mentioning that the progressive increase in competition has occurred in combination with the consolidation of industry through mergers and acquisitions, which have resulted in more comprehensive banking players that participate in all market segments. In this context, in recent years other non-traditional providers of financial services have emerged, such as e-commerce, local and foreign fintech companies, Telecom companies, like internet and mobile phone providers, and more recently some marketplaces that offer financing, directly to their customers or providers, which has resulted in the disintermediation of traditional banking service providers that have become increasingly challenged. In the retail market, we compete with other private sector Chilean banks, as well as with Banco Estado. Among private sector banks, we believe our strongest competitors in this market are Banco Santander Chile, Scotiabank Chile and BCI, which have developed diversified business strategies focused on both small and medium sized companies and middle-income segments of the Chilean population. In the wholesale market, our strongest competitors are Banco Santander Chile, BCI, Itaú and Scotiabank Chile. Likewise, our most relevant competitors in the high-income segment are Banco Santander Chile and Banco Bice, which use specialized business models that provide wealth management services and traditional banking services, just like us. Additionally, our subsidiaries compete with companies that offer non-banking specialized financial services in the higher-income individual segment and the middle market and corporate segment such as Larrain Vial, BTG Pactual, Moneda Patria Investments and Credicorp Capital, whose core businesses are securities brokerage, financial advisory and wealth management services. Other Chilean commercial entities also compete in these markets of specialized financial services, but they are less focused on such businesses. In the acquiring business, in which Banco de Chile started its own venture through the Banchile Pagos subsidiary, the main competitors are Transbank, Getnet and Mercado Pago. Key Trends in the Banking Business Banco de Chile's strategy is continuously adapting to the evolution of the business environment. Below are the main elements and trends that currently characterize the business environment: Global Environment: • Normalization of both inflation and interest rates. • Climate change. • Armed conflicts and geopolitical reordering. • Disruption in international affairs and increased tensions in the world order.
Business Strategy | 15 Local Environment: • Economic slowdown and subdued private investment. • Increased criminality. • New political cycle and expectations of economic boost. • Political fragmentation. • Strengthening consumer rights (data security). Banking Industry: • New technological capabilities (AI, Cloud, Cyber). • Regulatory pressure and progressive capital requirements. • Increased competition and widened competitive perimeter (Open Banking, Fintechs). • Sustainability and climate change. • Business model modernization, talent management, and IT strategies to adapt to the new environment. • More demanding and less loyal customers, with increased preference for a simple, customized, integrating and frictionless experience. • Optimization of the physical service network and consolidation of digital channels as the main way for interaction with customers. • Pressure on cybersecurity and data protection risks linked to the increase in digitalization. • Cost base optimization to mitigate increased competition and regulation. Regulatory Environment Financial Market Commission (CMF): The CMF is responsible for regulating, supervising and sanctioning the operations, stability and development of the Chilean financial market (made up of listed companies, banks and financial institutions, insurance companies, insurance brokers, mutual funds and investment funds), promoting the participation of market agents and ensuring public confidence. To achieve this objective, the CMF must have a global and systemic vision, which allows the interests of investors and insured agents to be safeguarded. Regarding the specific powers of the CMF related to banking regulation, this entity authorizes the creation of new banks and has broad powers to interpret and enforce legal and regulatory requirements applicable to banks and financial institutions. Furthermore, in cases of noncompliance with its legal and regulatory requirements, the CMF has the ability to impose sanctions. In extreme cases, it can appoint, with the prior approval of the board of directors of the Central Bank, a provisional administrator to manage banks. It also has the mandate to approve any amendment to banks' bylaws. A bank's financial statements as of December 31 of each year must be audited and submitted to the CMF together with the report of its independent auditors. Also, banks are required by the CMF to include in mid-year financial statements (as of June 30 of every fiscal year) an auditor's interim review report on financial information in accordance with Chilean GAAP. In addition, banks are required to provide extensive information regarding their operations at various periodic intervals to the CMF by means of specialized reports associated with business- related risk, capital, products, debtors, transactions, distribution channels, among others. Central Bank: The Central Bank is an autonomous legal entity created under the framework of the Chilean Constitution. It is subject to its Ley Orgánica Constitucional (the "Organic Constitutional Law") and the current Chilean Constitution. The Central Bank is directed and administered by a board of directors composed of five members appointed by the President of Chile, subject to Senate approval. The legal purpose of the Central Bank is to maintain the stability of the Chilean peso, that is, to keep inflation low and stable over time. It must also promote the stability and efficiency of the financial system, ensuring the normal functioning of internal and external payments. The agency regulates the amount of money and credit in circulation, executes international exchange operations and issues monetary, credit, financial and international exchange regulations. Securities and Exchange Commission (SEC): Since Banco de Chile has been listed on the New York Stock Exchange since January 1, 2002, we are subject to regulation and supervision of the Securities and Exchange Commission. We are required to file with SEC the form 20F, including audited financial statements, as of December of each year in accordance with IFRS as issued by the International Accounting Standards Board.
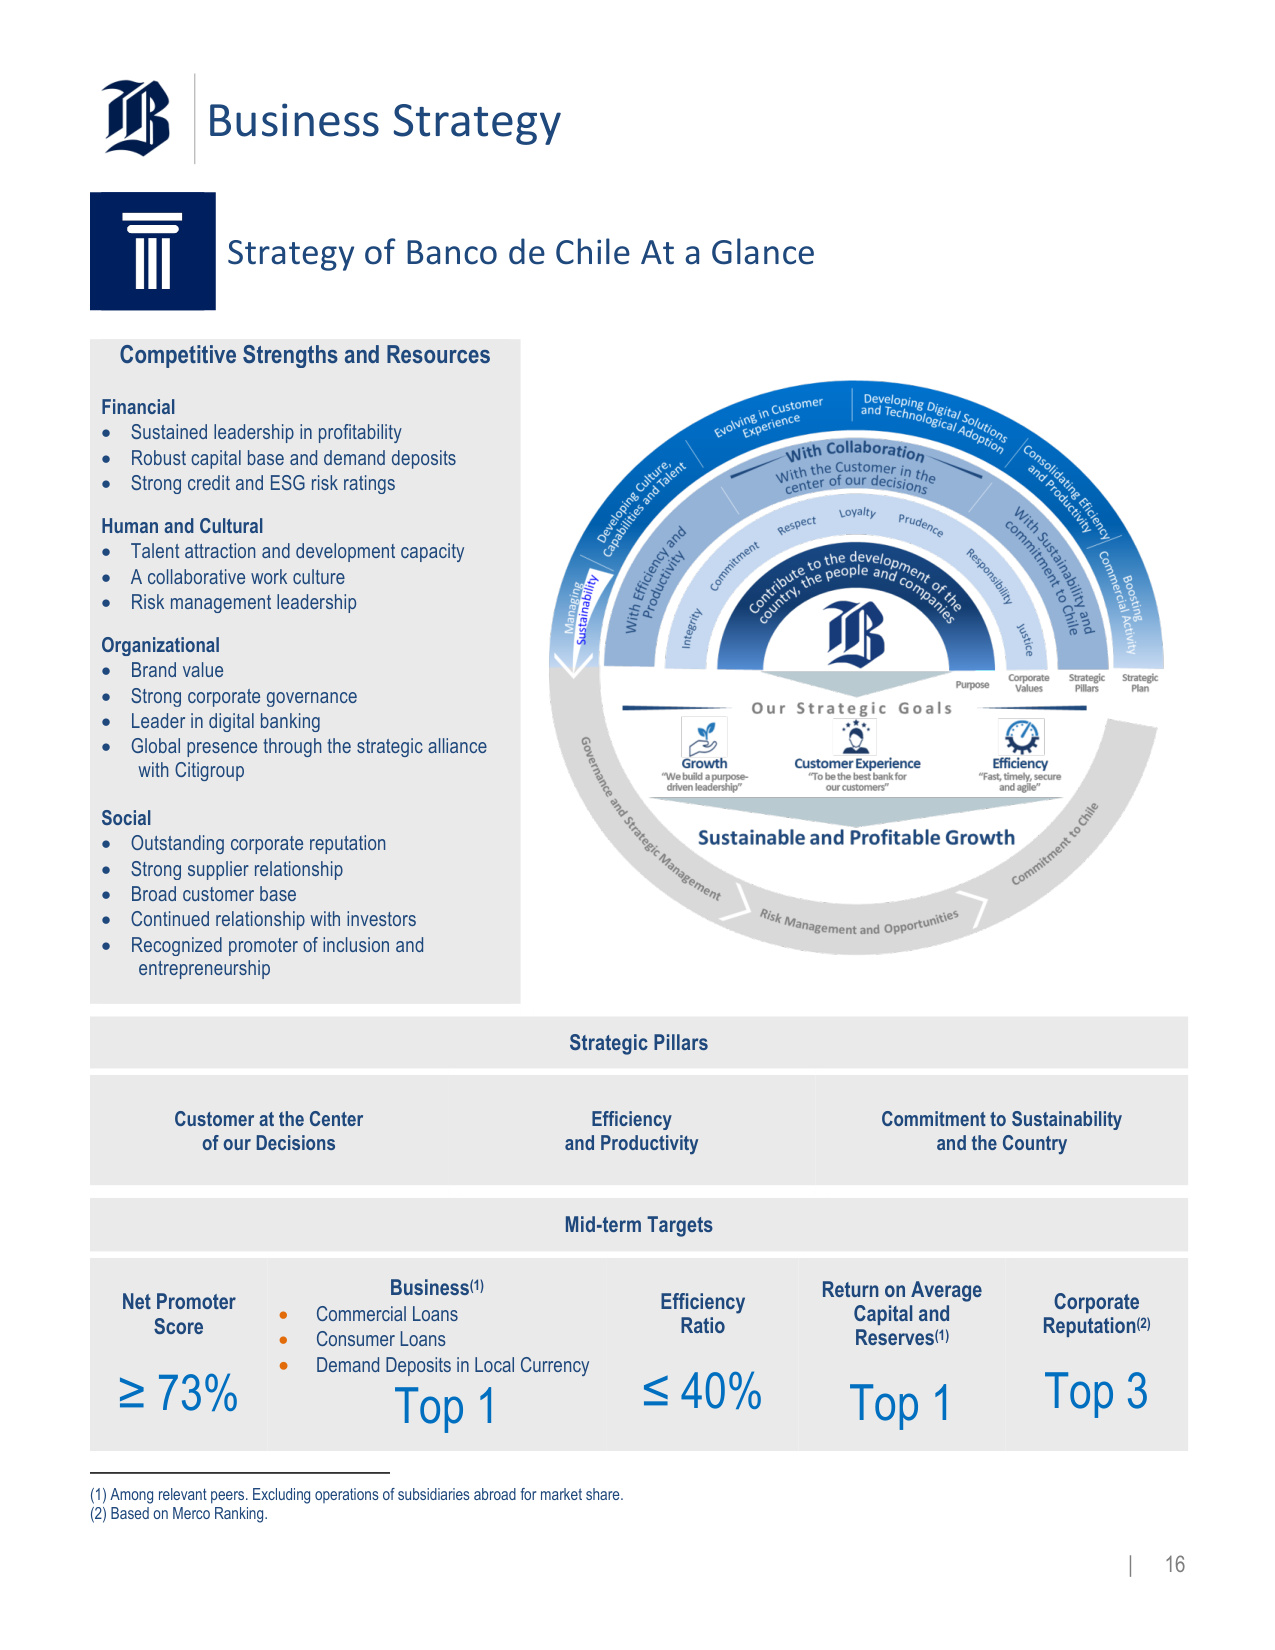
Business Strategy | 16 Strategy of Banco de Chile At a Glance Competitive Strengths and Resources Financial • Sustained leadership in profitability • Robust capital base and demand deposits • Strong credit and ESG risk ratings Human and Cultural • Talent attraction and development capacity • A collaborative work culture • Risk management leadership Organizational • Brand value • Strong corporate governance • Leader in digital banking • Global presence through the strategic alliance with Citigroup Social • Outstanding corporate reputation • Strong supplier relationship • Broad customer base • Continued relationship with investors • Recognized promoter of inclusion and entrepreneurship Strategic Pillars Customer at the Center of our Decisions Efficiency and Productivity Commitment to Sustainability and the Country Mid-term Targets Net Promoter Score ≥ 73% Business(1) • Commercial Loans • Consumer Loans • Demand Deposits in Local Currency Top 1 Efficiency Ratio ≤ 40% Return on Average Capital and Reserves(1) Top 1 Corporate Reputation(2) Top 3 (1) Among relevant peers. Excluding operations of subsidiaries abroad for market share. (2) Based on Merco Ranking.
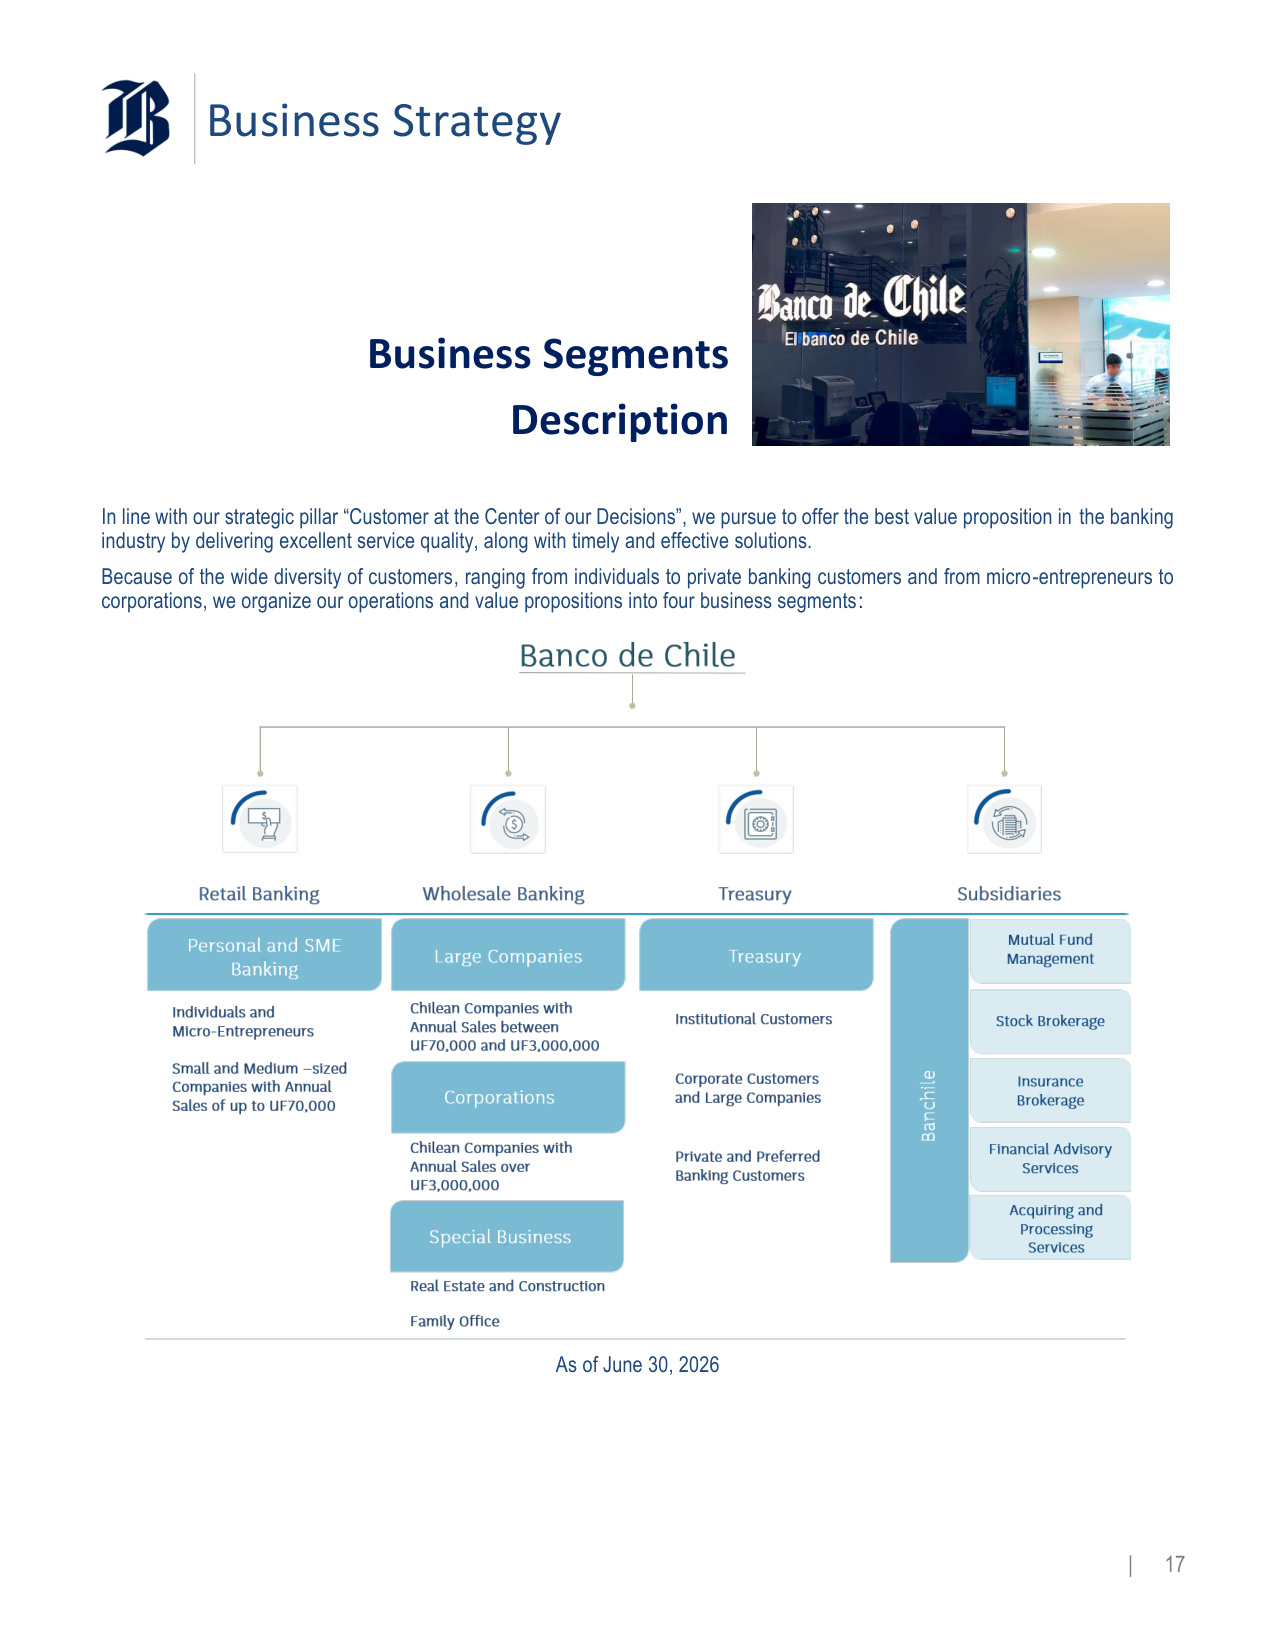
Business Strategy | 17 Business Segments Description In line with our strategic pillar "Customer at the Center of our Decisions", we pursue to offer the best value proposition in the banking industry by delivering excellent service quality, along with timely and effective solutions. Because of the wide diversity of customers, ranging from individuals to private banking customers and from micro-entrepreneurs to corporations, we organize our operations and value propositions into four business segments: As of June 30, 2026
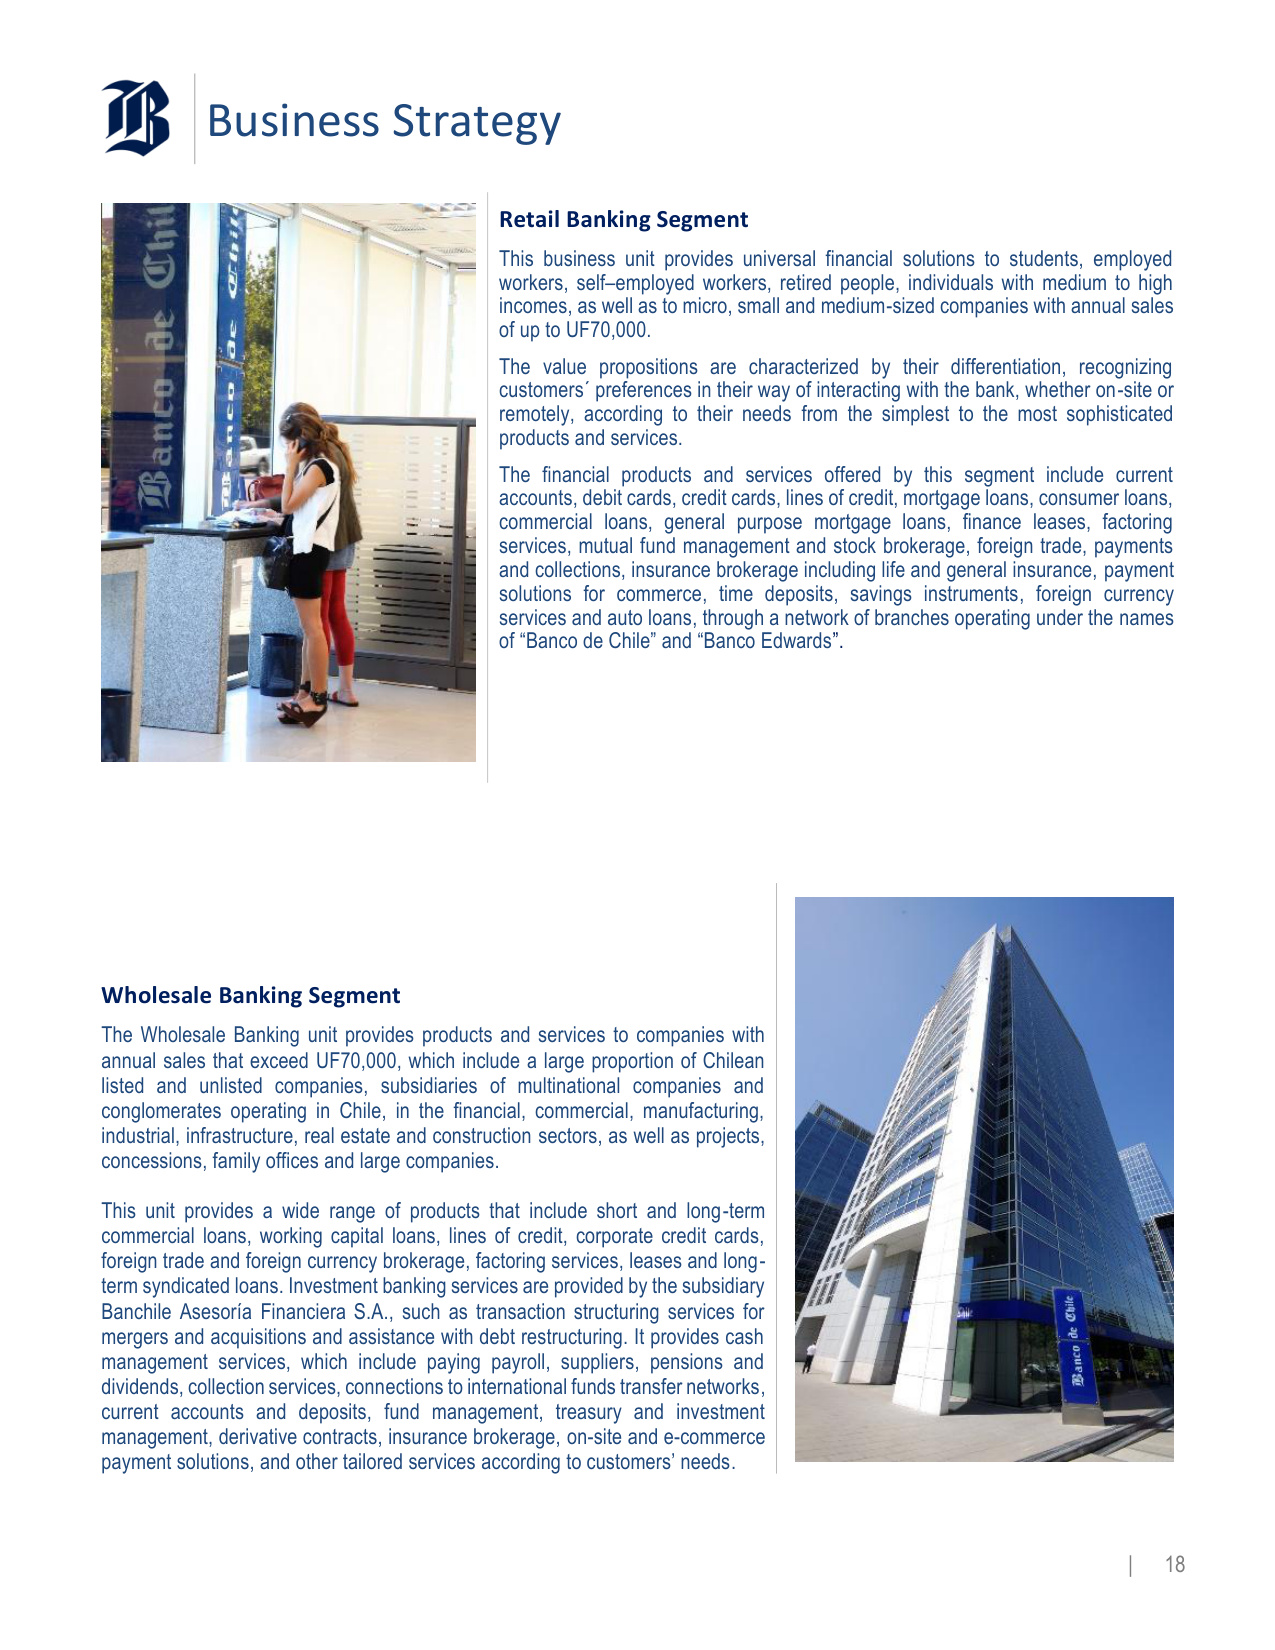
Business Strategy | 18 Retail Banking Segment This business unit provides universal financial solutions to students, employed workers, self–employed workers, retired people, individuals with medium to high incomes, as well as to micro, small and medium-sized companies with annual sales of up to UF70,000. The value propositions are characterized by their differentiation, recognizing customers´ preferences in their way of interacting with the bank, whether on-site or remotely, according to their needs from the simplest to the most sophisticated products and services. The financial products and services offered by this segment include current accounts, debit cards, credit cards, lines of credit, mortgage loans, consumer loans, commercial loans, general purpose mortgage loans, finance leases, factoring services, mutual fund management and stock brokerage, foreign trade, payments and collections, insurance brokerage including life and general insurance, payment solutions for commerce, time deposits, savings instruments, foreign currency services and auto loans, through a network of branches operating under the names of "Banco de Chile" and "Banco Edwards". Wholesale Banking Segment The Wholesale Banking unit provides products and services to companies with annual sales that exceed UF70,000, which include a large proportion of Chilean listed and unlisted companies, subsidiaries of multinational companies and conglomerates operating in Chile, in the financial, commercial, manufacturing, industrial, infrastructure, real estate and construction sectors, as well as projects, concessions, family offices and large companies. This unit provides a wide range of products that include short and long-term commercial loans, working capital loans, lines of credit, corporate credit cards, foreign trade and foreign currency brokerage, factoring services, leases and long- term syndicated loans. Investment banking services are provided by the subsidiary Banchile Asesoría Financiera S.A., such as transaction structuring services for mergers and acquisitions and assistance with debt restructuring. It provides cash management services, which include paying payroll, suppliers, pensions and dividends, collection services, connections to international funds transfer networks, current accounts and deposits, fund management, treasury and investment management, derivative contracts, insurance brokerage, on-site and e-commerce payment solutions, and other tailored services according to customers' needs.
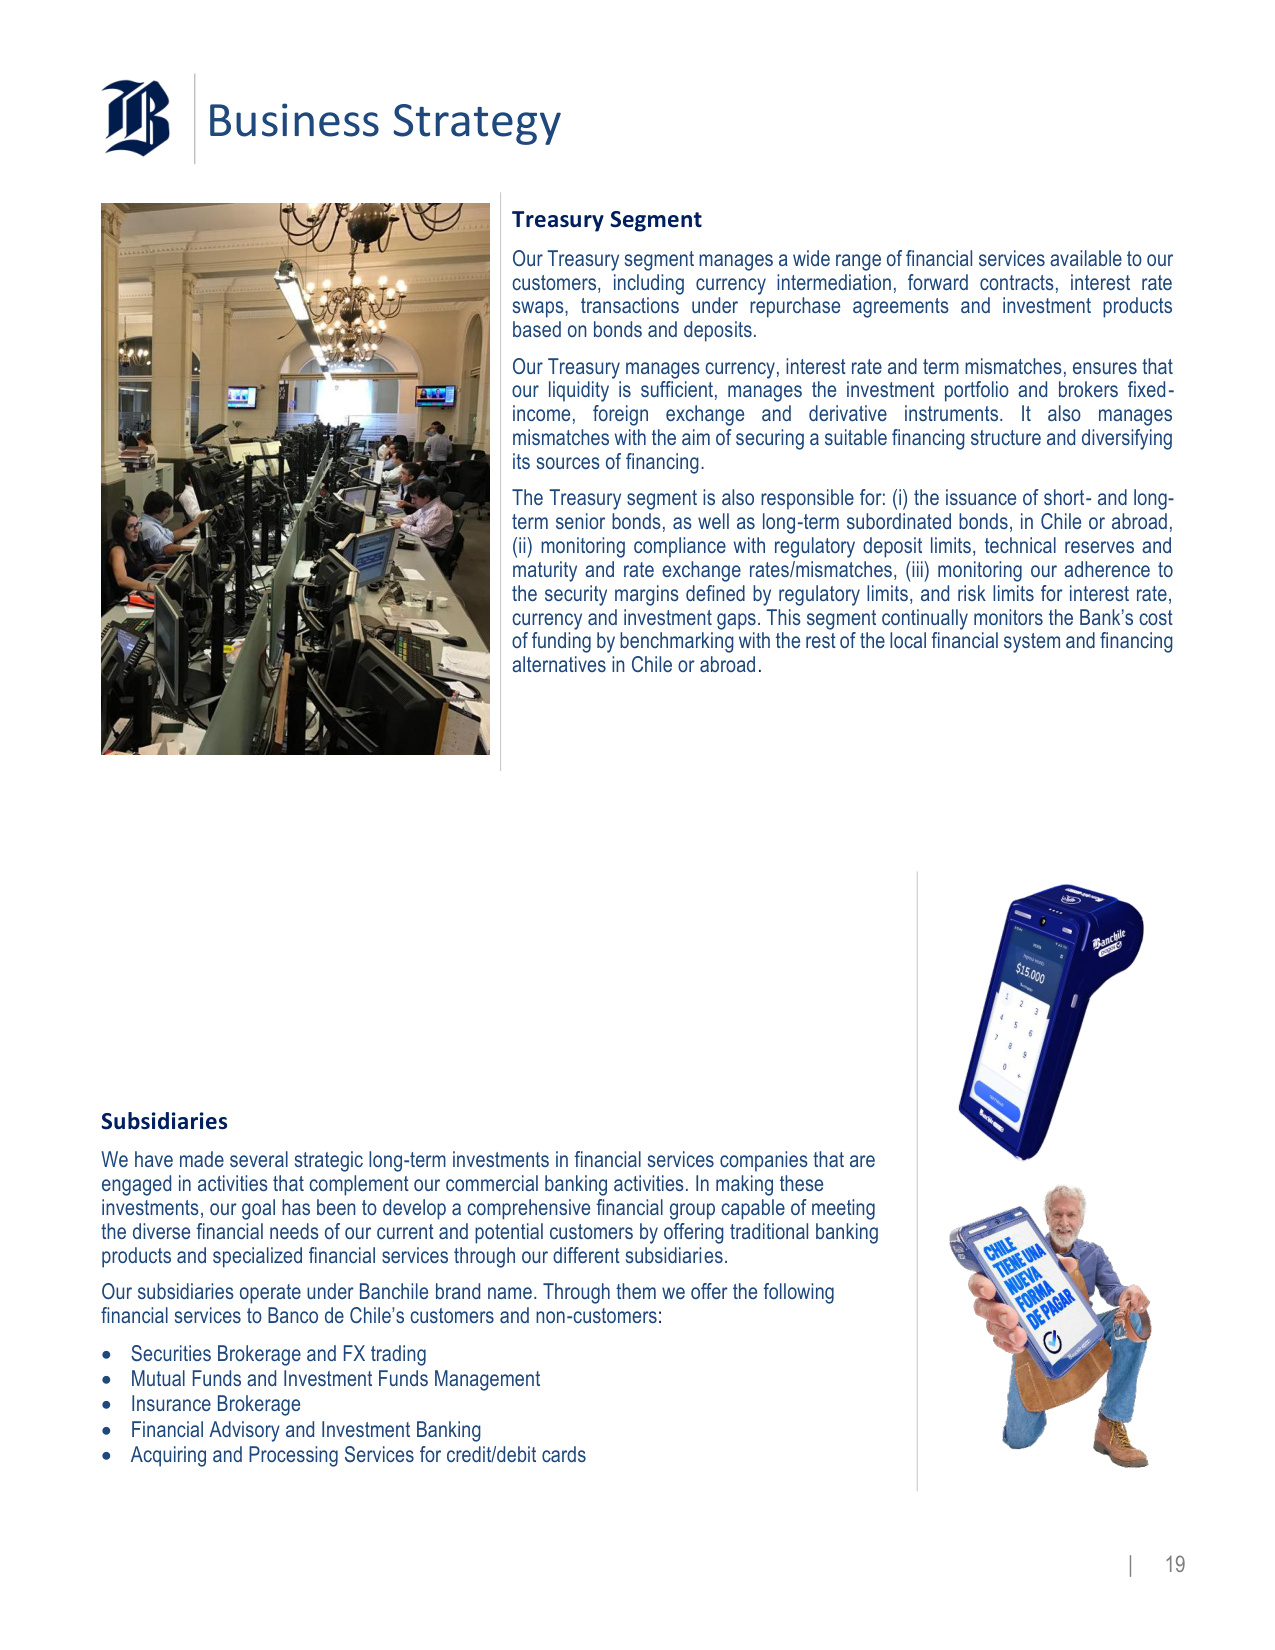
Business Strategy | 19 Treasury Segment Our Treasury segment manages a wide range of financial services available to our customers, including currency intermediation, forward contracts, interest rate swaps, transactions under repurchase agreements and investment products based on bonds and deposits. Our Treasury manages currency, interest rate and term mismatches, ensures that our liquidity is sufficient, manages the investment portfolio and brokers fixed- income, foreign exchange and derivative instruments. It also manages mismatches with the aim of securing a suitable financing structure and diversifying its sources of financing. The Treasury segment is also responsible for: (i) the issuance of short- and long- term senior bonds, as well as long-term subordinated bonds, in Chile or abroad, (ii) monitoring compliance with regulatory deposit limits, technical reserves and maturity and rate exchange rates/mismatches, (iii) monitoring our adherence to the security margins defined by regulatory limits, and risk limits for interest rate, currency and investment gaps. This segment continually monitors the Bank's cost of funding by benchmarking with the rest of the local financial system and financing alternatives in Chile or abroad. Subsidiaries We have made several strategic long-term investments in financial services companies that are engaged in activities that complement our commercial banking activities. In making these investments, our goal has been to develop a comprehensive financial group capable of meeting the diverse financial needs of our current and potential customers by offering traditional banking products and specialized financial services through our different subsidiaries. Our subsidiaries operate under Banchile brand name. Through them we offer the following financial services to Banco de Chile's customers and non-customers: • Securities Brokerage and FX trading • Mutual Funds and Investment Funds Management • Insurance Brokerage • Financial Advisory and Investment Banking • Acquiring and Processing Services for credit/debit cards
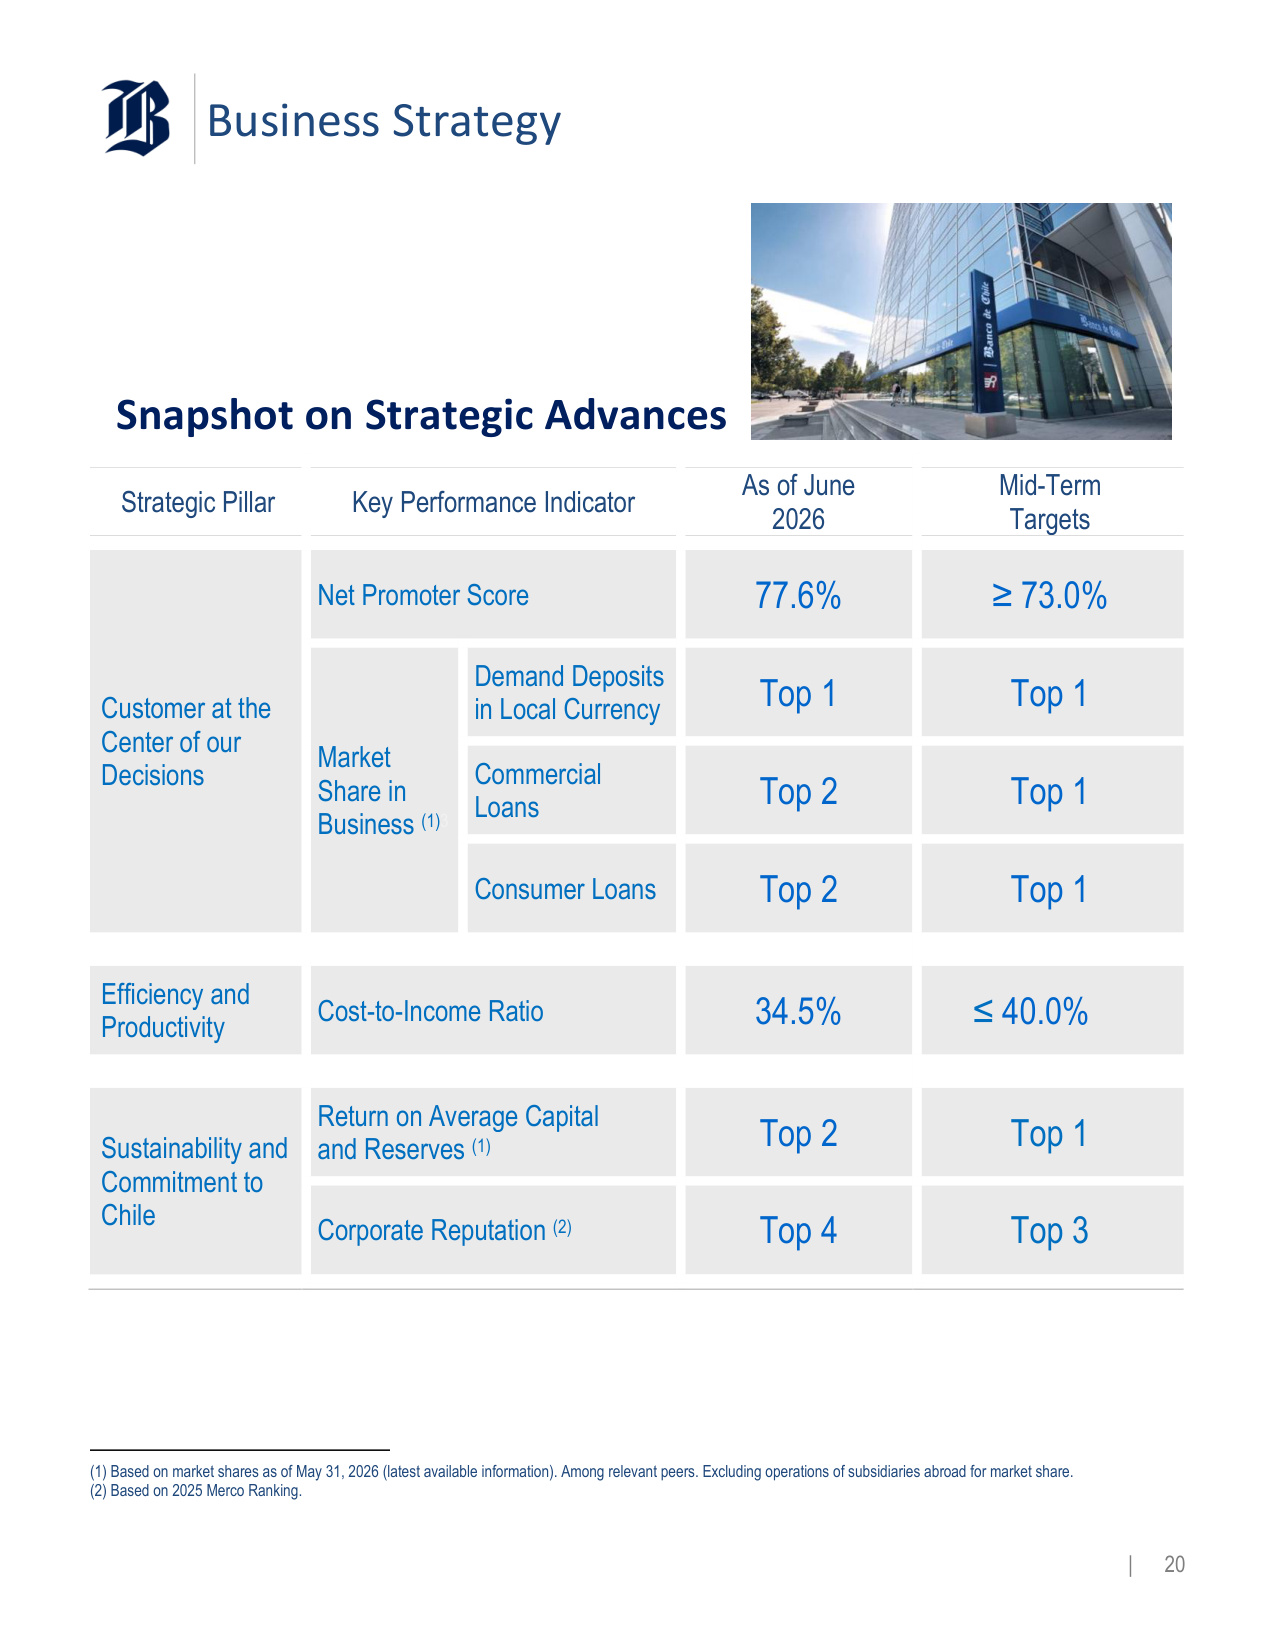
Business Strategy | 20 Snapshot on Strategic Advances Strategic Pillar Key Performance Indicator As of June 2026 Mid-Term Targets Customer at the Center of our Decisions Net Promoter Score 77.6% ≥ 73.0% Market Share in Business (1)3 Demand Deposits in Local Currency Top 1 Top 1 Commercial Loans Top 2 Top 1 Consumer Loans Top 2 Top 1 Efficiency and Productivity Cost-to-Income Ratio 34.5% ≤ 40.0% Sustainability and Commitment to Chile Return on Average Capital and Reserves (1) Top 2 Top 1 Corporate Reputation (2)(4) Top 4 Top 3 (1) Based on market shares as of May 31, 2026 (latest available information). Among relevant peers. Excluding operations of subsidiaries abroad for market share. (2) Based on 2025 Merco Ranking.
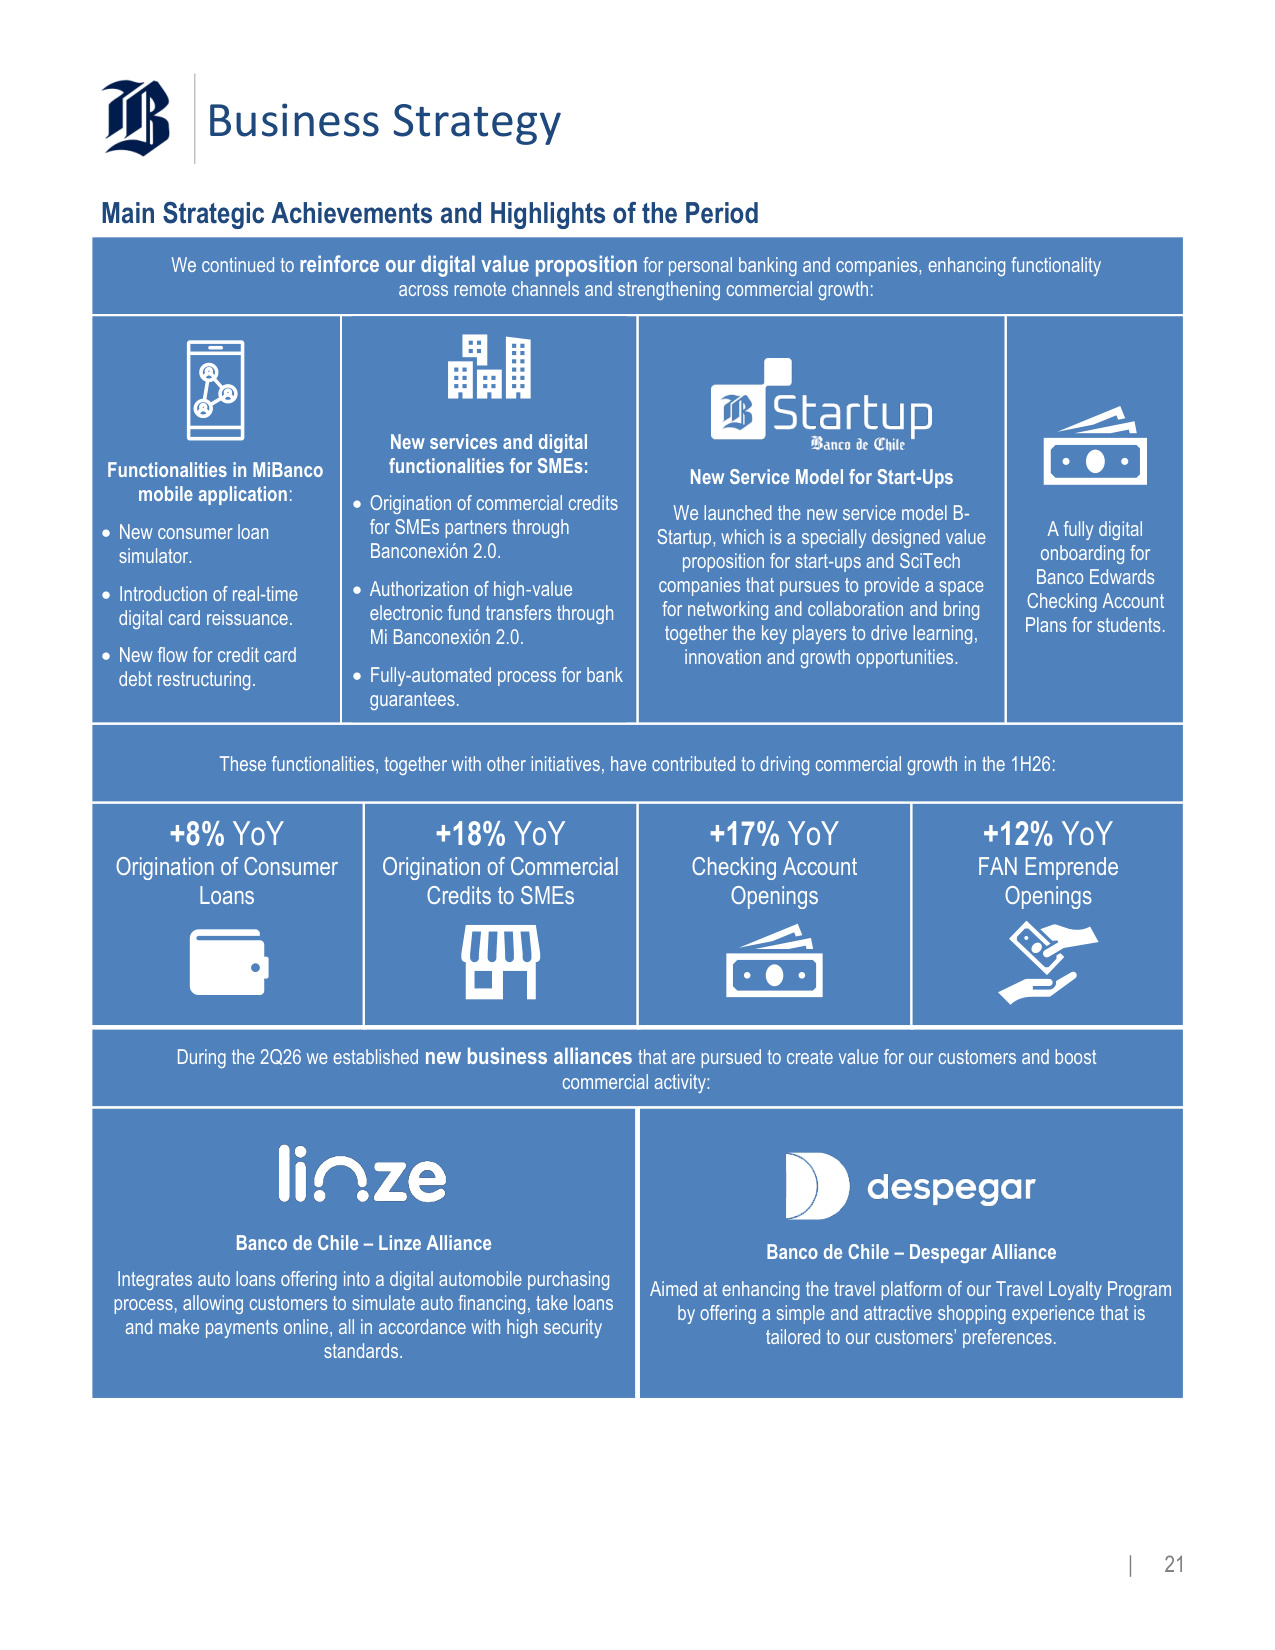
Business Strategy | 21 Main Strategic Achievements and Highlights of the Period We continued to reinforce our digital value proposition for personal banking and companies, enhancing functionality across remote channels and strengthening commercial growth: Functionalities in MiBanco mobile application: • New consumer loan simulator. • Introduction of real-time digital card reissuance. • New flow for credit card debt restructuring. New services and digital functionalities for SMEs: • Origination of commercial credits for SMEs partners through Banconexión 2.0. • Authorization of high‑value electronic fund transfers through Mi Banconexión 2.0. • Fully-automated process for bank guarantees. New Service Model for Start-Ups We launched the new service model B- Startup, which is a specially designed value proposition for start-ups and SciTech companies that pursues to provide a space for networking and collaboration and bring together the key players to drive learning, innovation and growth opportunities. A fully digital onboarding for Banco Edwards Checking Account Plans for students. These functionalities, together with other initiatives, have contributed to driving commercial growth in the 1H26: +8% YoY Origination of Consumer Loans +18% YoY Origination of Commercial Credits to SMEs +17% YoY Checking Account Openings +12% YoY FAN Emprende Openings During the 2Q26 we established new business alliances that are pursued to create value for our customers and boost commercial activity: Banco de Chile – Linze Alliance Integrates auto loans offering into a digital automobile purchasing process, allowing customers to simulate auto financing, take loans and make payments online, all in accordance with high security standards. Banco de Chile – Despegar Alliance Aimed at enhancing the travel platform of our Travel Loyalty Program by offering a simple and attractive shopping experience that is tailored to our customers' preferences.
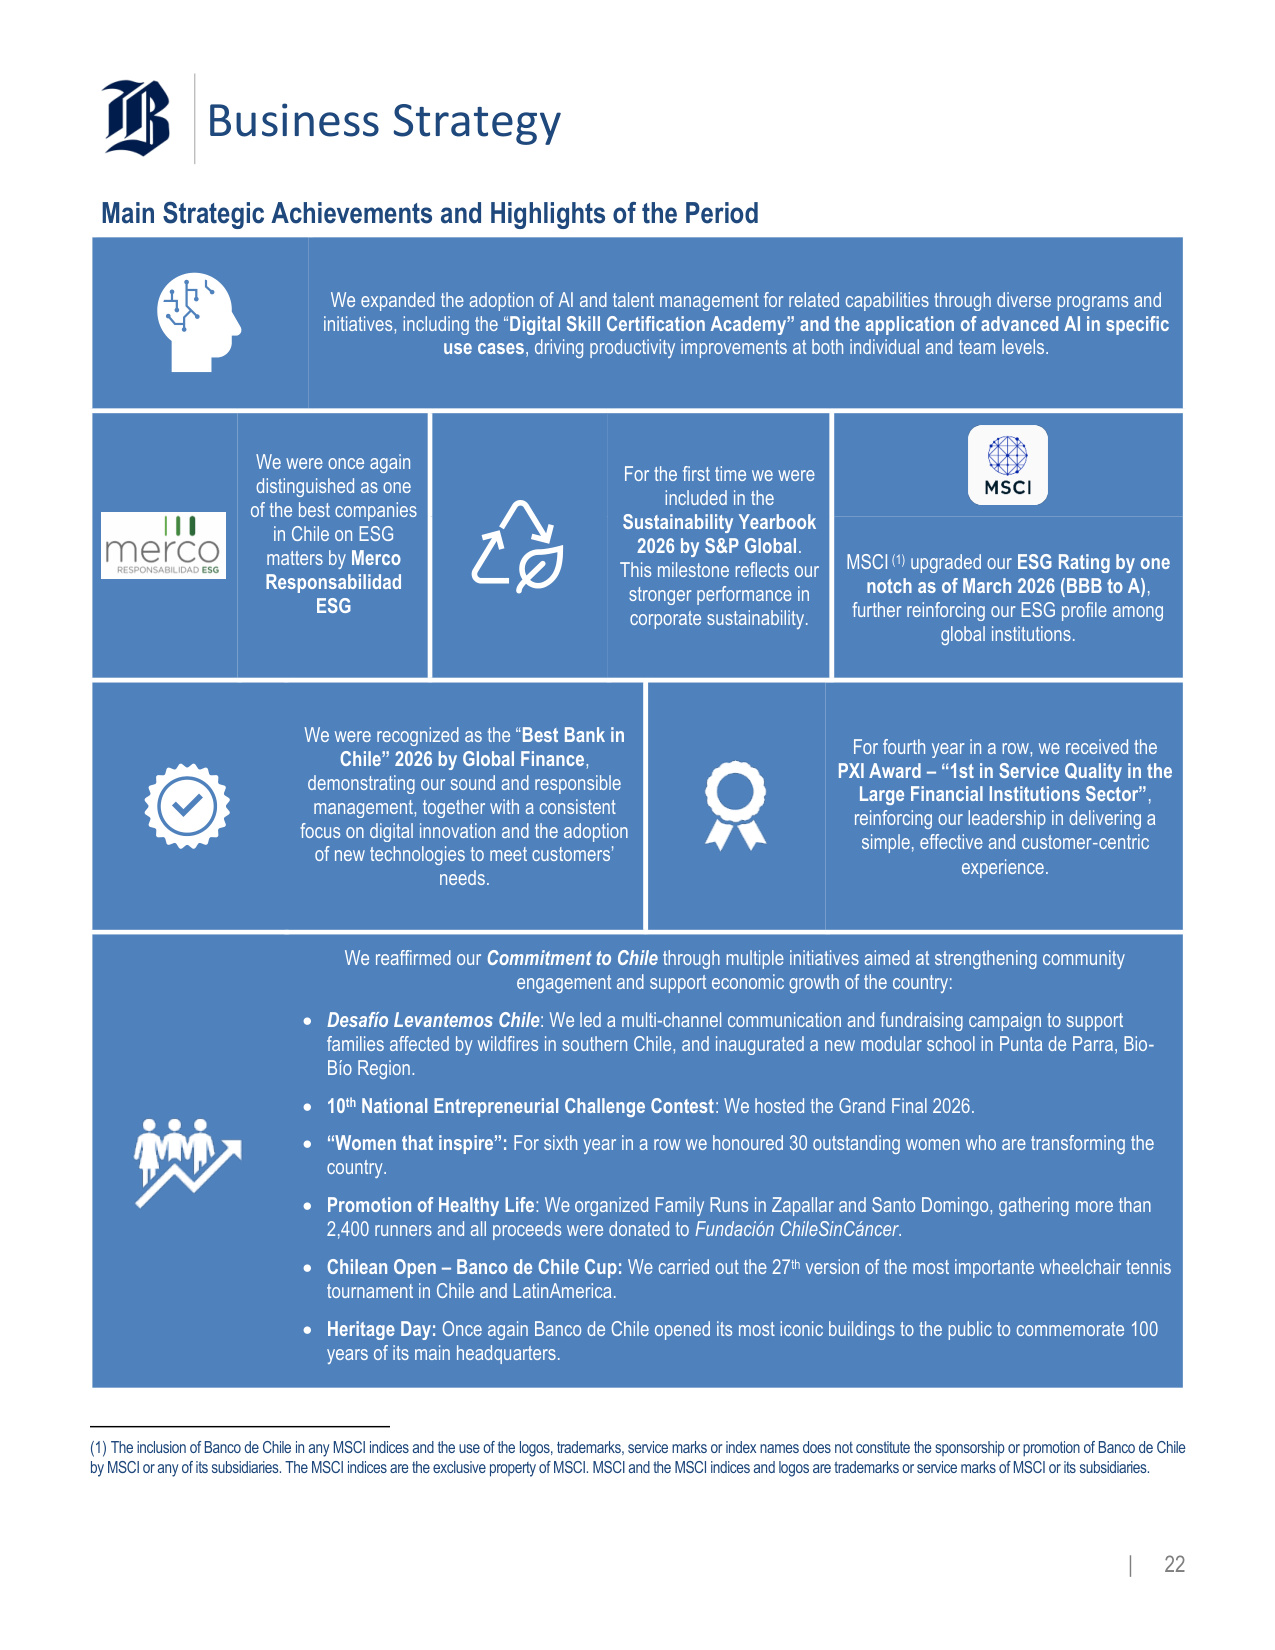
Business Strategy | 22 Main Strategic Achievements and Highlights of the Period We expanded the adoption of AI and talent management for related capabilities through diverse programs and initiatives, including the "Digital Skill Certification Academy" and the application of advanced AI in specific use cases, driving productivity improvements at both individual and team levels. We were once again distinguished as one of the best companies in Chile on ESG matters by Merco Responsabilidad ESG For the first time we were included in the Sustainability Yearbook 2026 by S&P Global. This milestone reflects our stronger performance in corporate sustainability. MSCI (1) upgraded our ESG Rating by one notch as of March 2026 (BBB to A), further reinforcing our ESG profile among global institutions. We were recognized as the "Best Bank in Chile" 2026 by Global Finance, demonstrating our sound and responsible management, together with a consistent focus on digital innovation and the adoption of new technologies to meet customers' needs. For fourth year in a row, we received the PXI Award – "1st in Service Quality in the Large Financial Institutions Sector", reinforcing our leadership in delivering a simple, effective and customer‑centric experience. We reaffirmed our Commitment to Chile through multiple initiatives aimed at strengthening community engagement and support economic growth of the country: • Desafío Levantemos Chile: We led a multi-channel communication and fundraising campaign to support families affected by wildfires in southern Chile, and inaugurated a new modular school in Punta de Parra, Bio- Bío Region. • 10th National Entrepreneurial Challenge Contest: We hosted the Grand Final 2026. • "Women that inspire": For sixth year in a row we honoured 30 outstanding women who are transforming the country. • Promotion of Healthy Life: We organized Family Runs in Zapallar and Santo Domingo, gathering more than 2,400 runners and all proceeds were donated to Fundación ChileSinCáncer. • Chilean Open – Banco de Chile Cup: We carried out the 27th version of the most importante wheelchair tennis tournament in Chile and LatinAmerica. • Heritage Day: Once again Banco de Chile opened its most iconic buildings to the public to commemorate 100 years of its main headquarters. (1) The inclusion of Banco de Chile in any MSCI indices and the use of the logos, trademarks, service marks or index names does not constitute the sponsorship or promotion of Banco de Chile by MSCI or any of its subsidiaries. The MSCI indices are the exclusive property of MSCI. MSCI and the MSCI indices and logos are trademarks or service marks of MSCI or its subsidiaries.
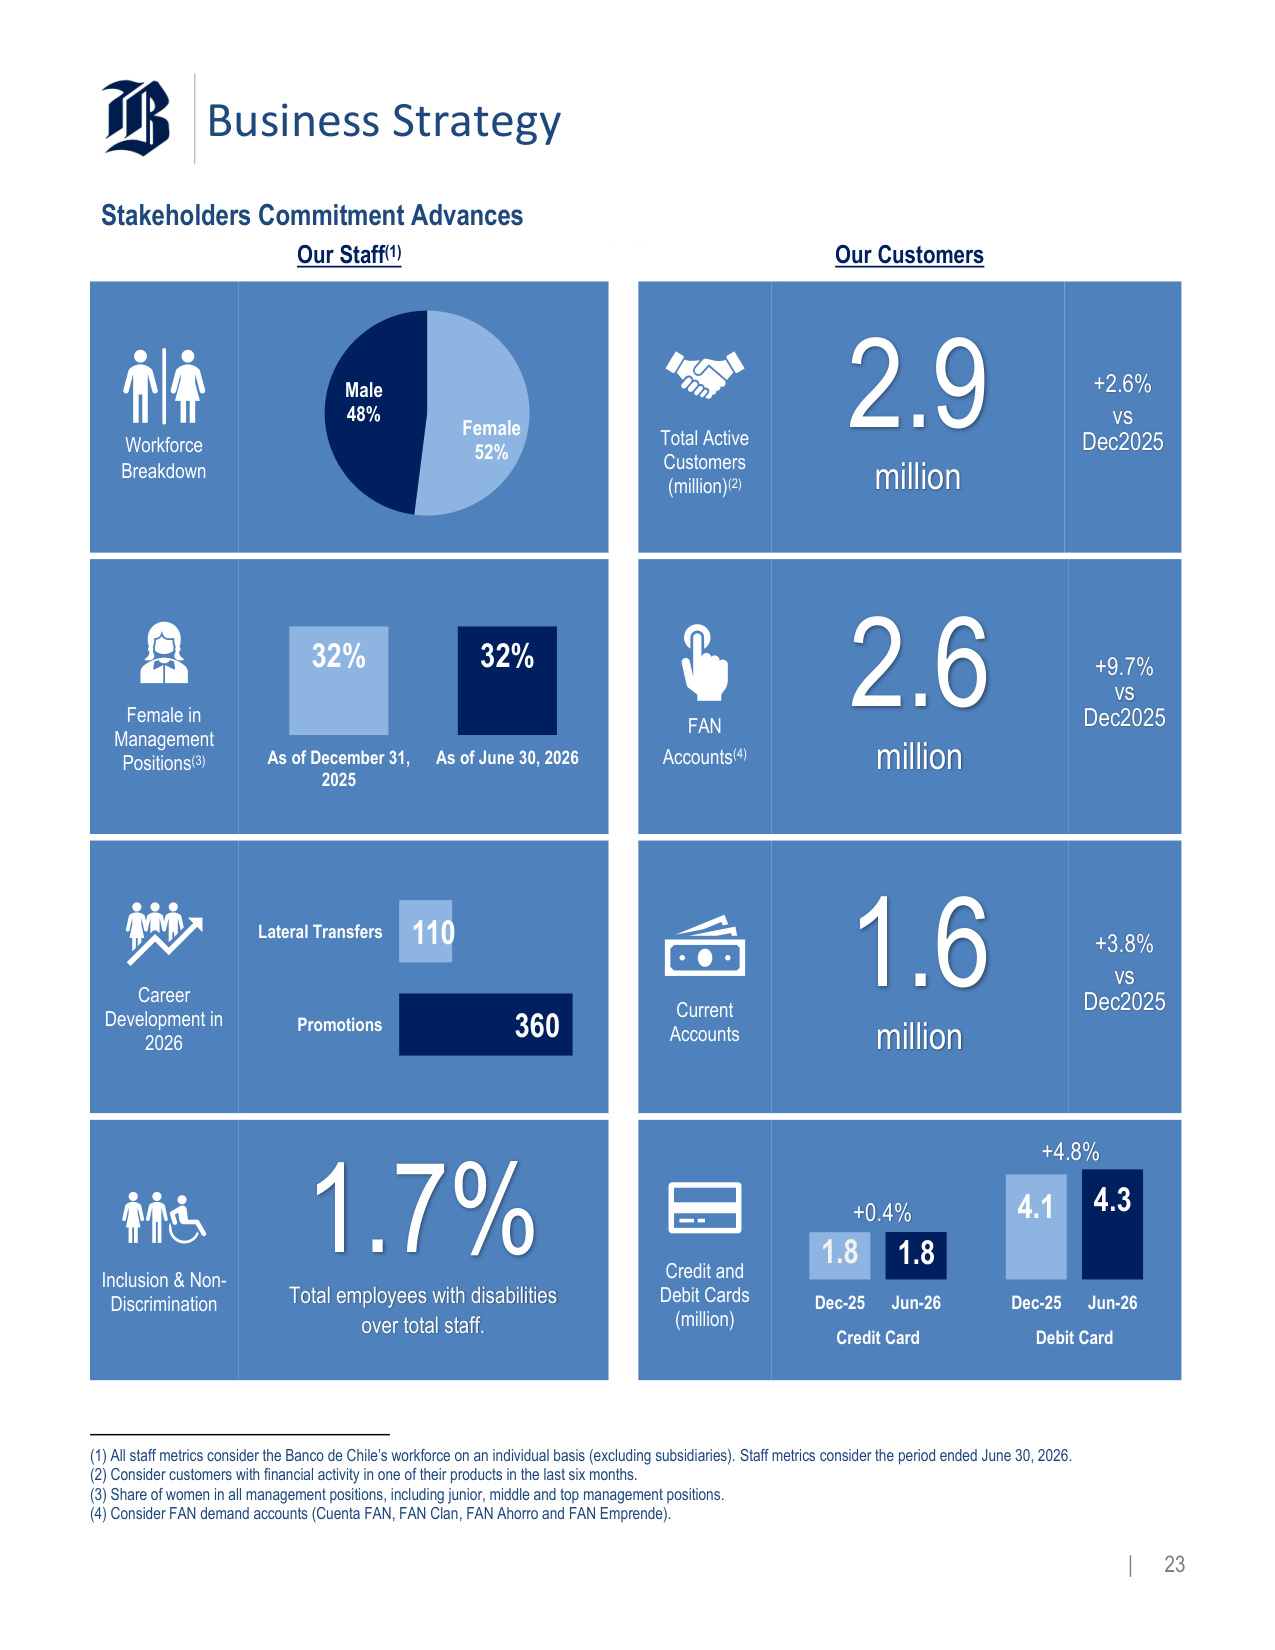
Business Strategy | 23 Stakeholders Commitment Advances Our Staff(1) Our Customers Workforce Breakdown Total Active Customers (million)(2) 2.9 million +2.6% vs Dec2025 Female in Management Positions(3) FAN Accounts(4) 2.6 million +9.7% vs Dec2025 Career Development in 2026 Current Accounts 1.6 million +3.8% vs Dec2025 Inclusion & Non- Discrimination 1.7% Total employees with disabilities over total staff. Credit and Debit Cards (million) (1) All staff metrics consider the Banco de Chile's workforce on an individual basis (excluding subsidiaries). Staff metrics consider the period ended June 30, 2026. (2) Consider customers with financial activity in one of their products in the last six months. (3) Share of women in all management positions, including junior, middle and top management positions. (4) Consider FAN demand accounts (Cuenta FAN, FAN Clan, FAN Ahorro and FAN Emprende). Female 52% Male 48% 32% 32% As of December 31, 2025 As of June 30, 2026 360 110 Promotions Lateral Transfers 1.8 1.8 Dec-25 Jun-26 Credit Card 4.1 4.3 Dec-25 Jun-26 Debit Card +4.8% +0.4%
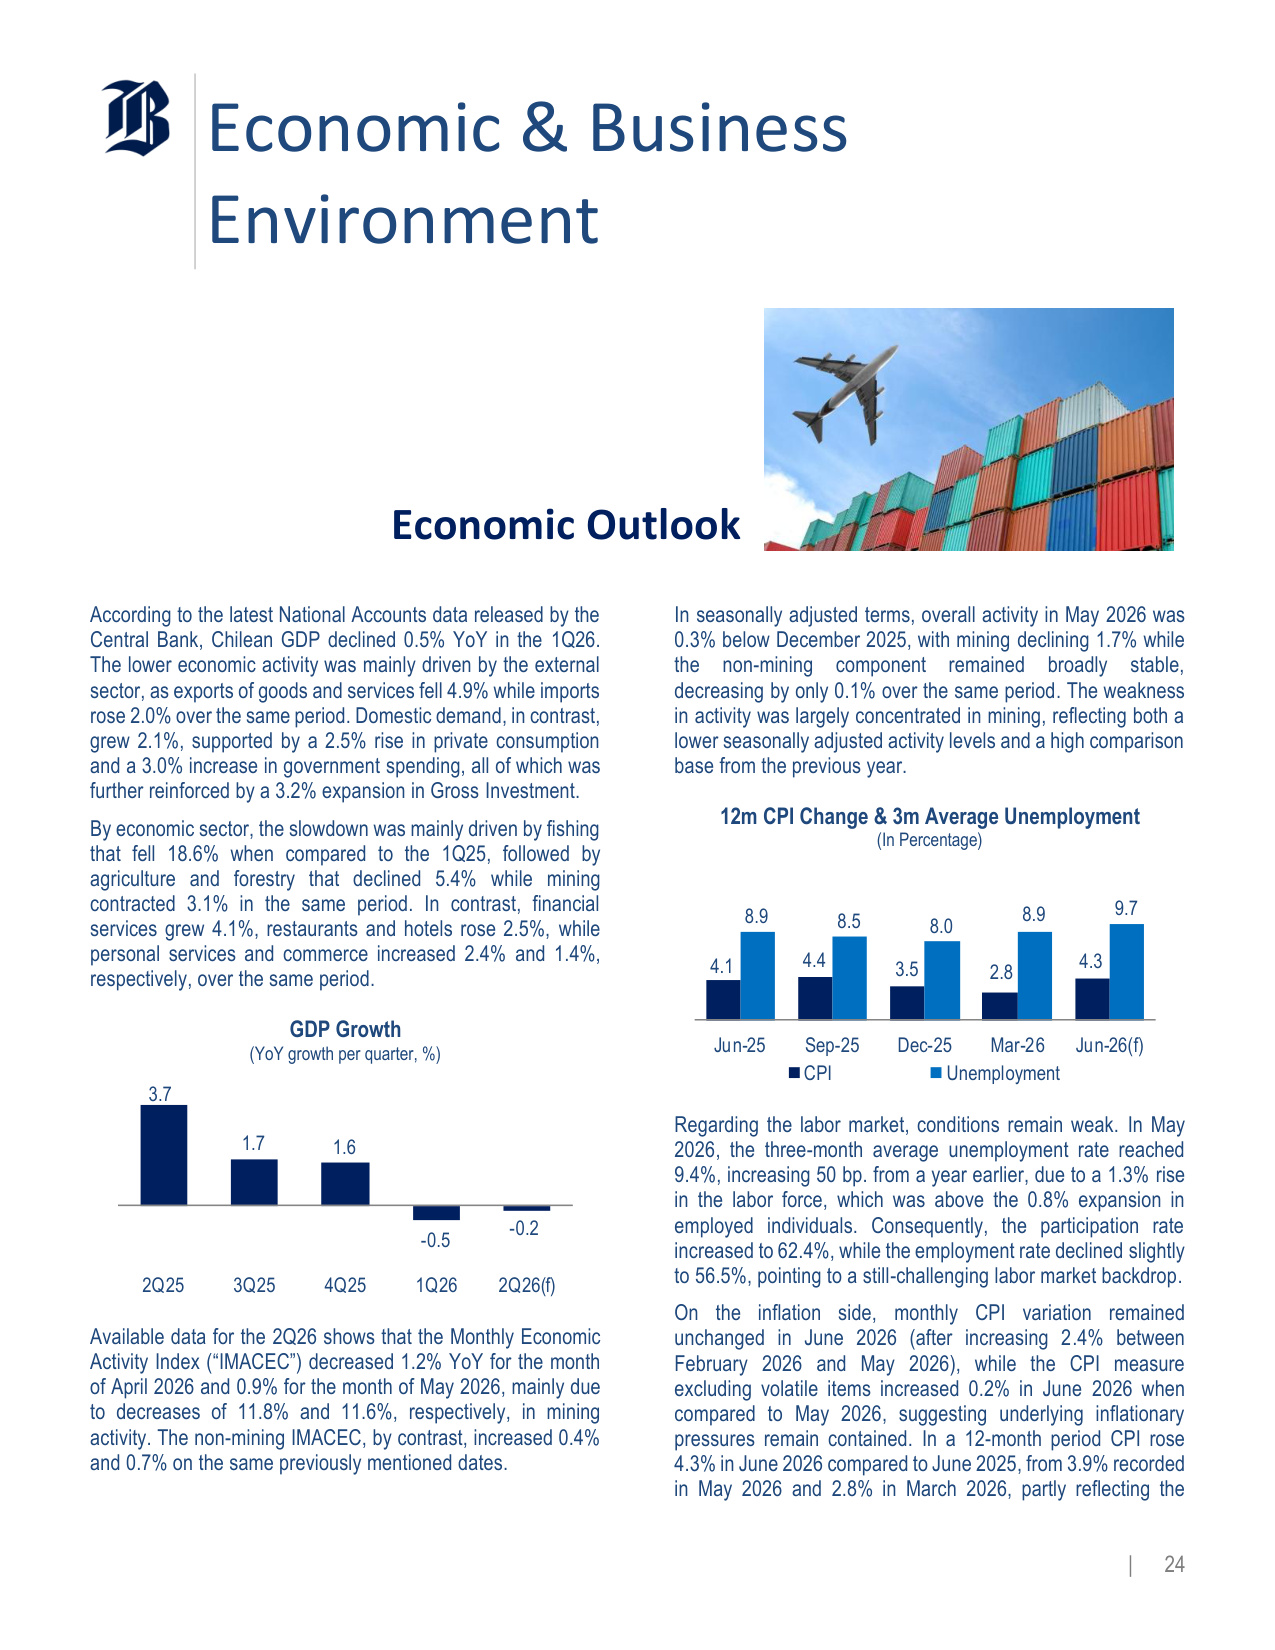
Economic & Business Environment | 24 Economic Outlook According to the latest National Accounts data released by the Central Bank, Chilean GDP declined 0.5% YoY in the 1Q26. The lower economic activity was mainly driven by the external sector, as exports of goods and services fell 4.9% while imports rose 2.0% over the same period. Domestic demand, in contrast, grew 2.1%, supported by a 2.5% rise in private consumption and a 3.0% increase in government spending, all of which was further reinforced by a 3.2% expansion in Gross Investment. By economic sector, the slowdown was mainly driven by fishing that fell 18.6% when compared to the 1Q25, followed by agriculture and forestry that declined 5.4% while mining contracted 3.1% in the same period. In contrast, financial services grew 4.1%, restaurants and hotels rose 2.5%, while personal services and commerce increased 2.4% and 1.4%, respectively, over the same period. GDP Growth (YoY growth per quarter, %) 3.7 1.7 1.6 -0.5 -0.2 2Q25 3Q25 4Q25 1Q26 2Q26(f) Available data for the 2Q26 shows that the Monthly Economic Activity Index ("IMACEC") decreased 1.2% YoY for the month of April 2026 and 0.9% for the month of May 2026, mainly due to decreases of 11.8% and 11.6%, respectively, in mining activity. The non-mining IMACEC, by contrast, increased 0.4% and 0.7% on the same previously mentioned dates. In seasonally adjusted terms, overall activity in May 2026 was 0.3% below December 2025, with mining declining 1.7% while the non-mining component remained broadly stable, decreasing by only 0.1% over the same period. The weakness in activity was largely concentrated in mining, reflecting both a lower seasonally adjusted activity levels and a high comparison base from the previous year. 12m CPI Change & 3m Average Unemployment (In Percentage) 4.1 4.4 3.5 2.8 4.3 8.9 8.5 8.0 8.9 9.7 Jun-25 Sep-25 Dec-25 Mar-26 Jun-26(f) CPI Unemployment Regarding the labor market, conditions remain weak. In May 2026, the three-month average unemployment rate reached 9.4%, increasing 50 bp. from a year earlier, due to a 1.3% rise in the labor force, which was above the 0.8% expansion in employed individuals. Consequently, the participation rate increased to 62.4%, while the employment rate declined slightly to 56.5%, pointing to a still-challenging labor market backdrop. On the inflation side, monthly CPI variation remained unchanged in June 2026 (after increasing 2.4% between February 2026 and May 2026), while the CPI measure excluding volatile items increased 0.2% in June 2026 when compared to May 2026, suggesting underlying inflationary pressures remain contained. In a 12-month period CPI rose 4.3% in June 2026 compared to June 2025, from 3.9% recorded in May 2026 and 2.8% in March 2026, partly reflecting the
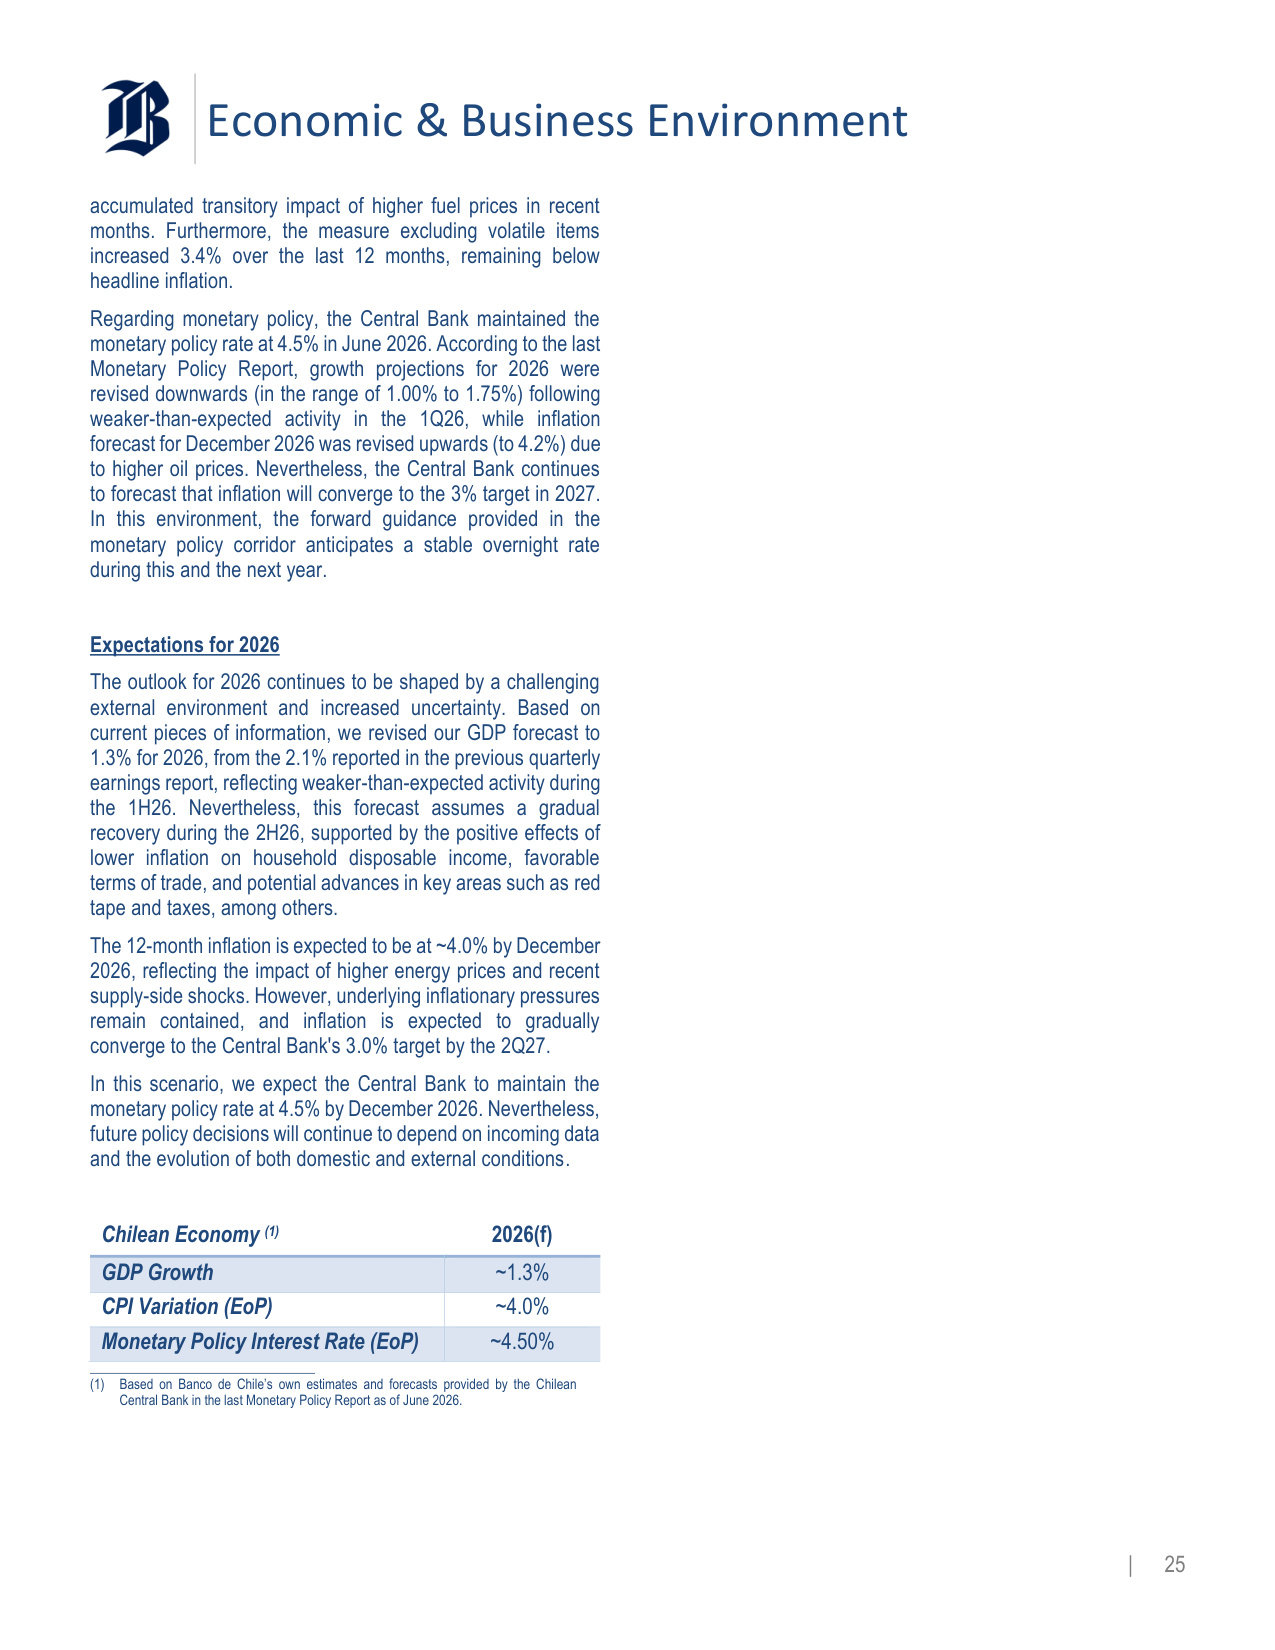
Economic & Business Environment | 25 accumulated transitory impact of higher fuel prices in recent months. Furthermore, the measure excluding volatile items increased 3.4% over the last 12 months, remaining below headline inflation. Regarding monetary policy, the Central Bank maintained the monetary policy rate at 4.5% in June 2026. According to the last Monetary Policy Report, growth projections for 2026 were revised downwards (in the range of 1.00% to 1.75%) following weaker-than-expected activity in the 1Q26, while inflation forecast for December 2026 was revised upwards (to 4.2%) due to higher oil prices. Nevertheless, the Central Bank continues to forecast that inflation will converge to the 3% target in 2027. In this environment, the forward guidance provided in the monetary policy corridor anticipates a stable overnight rate during this and the next year. Expectations for 2026 The outlook for 2026 continues to be shaped by a challenging external environment and increased uncertainty. Based on current pieces of information, we revised our GDP forecast to 1.3% for 2026, from the 2.1% reported in the previous quarterly earnings report, reflecting weaker-than-expected activity during the 1H26. Nevertheless, this forecast assumes a gradual recovery during the 2H26, supported by the positive effects of lower inflation on household disposable income, favorable terms of trade, and potential advances in key areas such as red tape and taxes, among others. The 12-month inflation is expected to be at ~4.0% by December 2026, reflecting the impact of higher energy prices and recent supply-side shocks. However, underlying inflationary pressures remain contained, and inflation is expected to gradually converge to the Central Bank's 3.0% target by the 2Q27. In this scenario, we expect the Central Bank to maintain the monetary policy rate at 4.5% by December 2026. Nevertheless, future policy decisions will continue to depend on incoming data and the evolution of both domestic and external conditions. Chilean Economy (1) 2026(f) GDP Growth ~1.3% CPI Variation (EoP) ~4.0% Monetary Policy Interest Rate (EoP) ~4.50% (1) Based on Banco de Chile's own estimates and forecasts provided by the Chilean Central Bank in the last Monetary Policy Report as of June 2026.
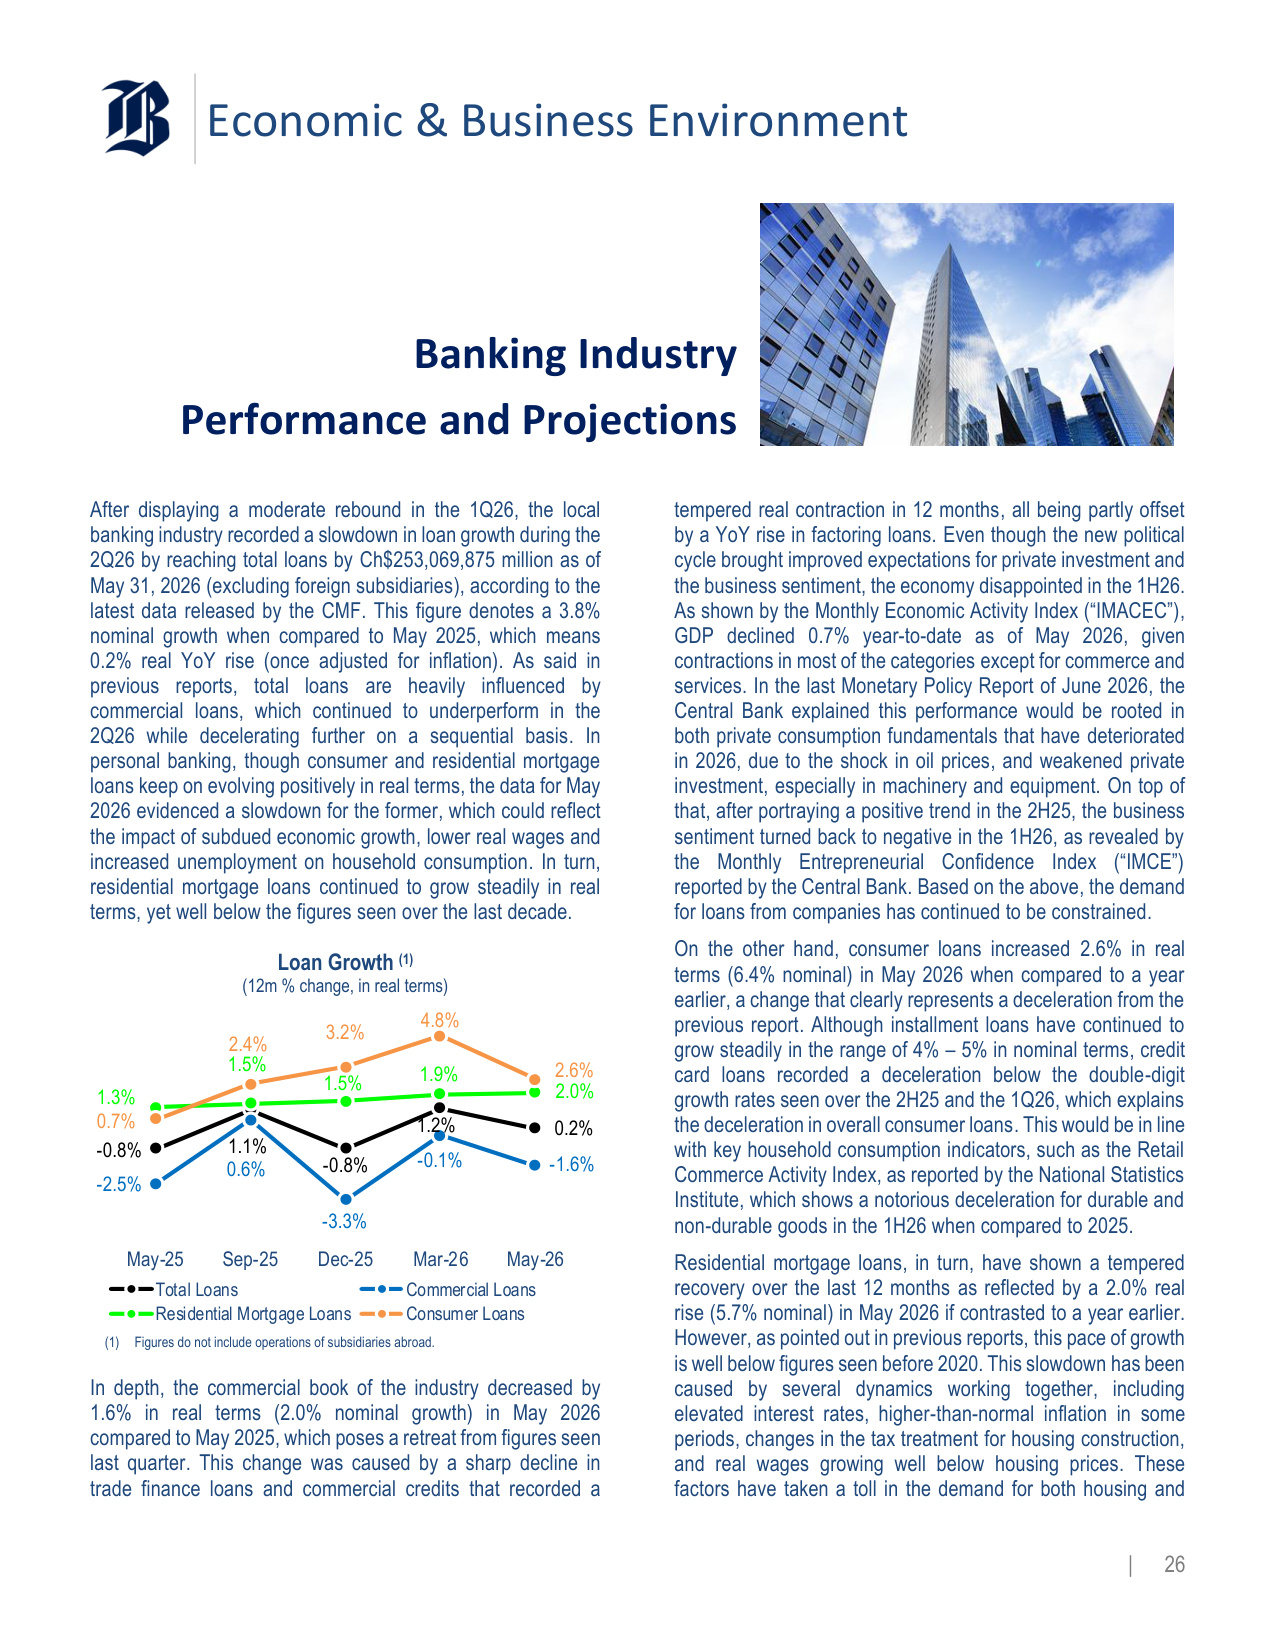
Economic & Business Environment | 26 Banking Industry Performance and Projections After displaying a moderate rebound in the 1Q26, the local banking industry recorded a slowdown in loan growth during the 2Q26 by reaching total loans by Ch$253,069,875 million as of May 31, 2026 (excluding foreign subsidiaries), according to the latest data released by the CMF. This figure denotes a 3.8% nominal growth when compared to May 2025, which means 0.2% real YoY rise (once adjusted for inflation). As said in previous reports, total loans are heavily influenced by commercial loans, which continued to underperform in the 2Q26 while decelerating further on a sequential basis. In personal banking, though consumer and residential mortgage loans keep on evolving positively in real terms, the data for May 2026 evidenced a slowdown for the former, which could reflect the impact of subdued economic growth, lower real wages and increased unemployment on household consumption. In turn, residential mortgage loans continued to grow steadily in real terms, yet well below the figures seen over the last decade. Loan Growth (1) (12m % change, in real terms) -0.8% 1.1% -0.8% 1.2% 0.2% -2.5% 0.6% -3.3% -0.1% -1.6% 1.3% 1.5% 1.5% 1.9% 2.0% 0.7% 2.4% 3.2% 4.8% 2.6% May-25 Sep-25 Dec-25 Mar-26 May-26 Total Loans Commercial Loans Residential Mortgage Loans Consumer Loans (1) Figures do not include operations of subsidiaries abroad. In depth, the commercial book of the industry decreased by 1.6% in real terms (2.0% nominal growth) in May 2026 compared to May 2025, which poses a retreat from figures seen last quarter. This change was caused by a sharp decline in trade finance loans and commercial credits that recorded a tempered real contraction in 12 months, all being partly offset by a YoY rise in factoring loans. Even though the new political cycle brought improved expectations for private investment and the business sentiment, the economy disappointed in the 1H26. As shown by the Monthly Economic Activity Index ("IMACEC"), GDP declined 0.7% year-to-date as of May 2026, given contractions in most of the categories except for commerce and services. In the last Monetary Policy Report of June 2026, the Central Bank explained this performance would be rooted in both private consumption fundamentals that have deteriorated in 2026, due to the shock in oil prices, and weakened private investment, especially in machinery and equipment. On top of that, after portraying a positive trend in the 2H25, the business sentiment turned back to negative in the 1H26, as revealed by the Monthly Entrepreneurial Confidence Index ("IMCE") reported by the Central Bank. Based on the above, the demand for loans from companies has continued to be constrained. On the other hand, consumer loans increased 2.6% in real terms (6.4% nominal) in May 2026 when compared to a year earlier, a change that clearly represents a deceleration from the previous report. Although installment loans have continued to grow steadily in the range of 4% – 5% in nominal terms, credit card loans recorded a deceleration below the double-digit growth rates seen over the 2H25 and the 1Q26, which explains the deceleration in overall consumer loans. This would be in line with key household consumption indicators, such as the Retail Commerce Activity Index, as reported by the National Statistics Institute, which shows a notorious deceleration for durable and non-durable goods in the 1H26 when compared to 2025. Residential mortgage loans, in turn, have shown a tempered recovery over the last 12 months as reflected by a 2.0% real rise (5.7% nominal) in May 2026 if contrasted to a year earlier. However, as pointed out in previous reports, this pace of growth is well below figures seen before 2020. This slowdown has been caused by several dynamics working together, including elevated interest rates, higher-than-normal inflation in some periods, changes in the tax treatment for housing construction, and real wages growing well below housing prices. These factors have taken a toll in the demand for both housing and
Economic & Business Environment | 27 residential mortgage loans, as the financial burden coming from monthly installments of residential mortgage loans has increased significantly for borrowers. Thus, the moderate pickup in the demand for loans over the last 12 months has mainly to do with some initiatives that have reenergized the demand for housing in the margin, particularly for homes below UF4,000 (~USD170,000). However, housing market fundamentals remain subdued, which also have a second- round effect on the financial condition of the construction sector. In terms of funding, Time Deposits continued to be the main financing source for local banks by amounting to Ch$118,486,238 million (excluding foreign subsidiaries) on May 31, 2026. This amount represents a 3.0% nominal increase (0.6% real contraction) when compared to May 2025. Aligned with what we pointed out last quarter; Time Deposits have continued to show a soft landing as the opportunity cost of funds in real terms has declined significantly. For the same reason, Demand Deposits managed by the industry totalled Ch$74,323,000 million (excluding foreign subsidiaries) as of the same date, indicating a 7.5% nominal growth (3.8% real) in relation to May 2025 fostered by higher preference for liquidity by customers across the board. As a result, the reciprocity ratio of Demand Deposits to Total Loans for the industry stood at 29.4% in May 2026, well above the ~25.0% levels seen before 2020. Based on these trends and the moderate expansion of the lending business, the need for long-term financing has decreased. Thus, the Debt Issued by the industry (including regulatory capital instruments) reached Ch$73,843,687 million in May 2026, which is only 0.4% above the level recorded a year earlier in nominal terms (3.1% real contraction). In regard to earnings, the industry achieved a bottom line of Ch$2,760,707 million in the five-month period ended May 31, 2026. This amount represents a YoY rise of Ch$341,442 or 14.1% when compared to the same period of 2025, which was mainly driven by the positive impact of the temporary pickup in inflation on revenues. In this regard, the top line recorded by the industry surged Ch$594,764 million or 8.0% YoY in nominal terms, mainly due to the positive effect of higher inflation on the CLF-indexed asset positions held by local banks, improved interest margin and, to a lesser degree, greater income from treasury activities, increased net fee income and other operating income. This positive effect was in part offset by: (i) credit loss expenses that rose Ch$123,791 million or 10.0%, mostly due to a net YoY rise in additional provisions that was partly offset by a better performance in specific provisions, (ii) higher income tax by Ch$81,954 million or 15.6%, explained by a couple of players with operations overseas, and (iii) a YoY increase of Ch$47,576 million or 1.5% in operating expenses, primarily explained by greater personnel expenses due to inflation indexation. Expectations for 2026 Aligned with revised expectations for the local economy, we have slightly modified our baseline scenario for the local banking industry. Regarding loan growth, since GDP growth has been revised down from 2.1% (last quarter) to 1.3% and we have cut our own inflation estimate for December 2026 from 4.3% (last quarter) to 4.0%, we now expect industry's total loans to grow ~4.0% in nominal terms by December 2026 (from ~4.5% nominal growth forecasted last quarter). Although we continue to see a more positive business sentiment given a new political cycle, the conflict in the Strait of Hormuz, together with pending economic reforms, has certainly taken a toll on local economic activity during the 1H26, from which the Central Bank is also forecasting a more moderate expansion of private investment and household spending compared to previous quarters. In terms of funding, we expect Demand Deposits to maintain a reciprocity ratio over total loans ranging from 28% to 30%, while the use of Time Deposits and Debt Issued by banks will depend on funding needs and the management of liquidity and interest rate risk in the banking book. In regard to net income, as we have slightly revised our own forecast for inflation down to 4.0% for December 2026 (from 4.3% last quarter) and the Central Bank is likely to keep the monetary policy interest rate at 4.5%, as we anticipated las quarter, we are maintaining our estimate for industry's NIM in the range of 3.6% to 3.8%. In terms of credit risk expenses, if economic activity gains some momentum in the 2H26 as expected, we believe that delinquency would stay in the range of 2.3% to 2.4% and credit loss expenses in the range of 1.2% to 1.3% as a percentage of average loans, excluding additional provisions, for 2026. Notwithstanding the above, we will closely monitor the aftermath of the conflict in the Strait of Hormuz in the coming quarters to adjust our forecast, if necessary. Banking Industry (1) FY2026 Nominal Loan Growth ~4.0% DDA / Total Loans 28% – 30% Net Interest Margin 3.6% – 3.8% CLE / Avg. Loans 1.2% – 1.3% Past-Due Loans (>90d) 2.3% – 2.4% (1) Based on Banco de Chile's own estimates.
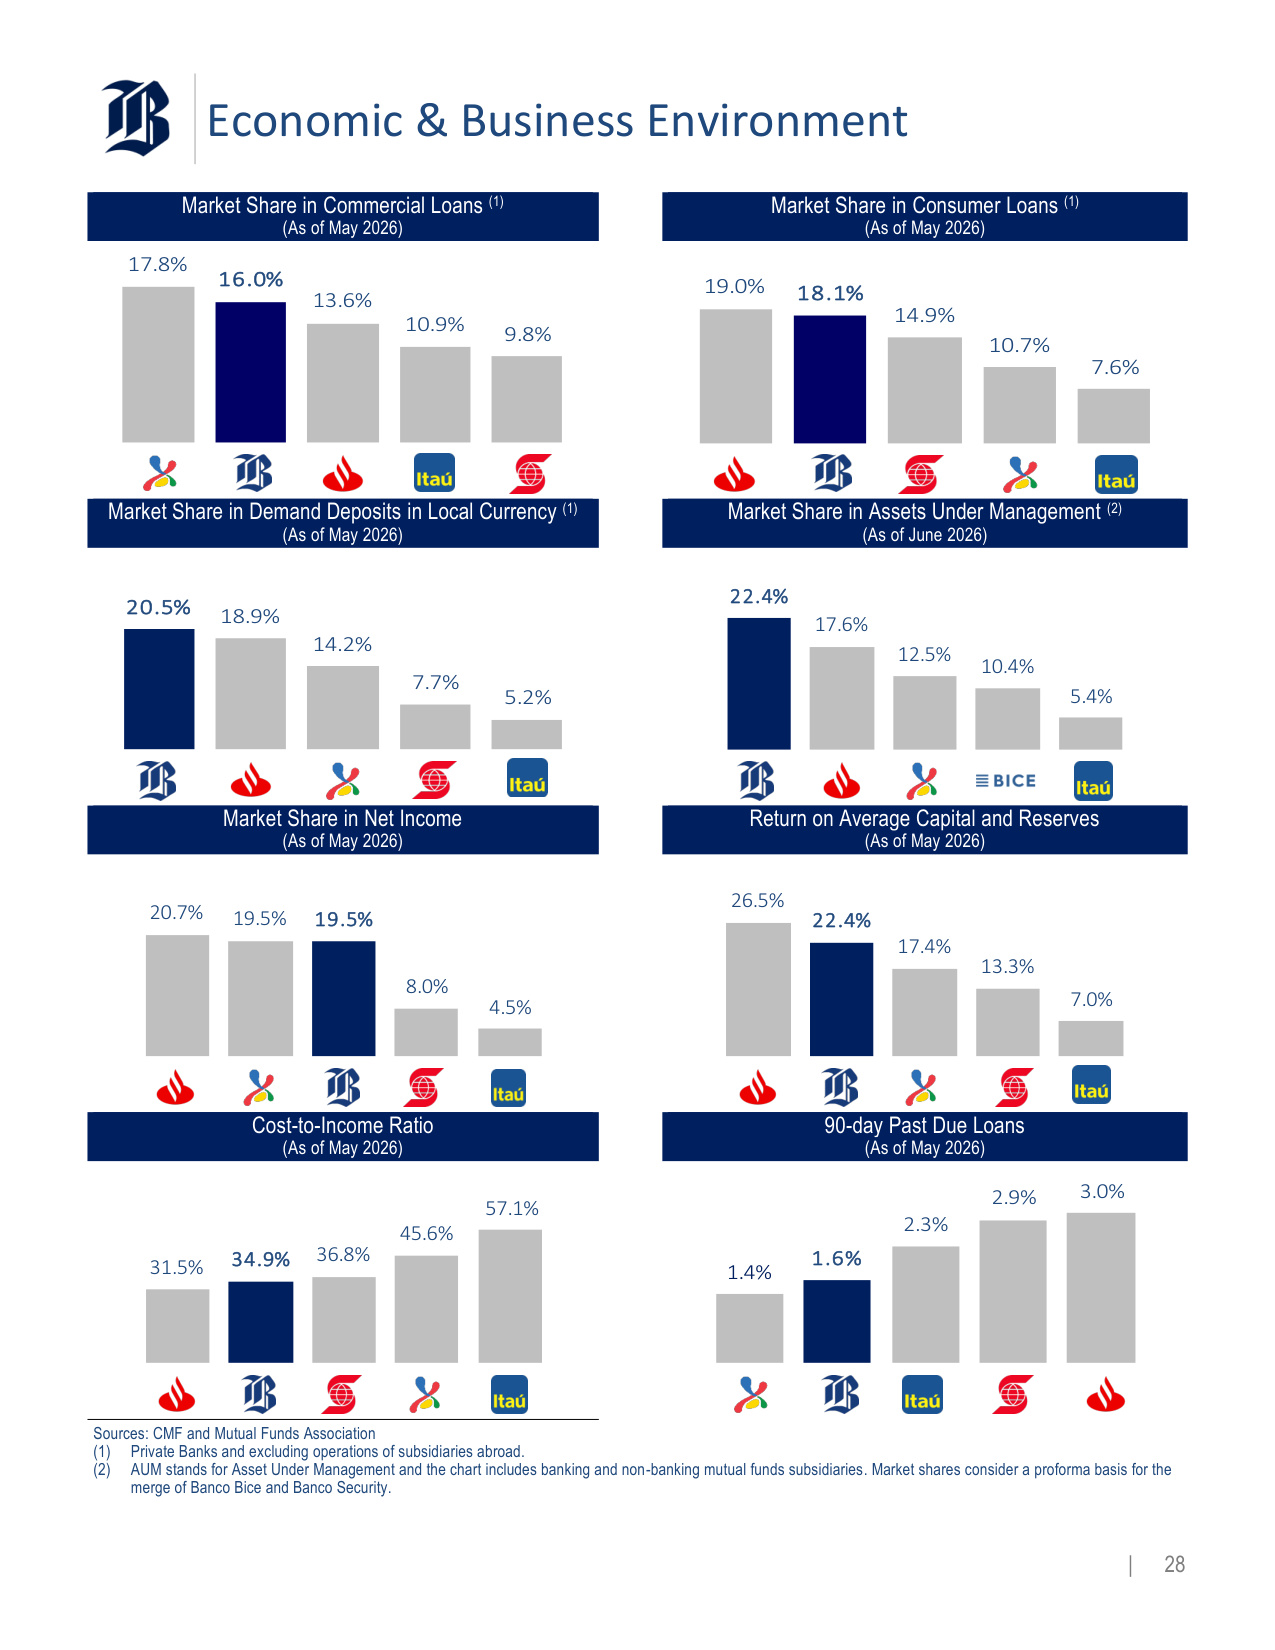
Economic & Business Environment | 28 Market Share in Commercial Loans (1) (As of May 2026) Market Share in Consumer Loans (1) (As of May 2026) 17.8% 16.0% 13.6% 10.9% 9.8% 19.0% 18.1% 14.9% 10.7% 7.6% Market Share in Demand Deposits in Local Currency (1) (As of May 2026) Market Share in Assets Under Management (2) (As of June 2026) 20.5% 18.9% 14.2% 7.7% 5.2% 22.4% 17.6% 12.5% 10.4% 5.4% Market Share in Net Income (As of May 2026) Return on Average Capital and Reserves (As of May 2026) 20.7% 19.5% 19.5% 8.0% 4.5% 26.5% 22.4% 17.4% 13.3% 7.0% Cost-to-Income Ratio (As of May 2026) 90-day Past Due Loans (As of May 2026) 31.5% 34.9% 36.8% 45.6% 57.1% 1.4% 1.6% 2.3% 2.9% 3.0% Sources: CMF and Mutual Funds Association (1) Private Banks and excluding operations of subsidiaries abroad. (2) AUM stands for Asset Under Management and the chart includes banking and non-banking mutual funds subsidiaries. Market shares consider a proforma basis for the merge of Banco Bice and Banco Security.
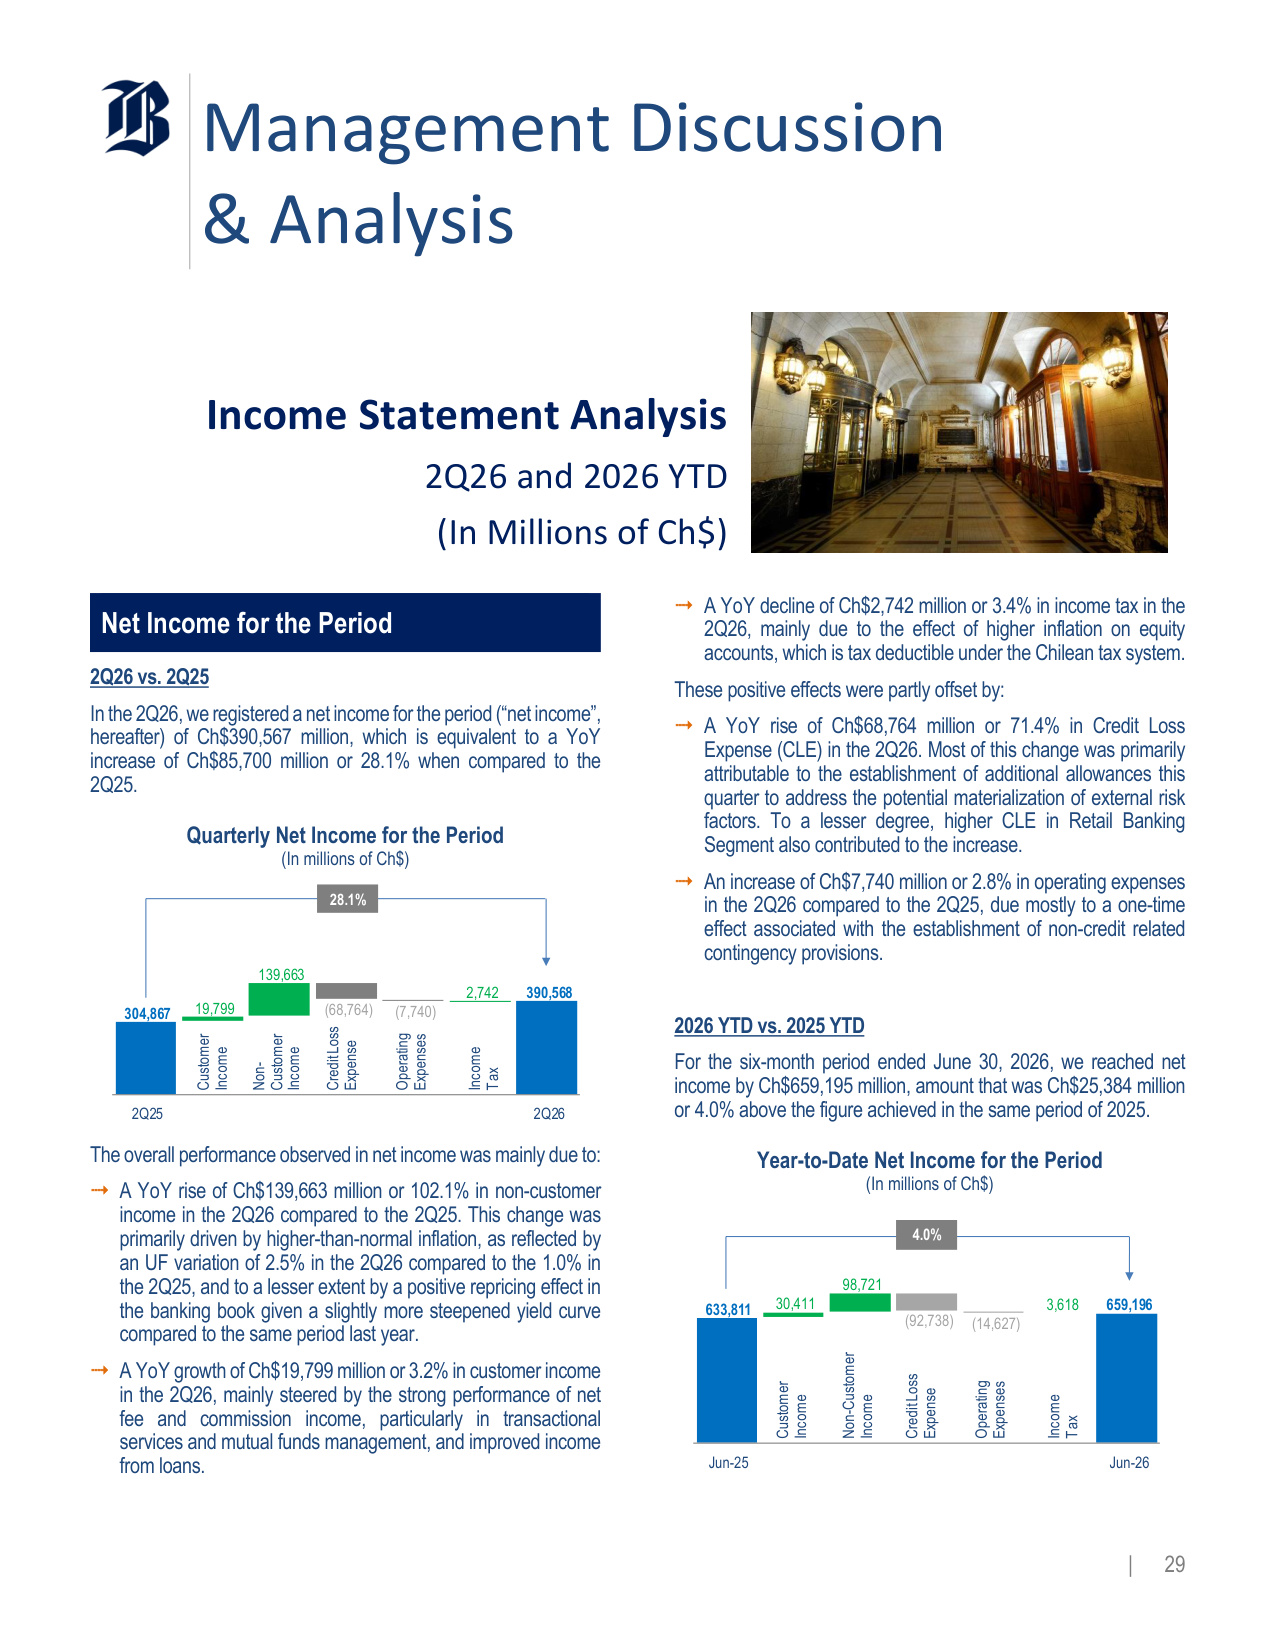
Management Discussion & Analysis | 29 Income Statement Analysis 2Q26 and 2026 YTD (In Millions of Ch$) Net Income for the Period 2Q26 vs. 2Q25 In the 2Q26, we registered a net income for the period ("net income", hereafter) of Ch$390,567 million, which is equivalent to a YoY increase of Ch$85,700 million or 28.1% when compared to the 2Q25. Quarterly Net Income for the Period (In millions of Ch$) 304,867 19,799 139,663 (68,764) (7,740) 2,742 390,568 2Q25 2Q26 28.1% Non- Customer Income Income Tax Customer Income Credit Loss Expense Operating Expenses The overall performance observed in net income was mainly due to: A YoY rise of Ch$139,663 million or 102.1% in non-customer income in the 2Q26 compared to the 2Q25. This change was primarily driven by higher-than-normal inflation, as reflected by an UF variation of 2.5% in the 2Q26 compared to the 1.0% in the 2Q25, and to a lesser extent by a positive repricing effect in the banking book given a slightly more steepened yield curve compared to the same period last year. A YoY growth of Ch$19,799 million or 3.2% in customer income in the 2Q26, mainly steered by the strong performance of net fee and commission income, particularly in transactional services and mutual funds management, and improved income from loans. A YoY decline of Ch$2,742 million or 3.4% in income tax in the 2Q26, mainly due to the effect of higher inflation on equity accounts, which is tax deductible under the Chilean tax system. These positive effects were partly offset by: A YoY rise of Ch$68,764 million or 71.4% in Credit Loss Expense (CLE) in the 2Q26. Most of this change was primarily attributable to the establishment of additional allowances this quarter to address the potential materialization of external risk factors. To a lesser degree, higher CLE in Retail Banking Segment also contributed to the increase. An increase of Ch$7,740 million or 2.8% in operating expenses in the 2Q26 compared to the 2Q25, due mostly to a one-time effect associated with the establishment of non-credit related contingency provisions. 2026 YTD vs. 2025 YTD For the six-month period ended June 30, 2026, we reached net income by Ch$659,195 million, amount that was Ch$25,384 million or 4.0% above the figure achieved in the same period of 2025. Year-to-Date Net Income for the Period (In millions of Ch$) 633,811 30,411 98,721 (92,738) (14,627) 3,618 659,196 Jun-25 Jun-26 4.0% Non-Customer Income Income Tax Customer Income Credit Loss Expense Operating Expenses
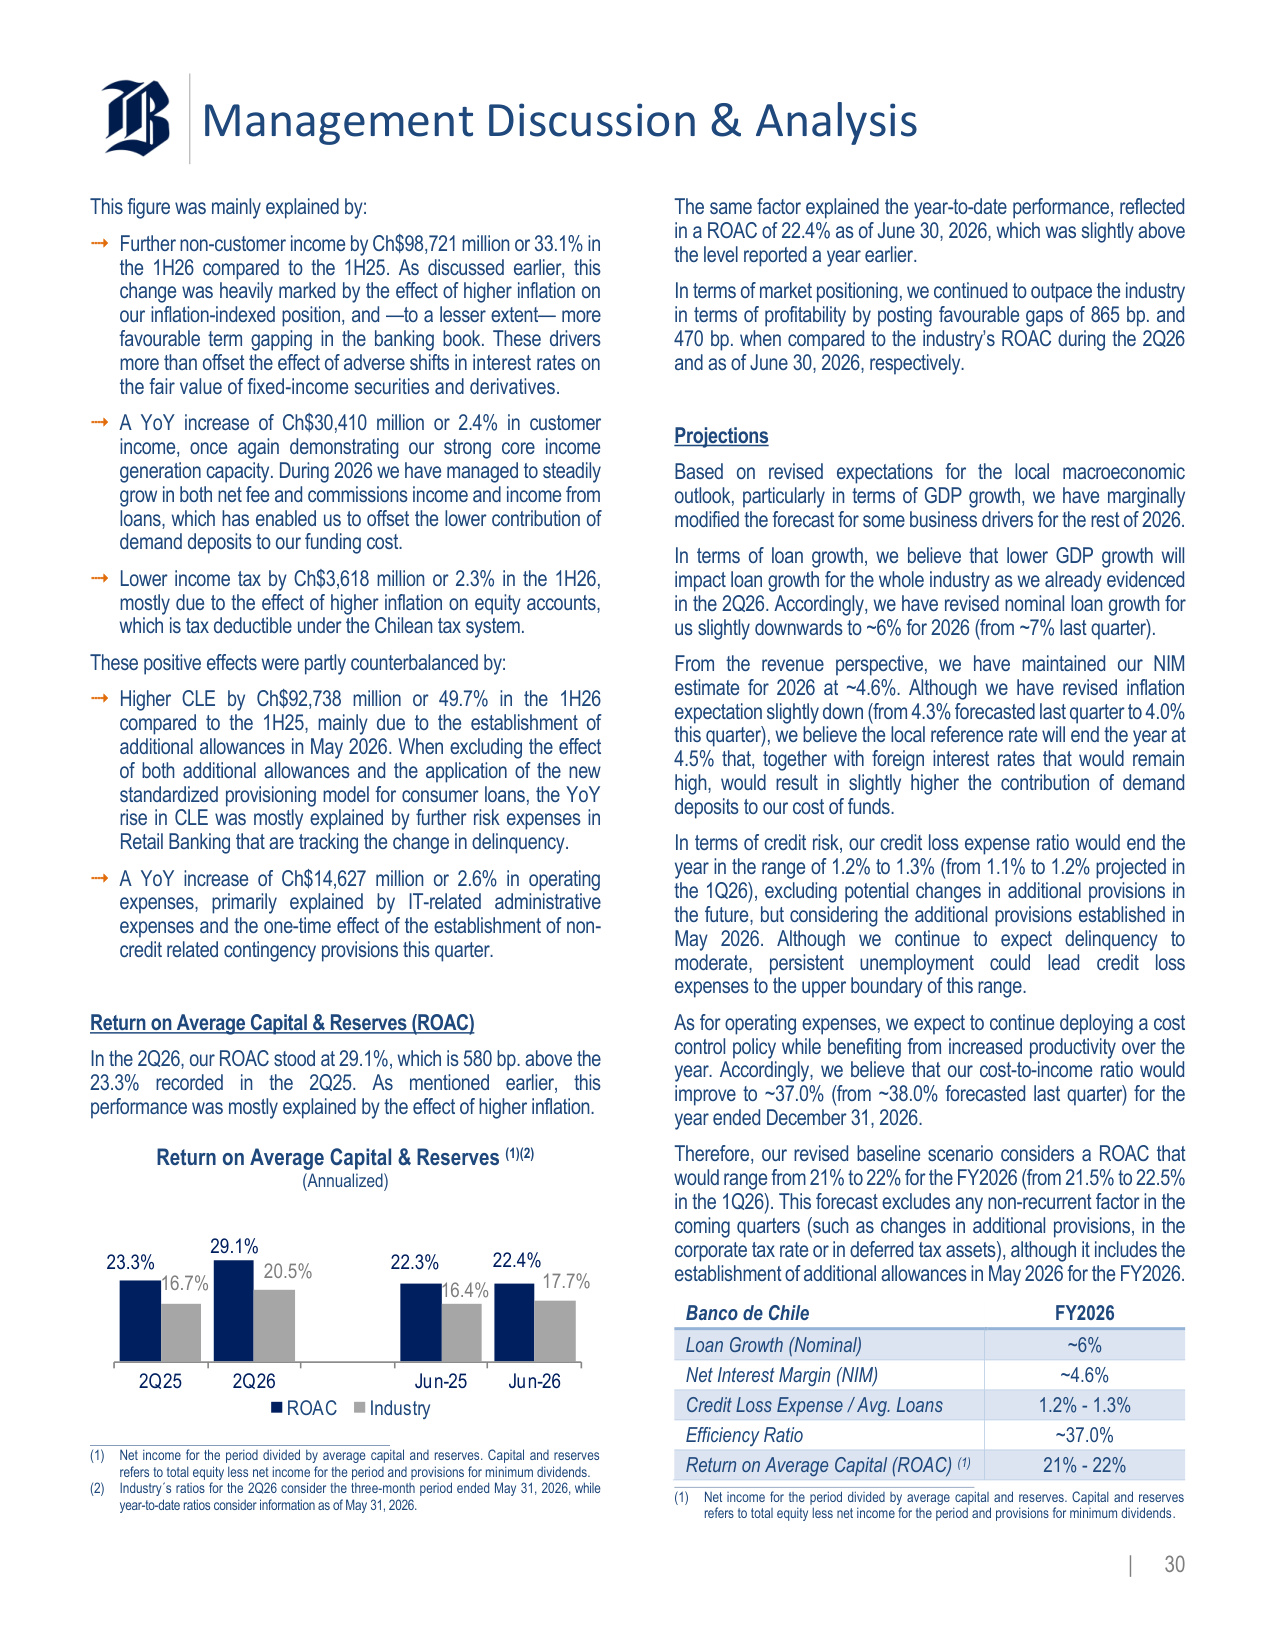
Management Discussion & Analysis | 30 This figure was mainly explained by: Further non-customer income by Ch$98,721 million or 33.1% in the 1H26 compared to the 1H25. As discussed earlier, this change was heavily marked by the effect of higher inflation on our inflation-indexed position, and —to a lesser extent— more favourable term gapping in the banking book. These drivers more than offset the effect of adverse shifts in interest rates on the fair value of fixed-income securities and derivatives. A YoY increase of Ch$30,410 million or 2.4% in customer income, once again demonstrating our strong core income generation capacity. During 2026 we have managed to steadily grow in both net fee and commissions income and income from loans, which has enabled us to offset the lower contribution of demand deposits to our funding cost. Lower income tax by Ch$3,618 million or 2.3% in the 1H26, mostly due to the effect of higher inflation on equity accounts, which is tax deductible under the Chilean tax system. These positive effects were partly counterbalanced by: Higher CLE by Ch$92,738 million or 49.7% in the 1H26 compared to the 1H25, mainly due to the establishment of additional allowances in May 2026. When excluding the effect of both additional allowances and the application of the new standardized provisioning model for consumer loans, the YoY rise in CLE was mostly explained by further risk expenses in Retail Banking that are tracking the change in delinquency. A YoY increase of Ch$14,627 million or 2.6% in operating expenses, primarily explained by IT-related administrative expenses and the one-time effect of the establishment of non- credit related contingency provisions this quarter. Return on Average Capital & Reserves (ROAC) In the 2Q26, our ROAC stood at 29.1%, which is 580 bp. above the 23.3% recorded in the 2Q25. As mentioned earlier, this performance was mostly explained by the effect of higher inflation. Return on Average Capital & Reserves (1)(2) (Annualized) 23.3% 29.1% 22.3% 22.4% 16.7% 20.5% 16.4% 17.7% 2Q25 2Q26 Jun-25 Jun-26 ROAC Industry (1) Net income for the period divided by average capital and reserves. Capital and reserves refers to total equity less net income for the period and provisions for minimum dividends. (2) Industry´s ratios for the 2Q26 consider the three-month period ended May 31, 2026, while year-to-date ratios consider information as of May 31, 2026. The same factor explained the year-to-date performance, reflected in a ROAC of 22.4% as of June 30, 2026, which was slightly above the level reported a year earlier. In terms of market positioning, we continued to outpace the industry in terms of profitability by posting favourable gaps of 865 bp. and 470 bp. when compared to the industry's ROAC during the 2Q26 and as of June 30, 2026, respectively. Projections Based on revised expectations for the local macroeconomic outlook, particularly in terms of GDP growth, we have marginally modified the forecast for some business drivers for the rest of 2026. In terms of loan growth, we believe that lower GDP growth will impact loan growth for the whole industry as we already evidenced in the 2Q26. Accordingly, we have revised nominal loan growth for us slightly downwards to ~6% for 2026 (from ~7% last quarter). From the revenue perspective, we have maintained our NIM estimate for 2026 at ~4.6%. Although we have revised inflation expectation slightly down (from 4.3% forecasted last quarter to 4.0% this quarter), we believe the local reference rate will end the year at 4.5% that, together with foreign interest rates that would remain high, would result in slightly higher the contribution of demand deposits to our cost of funds. In terms of credit risk, our credit loss expense ratio would end the year in the range of 1.2% to 1.3% (from 1.1% to 1.2% projected in the 1Q26), excluding potential changes in additional provisions in the future, but considering the additional provisions established in May 2026. Although we continue to expect delinquency to moderate, persistent unemployment could lead credit loss expenses to the upper boundary of this range. As for operating expenses, we expect to continue deploying a cost control policy while benefiting from increased productivity over the year. Accordingly, we believe that our cost-to-income ratio would improve to ~37.0% (from ~38.0% forecasted last quarter) for the year ended December 31, 2026. Therefore, our revised baseline scenario considers a ROAC that would range from 21% to 22% for the FY2026 (from 21.5% to 22.5% in the 1Q26). This forecast excludes any non-recurrent factor in the coming quarters (such as changes in additional provisions, in the corporate tax rate or in deferred tax assets), although it includes the establishment of additional allowances in May 2026 for the FY2026. Banco de Chile FY2026 Loan Growth (Nominal) ~6% Net Interest Margin (NIM) ~4.6% Credit Loss Expense / Avg. Loans 1.2% - 1.3% Efficiency Ratio ~37.0% Return on Average Capital (ROAC) (1) 21% - 22% (1) Net income for the period divided by average capital and reserves. Capital and reserves refers to total equity less net income for the period and provisions for minimum dividends.
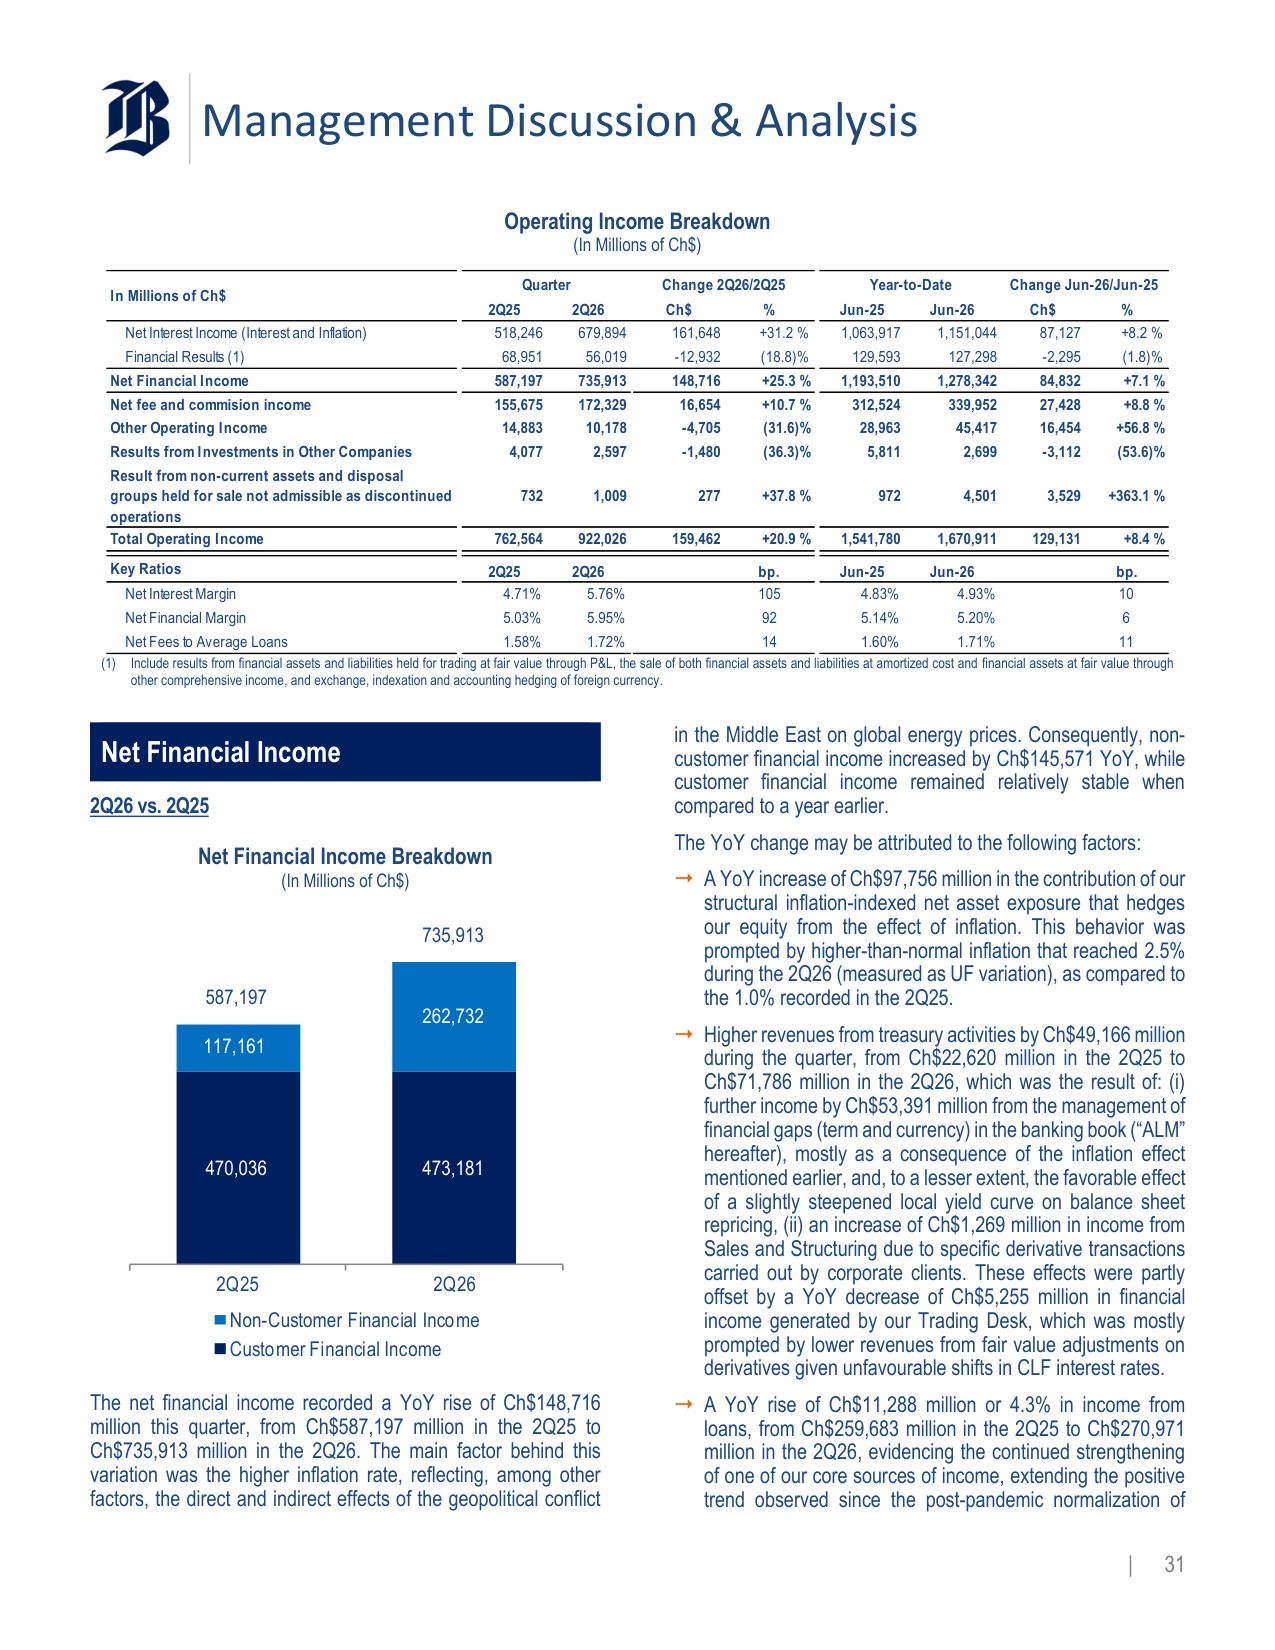
Management Discussion & Analysis | 31 Operating Income Breakdown (In Millions of Ch$) 2Q25 2Q26 Ch$ % Jun-25 Jun-26 Ch$ % Net Interest Income (Interest and Inflation) 518,246 679,894 161,648 +31.2 % 1,063,917 1,151,044 87,127 +8.2 % Financial Results (1) 68,951 56,019 -12,932 (18.8)% 129,593 127,298 -2,295 (1.8)% Net Financial Income 587,197 735,913 148,716 +25.3 % 1,193,510 1,278,342 84,832 +7.1 % Net fee and commision income 155,675 172,329 16,654 +10.7 % 312,524 339,952 27,428 +8.8 % Other Operating Income 14,883 10,178 -4,705 (31.6)% 28,963 45,417 16,454 +56.8 % Results from Investments in Other Companies 4,077 2,597 -1,480 (36.3)% 5,811 2,699 -3,112 (53.6)% Result from non-current assets and disposal groups held for sale not admissible as discontinued operations 732 1,009 277 +37.8 % 972 4,501 3,529 +363.1 % Total Operating Income 762,564 922,026 159,462 +20.9 % 1,541,780 1,670,911 129,131 +8.4 % Key Ratios 2Q25 2Q26 bp. Jun-25 Jun-26 bp. Net Interest Margin 4.71% 5.76% 105 4.83% 4.93% 10 Net Financial Margin 5.03% 5.95% 92 5.14% 5.20% 6 Net Fees to Average Loans 1.58% 1.72% 14 1.60% 1.71% 11 Change Jun-26/Jun-25 In Millions of Ch$ Change 2Q26/2Q25 Year-to-Date Quarter (1) Include results from financial assets and liabilities held for trading at fair value through P&L, the sale of both financial assets and liabilities at amortized cost and financial assets at fair value through other comprehensive income, and exchange, indexation and accounting hedging of foreign currency. Net Financial Income 2Q26 vs. 2Q25 Net Financial Income Breakdown (In Millions of Ch$) 470,036 473,181 117,161 262,732 587,197 735,913 2Q25 2Q26 Non-Customer Financial Income Customer Financial Income The net financial income recorded a YoY rise of Ch$148,716 million this quarter, from Ch$587,197 million in the 2Q25 to Ch$735,913 million in the 2Q26. The main factor behind this variation was the higher inflation rate, reflecting, among other factors, the direct and indirect effects of the geopolitical conflict in the Middle East on global energy prices. Consequently, non- customer financial income increased by Ch$145,571 YoY, while customer financial income remained relatively stable when compared to a year earlier. The YoY change may be attributed to the following factors: A YoY increase of Ch$97,756 million in the contribution of our structural inflation-indexed net asset exposure that hedges our equity from the effect of inflation. This behavior was prompted by higher-than-normal inflation that reached 2.5% during the 2Q26 (measured as UF variation), as compared to the 1.0% recorded in the 2Q25. Higher revenues from treasury activities by Ch$49,166 million during the quarter, from Ch$22,620 million in the 2Q25 to Ch$71,786 million in the 2Q26, which was the result of: (i) further income by Ch$53,391 million from the management of financial gaps (term and currency) in the banking book ("ALM" hereafter), mostly as a consequence of the inflation effect mentioned earlier, and, to a lesser extent, the favorable effect of a slightly steepened local yield curve on balance sheet repricing, (ii) an increase of Ch$1,269 million in income from Sales and Structuring due to specific derivative transactions carried out by corporate clients. These effects were partly offset by a YoY decrease of Ch$5,255 million in financial income generated by our Trading Desk, which was mostly prompted by lower revenues from fair value adjustments on derivatives given unfavourable shifts in CLF interest rates. A YoY rise of Ch$11,288 million or 4.3% in income from loans, from Ch$259,683 million in the 2Q25 to Ch$270,971 million in the 2Q26, evidencing the continued strengthening of one of our core sources of income, extending the positive trend observed since the post-pandemic normalization of
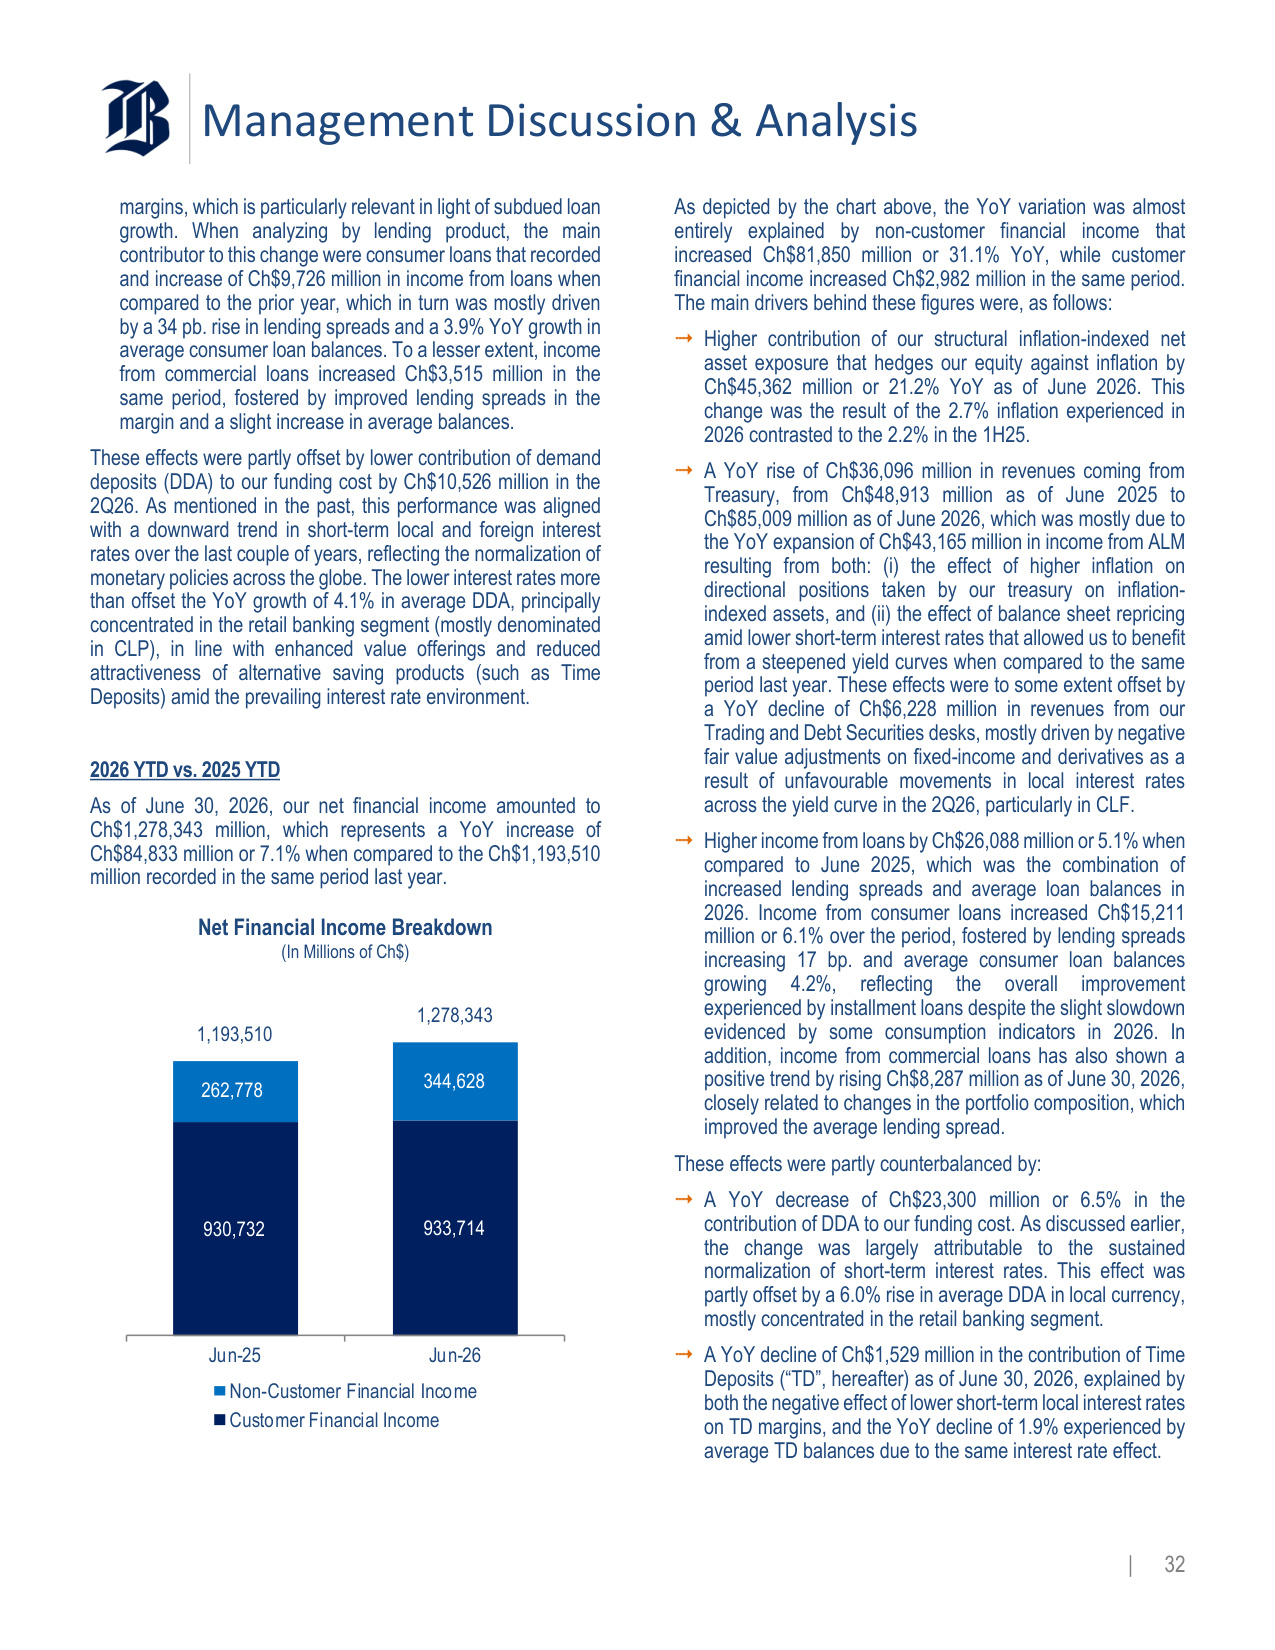
Management Discussion & Analysis | 32 margins, which is particularly relevant in light of subdued loan growth. When analyzing by lending product, the main contributor to this change were consumer loans that recorded and increase of Ch$9,726 million in income from loans when compared to the prior year, which in turn was mostly driven by a 34 pb. rise in lending spreads and a 3.9% YoY growth in average consumer loan balances. To a lesser extent, income from commercial loans increased Ch$3,515 million in the same period, fostered by improved lending spreads in the margin and a slight increase in average balances. These effects were partly offset by lower contribution of demand deposits (DDA) to our funding cost by Ch$10,526 million in the 2Q26. As mentioned in the past, this performance was aligned with a downward trend in short-term local and foreign interest rates over the last couple of years, reflecting the normalization of monetary policies across the globe. The lower interest rates more than offset the YoY growth of 4.1% in average DDA, principally concentrated in the retail banking segment (mostly denominated in CLP), in line with enhanced value offerings and reduced attractiveness of alternative saving products (such as Time Deposits) amid the prevailing interest rate environment. 2026 YTD vs. 2025 YTD As of June 30, 2026, our net financial income amounted to Ch$1,278,343 million, which represents a YoY increase of Ch$84,833 million or 7.1% when compared to the Ch$1,193,510 million recorded in the same period last year. Net Financial Income Breakdown (In Millions of Ch$) 930,732 933,714 262,778 344,628 1,193,510 1,278,343 Jun-25 Jun-26 Non-Customer Financial Income Customer Financial Income As depicted by the chart above, the YoY variation was almost entirely explained by non-customer financial income that increased Ch$81,850 million or 31.1% YoY, while customer financial income increased Ch$2,982 million in the same period. The main drivers behind these figures were, as follows: Higher contribution of our structural inflation-indexed net asset exposure that hedges our equity against inflation by Ch$45,362 million or 21.2% YoY as of June 2026. This change was the result of the 2.7% inflation experienced in 2026 contrasted to the 2.2% in the 1H25. A YoY rise of Ch$36,096 million in revenues coming from Treasury, from Ch$48,913 million as of June 2025 to Ch$85,009 million as of June 2026, which was mostly due to the YoY expansion of Ch$43,165 million in income from ALM resulting from both: (i) the effect of higher inflation on directional positions taken by our treasury on inflation- indexed assets, and (ii) the effect of balance sheet repricing amid lower short-term interest rates that allowed us to benefit from a steepened yield curves when compared to the same period last year. These effects were to some extent offset by a YoY decline of Ch$6,228 million in revenues from our Trading and Debt Securities desks, mostly driven by negative fair value adjustments on fixed-income and derivatives as a result of unfavourable movements in local interest rates across the yield curve in the 2Q26, particularly in CLF. Higher income from loans by Ch$26,088 million or 5.1% when compared to June 2025, which was the combination of increased lending spreads and average loan balances in 2026. Income from consumer loans increased Ch$15,211 million or 6.1% over the period, fostered by lending spreads increasing 17 bp. and average consumer loan balances growing 4.2%, reflecting the overall improvement experienced by installment loans despite the slight slowdown evidenced by some consumption indicators in 2026. In addition, income from commercial loans has also shown a positive trend by rising Ch$8,287 million as of June 30, 2026, closely related to changes in the portfolio composition, which improved the average lending spread. These effects were partly counterbalanced by: A YoY decrease of Ch$23,300 million or 6.5% in the contribution of DDA to our funding cost. As discussed earlier, the change was largely attributable to the sustained normalization of short-term interest rates. This effect was partly offset by a 6.0% rise in average DDA in local currency, mostly concentrated in the retail banking segment. A YoY decline of Ch$1,529 million in the contribution of Time Deposits ("TD", hereafter) as of June 30, 2026, explained by both the negative effect of lower short-term local interest rates on TD margins, and the YoY decline of 1.9% experienced by average TD balances due to the same interest rate effect.
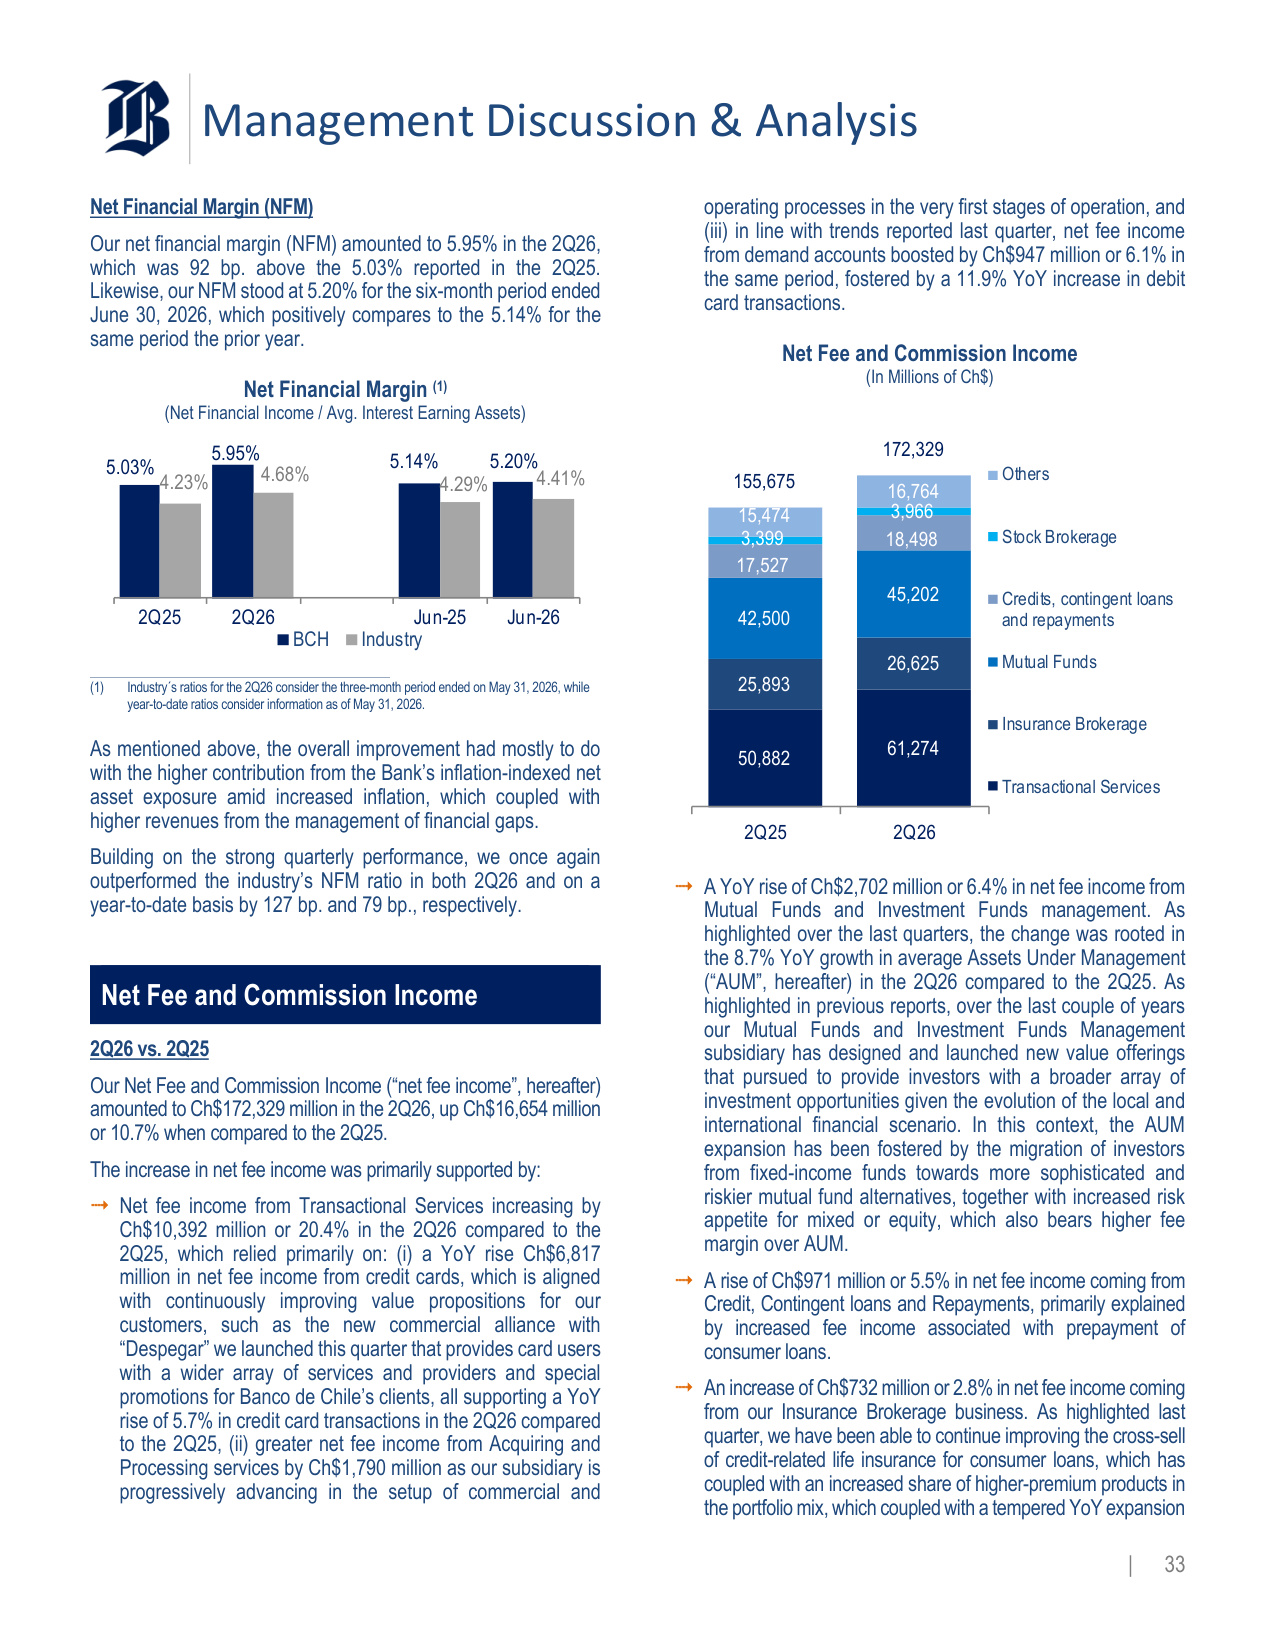
Management Discussion & Analysis | 33 Net Financial Margin (NFM) Our net financial margin (NFM) amounted to 5.95% in the 2Q26, which was 92 bp. above the 5.03% reported in the 2Q25. Likewise, our NFM stood at 5.20% for the six-month period ended June 30, 2026, which positively compares to the 5.14% for the same period the prior year. Net Financial Margin (1) (Net Financial Income / Avg. Interest Earning Assets) 5.03% 5.95% 5.14% 5.20% 4.23% 4.68% 4.29% 4.41% 2Q25 2Q26 Jun-25 Jun-26 BCH Industry (1) Industry´s ratios for the 2Q26 consider the three-month period ended on May 31, 2026, while year-to-date ratios consider information as of May 31, 2026. As mentioned above, the overall improvement had mostly to do with the higher contribution from the Bank's inflation-indexed net asset exposure amid increased inflation, which coupled with higher revenues from the management of financial gaps. Building on the strong quarterly performance, we once again outperformed the industry's NFM ratio in both 2Q26 and on a year-to-date basis by 127 bp. and 79 bp., respectively. Net Fee and Commission Income 2Q26 vs. 2Q25 Our Net Fee and Commission Income ("net fee income", hereafter) amounted to Ch$172,329 million in the 2Q26, up Ch$16,654 million or 10.7% when compared to the 2Q25. The increase in net fee income was primarily supported by: Net fee income from Transactional Services increasing by Ch$10,392 million or 20.4% in the 2Q26 compared to the 2Q25, which relied primarily on: (i) a YoY rise Ch$6,817 million in net fee income from credit cards, which is aligned with continuously improving value propositions for our customers, such as the new commercial alliance with "Despegar" we launched this quarter that provides card users with a wider array of services and providers and special promotions for Banco de Chile's clients, all supporting a YoY rise of 5.7% in credit card transactions in the 2Q26 compared to the 2Q25, (ii) greater net fee income from Acquiring and Processing services by Ch$1,790 million as our subsidiary is progressively advancing in the setup of commercial and operating processes in the very first stages of operation, and (iii) in line with trends reported last quarter, net fee income from demand accounts boosted by Ch$947 million or 6.1% in the same period, fostered by a 11.9% YoY increase in debit card transactions. Net Fee and Commission Income (In Millions of Ch$) 50,882 61,274 25,893 26,625 42,500 45,202 17,527 18,498 3,399 3,966 15,474 16,764 155,675 172,329 2Q25 2Q26 Others Stock Brokerage Credits, contingent loans and repayments Mutual Funds Insurance Brokerage Transactional Services A YoY rise of Ch$2,702 million or 6.4% in net fee income from Mutual Funds and Investment Funds management. As highlighted over the last quarters, the change was rooted in the 8.7% YoY growth in average Assets Under Management ("AUM", hereafter) in the 2Q26 compared to the 2Q25. As highlighted in previous reports, over the last couple of years our Mutual Funds and Investment Funds Management subsidiary has designed and launched new value offerings that pursued to provide investors with a broader array of investment opportunities given the evolution of the local and international financial scenario. In this context, the AUM expansion has been fostered by the migration of investors from fixed-income funds towards more sophisticated and riskier mutual fund alternatives, together with increased risk appetite for mixed or equity, which also bears higher fee margin over AUM. A rise of Ch$971 million or 5.5% in net fee income coming from Credit, Contingent loans and Repayments, primarily explained by increased fee income associated with prepayment of consumer loans. An increase of Ch$732 million or 2.8% in net fee income coming from our Insurance Brokerage business. As highlighted last quarter, we have been able to continue improving the cross-sell of credit-related life insurance for consumer loans, which has coupled with an increased share of higher-premium products in the portfolio mix, which coupled with a tempered YoY expansion
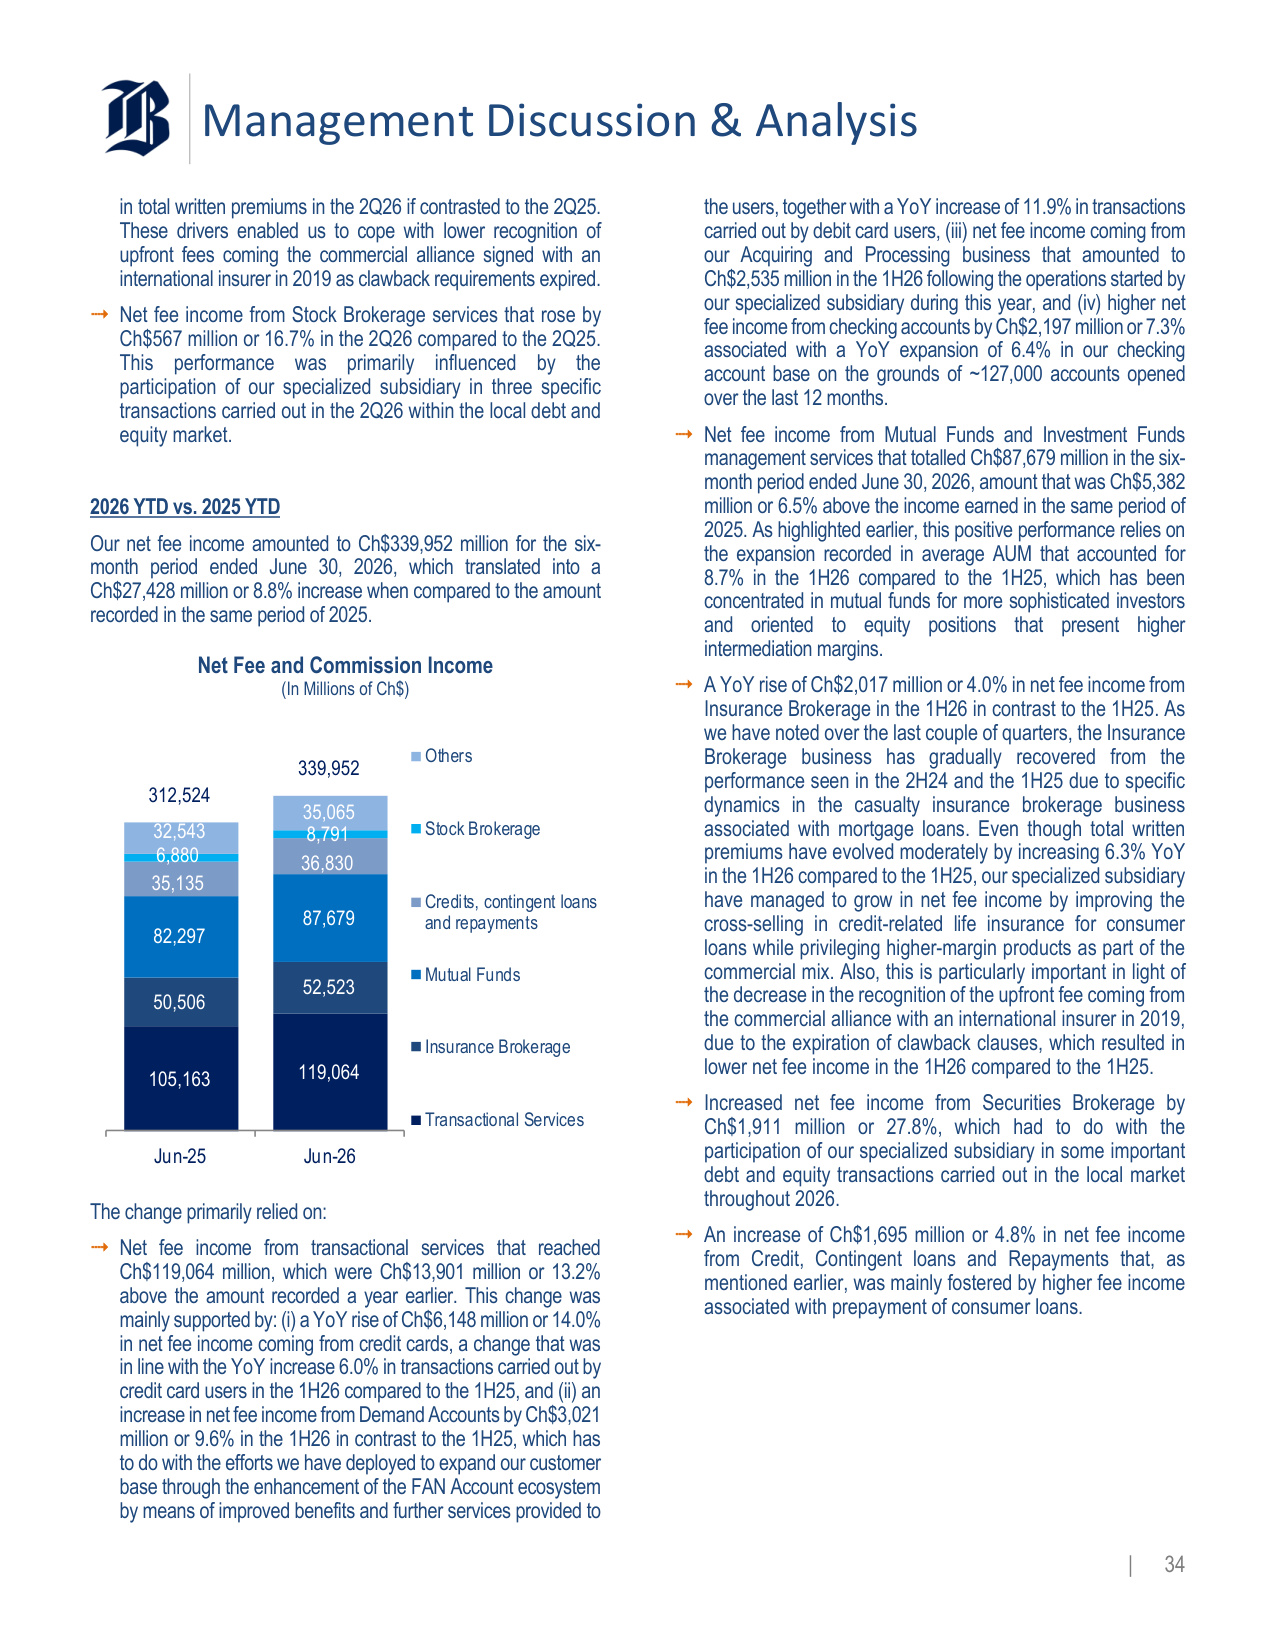
Management Discussion & Analysis | 34 in total written premiums in the 2Q26 if contrasted to the 2Q25. These drivers enabled us to cope with lower recognition of upfront fees coming the commercial alliance signed with an international insurer in 2019 as clawback requirements expired. Net fee income from Stock Brokerage services that rose by Ch$567 million or 16.7% in the 2Q26 compared to the 2Q25. This performance was primarily influenced by the participation of our specialized subsidiary in three specific transactions carried out in the 2Q26 within the local debt and equity market. 2026 YTD vs. 2025 YTD Our net fee income amounted to Ch$339,952 million for the six- month period ended June 30, 2026, which translated into a Ch$27,428 million or 8.8% increase when compared to the amount recorded in the same period of 2025. Net Fee and Commission Income (In Millions of Ch$) 105,163 119,064 50,506 52,523 82,297 87,679 35,135 36,830 6,880 8,791 32,543 35,065 312,524 339,952 Jun-25 Jun-26 Others Stock Brokerage Credits, contingent loans and repayments Mutual Funds Insurance Brokerage Transactional Services The change primarily relied on: Net fee income from transactional services that reached Ch$119,064 million, which were Ch$13,901 million or 13.2% above the amount recorded a year earlier. This change was mainly supported by: (i) a YoY rise of Ch$6,148 million or 14.0% in net fee income coming from credit cards, a change that was in line with the YoY increase 6.0% in transactions carried out by credit card users in the 1H26 compared to the 1H25, and (ii) an increase in net fee income from Demand Accounts by Ch$3,021 million or 9.6% in the 1H26 in contrast to the 1H25, which has to do with the efforts we have deployed to expand our customer base through the enhancement of the FAN Account ecosystem by means of improved benefits and further services provided to the users, together with a YoY increase of 11.9% in transactions carried out by debit card users, (iii) net fee income coming from our Acquiring and Processing business that amounted to Ch$2,535 million in the 1H26 following the operations started by our specialized subsidiary during this year, and (iv) higher net fee income from checking accounts by Ch$2,197 million or 7.3% associated with a YoY expansion of 6.4% in our checking account base on the grounds of ~127,000 accounts opened over the last 12 months. Net fee income from Mutual Funds and Investment Funds management services that totalled Ch$87,679 million in the six- month period ended June 30, 2026, amount that was Ch$5,382 million or 6.5% above the income earned in the same period of 2025. As highlighted earlier, this positive performance relies on the expansion recorded in average AUM that accounted for 8.7% in the 1H26 compared to the 1H25, which has been concentrated in mutual funds for more sophisticated investors and oriented to equity positions that present higher intermediation margins. A YoY rise of Ch$2,017 million or 4.0% in net fee income from Insurance Brokerage in the 1H26 in contrast to the 1H25. As we have noted over the last couple of quarters, the Insurance Brokerage business has gradually recovered from the performance seen in the 2H24 and the 1H25 due to specific dynamics in the casualty insurance brokerage business associated with mortgage loans. Even though total written premiums have evolved moderately by increasing 6.3% YoY in the 1H26 compared to the 1H25, our specialized subsidiary have managed to grow in net fee income by improving the cross-selling in credit-related life insurance for consumer loans while privileging higher-margin products as part of the commercial mix. Also, this is particularly important in light of the decrease in the recognition of the upfront fee coming from the commercial alliance with an international insurer in 2019, due to the expiration of clawback clauses, which resulted in lower net fee income in the 1H26 compared to the 1H25. Increased net fee income from Securities Brokerage by Ch$1,911 million or 27.8%, which had to do with the participation of our specialized subsidiary in some important debt and equity transactions carried out in the local market throughout 2026. An increase of Ch$1,695 million or 4.8% in net fee income from Credit, Contingent loans and Repayments that, as mentioned earlier, was mainly fostered by higher fee income associated with prepayment of consumer loans.
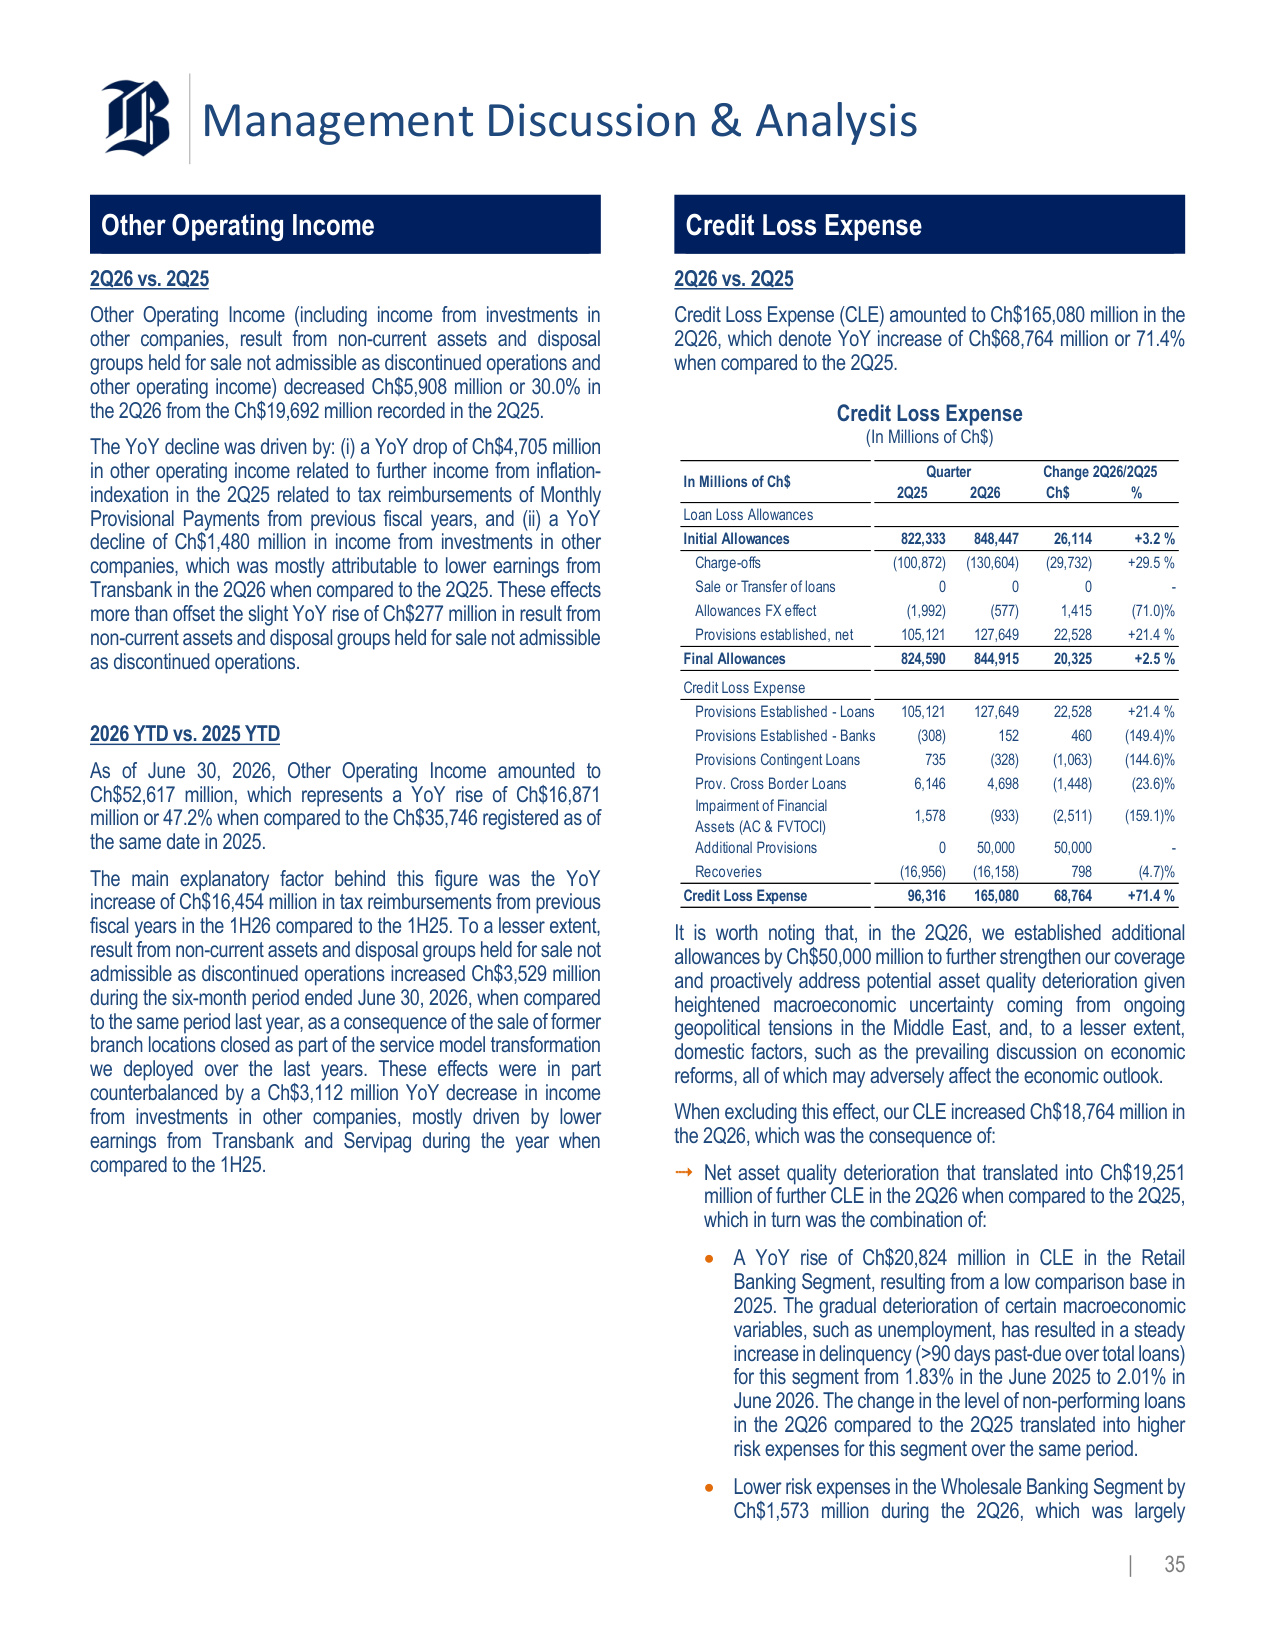
Management Discussion & Analysis | 35 Other Operating Income 2Q26 vs. 2Q25 Other Operating Income (including income from investments in other companies, result from non-current assets and disposal groups held for sale not admissible as discontinued operations and other operating income) decreased Ch$5,908 million or 30.0% in the 2Q26 from the Ch$19,692 million recorded in the 2Q25. The YoY decline was driven by: (i) a YoY drop of Ch$4,705 million in other operating income related to further income from inflation- indexation in the 2Q25 related to tax reimbursements of Monthly Provisional Payments from previous fiscal years, and (ii) a YoY decline of Ch$1,480 million in income from investments in other companies, which was mostly attributable to lower earnings from Transbank in the 2Q26 when compared to the 2Q25. These effects more than offset the slight YoY rise of Ch$277 million in result from non-current assets and disposal groups held for sale not admissible as discontinued operations. 2026 YTD vs. 2025 YTD As of June 30, 2026, Other Operating Income amounted to Ch$52,617 million, which represents a YoY rise of Ch$16,871 million or 47.2% when compared to the Ch$35,746 registered as of the same date in 2025. The main explanatory factor behind this figure was the YoY increase of Ch$16,454 million in tax reimbursements from previous fiscal years in the 1H26 compared to the 1H25. To a lesser extent, result from non-current assets and disposal groups held for sale not admissible as discontinued operations increased Ch$3,529 million during the six-month period ended June 30, 2026, when compared to the same period last year, as a consequence of the sale of former branch locations closed as part of the service model transformation we deployed over the last years. These effects were in part counterbalanced by a Ch$3,112 million YoY decrease in income from investments in other companies, mostly driven by lower earnings from Transbank and Servipag during the year when compared to the 1H25. Credit Loss Expense 2Q26 vs. 2Q25 Credit Loss Expense (CLE) amounted to Ch$165,080 million in the 2Q26, which denote YoY increase of Ch$68,764 million or 71.4% when compared to the 2Q25. Credit Loss Expense (In Millions of Ch$) 2Q25 2Q26 Ch$ % Loan Loss Allowances Initial Allowances 822,333 848,447 26,114 +3.2 % Charge-offs (100,872) (130,604) (29,732) +29.5 % Sale or Transfer of loans 0 0 0 - Allowances FX effect (1,992) (577) 1,415 (71.0)% Provisions established, net 105,121 127,649 22,528 +21.4 % Final Allowances 824,590 844,915 20,325 +2.5 % Credit Loss Expense Provisions Established - Loans 105,121 127,649 22,528 +21.4 % Provisions Established - Banks (308) 152 460 (149.4)% Provisions Contingent Loans 735 (328) (1,063) (144.6)% Prov. Cross Border Loans 6,146 4,698 (1,448) (23.6)% Impairment of Financial Assets (AC & FVTOCI) 1,578 (933) (2,511) (159.1)% Additional Provisions 0 50,000 50,000 - Recoveries (16,956) (16,158) 798 (4.7)% Credit Loss Expense 96,316 165,080 68,764 +71.4 % In Millions of Ch$ Quarter Change 2Q26/2Q25 It is worth noting that, in the 2Q26, we established additional allowances by Ch$50,000 million to further strengthen our coverage and proactively address potential asset quality deterioration given heightened macroeconomic uncertainty coming from ongoing geopolitical tensions in the Middle East, and, to a lesser extent, domestic factors, such as the prevailing discussion on economic reforms, all of which may adversely affect the economic outlook. When excluding this effect, our CLE increased Ch$18,764 million in the 2Q26, which was the consequence of: Net asset quality deterioration that translated into Ch$19,251 million of further CLE in the 2Q26 when compared to the 2Q25, which in turn was the combination of: • A YoY rise of Ch$20,824 million in CLE in the Retail Banking Segment, resulting from a low comparison base in 2025. The gradual deterioration of certain macroeconomic variables, such as unemployment, has resulted in a steady increase in delinquency (>90 days past-due over total loans) for this segment from 1.83% in the June 2025 to 2.01% in June 2026. The change in the level of non-performing loans in the 2Q26 compared to the 2Q25 translated into higher risk expenses for this segment over the same period. • Lower risk expenses in the Wholesale Banking Segment by Ch$1,573 million during the 2Q26, which was largely
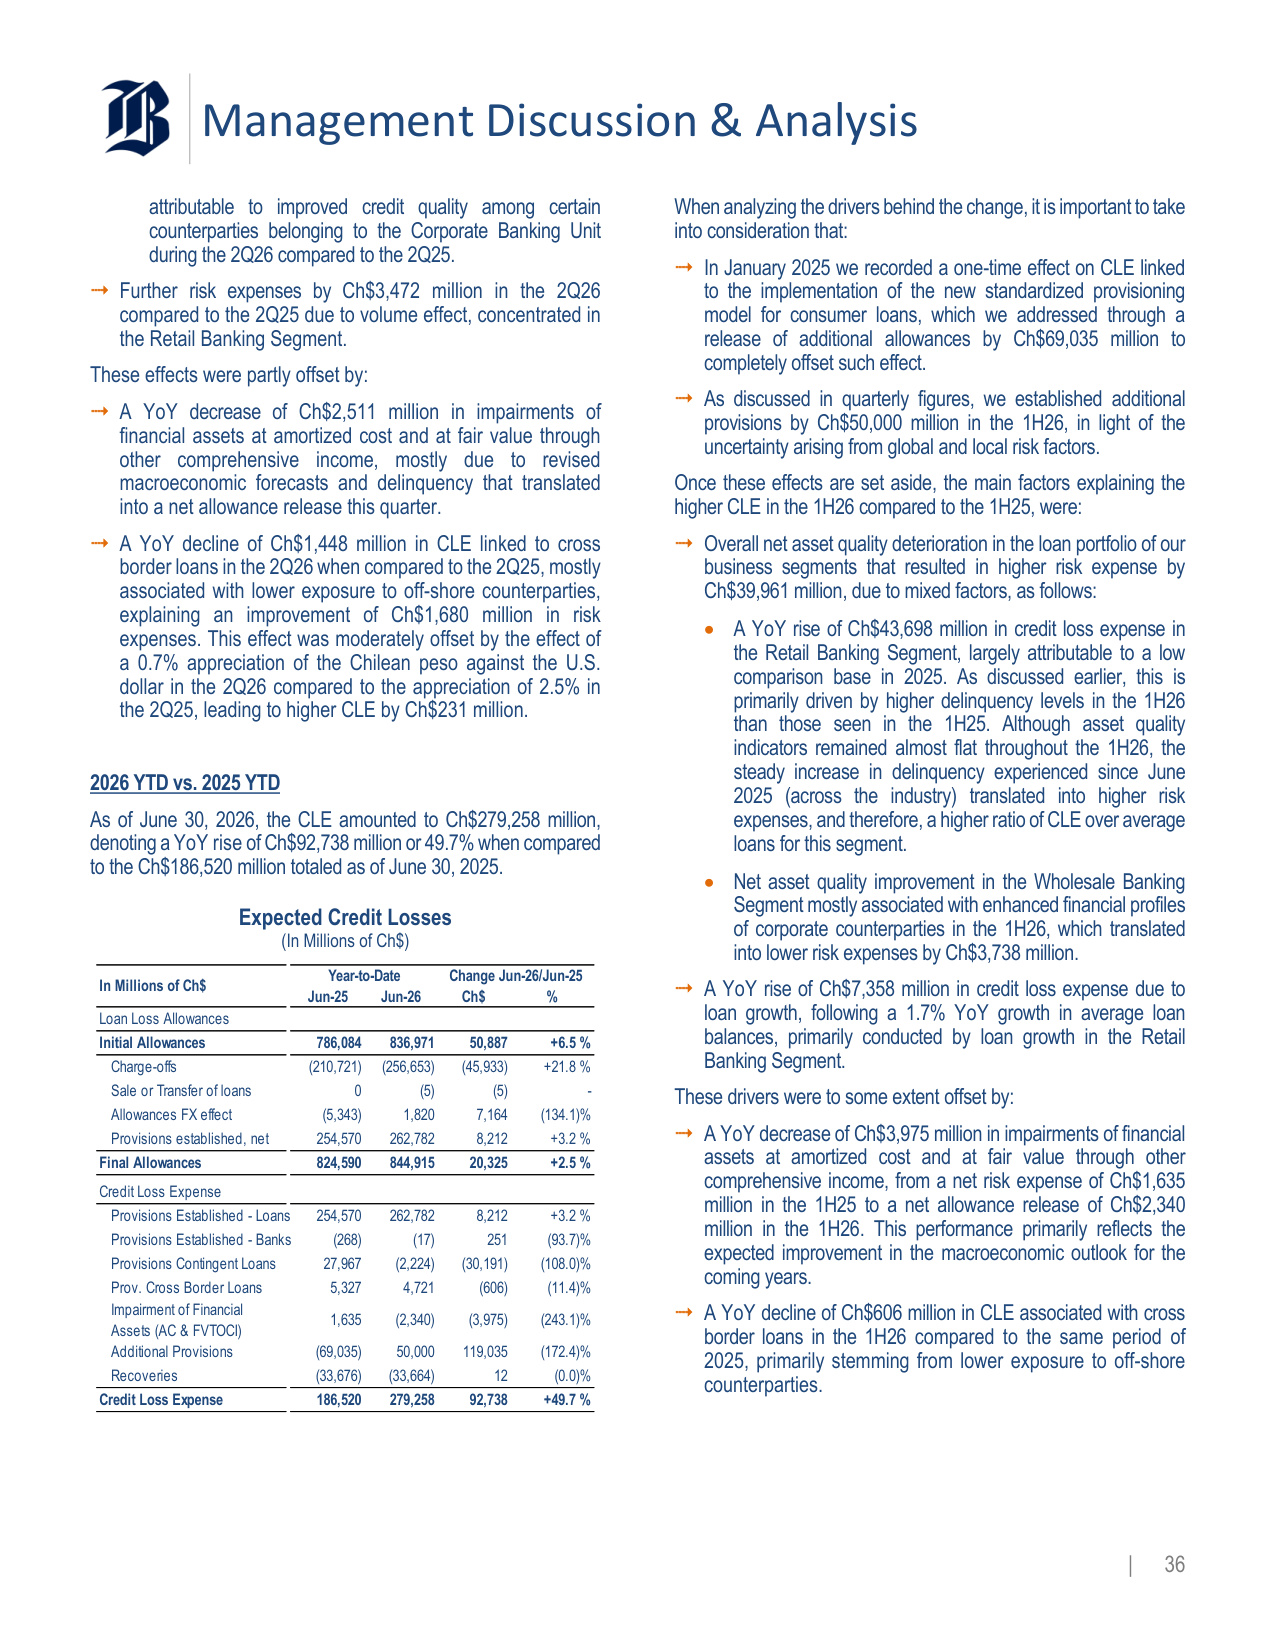
Management Discussion & Analysis | 36 attributable to improved credit quality among certain counterparties belonging to the Corporate Banking Unit during the 2Q26 compared to the 2Q25. Further risk expenses by Ch$3,472 million in the 2Q26 compared to the 2Q25 due to volume effect, concentrated in the Retail Banking Segment. These effects were partly offset by: A YoY decrease of Ch$2,511 million in impairments of financial assets at amortized cost and at fair value through other comprehensive income, mostly due to revised macroeconomic forecasts and delinquency that translated into a net allowance release this quarter. A YoY decline of Ch$1,448 million in CLE linked to cross border loans in the 2Q26 when compared to the 2Q25, mostly associated with lower exposure to off-shore counterparties, explaining an improvement of Ch$1,680 million in risk expenses. This effect was moderately offset by the effect of a 0.7% appreciation of the Chilean peso against the U.S. dollar in the 2Q26 compared to the appreciation of 2.5% in the 2Q25, leading to higher CLE by Ch$231 million. 2026 YTD vs. 2025 YTD As of June 30, 2026, the CLE amounted to Ch$279,258 million, denoting a YoY rise of Ch$92,738 million or 49.7% when compared to the Ch$186,520 million totaled as of June 30, 2025. Expected Credit Losses (In Millions of Ch$) Jun-25 Jun-26 Ch$ % Loan Loss Allowances Initial Allowances 786,084 836,971 50,887 +6.5 % Charge-offs (210,721) (256,653) (45,933) +21.8 % Sale or Transfer of loans 0 (5) (5) - Allowances FX effect (5,343) 1,820 7,164 (134.1)% Provisions established, net 254,570 262,782 8,212 +3.2 % Final Allowances 824,590 844,915 20,325 +2.5 % Credit Loss Expense Provisions Established - Loans 254,570 262,782 8,212 +3.2 % Provisions Established - Banks (268) (17) 251 (93.7)% Provisions Contingent Loans 27,967 (2,224) (30,191) (108.0)% Prov. Cross Border Loans 5,327 4,721 (606) (11.4)% Impairment of Financial Assets (AC & FVTOCI) 1,635 (2,340) (3,975) (243.1)% Additional Provisions (69,035) 50,000 119,035 (172.4)% Recoveries (33,676) (33,664) 12 (0.0)% Credit Loss Expense 186,520 279,258 92,738 +49.7 % Change Jun-26/Jun-25 In Millions of Ch$ Year-to-Date When analyzing the drivers behind the change, it is important to take into consideration that: In January 2025 we recorded a one-time effect on CLE linked to the implementation of the new standardized provisioning model for consumer loans, which we addressed through a release of additional allowances by Ch$69,035 million to completely offset such effect. As discussed in quarterly figures, we established additional provisions by Ch$50,000 million in the 1H26, in light of the uncertainty arising from global and local risk factors. Once these effects are set aside, the main factors explaining the higher CLE in the 1H26 compared to the 1H25, were: Overall net asset quality deterioration in the loan portfolio of our business segments that resulted in higher risk expense by Ch$39,961 million, due to mixed factors, as follows: • A YoY rise of Ch$43,698 million in credit loss expense in the Retail Banking Segment, largely attributable to a low comparison base in 2025. As discussed earlier, this is primarily driven by higher delinquency levels in the 1H26 than those seen in the 1H25. Although asset quality indicators remained almost flat throughout the 1H26, the steady increase in delinquency experienced since June 2025 (across the industry) translated into higher risk expenses, and therefore, a higher ratio of CLE over average loans for this segment. • Net asset quality improvement in the Wholesale Banking Segment mostly associated with enhanced financial profiles of corporate counterparties in the 1H26, which translated into lower risk expenses by Ch$3,738 million. A YoY rise of Ch$7,358 million in credit loss expense due to loan growth, following a 1.7% YoY growth in average loan balances, primarily conducted by loan growth in the Retail Banking Segment. These drivers were to some extent offset by: A YoY decrease of Ch$3,975 million in impairments of financial assets at amortized cost and at fair value through other comprehensive income, from a net risk expense of Ch$1,635 million in the 1H25 to a net allowance release of Ch$2,340 million in the 1H26. This performance primarily reflects the expected improvement in the macroeconomic outlook for the coming years. A YoY decline of Ch$606 million in CLE associated with cross border loans in the 1H26 compared to the same period of 2025, primarily stemming from lower exposure to off-shore counterparties.
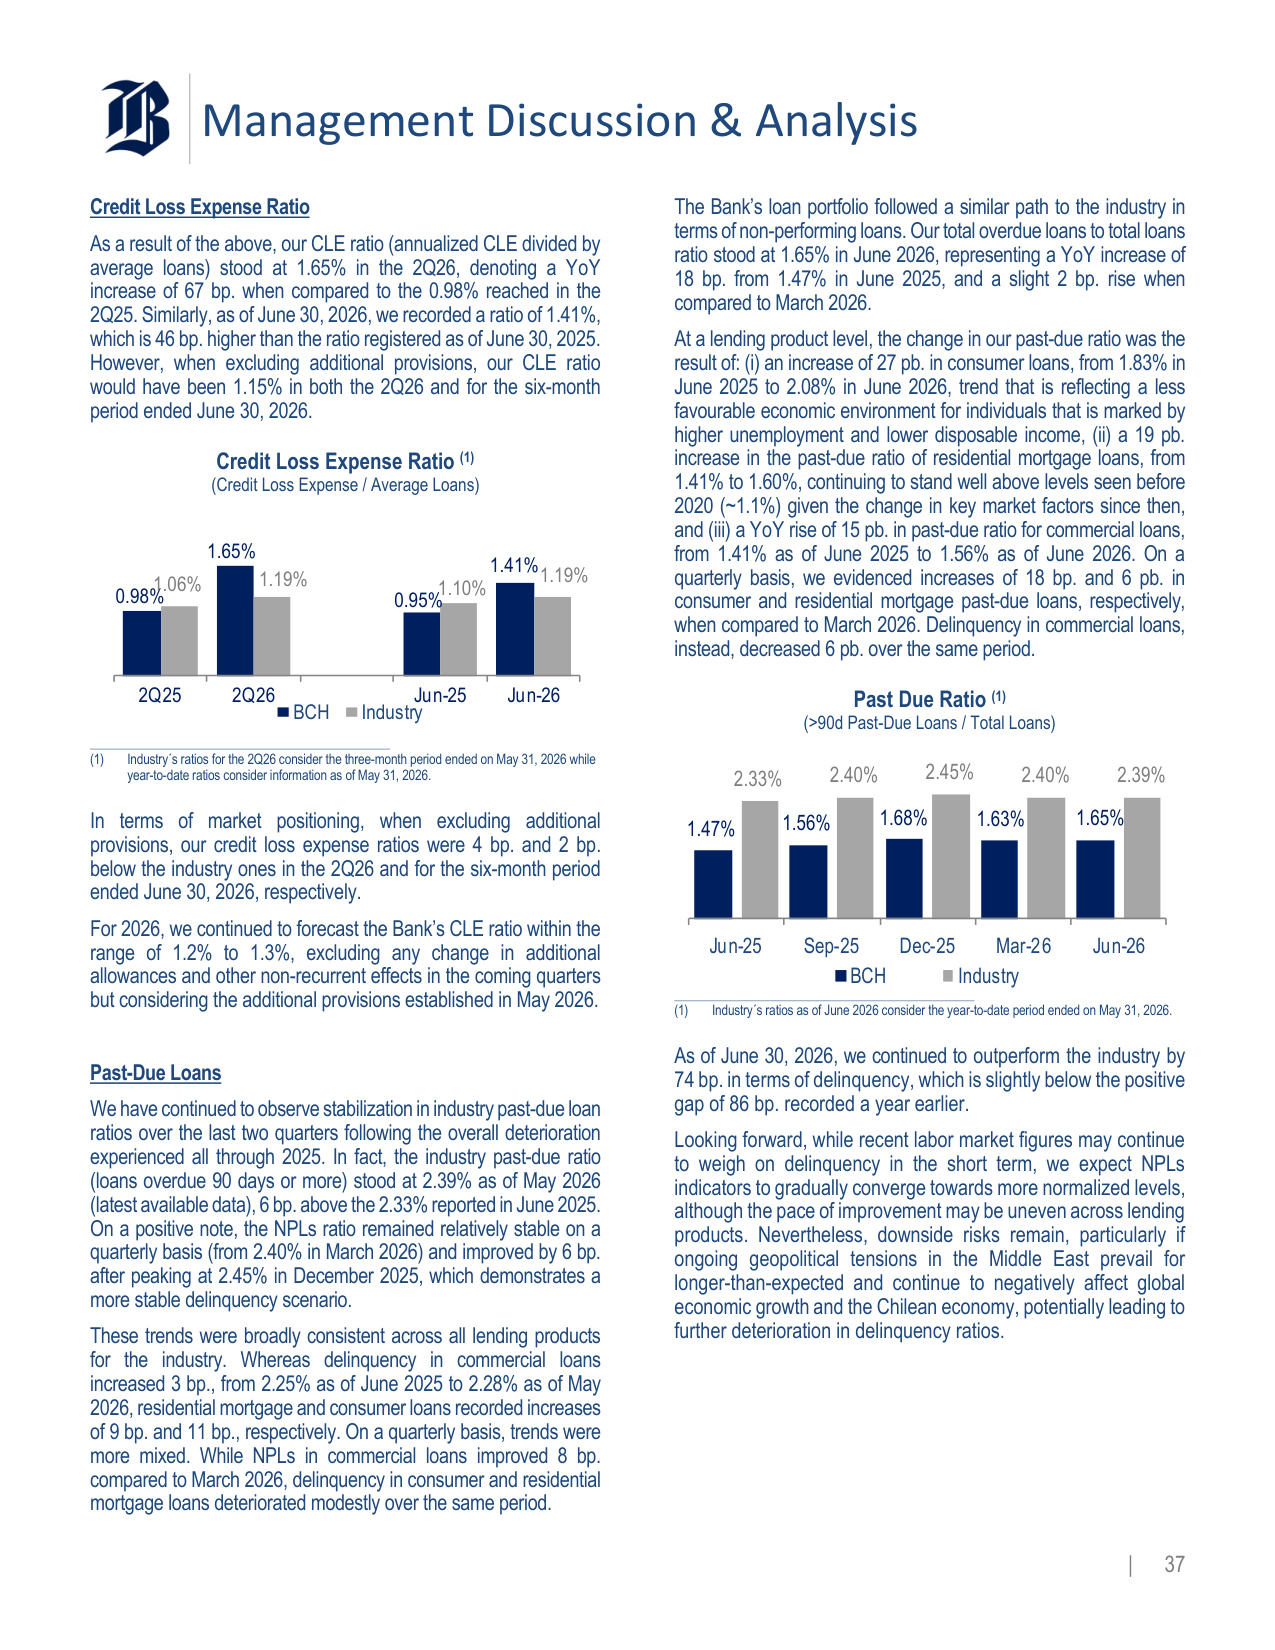
Management Discussion & Analysis | 37 Credit Loss Expense Ratio As a result of the above, our CLE ratio (annualized CLE divided by average loans) stood at 1.65% in the 2Q26, denoting a YoY increase of 67 bp. when compared to the 0.98% reached in the 2Q25. Similarly, as of June 30, 2026, we recorded a ratio of 1.41%, which is 46 bp. higher than the ratio registered as of June 30, 2025. However, when excluding additional provisions, our CLE ratio would have been 1.15% in both the 2Q26 and for the six-month period ended June 30, 2026. Credit Loss Expense Ratio (1) (Credit Loss Expense / Average Loans) 0.98% 1.65% 0.95% 1.41% 1.06% 1.19% 1.10% 1.19% 2Q25 2Q26 Jun-25 Jun-26 BCH Industry (1) Industry´s ratios for the 2Q26 consider the three-month period ended on May 31, 2026 while year-to-date ratios consider information as of May 31, 2026. In terms of market positioning, when excluding additional provisions, our credit loss expense ratios were 4 bp. and 2 bp. below the industry ones in the 2Q26 and for the six-month period ended June 30, 2026, respectively. For 2026, we continued to forecast the Bank's CLE ratio within the range of 1.2% to 1.3%, excluding any change in additional allowances and other non-recurrent effects in the coming quarters but considering the additional provisions established in May 2026. Past-Due Loans We have continued to observe stabilization in industry past-due loan ratios over the last two quarters following the overall deterioration experienced all through 2025. In fact, the industry past-due ratio (loans overdue 90 days or more) stood at 2.39% as of May 2026 (latest available data), 6 bp. above the 2.33% reported in June 2025. On a positive note, the NPLs ratio remained relatively stable on a quarterly basis (from 2.40% in March 2026) and improved by 6 bp. after peaking at 2.45% in December 2025, which demonstrates a more stable delinquency scenario. These trends were broadly consistent across all lending products for the industry. Whereas delinquency in commercial loans increased 3 bp., from 2.25% as of June 2025 to 2.28% as of May 2026, residential mortgage and consumer loans recorded increases of 9 bp. and 11 bp., respectively. On a quarterly basis, trends were more mixed. While NPLs in commercial loans improved 8 bp. compared to March 2026, delinquency in consumer and residential mortgage loans deteriorated modestly over the same period. The Bank's loan portfolio followed a similar path to the industry in terms of non-performing loans. Our total overdue loans to total loans ratio stood at 1.65% in June 2026, representing a YoY increase of 18 bp. from 1.47% in June 2025, and a slight 2 bp. rise when compared to March 2026. At a lending product level, the change in our past-due ratio was the result of: (i) an increase of 27 pb. in consumer loans, from 1.83% in June 2025 to 2.08% in June 2026, trend that is reflecting a less favourable economic environment for individuals that is marked by higher unemployment and lower disposable income, (ii) a 19 pb. increase in the past-due ratio of residential mortgage loans, from 1.41% to 1.60%, continuing to stand well above levels seen before 2020 (~1.1%) given the change in key market factors since then, and (iii) a YoY rise of 15 pb. in past-due ratio for commercial loans, from 1.41% as of June 2025 to 1.56% as of June 2026. On a quarterly basis, we evidenced increases of 18 bp. and 6 pb. in consumer and residential mortgage past-due loans, respectively, when compared to March 2026. Delinquency in commercial loans, instead, decreased 6 pb. over the same period. Past Due Ratio (1) (>90d Past-Due Loans / Total Loans) 1.47% 1.56% 1.68% 1.63% 1.65% 2.33% 2.40% 2.45% 2.40% 2.39% Jun-25 Sep-25 Dec-25 Mar-26 Jun-26 BCH Industry (1) Industry´s ratios as of June 2026 consider the year-to-date period ended on May 31, 2026. As of June 30, 2026, we continued to outperform the industry by 74 bp. in terms of delinquency, which is slightly below the positive gap of 86 bp. recorded a year earlier. Looking forward, while recent labor market figures may continue to weigh on delinquency in the short term, we expect NPLs indicators to gradually converge towards more normalized levels, although the pace of improvement may be uneven across lending products. Nevertheless, downside risks remain, particularly if ongoing geopolitical tensions in the Middle East prevail for longer-than-expected and continue to negatively affect global economic growth and the Chilean economy, potentially leading to further deterioration in delinquency ratios.
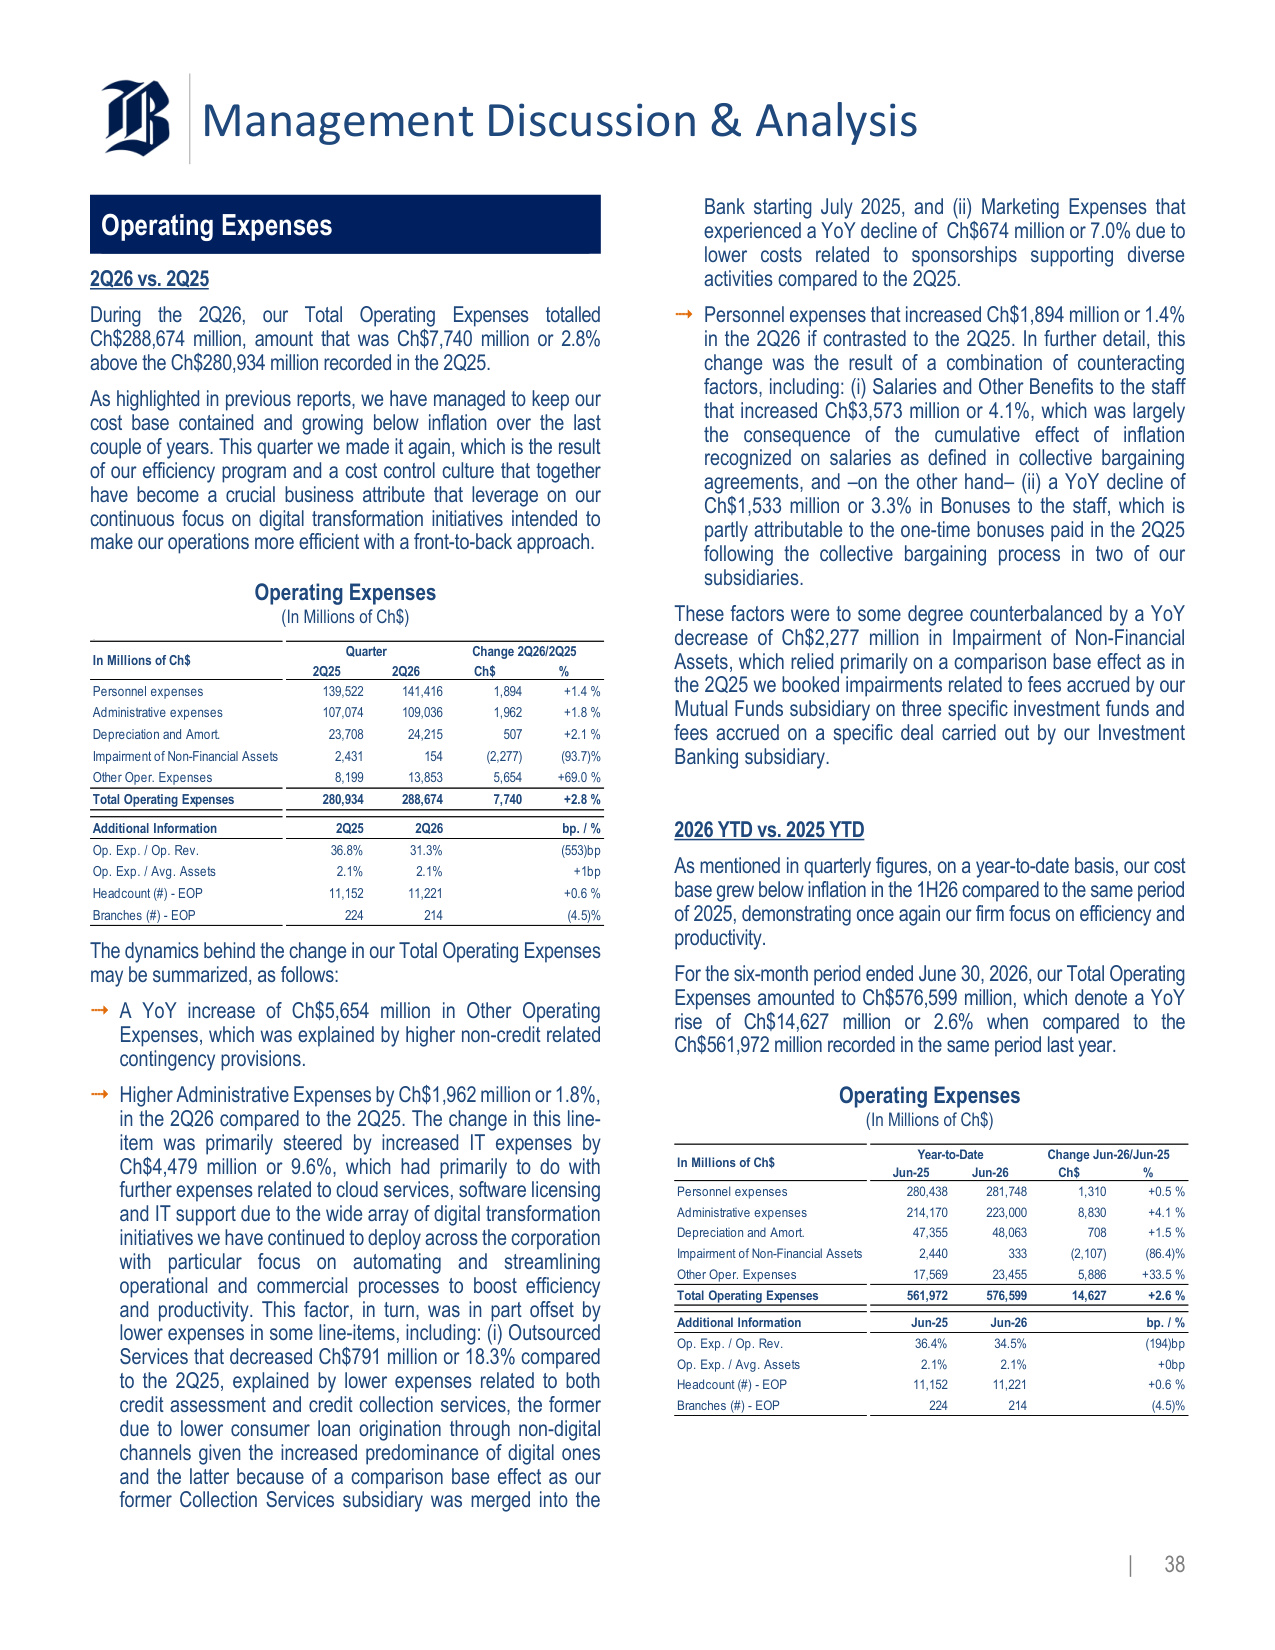
Management Discussion & Analysis | 38 Operating Expenses 2Q26 vs. 2Q25 During the 2Q26, our Total Operating Expenses totalled Ch$288,674 million, amount that was Ch$7,740 million or 2.8% above the Ch$280,934 million recorded in the 2Q25. As highlighted in previous reports, we have managed to keep our cost base contained and growing below inflation over the last couple of years. This quarter we made it again, which is the result of our efficiency program and a cost control culture that together have become a crucial business attribute that leverage on our continuous focus on digital transformation initiatives intended to make our operations more efficient with a front-to-back approach. Operating Expenses (In Millions of Ch$) 2Q25 2Q26 Ch$ % Personnel expenses 139,522 141,416 1,894 +1.4 % Administrative expenses 107,074 109,036 1,962 +1.8 % Depreciation and Amort. 23,708 24,215 507 +2.1 % Impairment of Non-Financial Assets 2,431 154 (2,277) (93.7)% Other Oper. Expenses 8,199 13,853 5,654 +69.0 % Total Operating Expenses 280,934 288,674 7,740 +2.8 % Additional Information 2Q25 2Q26 bp. / % Op. Exp. / Op. Rev. 36.8% 31.3% (553)bp Op. Exp. / Avg. Assets 2.1% 2.1% +1bp Headcount (#) - EOP 11,152 11,221 +0.6 % Branches (#) - EOP 224 214 (4.5)% In Millions of Ch$ Quarter Change 2Q26/2Q25 The dynamics behind the change in our Total Operating Expenses may be summarized, as follows: A YoY increase of Ch$5,654 million in Other Operating Expenses, which was explained by higher non-credit related contingency provisions. Higher Administrative Expenses by Ch$1,962 million or 1.8%, in the 2Q26 compared to the 2Q25. The change in this line- item was primarily steered by increased IT expenses by Ch$4,479 million or 9.6%, which had primarily to do with further expenses related to cloud services, software licensing and IT support due to the wide array of digital transformation initiatives we have continued to deploy across the corporation with particular focus on automating and streamlining operational and commercial processes to boost efficiency and productivity. This factor, in turn, was in part offset by lower expenses in some line-items, including: (i) Outsourced Services that decreased Ch$791 million or 18.3% compared to the 2Q25, explained by lower expenses related to both credit assessment and credit collection services, the former due to lower consumer loan origination through non-digital channels given the increased predominance of digital ones and the latter because of a comparison base effect as our former Collection Services subsidiary was merged into the Bank starting July 2025, and (ii) Marketing Expenses that experienced a YoY decline of Ch$674 million or 7.0% due to lower costs related to sponsorships supporting diverse activities compared to the 2Q25. Personnel expenses that increased Ch$1,894 million or 1.4% in the 2Q26 if contrasted to the 2Q25. In further detail, this change was the result of a combination of counteracting factors, including: (i) Salaries and Other Benefits to the staff that increased Ch$3,573 million or 4.1%, which was largely the consequence of the cumulative effect of inflation recognized on salaries as defined in collective bargaining agreements, and –on the other hand– (ii) a YoY decline of Ch$1,533 million or 3.3% in Bonuses to the staff, which is partly attributable to the one-time bonuses paid in the 2Q25 following the collective bargaining process in two of our subsidiaries. These factors were to some degree counterbalanced by a YoY decrease of Ch$2,277 million in Impairment of Non-Financial Assets, which relied primarily on a comparison base effect as in the 2Q25 we booked impairments related to fees accrued by our Mutual Funds subsidiary on three specific investment funds and fees accrued on a specific deal carried out by our Investment Banking subsidiary. 2026 YTD vs. 2025 YTD As mentioned in quarterly figures, on a year-to-date basis, our cost base grew below inflation in the 1H26 compared to the same period of 2025, demonstrating once again our firm focus on efficiency and productivity. For the six-month period ended June 30, 2026, our Total Operating Expenses amounted to Ch$576,599 million, which denote a YoY rise of Ch$14,627 million or 2.6% when compared to the Ch$561,972 million recorded in the same period last year. Operating Expenses (In Millions of Ch$) Jun-25 Jun-26 Ch$ % Personnel expenses 280,438 281,748 1,310 +0.5 % Administrative expenses 214,170 223,000 8,830 +4.1 % Depreciation and Amort. 47,355 48,063 708 +1.5 % Impairment of Non-Financial Assets 2,440 333 (2,107) (86.4)% Other Oper. Expenses 17,569 23,455 5,886 +33.5 % Total Operating Expenses 561,972 576,599 14,627 +2.6 % Additional Information Jun-25 Jun-26 bp. / % Op. Exp. / Op. Rev. 36.4% 34.5% (194)bp Op. Exp. / Avg. Assets 2.1% 2.1% +0bp Headcount (#) - EOP 11,152 11,221 +0.6 % Branches (#) - EOP 224 214 (4.5)% Year-to-Date Change Jun-26/Jun-25 In Millions of Ch$
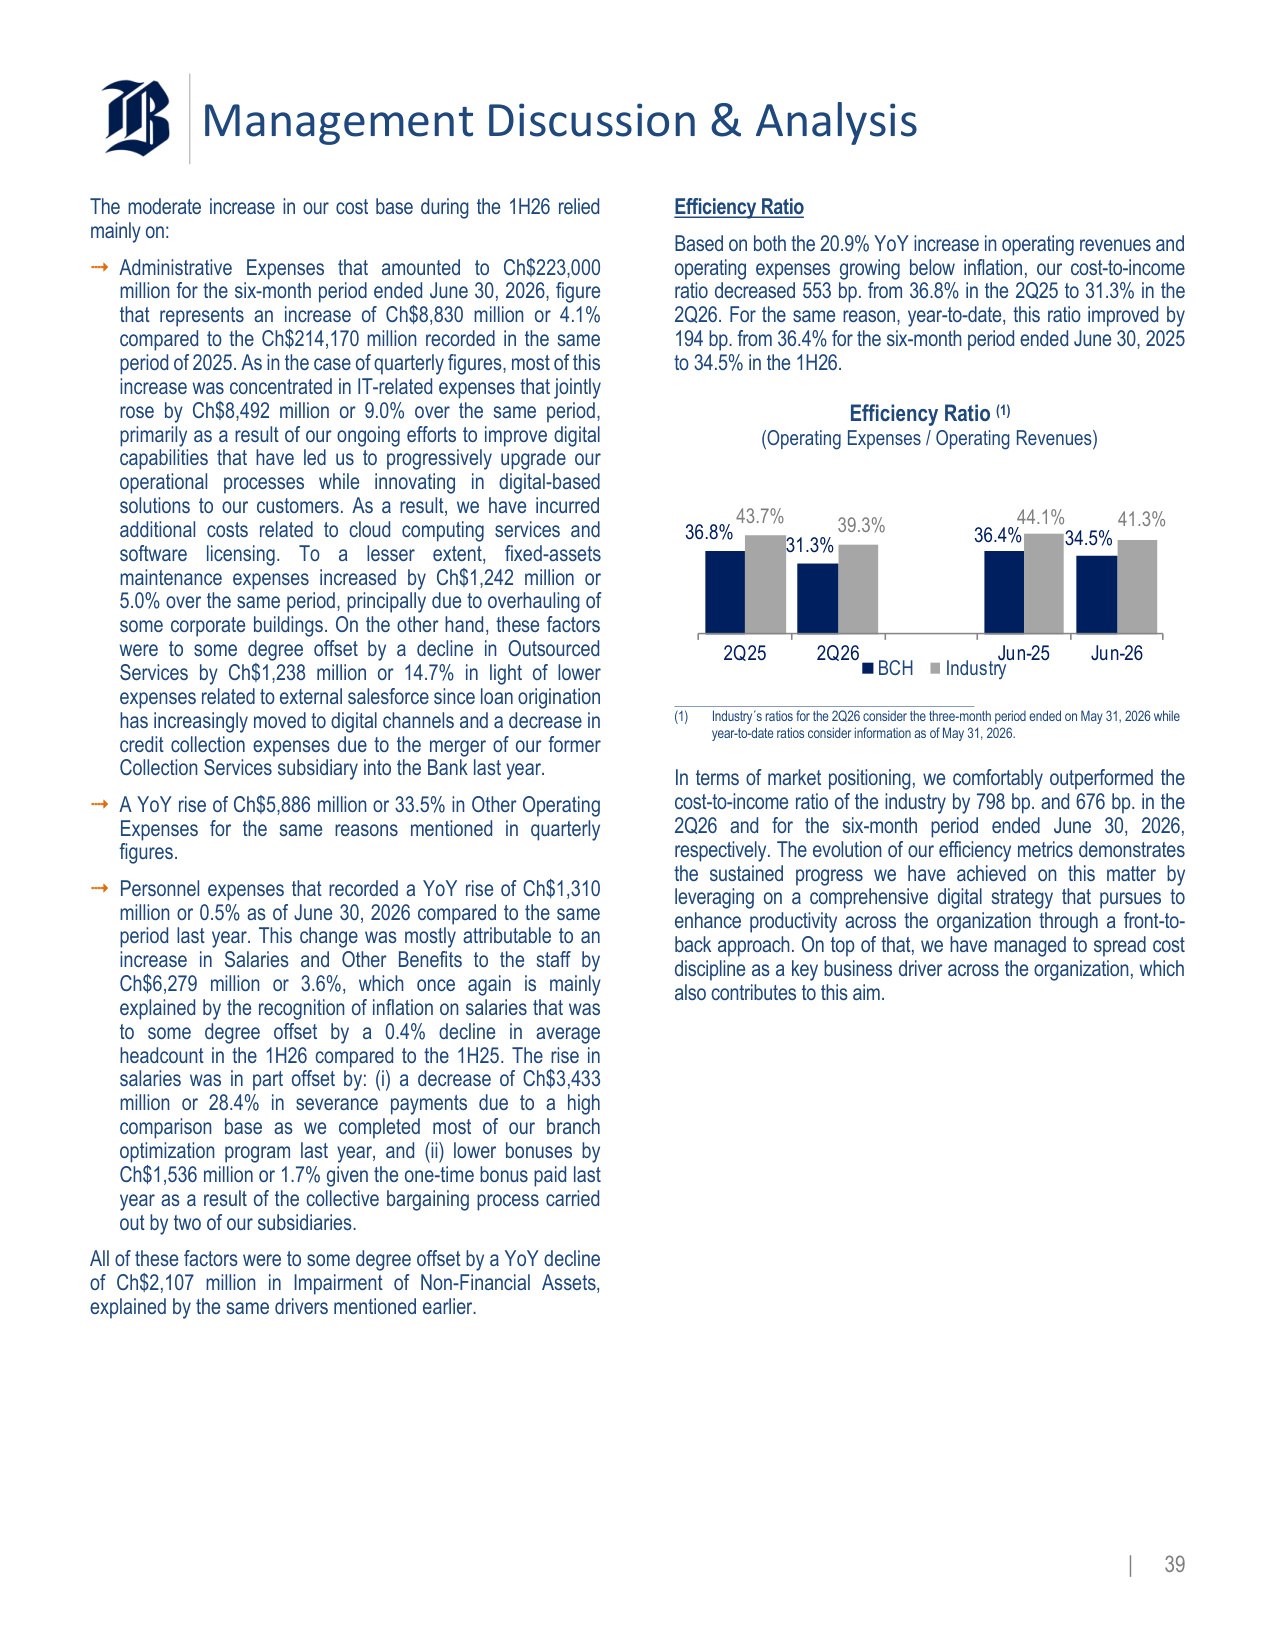
Management Discussion & Analysis | 39 The moderate increase in our cost base during the 1H26 relied mainly on: Administrative Expenses that amounted to Ch$223,000 million for the six-month period ended June 30, 2026, figure that represents an increase of Ch$8,830 million or 4.1% compared to the Ch$214,170 million recorded in the same period of 2025. As in the case of quarterly figures, most of this increase was concentrated in IT-related expenses that jointly rose by Ch$8,492 million or 9.0% over the same period, primarily as a result of our ongoing efforts to improve digital capabilities that have led us to progressively upgrade our operational processes while innovating in digital-based solutions to our customers. As a result, we have incurred additional costs related to cloud computing services and software licensing. To a lesser extent, fixed-assets maintenance expenses increased by Ch$1,242 million or 5.0% over the same period, principally due to overhauling of some corporate buildings. On the other hand, these factors were to some degree offset by a decline in Outsourced Services by Ch$1,238 million or 14.7% in light of lower expenses related to external salesforce since loan origination has increasingly moved to digital channels and a decrease in credit collection expenses due to the merger of our former Collection Services subsidiary into the Bank last year. A YoY rise of Ch$5,886 million or 33.5% in Other Operating Expenses for the same reasons mentioned in quarterly figures. Personnel expenses that recorded a YoY rise of Ch$1,310 million or 0.5% as of June 30, 2026 compared to the same period last year. This change was mostly attributable to an increase in Salaries and Other Benefits to the staff by Ch$6,279 million or 3.6%, which once again is mainly explained by the recognition of inflation on salaries that was to some degree offset by a 0.4% decline in average headcount in the 1H26 compared to the 1H25. The rise in salaries was in part offset by: (i) a decrease of Ch$3,433 million or 28.4% in severance payments due to a high comparison base as we completed most of our branch optimization program last year, and (ii) lower bonuses by Ch$1,536 million or 1.7% given the one-time bonus paid last year as a result of the collective bargaining process carried out by two of our subsidiaries. All of these factors were to some degree offset by a YoY decline of Ch$2,107 million in Impairment of Non-Financial Assets, explained by the same drivers mentioned earlier. Efficiency Ratio Based on both the 20.9% YoY increase in operating revenues and operating expenses growing below inflation, our cost-to-income ratio decreased 553 bp. from 36.8% in the 2Q25 to 31.3% in the 2Q26. For the same reason, year-to-date, this ratio improved by 194 bp. from 36.4% for the six-month period ended June 30, 2025 to 34.5% in the 1H26. Efficiency Ratio (1) (Operating Expenses / Operating Revenues) 36.8% 31.3% 36.4% 34.5% 43.7% 39.3% 44.1% 41.3% 2Q25 2Q26 Jun-25 Jun-26 BCH Industry (1) Industry´s ratios for the 2Q26 consider the three-month period ended on May 31, 2026 while year-to-date ratios consider information as of May 31, 2026. In terms of market positioning, we comfortably outperformed the cost-to-income ratio of the industry by 798 bp. and 676 bp. in the 2Q26 and for the six-month period ended June 30, 2026, respectively. The evolution of our efficiency metrics demonstrates the sustained progress we have achieved on this matter by leveraging on a comprehensive digital strategy that pursues to enhance productivity across the organization through a front-to- back approach. On top of that, we have managed to spread cost discipline as a key business driver across the organization, which also contributes to this aim.
Management Discussion & Analysis | 40 Income Tax 2Q26 vs. 2Q25 During the 2Q26, our income tax amounted to Ch$77,705 million, which represents a YoY decrease of Ch$2,742 million or 3.5% when contrasted to the 2Q25. This figure was principally explained by the effect of higher inflation (CPI variation) on equity accounts, which is tax deductible under the Chilean tax, resulting in lower income tax by Ch$28,446 million in the 2Q26 compared to the 2Q25. This effect more than offset: (i) a YoY rise of Ch$82,958 million in net operating income before income tax in the 2Q26 compared to 2Q25, which translated into further income tax by Ch$22,399 million at the prevailing statutory corporate tax rate of 27%, and (ii) lower tax deductions and other effects by Ch$3,305 million due to mixed factors including negative fair value adjustments for fixed-income securities treated under Article 104. Based on these drivers, our effective tax rate decreased from 20.9% in the 2Q25 to 16.6% in the 2Q26. 2026 YTD vs. 2025 YTD As of June 30, 2026, we recorded an income tax of Ch$155,859 million, which is Ch$3,618 million below the Ch$159,477 million registered as of June 30, 2025. The change was mostly the consequence of: (i) the effect of higher inflation on our equity (tax deductible under the Chilean Tax Law), which translated into lower income tax by Ch$4,776 million in the 1H26 than in the 1H25, and (ii) higher general tax deductions in the 1H26 compared to the 1H25 by Ch$4,719 million, primarily driven by the tax treatment of fixed-income securities under Article 104 of the Chilean tax law. These factors were in part offset by an increase of Ch$5,877 million in income tax coming from the further net operating income before income tax by Ch$21,766 million in the 1H26 compared to the 1H25 at the 27% statutory corporate tax rate. On the whole, our effective tax rate reached 19.1% for the six-month period ended June 30, 2026, which compares to the 20.1% recorded in the same period of 2025. It is important to recall that, during the 2Q26, the Chilean Congress began the discussion of the "National Reconstruction, Economic and Social Development" bill that considers, among other measures, a gradual decline in the statutory corporate tax rate in a three-year timeframe, from 27% to 25.5% for 2027, 24% for 2028 and 23% for 2029 onwards. Since deferred taxes are measured by using the approved or substantially approved corporate tax rates as of the reporting date, as of June 30, 2026, no effects associated with this bill have been recognized. However, if the bill is enacted and published in substantially the same form as proposed, we estimate that the remeasurement of our deferred tax assets and liabilities would result in an income tax charge of about Ch$69,000 million. Furthermore, our effective tax rate would be approximately three percentage points below the new statutory corporate tax rates due to the impact of inflation on equity (assuming a ~3% inflation rate) and excluding any other non-recurrent tax deductions or surcharges.
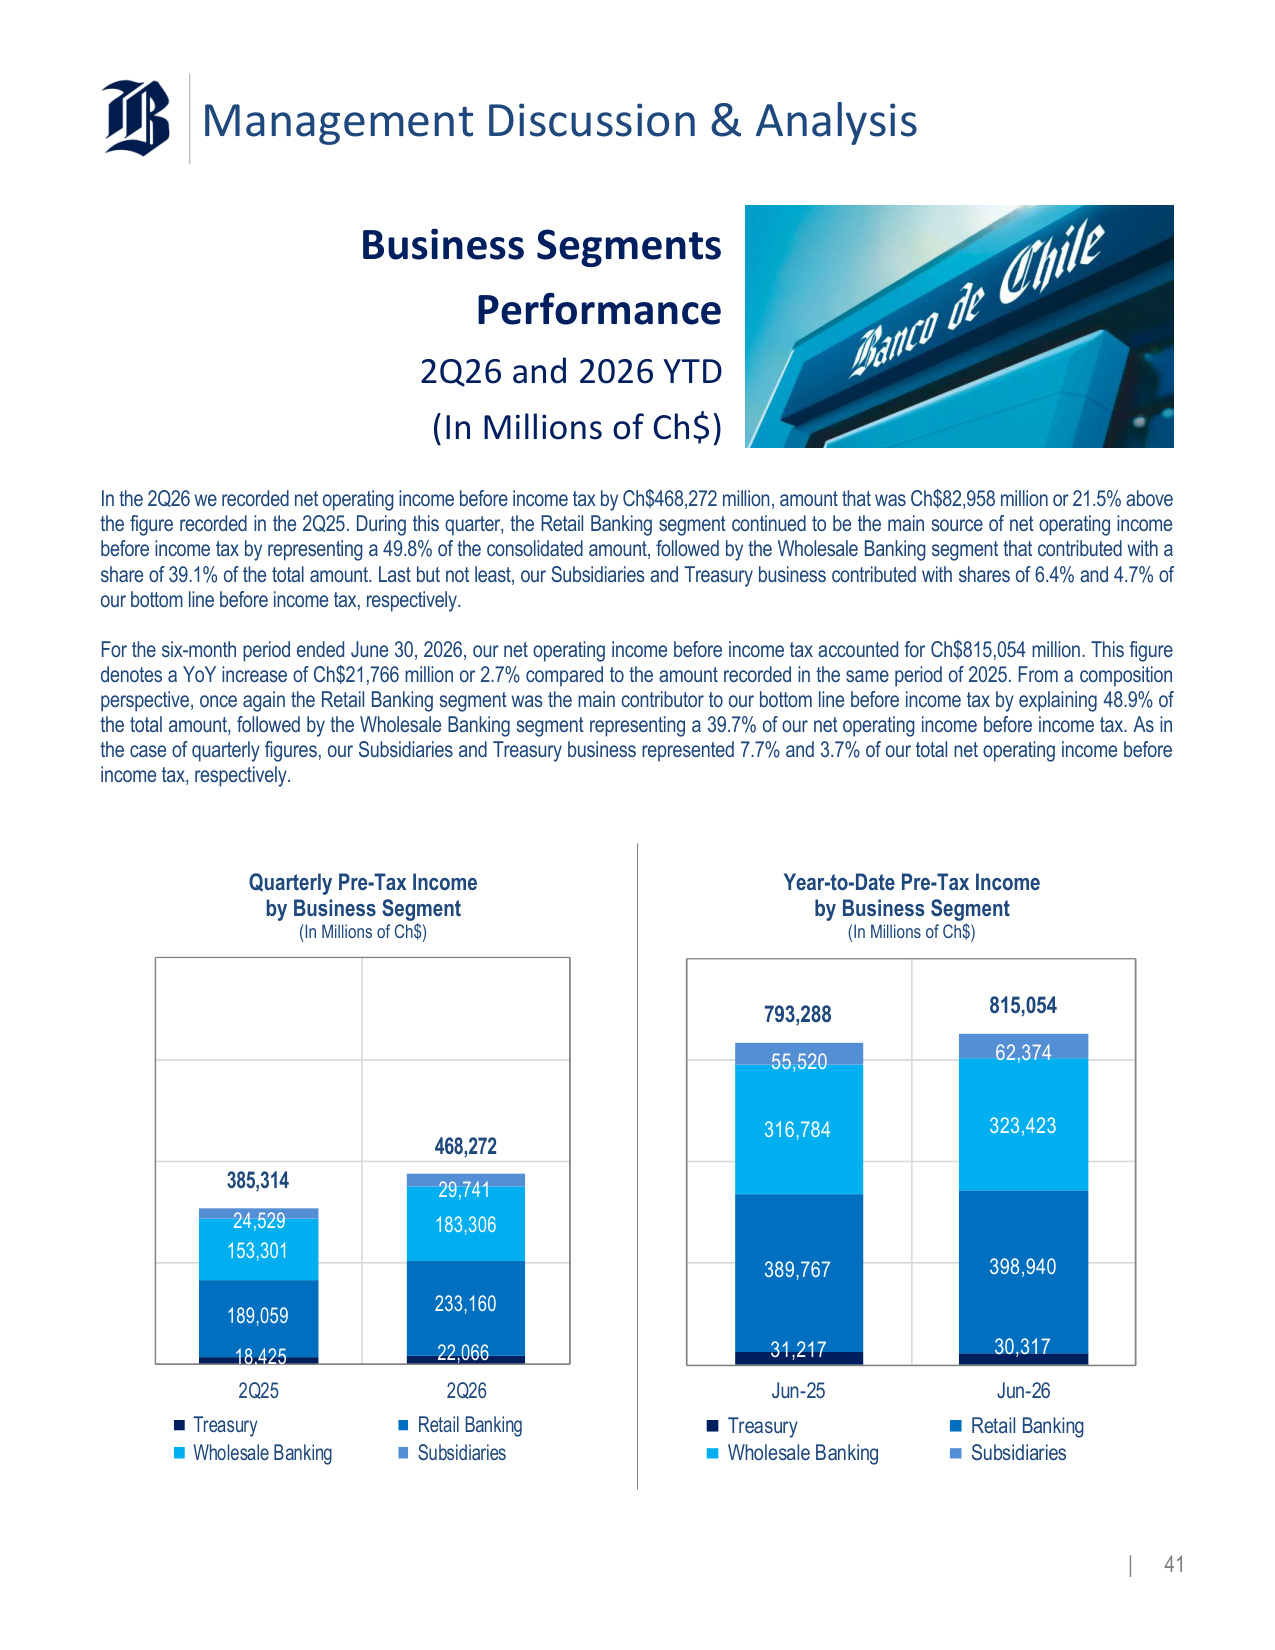
Management Discussion & Analysis | 41 Business Segments Performance 2Q26 and 2026 YTD (In Millions of Ch$) In the 2Q26 we recorded net operating income before income tax by Ch$468,272 million, amount that was Ch$82,958 million or 21.5% above the figure recorded in the 2Q25. During this quarter, the Retail Banking segment continued to be the main source of net operating income before income tax by representing a 49.8% of the consolidated amount, followed by the Wholesale Banking segment that contributed with a share of 39.1% of the total amount. Last but not least, our Subsidiaries and Treasury business contributed with shares of 6.4% and 4.7% of our bottom line before income tax, respectively. For the six-month period ended June 30, 2026, our net operating income before income tax accounted for Ch$815,054 million. This figure denotes a YoY increase of Ch$21,766 million or 2.7% compared to the amount recorded in the same period of 2025. From a composition perspective, once again the Retail Banking segment was the main contributor to our bottom line before income tax by explaining 48.9% of the total amount, followed by the Wholesale Banking segment representing a 39.7% of our net operating income before income tax. As in the case of quarterly figures, our Subsidiaries and Treasury business represented 7.7% and 3.7% of our total net operating income before income tax, respectively. Quarterly Pre-Tax Income by Business Segment (In Millions of Ch$) 18,425 22,066 189,059 233,160 153,301 183,306 24,529 29,741 385,314 468,272 2Q25 2Q26 Treasury Retail Banking Wholesale Banking Subsidiaries Year-to-Date Pre-Tax Income by Business Segment (In Millions of Ch$) 31,217 30,317 389,767 398,940 316,784 323,423 55,520 62,374 793,288 815,054 Jun-25 Jun-26 Treasury Retail Banking Wholesale Banking Subsidiaries
Management Discussion & Analysis | 42 Retail Banking Segment Our Retail Banking segment recorded net operating income before income tax by Ch$233,160 million in the 2Q26, amount that denotes a YoY increase of Ch$44,101 million or 23.3% compared to the 2Q25. This change was primarily caused by a YoY rise of Ch$100,327 million or 21.1% in total operating income, primarily due to increased revenues coming from asset and liability management (term gapping and revenues from inflation indexation) that are partly allocated to this segment, given the increase in inflation in the 2Q26 compared to the 2Q25, together with higher net fee income coming from transactional services and greater income from loans, particularly focused on consumer loans, that enabled us to deal with a lower contribution of demand deposits to our funding. To some degree, the rise in operating revenues was partly offset by: (i) higher credit loss expense by Ch$50,893 million or 59.4% YoY, primarily due to the establishment of additional allowances this quarter that are partly allocated to this segment and also as a result of higher delinquency, and (ii) a YoY increase of Ch$5,332 million or 2.7% in operating expenses, below 12-month inflation, largely attributable to higher personnel expenses due to the recognition of inflation on salaries and non-credit related contingency provisions, as mentioned earlier. As of June 30, 2026, our Retail Banking segment recorded a net operating income before income tax of Ch$398,940 million that denote a YoY rise Ch$9,173 million or 2.4% compared to the same period of 2025. Once again, this performance was primarily attributable to operating revenues that increased Ch$93,115 million or 9.7% YoY, due to higher revenues from the management of financial gaps that are partly allocated to this segment, in conjunction with both higher income from loans and increase net fee income, primarily focused on transactional services, which enabled us to more than offset the lower contribution of demand deposits managed by the segment to our cost of funds given the decrease in short-term interest rates. The increase in operating revenues was to some extent offset by: (i) credit loss expenses that rose Ch$77,127 million or 46.0% YoY in the 1H26 compared to the 1H25, mostly due to the same drivers mentioned earlier associated with increased additional provisions and higher delinquency, and (ii) a tempered YoY rise of Ch$6,814 million or 1.7% in operating expenses, due to similar reasons mentioned in the quarterly figures. Wholesale Banking Segment In the 2Q26, the Wholesale Banking segment reached a net operating income before income tax of Ch$183,306 million in the 2Q26, which denote a YoY rise of Ch$30,005 million or 19.6% compared to the 2Q25. This performance was mostly driven by a YoY increase of Ch$53,374 million or 25.0% in total operating income, mostly steered by higher revenues from asset and liability management that are partly allocated to this segment, and a YoY increase in net fee income, all of which more than offset the effect of lower contribution of DDA to our funding and a YoY decline in income from loans in this segment. The improve top line was partly mitigated by: (i) a YoY increase of Ch$20,381 million in credit loss expense mainly prompted by the establishment of additional allowances in the 2Q26 that are partly allocated to this segment, which in turn was partly offset by improved credit quality among certain Wholesale counterparties, and (ii) higher operating expenses by Ch$2,987 million or 5.9%, principally explained by the recognition of the cumulative effect of inflation on salaries and the establishment of non-credit related contingency provisions. As of June 30, 2026, the Wholesale Banking Segment recorded a net operating income before income tax of Ch$323,423 million, which was Ch$6,639 million or 2.1% above the level recorded in the 1H25. This behavior was mostly explained by a YoY rise of Ch$31,369 million in total operating income, which in turn was largely influenced by increased revenues from asset and liability management that are in part allocated to this segment, which allowed us to offset the effect of lower contribution of DDA to our funding. On the other hand, the 7.2% YoY growth in total operating revenues was partly offset by: (i) an annual increase of Ch$19,586 million in credit loss expense due to the same factors discussed in the quarterly figures, and (ii) a YoY rise of Ch$5,144 million or 5.0% in operating expenses as a result of similar drivers mentioned earlier.
Management Discussion & Analysis | 43 Treasury Segment Our Treasury segment reported net operating income before income tax of Ch$22,066 million in the 2Q26, denoting a YoY increase of Ch$3,641 million or 19.8% compared to the Ch$18,425 million in the 2Q25. This performance was mainly driven by a Ch$2,511 million YoY decrease in impairments of financial assets at amortized cost and at fair value through other comprehensive income, reflecting revised macroeconomic forecasts and delinquency indicators during the quarter. To a lesser extent, the annual change was supported by a YoY increase of Ch$1,318 million or 6.1% in total operating revenues, primarily attributable to higher inflation during the 2Q26 when contrasted to the same quarter last year, which resulted in higher income from asset and liability management that are partly allocated to the Treasury segment. This positive effect allowed us to more than offset the YoY decline in revenues coming from the management of our Trading desk, reflecting negative fair value adjustments on derivatives due to unfavourable shifts in CLF interest rates during the 2Q26 in relation to the 2Q25. As of June 30, 2026, the Treasury segment registered a net operating income before income tax of Ch$30,317 million, which represents a moderate YoY decrease of Ch$900 million or 2.9% compared to the 1H25. This performance was the produced by the combination of two opposing factors, including: (i) a YoY decrease of Ch$10,219 million in revenues from the management of our Trading and Debt Securities desks, mostly attributable to unfavourable movements in local interest rates in 2026 (particularly in CLF) that translated into negative fair value adjustments on fixed-income and derivatives, and (ii) further revenues from term gapping and inflation-indexation that are partly allocated to this segment due to the effect of higher inflation in 2026 and, to a lesser degree, positive balance sheet repricing. The decline in total operating revenues was to some extent offset by a net release of Ch$3,975 million in impairments of financial assets at amortized cost and at fair value through other comprehensive income for the same previously discussed reasons. Subsidiaries The net operating income before income tax of our Subsidiaries amounted to Ch$29,741 million in the 2Q26, which denote a rise of Ch$5,211 million or 21.2% compared to the 2Q25. This surge was mainly steered by: (i) an increase of Ch$3,189 million or 23.6% in net operating income before income tax earned by our Mutual Funds and Investment Funds subsidiary, due to lower impairment of non-financial assets related to investment funds managed overseas (in 2Q25) and an 8.7% expansion in average AUM focused on high- margin products, (ii) a rise of Ch$2,712 million or 26.5% in the bottom line of our Stock Brokerage subsidiary, based on higher net fee income following the participation of this subsidiary in local transactions, together with lower personnel expenses as the company paid a one-time bonus for the completion of a collective bargaining process in the 2Q25, and (iii) a rise of Ch$861 million in net operating income before income tax earned by our Investment Banking subsidiary, based on both slightly improved business activity and lower impairment of non-financial assets. These factors were in part offset by further net operating losses in the Banchile Pagos subsidiary of Ch$951 million, which is still in its start-up phase and lower net operating income before income tax by Ch$596 million explained by the merger of Socofin into the Bank in July 2025. As of June 30, 2026 our Subsidiaries recorded net operating income before income tax of Ch$62,374 million, amount that was Ch$6,854 million or 12.3% higher compared to the 1H25. This change was mainly fostered by: (i) a rise of Ch$4,936 million or 20.7% in the bottom line of our Stock Brokerage subsidiary due to increased stock trading turnover following the participation in some transactions in the local market and improved net financial income, along with lower personnel expenses as previously mentioned, (ii) higher net operating income before income tax in our Mutual Funds and Investment Funds subsidiary by Ch$3,430 million or 12.1%, largely due to higher net fee income on the grounds of an 8.7% increase in average AUM and improved margins, which coupled with lower impairment of non-financial assets mentioned earlier, and (iii) an improved bottom line of our Investment Banking subsidiary by Ch$1,120 million as a result of both enhanced activity in the local capital market and lower impairment of non-financial assets. These drivers were to some degree offset by lower net operating income before income tax by Ch$2,288 million in Banchile Pagos and Ch$632 million in Socofin, which relate to each company's stage in the lifecycle.
Management Discussion & Analysis | 44 Balance Sheet Analysis As of June 30, 2026 (In Millions of Ch$) Loan Portfolio Overall, lending activity continues to be subdued in the local banking industry. This trend would be mirroring lack of dynamism in the local economy after a disappointing macroeconomic performance in the 1H26. In this environment, according to the 2Q26 Credit Survey conducted by the Central Bank, banks seem to have restricted supply conditions for individuals and companies, except for SMEs and companies from the real estate and construction sector. Furthermore, from the demand side, as reported by the Central Bank, local banks would have continued to see a weakened demand from both individuals –particularly in consumer loans– and large companies, while demand from SMEs and companies in the real estate sector would have strengthened on a sequential basis. Aligned with these trends, the loan book managed by the industry recorded a modest 0.2% YoY expansion in real terms in May 2026 (latest available data released by the CMF). Although positive, this figure involves both a deceleration in consumer loans and commercial loans that continued to be in negative territory, all in line with findings revealed by the Central Bank's Credit Survey. Whereas the performance of consumer loans seems to be tracking the deceleration observed in consumption indicators for durable and non-durable goods in the 1H26 when compared to 2025, including the Retail Commerce Activity Index, the demand from large companies is consistent with weakened private investment, especially in terms of machinery and equipment, as reported by the Central Bank in the last Monetary Policy Report of June 2026 and a business sentiment that –according to the Monthly Entrepreneurial Confidence Index ("IMCE")– returned to negative territory in the 1H26. At this point it is clear that both the recent shock in oil prices – with second-round effects in local inflation– and the uncertainty surrounding the outcome and the timing of economic reforms proposed by the current administration have resulted in economic slowdown prompted by a more cautious approach by both individuals and companies that ultimately have resulted in subdued loan growth. The dynamics observed in the industry in terms of loan growth have also influenced the evolution of our loan book, although in a different fashion. As of June 30, 2026 our loan book amounted to Ch$40,274,221 million, which denote a 2.3% nominal YoY expansion when compared to a year earlier. Worth noting is, however, that our loan portfolio has grown 2.8% in nominal terms since December 2025, which denotes a 5.6% annualized growth rate. As mentioned last quarter, throughout the 1H26 we have managed to reenergize the lending business in some units of the Wholesale Banking Segment, which has enabled us to recover market share year-to-date. On the other hand, it is important to note that a one-time change in the accounting presentation of credit card loans impacted loan growth for the whole portfolio that, when excluding this effect, would have grown 2.9% and 3.4% compared to June 2025 and December 2025, respectively. Loan Portfolio Evolution (In Millions of Ch$ and %) 20,083,262 19,509,355 20,489,450 13,719,761 13,916,618 14,179,918 5,571,466 5,765,997 5,604,853 39,374,489 39,191,970 40,274,221 Jun-25 Dec-25 Jun-26 Commercial Loans Residential Mortgage Loans Consumer Loans +5.0% +1.9% +2.3% 51% 35% 14% (2.8)% +2.8%
Management Discussion & Analysis | 45 At the lending product level, commercial loans rose 2.0% in nominal terms compared to June 2025. However, these loans grew 5.0% since December 2025, which translates into 10.3% annualized. This quarter, most of the increase was supported by growth in both our Large Companies Banking Unit and SME Banking loans that continued to evolve positively when excluding Fogape loans. In Personal Banking, residential mortgage loans increased 3.4% in nominal terms compared to June 2025, while consumer loans grew 0.6% in the same period. As for the latter, installment loans have continued to grow above inflation, while credit card loans recorded a decline compared to June 2025 and December 2025. The decrease in credit cards was mostly due to a one-time effect caused by the migration of the credit card processing system that resulted in a revised accounting presentation of both prepayments of unbilled credit cards usage and payments of billed amounts made before the due date. Prior to the migration, these payments were booked as "payments in progress", which created a temporary liability ("other demand deposits") that was cleared against credit card loans on the due date. Under the new system, these payments are immediately cleared against credit card loans when they are received from customers. Hence, once adopted the new system, our credit card loans and other demand deposits experienced a one-time decline (compared to figures under the previous system) of ~Ch$210,000 million in June 2026. Therefore, on a proforma basis (adjusting the comparison base by this change), in June 2026 our total consumer loans would have grown 5.3% and 1.5% compared to December 2025 and June 2025, respectively. Loans by Segment (In Millions of Ch$ and %) Retail Banking 26,675,930 66.2% Wholesale Banking 13,598,291 33.8% Individuals 21,144,592 52.5% SMEs 5,531,338 13.7% Large Companies 5,577,285 13.8% Corporate 8,021,006 19.9% In terms of portfolio mix, as of June 30, 2026, our loan book was primarily composed of Retail Banking by Ch$26,675,930 million, representing 66.2% of the total portfolio, including both Personal banking loans and SMEs banking loans. Furthermore, loans managed by our Wholesale Banking segment amounted to Ch$13,598,291 million as of the same date, representing a 33.8% of the total portfolio, comprising loans handled by both the Corporate and Large Companies banking units. Within the Retail Banking loan book, Personal Banking loans amounted Ch$21,144,592 million or 79.3% of the Retail Banking portfolio, while SME loans reached Ch$5,531,338 million or 20.7% of the portfolio. The Wholesale Banking loan book, in turn, had loans to Corporations by Ch$8,021,006 million or 59.0% of the segment's book, and loans provided to Large Companies by Ch$5,577,285 million, or 41.0% of the segment's portfolio. From the loan growth perspective, as of June 30, 2026 the Retail Banking loans grew Ch$964,436 million or 3.8% on a proforma basis (Ch$719,608 million or 2.8% actual) when compared to a year earlier and Ch$476,480 million or 1.8% on a proforma basis (Ch$231,932 or 0.9% actual) since December 2025. The change in the Retail Banking loan book has been primarily steered by expansions in both Personal Banking and SME Banking loans. Even though growth in SME banking continues to be contained, this portfolio keeps on displaying a recovery in core lending, when setting aside the amortization of formerly granted Fogape loans. In the case of Personal Banking loans, on a proforma basis, growth has been conducted by Consumer loans, while Residential Mortgage loans continue to evidence slower pace of growth across the industry. Thus, the evolution of the Retail Banking loan book may be described, as follows: Personal Banking loans that, on a proforma basis, increased by Ch$751,186 million or 3.7% compared to June 2025 (Ch$506,358 million or 2.5% actual) and Ch$342,410 million or 1.7% (Ch$97,862 million or 0.5% actual) since December 2025. More specifically, the YoY growth was fostered by: • Residential Mortgage loans amounting to Ch$14,179,918 million in June 2026, which is Ch$460,157 million or 3.4% above the figure recorded a year earlier and Ch$263,300 million or 1.9% above the level reached in December 2025. This performance represents a slowdown when compared to prior quarters, in line with the slower pace of growth we are seeing for this product since the 4Q24. Though the industry has also shown a deceleration when compared to previous years, over the last year the banking system has portrayed a modest positive trend, which has translated into a market share decrease for us. Positively, this is due in part to the more selective growth we have pursued in this product over the past few quarters, which has enabled to improve lending spreads on new loans. As we highlighted in the discussion of the industry, there are several factors that explain the evolution of this lending product across the board, such as higher interest rates, demographic changes, periods of higher-than- usual inflation, tax reforms affecting the final price of properties, and real wages that have grown at a much slower pace than housing prices. More recently, there have been initiatives to mitigate this situation including the
Management Discussion & Analysis | 46 state-guaranteed program that subsidizes the interest rate paid by borrowers for properties of up to UF4,000 (~USD170,000) and, on the other hand, an economic bill presented by the Finance Ministry would remove VAT on properties, which has temporarily cooled down the demand for new homes. In this environment, our origination of residential mortgage loans reached Ch$536,988 million in the 1H26, which is 36.8% below the origination recorded in the 1H25. • Consumer loans that reached Ch$5,604,853 million on June 30, 2026. On a proforma basis, this amount represents an expansion of Ch$278,215 million or 5.3% compared to June 2025 (Ch$33,387 million or 0.6% actual) and a rise of Ch$83,404 million or 1.5% contrasted to December 2025 (Ch$161,144 million or 2.8% actual decline). As highlighted in the last report, consumer loans were showing some signs of deceleration starting the 2H25, given opposing trends in installment loans and credit card loans. However, in the 2Q26 and on a proforma basis, installment loans continued to grow consistently above inflation while credit card loans displayed a sort of acceleration. In fact, our installment loans amounted to Ch$3,430,103 million in June 2026, which represents a YoY rise of Ch$150,680 million or 4.6%. This expansion is aligned with 12-month growth rates seen throughout this year and denotes an important advance compared to the pace of growth this product showed a year ago. This is particularly important in light of the slowdown in some consumption indicators as reported by the Central Bank. As highlighted last quarter, this performance has been supported by continuously improving value offerings for the targeted segments, such as our recently announced alliance with "Linze", which will enable us to actively compete in the Auto Loans market in which we seen excellent opportunities to attract new customers while benefiting current ones. Initiatives like this allowed us to keep on growing in origination of installment loans by achieving Ch$1,188,669 million in the 1H26, which is 10.5% above the level reached in the 1H25. In addition, as of June 30, 2026 we had credit card loans by Ch$1,889,319 million. On a proforma basis, this amount represents an increase of Ch$123,945 million or 7.2% compared to June 2025 (Ch$120,883 million or 6.0% actual decline), which is above 5-6% growth rates (proforma) seen all through the 1H26. Over the last years, we have devoted efforts to continuously improve the array of value offerings and benefits for our credit card users, which has enabled us to prevent the influence of seemingly weakened consumer indicators on the use of this payment channels by our customers. These actions, together with a premium customer base, have sustained the evolution of credit card loans. SME Banking loans that grew Ch$213,250 million or 4.0% when compared to June 2025 by reaching Ch$5,531,338 million in June 2026. When compared to December 2025, this loan book increased by Ch$134,070 million or 2.5%. More importantly, core borrowing from SMEs (i.e. excluding the amortization of Fogape loans) has been the main source of growth. Accordingly, the YoY increase in this portfolio was composed of mixed factors, including: (i) Non-Fogape loans growing by Ch$504,875 million or 8.4% in nominal terms in June 2026 compared to a year earlier, which has been the result of our continues focus on customer proximity and customer knowledge in order to accompany SME customers through their entire life cycle, and (ii) Fogape loans granted just after the COVID-19 pandemic, as an economic reactivation measure, that declined Ch$299,071 million or 58.7% in the same period due to maturity. On a year-to-date basis, core lending (excluding amortization of Fogape loans) rose 3.9% in nominal terms compared to December 2025. In the Wholesale Banking segment, in turn, we have continued to see a hopeful rebound as in the last quarter. As of June 30, 2026, the segment's loan book reached Ch$13,598,291 million, which represent a nominal YoY rise of Ch$180,122 million or 1.3% when compared to a year earlier and a year-to-date nominal increase of Ch$850,319 million or 6.7%, since December 2025. Over the 2Q26 we managed to keep on originating new lending operations by deploying proactive commercial efforts through reinforced market monitoring, which has enabled us to grow faster than the industry in commercial loans in the 1H26 and regain market share. However, we are aware the economy is performing below expectations. Actually, the Central Bank has revised downwards the growth forecast for private investment and GDP for 2026, which could further weaken the demand for commercial loans if the economic reactivation bill that is been discussed in the Congress takes longer than expected to be approved or its reforms do not have an immediate positive outcome on economic growth. In summary, the recent evolution of the Wholesale Banking loan book may be described as follows: The loan book managed by our Large Companies Banking Unit accounted for Ch$5,577,285 million on June 30, 2026. This amount was Ch$95,448 million or 1.7% above the figure recorded a year earlier and Ch$232,598 million or 4.4% over the level recorded in December 2025. The 12-month change was primarily produced by almost equal increases in Commercial Credits (Ch$78,998 million or 2.5%) and Leasing loans (Ch$78,059 million or 6.5%) given improved focus on commercial efforts and improvements we have made to the value offerings for the leasing business over the last years. These factors, in turn, were to some degree offset by a decline of Ch$62,308 million or 7.1% in Trade Finance loans, which is aligned with the contraction seen at the industry level that could be partially related to disruptions in global supply chains due to geopolitical
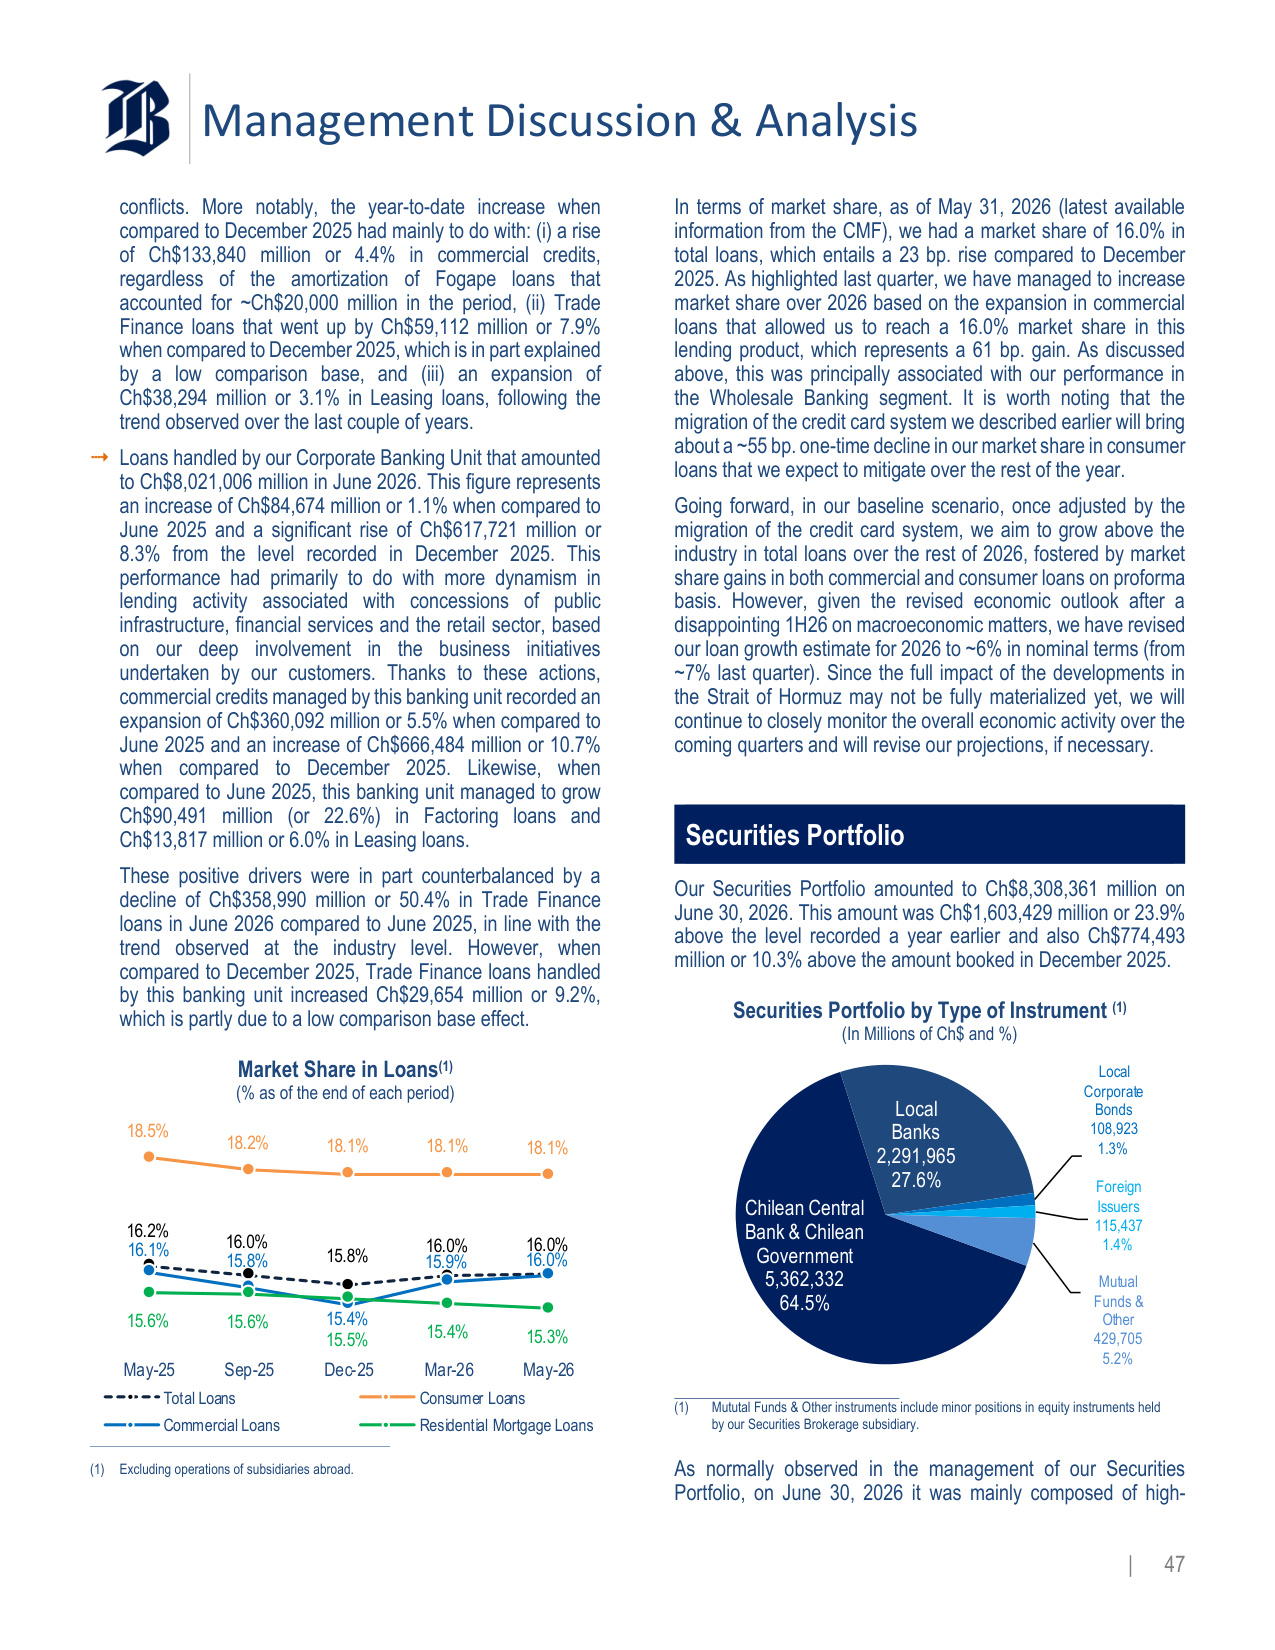
Management Discussion & Analysis | 47 conflicts. More notably, the year-to-date increase when compared to December 2025 had mainly to do with: (i) a rise of Ch$133,840 million or 4.4% in commercial credits, regardless of the amortization of Fogape loans that accounted for ~Ch$20,000 million in the period, (ii) Trade Finance loans that went up by Ch$59,112 million or 7.9% when compared to December 2025, which is in part explained by a low comparison base, and (iii) an expansion of Ch$38,294 million or 3.1% in Leasing loans, following the trend observed over the last couple of years. Loans handled by our Corporate Banking Unit that amounted to Ch$8,021,006 million in June 2026. This figure represents an increase of Ch$84,674 million or 1.1% when compared to June 2025 and a significant rise of Ch$617,721 million or 8.3% from the level recorded in December 2025. This performance had primarily to do with more dynamism in lending activity associated with concessions of public infrastructure, financial services and the retail sector, based on our deep involvement in the business initiatives undertaken by our customers. Thanks to these actions, commercial credits managed by this banking unit recorded an expansion of Ch$360,092 million or 5.5% when compared to June 2025 and an increase of Ch$666,484 million or 10.7% when compared to December 2025. Likewise, when compared to June 2025, this banking unit managed to grow Ch$90,491 million (or 22.6%) in Factoring loans and Ch$13,817 million or 6.0% in Leasing loans. These positive drivers were in part counterbalanced by a decline of Ch$358,990 million or 50.4% in Trade Finance loans in June 2026 compared to June 2025, in line with the trend observed at the industry level. However, when compared to December 2025, Trade Finance loans handled by this banking unit increased Ch$29,654 million or 9.2%, which is partly due to a low comparison base effect. Market Share in Loans(1) (% as of the end of each period) 16.2% 16.0% 15.8% 16.0% 16.0% 18.5% 18.2% 18.1% 18.1% 18.1% 16.1% 15.8% 15.4% 15.9% 16.0% 15.6% 15.6% 15.5% 15.4% 15.3% May-25 Sep-25 Dec-25 Mar-26 May-26 Total Loans Consumer Loans Commercial Loans Residential Mortgage Loans (1) Excluding operations of subsidiaries abroad. In terms of market share, as of May 31, 2026 (latest available information from the CMF), we had a market share of 16.0% in total loans, which entails a 23 bp. rise compared to December 2025. As highlighted last quarter, we have managed to increase market share over 2026 based on the expansion in commercial loans that allowed us to reach a 16.0% market share in this lending product, which represents a 61 bp. gain. As discussed above, this was principally associated with our performance in the Wholesale Banking segment. It is worth noting that the migration of the credit card system we described earlier will bring about a ~55 bp. one-time decline in our market share in consumer loans that we expect to mitigate over the rest of the year. Going forward, in our baseline scenario, once adjusted by the migration of the credit card system, we aim to grow above the industry in total loans over the rest of 2026, fostered by market share gains in both commercial and consumer loans on proforma basis. However, given the revised economic outlook after a disappointing 1H26 on macroeconomic matters, we have revised our loan growth estimate for 2026 to ~6% in nominal terms (from ~7% last quarter). Since the full impact of the developments in the Strait of Hormuz may not be fully materialized yet, we will continue to closely monitor the overall economic activity over the coming quarters and will revise our projections, if necessary. Securities Portfolio Our Securities Portfolio amounted to Ch$8,308,361 million on June 30, 2026. This amount was Ch$1,603,429 million or 23.9% above the level recorded a year earlier and also Ch$774,493 million or 10.3% above the amount booked in December 2025. Securities Portfolio by Type of Instrument (1) (In Millions of Ch$ and %) Chilean Central Bank & Chilean Government 5,362,332 64.5% Local Banks 2,291,965 27.6% Local Corporate Bonds 108,923 1.3% Foreign Issuers 115,437 1.4% Mutual Funds & Other 429,705 5.2% (1) Mututal Funds & Other instruments include minor positions in equity instruments held by our Securities Brokerage subsidiary. As normally observed in the management of our Securities Portfolio, on June 30, 2026 it was mainly composed of high-
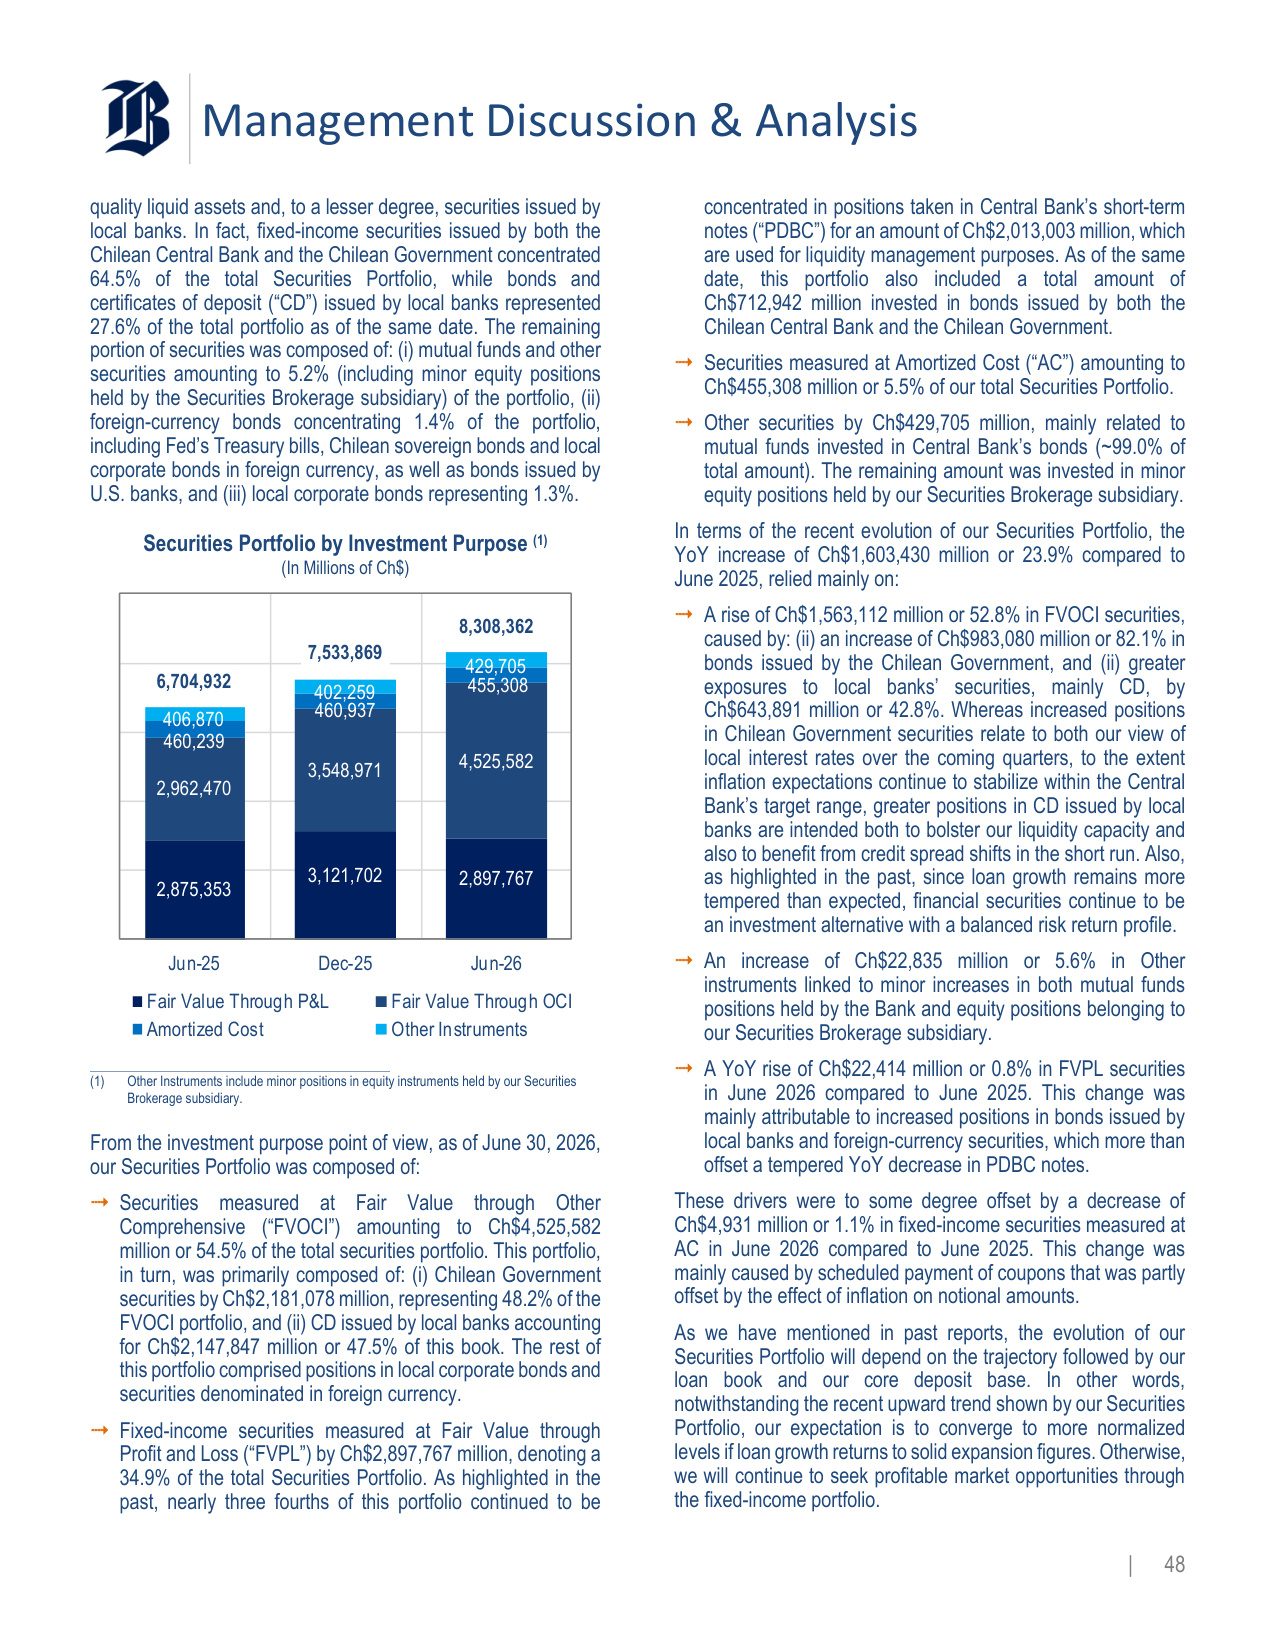
Management Discussion & Analysis | 48 quality liquid assets and, to a lesser degree, securities issued by local banks. In fact, fixed-income securities issued by both the Chilean Central Bank and the Chilean Government concentrated 64.5% of the total Securities Portfolio, while bonds and certificates of deposit ("CD") issued by local banks represented 27.6% of the total portfolio as of the same date. The remaining portion of securities was composed of: (i) mutual funds and other securities amounting to 5.2% (including minor equity positions held by the Securities Brokerage subsidiary) of the portfolio, (ii) foreign-currency bonds concentrating 1.4% of the portfolio, including Fed's Treasury bills, Chilean sovereign bonds and local corporate bonds in foreign currency, as well as bonds issued by U.S. banks, and (iii) local corporate bonds representing 1.3%. Securities Portfolio by Investment Purpose (1) (In Millions of Ch$) 2,875,353 3,121,702 2,897,767 2,962,470 3,548,971 4,525,582 460,239 460,937 455,308 406,870 402,259 429,705 6,704,932 7,533,869 8,308,362 Jun-25 Dec-25 Jun-26 Fair Value Through P&L Fair Value Through OCI Amortized Cost Other Instruments (1) Other Instruments include minor positions in equity instruments held by our Securities Brokerage subsidiary. From the investment purpose point of view, as of June 30, 2026, our Securities Portfolio was composed of: Securities measured at Fair Value through Other Comprehensive ("FVOCI") amounting to Ch$4,525,582 million or 54.5% of the total securities portfolio. This portfolio, in turn, was primarily composed of: (i) Chilean Government securities by Ch$2,181,078 million, representing 48.2% of the FVOCI portfolio, and (ii) CD issued by local banks accounting for Ch$2,147,847 million or 47.5% of this book. The rest of this portfolio comprised positions in local corporate bonds and securities denominated in foreign currency. Fixed-income securities measured at Fair Value through Profit and Loss ("FVPL") by Ch$2,897,767 million, denoting a 34.9% of the total Securities Portfolio. As highlighted in the past, nearly three fourths of this portfolio continued to be concentrated in positions taken in Central Bank's short-term notes ("PDBC") for an amount of Ch$2,013,003 million, which are used for liquidity management purposes. As of the same date, this portfolio also included a total amount of Ch$712,942 million invested in bonds issued by both the Chilean Central Bank and the Chilean Government. Securities measured at Amortized Cost ("AC") amounting to Ch$455,308 million or 5.5% of our total Securities Portfolio. Other securities by Ch$429,705 million, mainly related to mutual funds invested in Central Bank's bonds (~99.0% of total amount). The remaining amount was invested in minor equity positions held by our Securities Brokerage subsidiary. In terms of the recent evolution of our Securities Portfolio, the YoY increase of Ch$1,603,430 million or 23.9% compared to June 2025, relied mainly on: A rise of Ch$1,563,112 million or 52.8% in FVOCI securities, caused by: (ii) an increase of Ch$983,080 million or 82.1% in bonds issued by the Chilean Government, and (ii) greater exposures to local banks' securities, mainly CD, by Ch$643,891 million or 42.8%. Whereas increased positions in Chilean Government securities relate to both our view of local interest rates over the coming quarters, to the extent inflation expectations continue to stabilize within the Central Bank's target range, greater positions in CD issued by local banks are intended both to bolster our liquidity capacity and also to benefit from credit spread shifts in the short run. Also, as highlighted in the past, since loan growth remains more tempered than expected, financial securities continue to be an investment alternative with a balanced risk return profile. An increase of Ch$22,835 million or 5.6% in Other instruments linked to minor increases in both mutual funds positions held by the Bank and equity positions belonging to our Securities Brokerage subsidiary. A YoY rise of Ch$22,414 million or 0.8% in FVPL securities in June 2026 compared to June 2025. This change was mainly attributable to increased positions in bonds issued by local banks and foreign-currency securities, which more than offset a tempered YoY decrease in PDBC notes. These drivers were to some degree offset by a decrease of Ch$4,931 million or 1.1% in fixed-income securities measured at AC in June 2026 compared to June 2025. This change was mainly caused by scheduled payment of coupons that was partly offset by the effect of inflation on notional amounts. As we have mentioned in past reports, the evolution of our Securities Portfolio will depend on the trajectory followed by our loan book and our core deposit base. In other words, notwithstanding the recent upward trend shown by our Securities Portfolio, our expectation is to converge to more normalized levels if loan growth returns to solid expansion figures. Otherwise, we will continue to seek profitable market opportunities through the fixed-income portfolio.
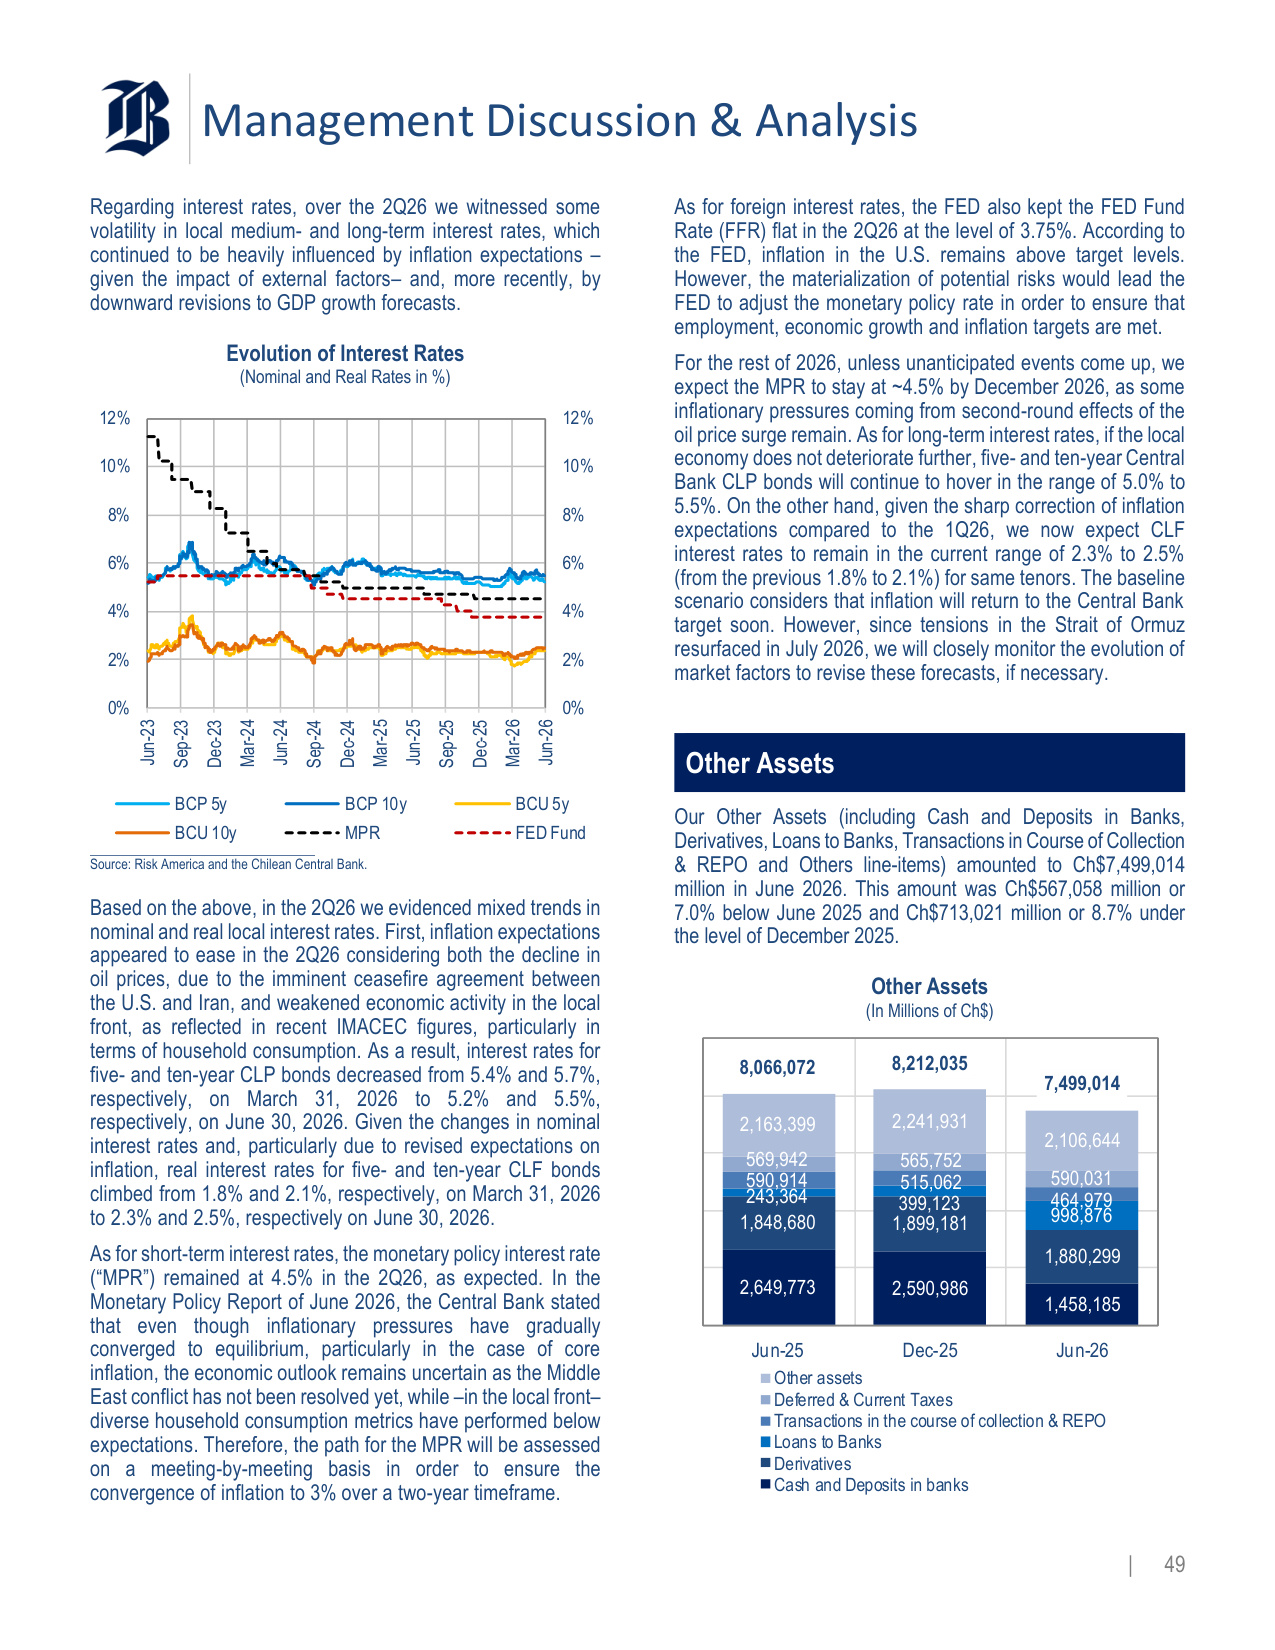
Management Discussion & Analysis | 49 Regarding interest rates, over the 2Q26 we witnessed some volatility in local medium- and long-term interest rates, which continued to be heavily influenced by inflation expectations – given the impact of external factors– and, more recently, by downward revisions to GDP growth forecasts. Evolution of Interest Rates (Nominal and Real Rates in %) 0% 2% 4% 6% 8% 10% 12% 0% 2% 4% 6% 8% 10% 12% Jun-23 Sep-23 Dec-23 Mar-24 Jun-24 Sep-24 Dec-24 Mar-25 Jun-25 Sep-25 Dec-25 Mar-26 Jun-26 BCP 5y BCP 10y BCU 5y BCU 10y MPR FED Fund Source: Risk America and the Chilean Central Bank. Based on the above, in the 2Q26 we evidenced mixed trends in nominal and real local interest rates. First, inflation expectations appeared to ease in the 2Q26 considering both the decline in oil prices, due to the imminent ceasefire agreement between the U.S. and Iran, and weakened economic activity in the local front, as reflected in recent IMACEC figures, particularly in terms of household consumption. As a result, interest rates for five- and ten-year CLP bonds decreased from 5.4% and 5.7%, respectively, on March 31, 2026 to 5.2% and 5.5%, respectively, on June 30, 2026. Given the changes in nominal interest rates and, particularly due to revised expectations on inflation, real interest rates for five- and ten-year CLF bonds climbed from 1.8% and 2.1%, respectively, on March 31, 2026 to 2.3% and 2.5%, respectively on June 30, 2026. As for short-term interest rates, the monetary policy interest rate ("MPR") remained at 4.5% in the 2Q26, as expected. In the Monetary Policy Report of June 2026, the Central Bank stated that even though inflationary pressures have gradually converged to equilibrium, particularly in the case of core inflation, the economic outlook remains uncertain as the Middle East conflict has not been resolved yet, while –in the local front– diverse household consumption metrics have performed below expectations. Therefore, the path for the MPR will be assessed on a meeting-by-meeting basis in order to ensure the convergence of inflation to 3% over a two-year timeframe. As for foreign interest rates, the FED also kept the FED Fund Rate (FFR) flat in the 2Q26 at the level of 3.75%. According to the FED, inflation in the U.S. remains above target levels. However, the materialization of potential risks would lead the FED to adjust the monetary policy rate in order to ensure that employment, economic growth and inflation targets are met. For the rest of 2026, unless unanticipated events come up, we expect the MPR to stay at ~4.5% by December 2026, as some inflationary pressures coming from second-round effects of the oil price surge remain. As for long-term interest rates, if the local economy does not deteriorate further, five- and ten-year Central Bank CLP bonds will continue to hover in the range of 5.0% to 5.5%. On the other hand, given the sharp correction of inflation expectations compared to the 1Q26, we now expect CLF interest rates to remain in the current range of 2.3% to 2.5% (from the previous 1.8% to 2.1%) for same tenors. The baseline scenario considers that inflation will return to the Central Bank target soon. However, since tensions in the Strait of Ormuz resurfaced in July 2026, we will closely monitor the evolution of market factors to revise these forecasts, if necessary. Other Assets Our Other Assets (including Cash and Deposits in Banks, Derivatives, Loans to Banks, Transactions in Course of Collection & REPO and Others line-items) amounted to Ch$7,499,014 million in June 2026. This amount was Ch$567,058 million or 7.0% below June 2025 and Ch$713,021 million or 8.7% under the level of December 2025. Other Assets (In Millions of Ch$) 2,649,773 2,590,986 1,458,185 1,848,680 1,899,181 1,880,299 243,364 399,123 998,876 590,914 515,062 464,979 569,942 565,752 590,031 2,163,399 2,241,931 2,106,644 8,066,072 8,212,035 7,499,014 Jun-25 Dec-25 Jun-26 Other assets Deferred & Current Taxes Transactions in the course of collection & REPO Loans to Banks Derivatives Cash and Deposits in banks
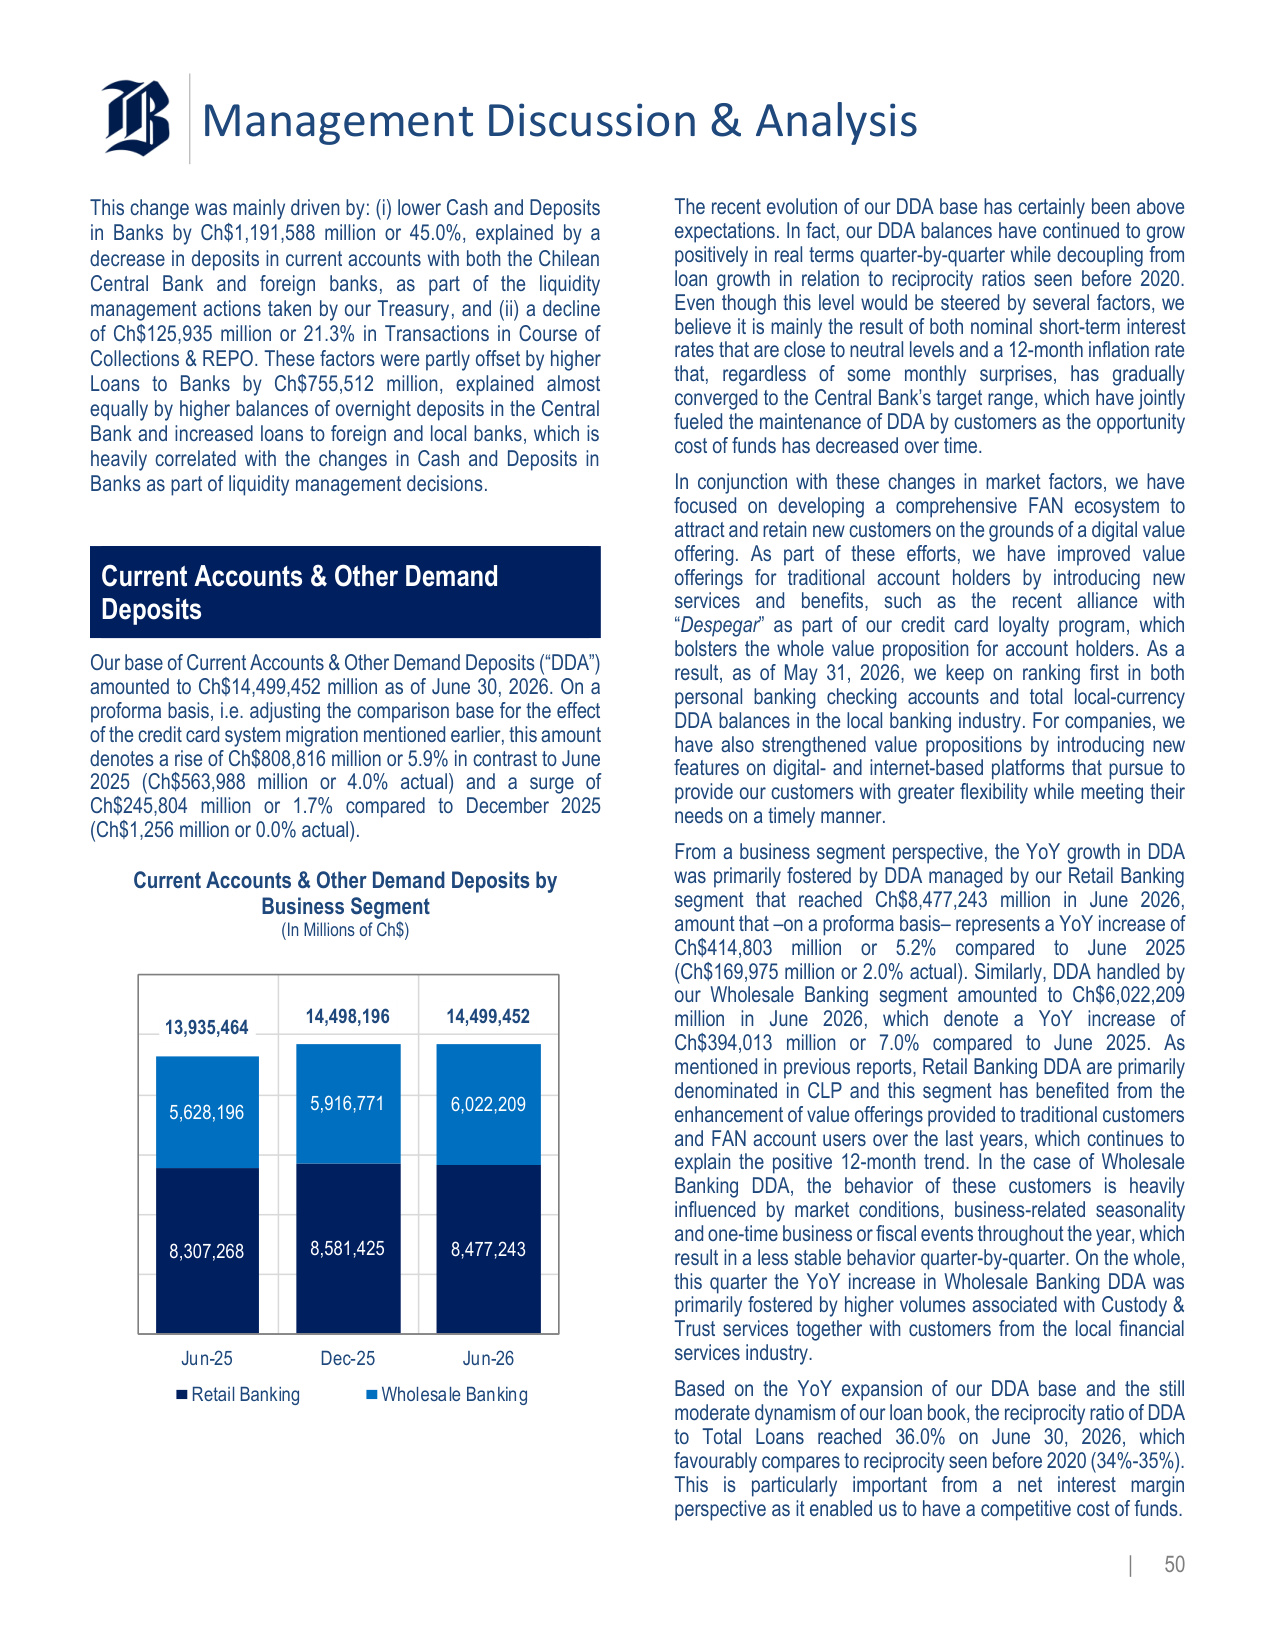
Management Discussion & Analysis | 50 This change was mainly driven by: (i) lower Cash and Deposits in Banks by Ch$1,191,588 million or 45.0%, explained by a decrease in deposits in current accounts with both the Chilean Central Bank and foreign banks, as part of the liquidity management actions taken by our Treasury, and (ii) a decline of Ch$125,935 million or 21.3% in Transactions in Course of Collections & REPO. These factors were partly offset by higher Loans to Banks by Ch$755,512 million, explained almost equally by higher balances of overnight deposits in the Central Bank and increased loans to foreign and local banks, which is heavily correlated with the changes in Cash and Deposits in Banks as part of liquidity management decisions. Current Accounts & Other Demand Deposits Our base of Current Accounts & Other Demand Deposits ("DDA") amounted to Ch$14,499,452 million as of June 30, 2026. On a proforma basis, i.e. adjusting the comparison base for the effect of the credit card system migration mentioned earlier, this amount denotes a rise of Ch$808,816 million or 5.9% in contrast to June 2025 (Ch$563,988 million or 4.0% actual) and a surge of Ch$245,804 million or 1.7% compared to December 2025 (Ch$1,256 million or 0.0% actual). Current Accounts & Other Demand Deposits by Business Segment (In Millions of Ch$) 8,307,268 8,581,425 8,477,243 5,628,196 5,916,771 6,022,209 13,935,464 14,498,196 14,499,452 Jun-25 Dec-25 Jun-26 Retail Banking Wholesale Banking The recent evolution of our DDA base has certainly been above expectations. In fact, our DDA balances have continued to grow positively in real terms quarter-by-quarter while decoupling from loan growth in relation to reciprocity ratios seen before 2020. Even though this level would be steered by several factors, we believe it is mainly the result of both nominal short-term interest rates that are close to neutral levels and a 12-month inflation rate that, regardless of some monthly surprises, has gradually converged to the Central Bank's target range, which have jointly fueled the maintenance of DDA by customers as the opportunity cost of funds has decreased over time. In conjunction with these changes in market factors, we have focused on developing a comprehensive FAN ecosystem to attract and retain new customers on the grounds of a digital value offering. As part of these efforts, we have improved value offerings for traditional account holders by introducing new services and benefits, such as the recent alliance with "Despegar" as part of our credit card loyalty program, which bolsters the whole value proposition for account holders. As a result, as of May 31, 2026, we keep on ranking first in both personal banking checking accounts and total local-currency DDA balances in the local banking industry. For companies, we have also strengthened value propositions by introducing new features on digital- and internet-based platforms that pursue to provide our customers with greater flexibility while meeting their needs on a timely manner. From a business segment perspective, the YoY growth in DDA was primarily fostered by DDA managed by our Retail Banking segment that reached Ch$8,477,243 million in June 2026, amount that –on a proforma basis– represents a YoY increase of Ch$414,803 million or 5.2% compared to June 2025 (Ch$169,975 million or 2.0% actual). Similarly, DDA handled by our Wholesale Banking segment amounted to Ch$6,022,209 million in June 2026, which denote a YoY increase of Ch$394,013 million or 7.0% compared to June 2025. As mentioned in previous reports, Retail Banking DDA are primarily denominated in CLP and this segment has benefited from the enhancement of value offerings provided to traditional customers and FAN account users over the last years, which continues to explain the positive 12-month trend. In the case of Wholesale Banking DDA, the behavior of these customers is heavily influenced by market conditions, business-related seasonality and one-time business or fiscal events throughout the year, which result in a less stable behavior quarter-by-quarter. On the whole, this quarter the YoY increase in Wholesale Banking DDA was primarily fostered by higher volumes associated with Custody & Trust services together with customers from the local financial services industry. Based on the YoY expansion of our DDA base and the still moderate dynamism of our loan book, the reciprocity ratio of DDA to Total Loans reached 36.0% on June 30, 2026, which favourably compares to reciprocity seen before 2020 (34%-35%). This is particularly important from a net interest margin perspective as it enabled us to have a competitive cost of funds.
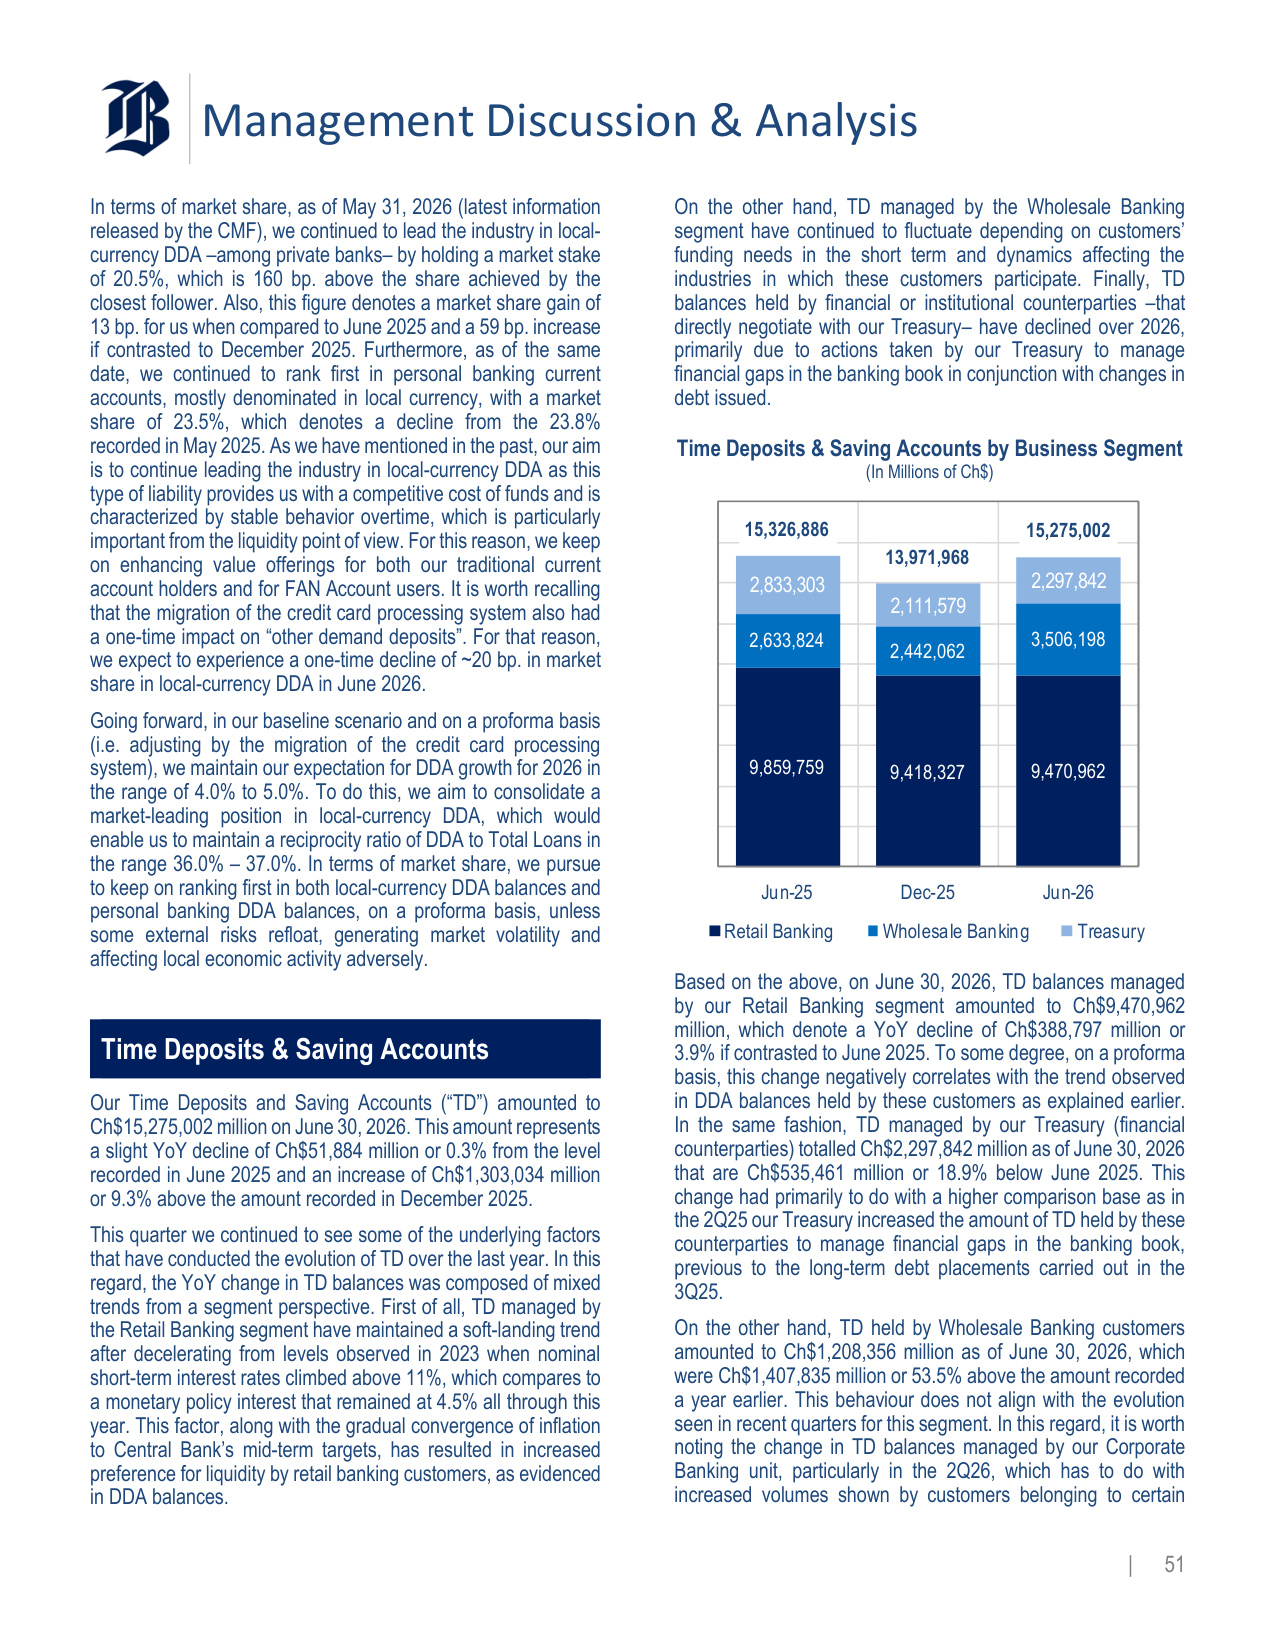
Management Discussion & Analysis | 51 In terms of market share, as of May 31, 2026 (latest information released by the CMF), we continued to lead the industry in local- currency DDA –among private banks– by holding a market stake of 20.5%, which is 160 bp. above the share achieved by the closest follower. Also, this figure denotes a market share gain of 13 bp. for us when compared to June 2025 and a 59 bp. increase if contrasted to December 2025. Furthermore, as of the same date, we continued to rank first in personal banking current accounts, mostly denominated in local currency, with a market share of 23.5%, which denotes a decline from the 23.8% recorded in May 2025. As we have mentioned in the past, our aim is to continue leading the industry in local-currency DDA as this type of liability provides us with a competitive cost of funds and is characterized by stable behavior overtime, which is particularly important from the liquidity point of view. For this reason, we keep on enhancing value offerings for both our traditional current account holders and for FAN Account users. It is worth recalling that the migration of the credit card processing system also had a one-time impact on "other demand deposits". For that reason, we expect to experience a one-time decline of ~20 bp. in market share in local-currency DDA in June 2026. Going forward, in our baseline scenario and on a proforma basis (i.e. adjusting by the migration of the credit card processing system), we maintain our expectation for DDA growth for 2026 in the range of 4.0% to 5.0%. To do this, we aim to consolidate a market-leading position in local-currency DDA, which would enable us to maintain a reciprocity ratio of DDA to Total Loans in the range 36.0% – 37.0%. In terms of market share, we pursue to keep on ranking first in both local-currency DDA balances and personal banking DDA balances, on a proforma basis, unless some external risks refloat, generating market volatility and affecting local economic activity adversely. Time Deposits & Saving Accounts Our Time Deposits and Saving Accounts ("TD") amounted to Ch$15,275,002 million on June 30, 2026. This amount represents a slight YoY decline of Ch$51,884 million or 0.3% from the level recorded in June 2025 and an increase of Ch$1,303,034 million or 9.3% above the amount recorded in December 2025. This quarter we continued to see some of the underlying factors that have conducted the evolution of TD over the last year. In this regard, the YoY change in TD balances was composed of mixed trends from a segment perspective. First of all, TD managed by the Retail Banking segment have maintained a soft-landing trend after decelerating from levels observed in 2023 when nominal short-term interest rates climbed above 11%, which compares to a monetary policy interest that remained at 4.5% all through this year. This factor, along with the gradual convergence of inflation to Central Bank's mid-term targets, has resulted in increased preference for liquidity by retail banking customers, as evidenced in DDA balances. On the other hand, TD managed by the Wholesale Banking segment have continued to fluctuate depending on customers' funding needs in the short term and dynamics affecting the industries in which these customers participate. Finally, TD balances held by financial or institutional counterparties –that directly negotiate with our Treasury– have declined over 2026, primarily due to actions taken by our Treasury to manage financial gaps in the banking book in conjunction with changes in debt issued. Time Deposits & Saving Accounts by Business Segment (In Millions of Ch$) 9,859,759 9,418,327 9,470,962 2,633,824 2,442,062 3,506,198 2,833,303 2,111,579 2,297,842 15,326,886 13,971,968 15,275,002 Jun-25 Dec-25 Jun-26 Retail Banking Wholesale Banking Treasury Based on the above, on June 30, 2026, TD balances managed by our Retail Banking segment amounted to Ch$9,470,962 million, which denote a YoY decline of Ch$388,797 million or 3.9% if contrasted to June 2025. To some degree, on a proforma basis, this change negatively correlates with the trend observed in DDA balances held by these customers as explained earlier. In the same fashion, TD managed by our Treasury (financial counterparties) totalled Ch$2,297,842 million as of June 30, 2026 that are Ch$535,461 million or 18.9% below June 2025. This change had primarily to do with a higher comparison base as in the 2Q25 our Treasury increased the amount of TD held by these counterparties to manage financial gaps in the banking book, previous to the long-term debt placements carried out in the 3Q25. On the other hand, TD held by Wholesale Banking customers amounted to Ch$1,208,356 million as of June 30, 2026, which were Ch$1,407,835 million or 53.5% above the amount recorded a year earlier. This behaviour does not align with the evolution seen in recent quarters for this segment. In this regard, it is worth noting the change in TD balances managed by our Corporate Banking unit, particularly in the 2Q26, which has to do with increased volumes shown by customers belonging to certain
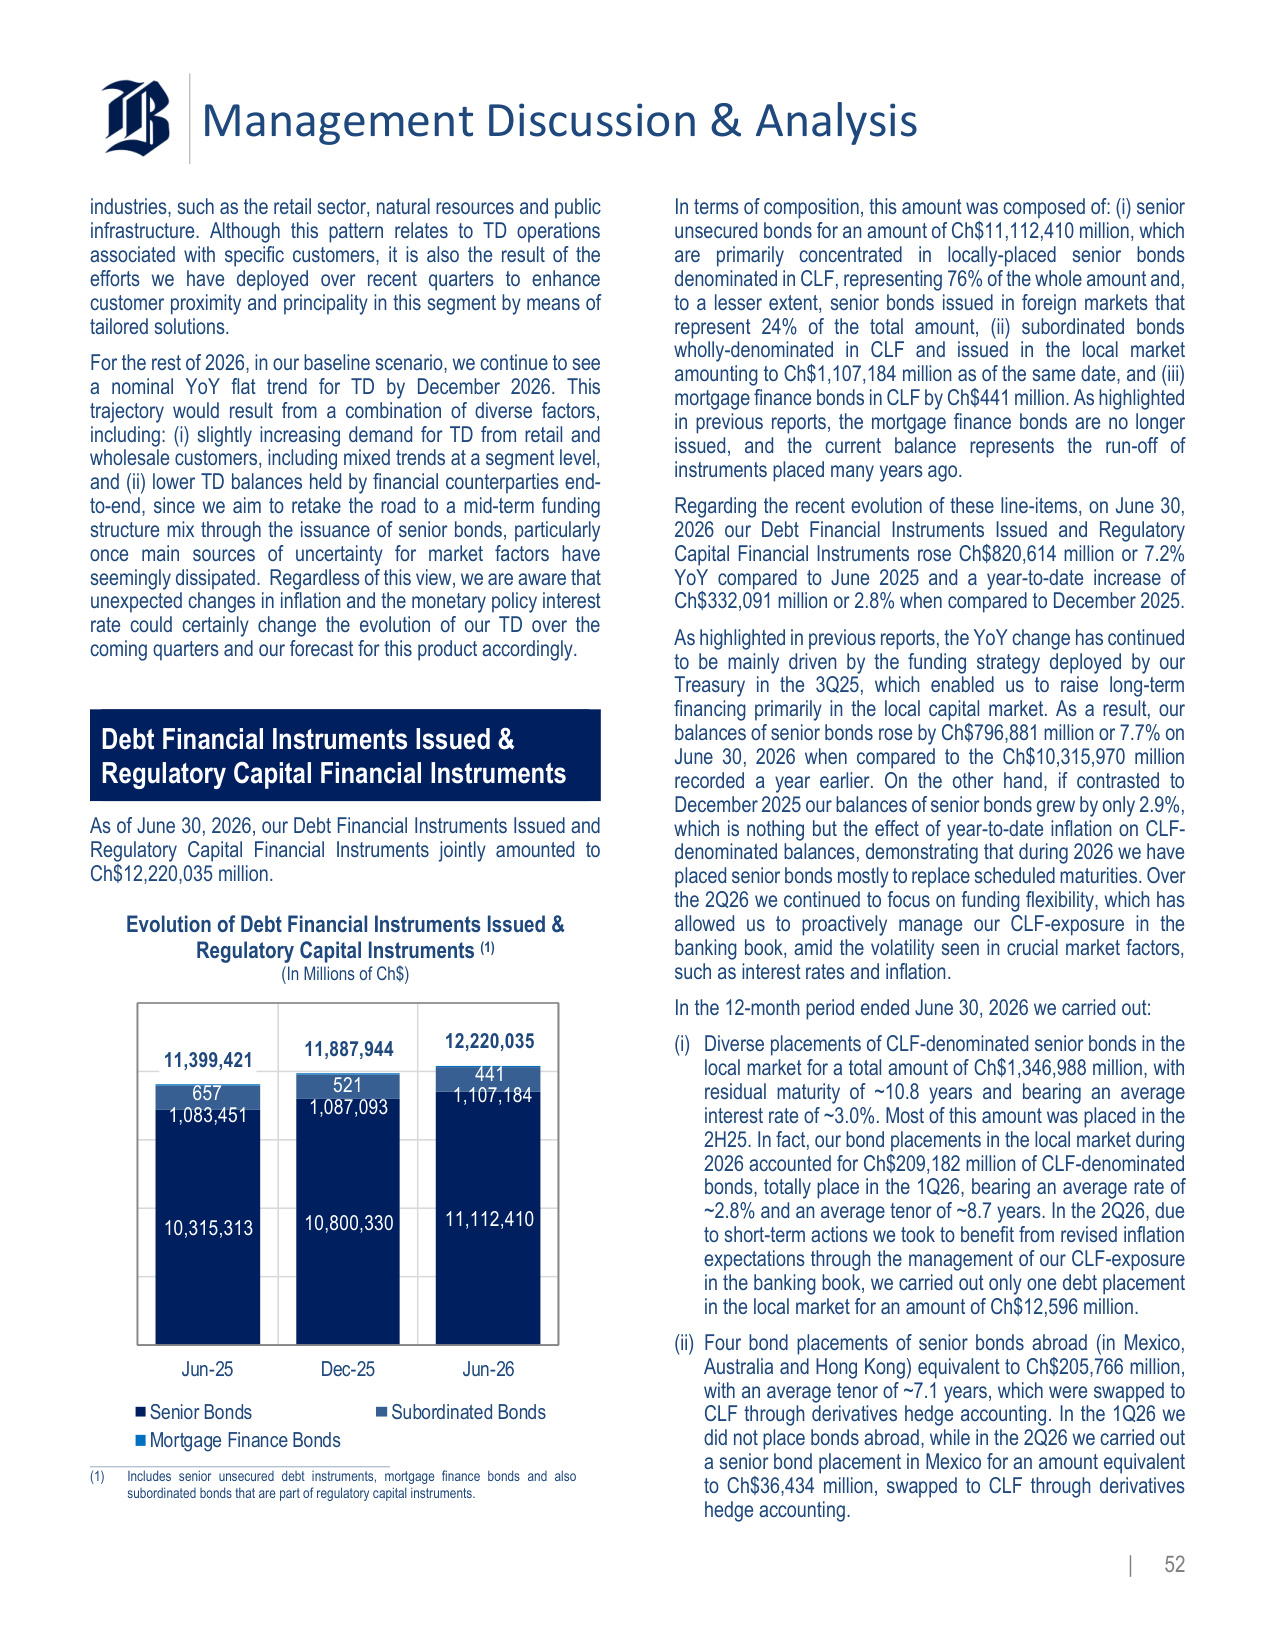
Management Discussion & Analysis | 52 industries, such as the retail sector, natural resources and public infrastructure. Although this pattern relates to TD operations associated with specific customers, it is also the result of the efforts we have deployed over recent quarters to enhance customer proximity and principality in this segment by means of tailored solutions. For the rest of 2026, in our baseline scenario, we continue to see a nominal YoY flat trend for TD by December 2026. This trajectory would result from a combination of diverse factors, including: (i) slightly increasing demand for TD from retail and wholesale customers, including mixed trends at a segment level, and (ii) lower TD balances held by financial counterparties end- to-end, since we aim to retake the road to a mid-term funding structure mix through the issuance of senior bonds, particularly once main sources of uncertainty for market factors have seemingly dissipated. Regardless of this view, we are aware that unexpected changes in inflation and the monetary policy interest rate could certainly change the evolution of our TD over the coming quarters and our forecast for this product accordingly. Debt Financial Instruments Issued & Regulatory Capital Financial Instruments As of June 30, 2026, our Debt Financial Instruments Issued and Regulatory Capital Financial Instruments jointly amounted to Ch$12,220,035 million. Evolution of Debt Financial Instruments Issued & Regulatory Capital Instruments (1) (In Millions of Ch$) 10,315,313 10,800,330 11,112,410 1,083,451 1,087,093 1,107,184 657 521 441 11,399,421 11,887,944 12,220,035 Jun-25 Dec-25 Jun-26 Senior Bonds Subordinated Bonds Mortgage Finance Bonds (1) Includes senior unsecured debt instruments, mortgage finance bonds and also subordinated bonds that are part of regulatory capital instruments. In terms of composition, this amount was composed of: (i) senior unsecured bonds for an amount of Ch$11,112,410 million, which are primarily concentrated in locally-placed senior bonds denominated in CLF, representing 76% of the whole amount and, to a lesser extent, senior bonds issued in foreign markets that represent 24% of the total amount, (ii) subordinated bonds wholly-denominated in CLF and issued in the local market amounting to Ch$1,107,184 million as of the same date, and (iii) mortgage finance bonds in CLF by Ch$441 million. As highlighted in previous reports, the mortgage finance bonds are no longer issued, and the current balance represents the run-off of instruments placed many years ago. Regarding the recent evolution of these line-items, on June 30, 2026 our Debt Financial Instruments Issued and Regulatory Capital Financial Instruments rose Ch$820,614 million or 7.2% YoY compared to June 2025 and a year-to-date increase of Ch$332,091 million or 2.8% when compared to December 2025. As highlighted in previous reports, the YoY change has continued to be mainly driven by the funding strategy deployed by our Treasury in the 3Q25, which enabled us to raise long-term financing primarily in the local capital market. As a result, our balances of senior bonds rose by Ch$796,881 million or 7.7% on June 30, 2026 when compared to the Ch$10,315,970 million recorded a year earlier. On the other hand, if contrasted to December 2025 our balances of senior bonds grew by only 2.9%, which is nothing but the effect of year-to-date inflation on CLF- denominated balances, demonstrating that during 2026 we have placed senior bonds mostly to replace scheduled maturities. Over the 2Q26 we continued to focus on funding flexibility, which has allowed us to proactively manage our CLF-exposure in the banking book, amid the volatility seen in crucial market factors, such as interest rates and inflation. In the 12-month period ended June 30, 2026 we carried out: (i) Diverse placements of CLF-denominated senior bonds in the local market for a total amount of Ch$1,346,988 million, with residual maturity of ~10.8 years and bearing an average interest rate of ~3.0%. Most of this amount was placed in the 2H25. In fact, our bond placements in the local market during 2026 accounted for Ch$209,182 million of CLF-denominated bonds, totally place in the 1Q26, bearing an average rate of ~2.8% and an average tenor of ~8.7 years. In the 2Q26, due to short-term actions we took to benefit from revised inflation expectations through the management of our CLF-exposure in the banking book, we carried out only one debt placement in the local market for an amount of Ch$12,596 million. (ii) Four bond placements of senior bonds abroad (in Mexico, Australia and Hong Kong) equivalent to Ch$205,766 million, with an average tenor of ~7.1 years, which were swapped to CLF through derivatives hedge accounting. In the 1Q26 we did not place bonds abroad, while in the 2Q26 we carried out a senior bond placement in Mexico for an amount equivalent to Ch$36,434 million, swapped to CLF through derivatives hedge accounting.
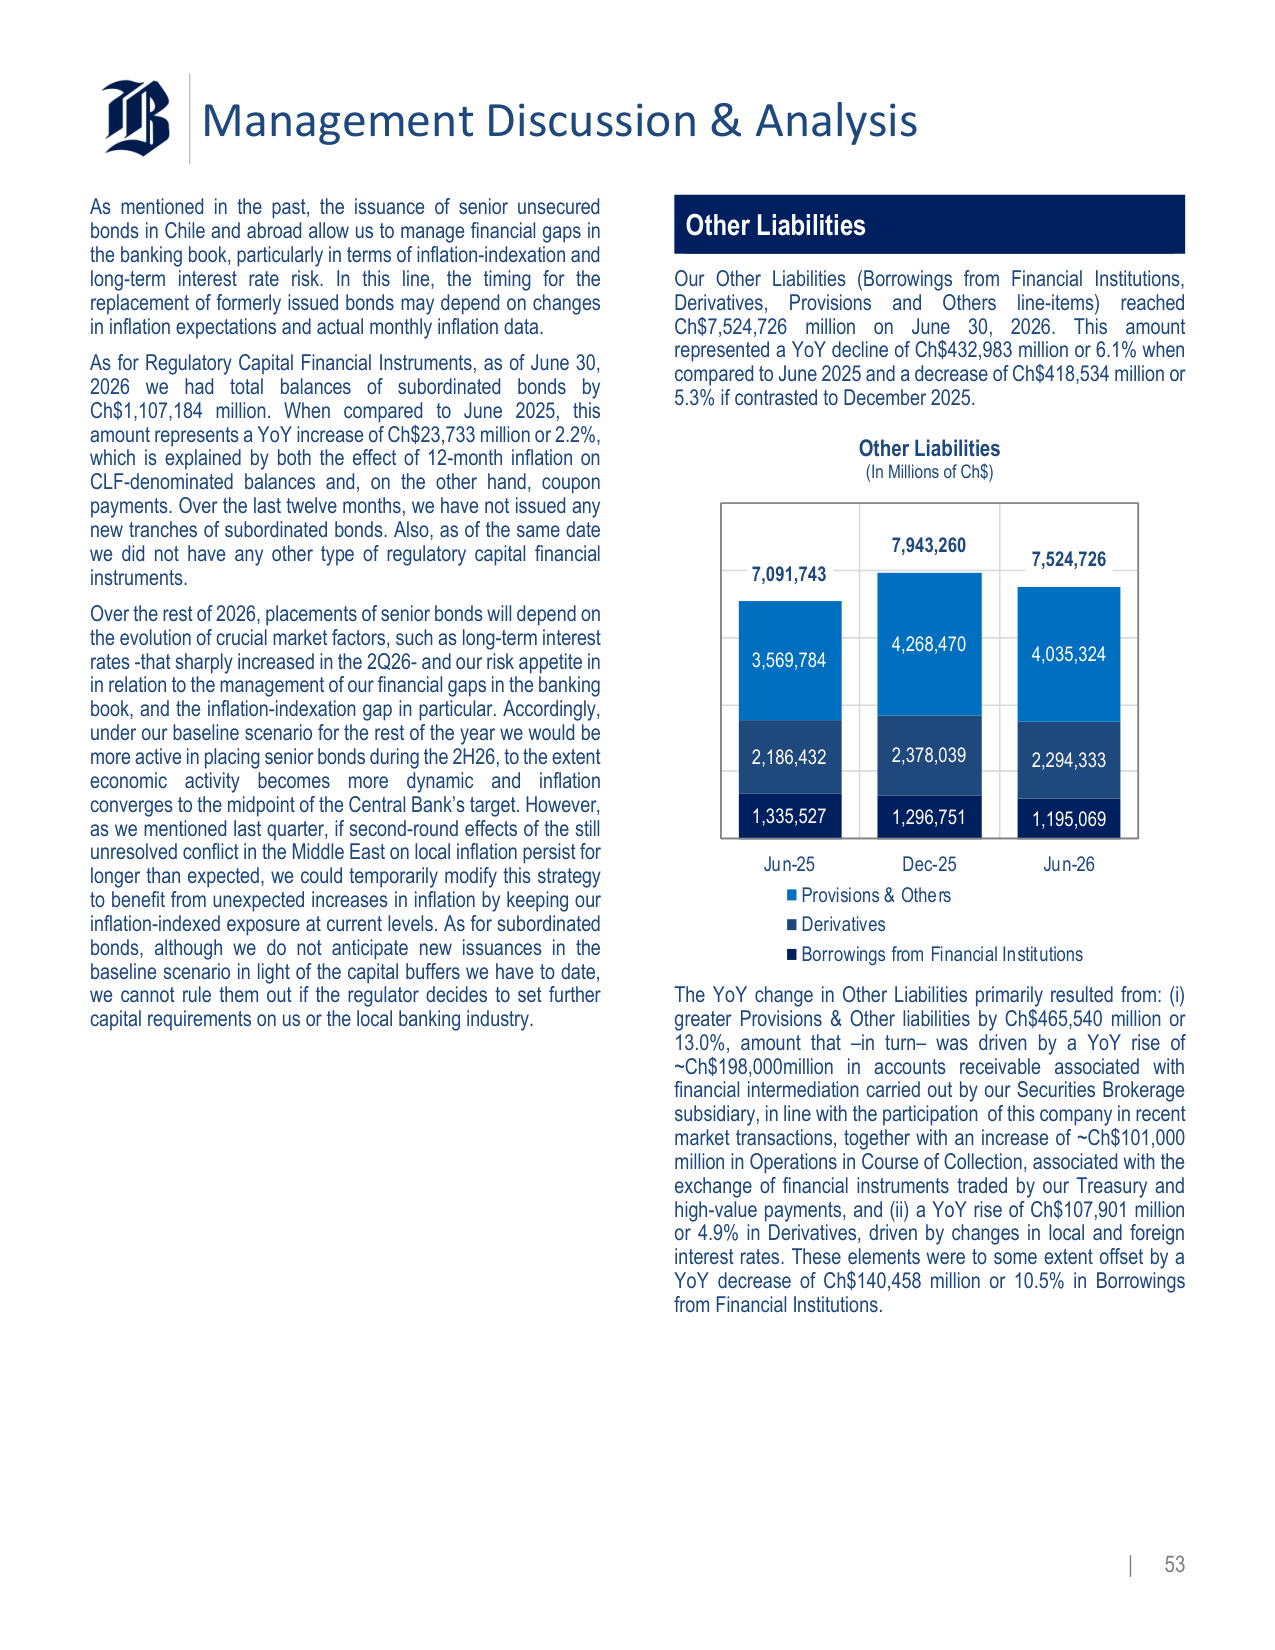
Management Discussion & Analysis | 53 As mentioned in the past, the issuance of senior unsecured bonds in Chile and abroad allow us to manage financial gaps in the banking book, particularly in terms of inflation-indexation and long-term interest rate risk. In this line, the timing for the replacement of formerly issued bonds may depend on changes in inflation expectations and actual monthly inflation data. As for Regulatory Capital Financial Instruments, as of June 30, 2026 we had total balances of subordinated bonds by Ch$1,107,184 million. When compared to June 2025, this amount represents a YoY increase of Ch$23,733 million or 2.2%, which is explained by both the effect of 12-month inflation on CLF-denominated balances and, on the other hand, coupon payments. Over the last twelve months, we have not issued any new tranches of subordinated bonds. Also, as of the same date we did not have any other type of regulatory capital financial instruments. Over the rest of 2026, placements of senior bonds will depend on the evolution of crucial market factors, such as long-term interest rates -that sharply increased in the 2Q26- and our risk appetite in in relation to the management of our financial gaps in the banking book, and the inflation-indexation gap in particular. Accordingly, under our baseline scenario for the rest of the year we would be more active in placing senior bonds during the 2H26, to the extent economic activity becomes more dynamic and inflation converges to the midpoint of the Central Bank's target. However, as we mentioned last quarter, if second-round effects of the still unresolved conflict in the Middle East on local inflation persist for longer than expected, we could temporarily modify this strategy to benefit from unexpected increases in inflation by keeping our inflation-indexed exposure at current levels. As for subordinated bonds, although we do not anticipate new issuances in the baseline scenario in light of the capital buffers we have to date, we cannot rule them out if the regulator decides to set further capital requirements on us or the local banking industry. Other Liabilities Our Other Liabilities (Borrowings from Financial Institutions, Derivatives, Provisions and Others line-items) reached Ch$7,524,726 million on June 30, 2026. This amount represented a YoY decline of Ch$432,983 million or 6.1% when compared to June 2025 and a decrease of Ch$418,534 million or 5.3% if contrasted to December 2025. Other Liabilities (In Millions of Ch$) 1,335,527 1,296,751 1,195,069 2,186,432 2,378,039 2,294,333 3,569,784 4,268,470 4,035,324 7,091,743 7,943,260 7,524,726 Jun-25 Dec-25 Jun-26 Provisions & Others Derivatives Borrowings from Financial Institutions The YoY change in Other Liabilities primarily resulted from: (i) greater Provisions & Other liabilities by Ch$465,540 million or 13.0%, amount that –in turn– was driven by a YoY rise of ~Ch$198,000million in accounts receivable associated with financial intermediation carried out by our Securities Brokerage subsidiary, in line with the participation of this company in recent market transactions, together with an increase of ~Ch$101,000 million in Operations in Course of Collection, associated with the exchange of financial instruments traded by our Treasury and high-value payments, and (ii) a YoY rise of Ch$107,901 million or 4.9% in Derivatives, driven by changes in local and foreign interest rates. These elements were to some extent offset by a YoY decrease of Ch$140,458 million or 10.5% in Borrowings from Financial Institutions.
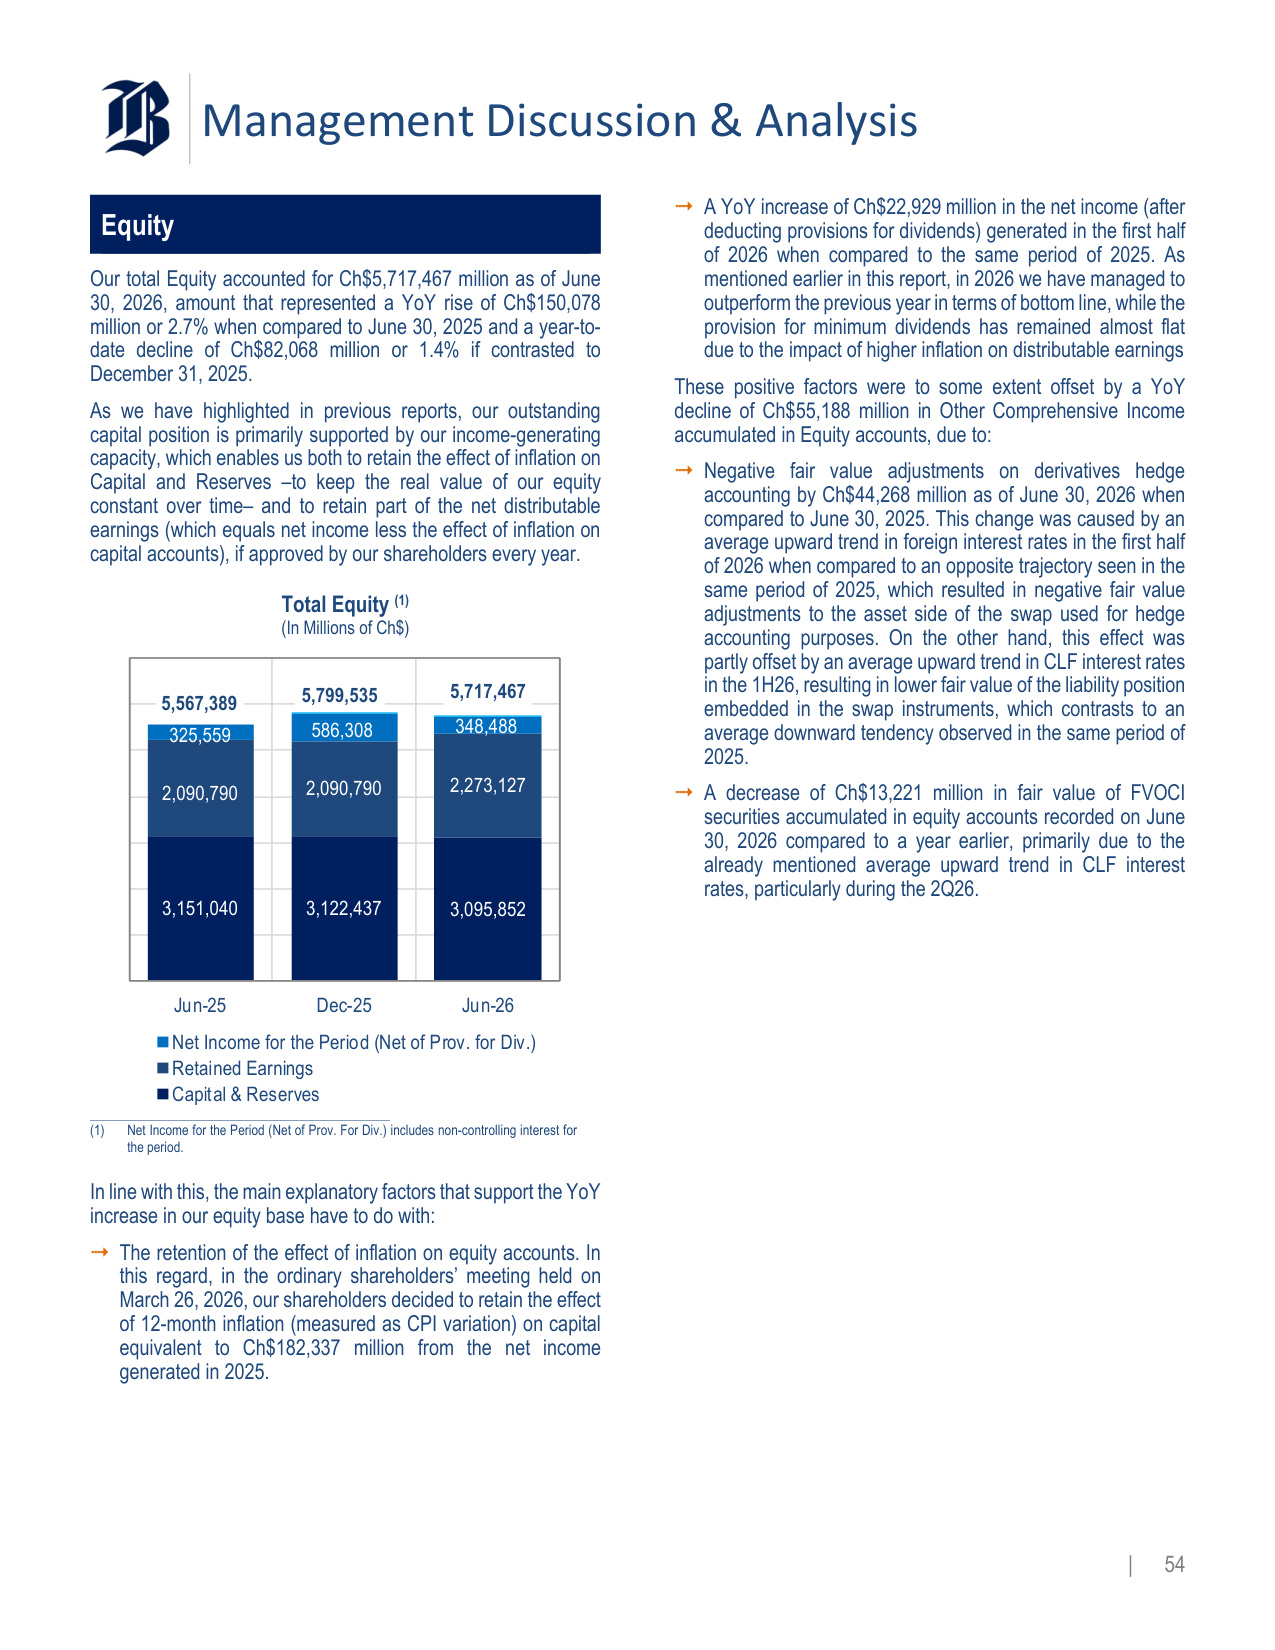
Management Discussion & Analysis | 54 Equity Our total Equity accounted for Ch$5,717,467 million as of June 30, 2026, amount that represented a YoY rise of Ch$150,078 million or 2.7% when compared to June 30, 2025 and a year-to- date decline of Ch$82,068 million or 1.4% if contrasted to December 31, 2025. As we have highlighted in previous reports, our outstanding capital position is primarily supported by our income-generating capacity, which enables us both to retain the effect of inflation on Capital and Reserves –to keep the real value of our equity constant over time– and to retain part of the net distributable earnings (which equals net income less the effect of inflation on capital accounts), if approved by our shareholders every year. Total Equity (1) (In Millions of Ch$) 3,151,040 3,122,437 3,095,852 2,090,790 2,090,790 2,273,127 325,559 586,308 348,488 5,567,389 5,799,535 5,717,467 Jun-25 Dec-25 Jun-26 Net Income for the Period (Net of Prov. for Div.) Retained Earnings Capital & Reserves (1) Net Income for the Period (Net of Prov. For Div.) includes non-controlling interest for the period. In line with this, the main explanatory factors that support the YoY increase in our equity base have to do with: The retention of the effect of inflation on equity accounts. In this regard, in the ordinary shareholders' meeting held on March 26, 2026, our shareholders decided to retain the effect of 12-month inflation (measured as CPI variation) on capital equivalent to Ch$182,337 million from the net income generated in 2025. A YoY increase of Ch$22,929 million in the net income (after deducting provisions for dividends) generated in the first half of 2026 when compared to the same period of 2025. As mentioned earlier in this report, in 2026 we have managed to outperform the previous year in terms of bottom line, while the provision for minimum dividends has remained almost flat due to the impact of higher inflation on distributable earnings These positive factors were to some extent offset by a YoY decline of Ch$55,188 million in Other Comprehensive Income accumulated in Equity accounts, due to: Negative fair value adjustments on derivatives hedge accounting by Ch$44,268 million as of June 30, 2026 when compared to June 30, 2025. This change was caused by an average upward trend in foreign interest rates in the first half of 2026 when compared to an opposite trajectory seen in the same period of 2025, which resulted in negative fair value adjustments to the asset side of the swap used for hedge accounting purposes. On the other hand, this effect was partly offset by an average upward trend in CLF interest rates in the 1H26, resulting in lower fair value of the liability position embedded in the swap instruments, which contrasts to an average downward tendency observed in the same period of 2025. A decrease of Ch$13,221 million in fair value of FVOCI securities accumulated in equity accounts recorded on June 30, 2026 compared to a year earlier, primarily due to the already mentioned average upward trend in CLF interest rates, particularly during the 2Q26.
Risk & Capital Management | 55 Risk Management Approach Risk Management Principles Banco de Chile's risk profile ensures that its business can sustainably grow and is aligned with its strategic objectives in order to maximize value creation and guarantee its liquidity and capital adequacy. Global risk management takes into consideration the business segments served by the bank and its subsidiaries, which is approached from an integrated and differentiated perspective. The Bank's corporate governance relies on active participation by the board, in order to adequately manage risk, either directly or through committees composed of directors and senior management that have been described in the Corporate Governance section of this report. The board establishes the risk policies, the risk appetite framework, and the guidelines to develop, validate and monitor its models. It approves the provision models and annually issues an opinion on the adequacy of provisions. Management is responsible for establishing rules and procedures, and for controlling compliance with the board's instructions. The bank has integrated its capital and liquidity planning process into its strategic planning, in line with the risks inherent to its business, the financial and competitive environment, its business strategy, corporate values, and its risk governance, management and control systems. Its capital planning process is aligned with the regulator's requirements and incorporates Risk Weighted Asset calculations and stress tests for its credit, market and operational risks, and the integrated measurement of its financial and non-financial risks. The Credit Risk Division, the Operational Risk and Global Control Division and the Cybersecurity Division jointly manage risk. They form the corporate risk governance structure, and their highly experienced and specialized teams, together with a robust regulatory framework, secure optimal and effective management of the matters they address. The Credit Risk Division is responsible for credit risk during the loan origination, monitoring and recovery stages for both the Retail and Wholesale segments and, through the Market Risk Area, is also responsible for measuring, limiting, controlling and reporting on market risk, as well as defining valuation and management standards for the Bank's assets and liabilities.
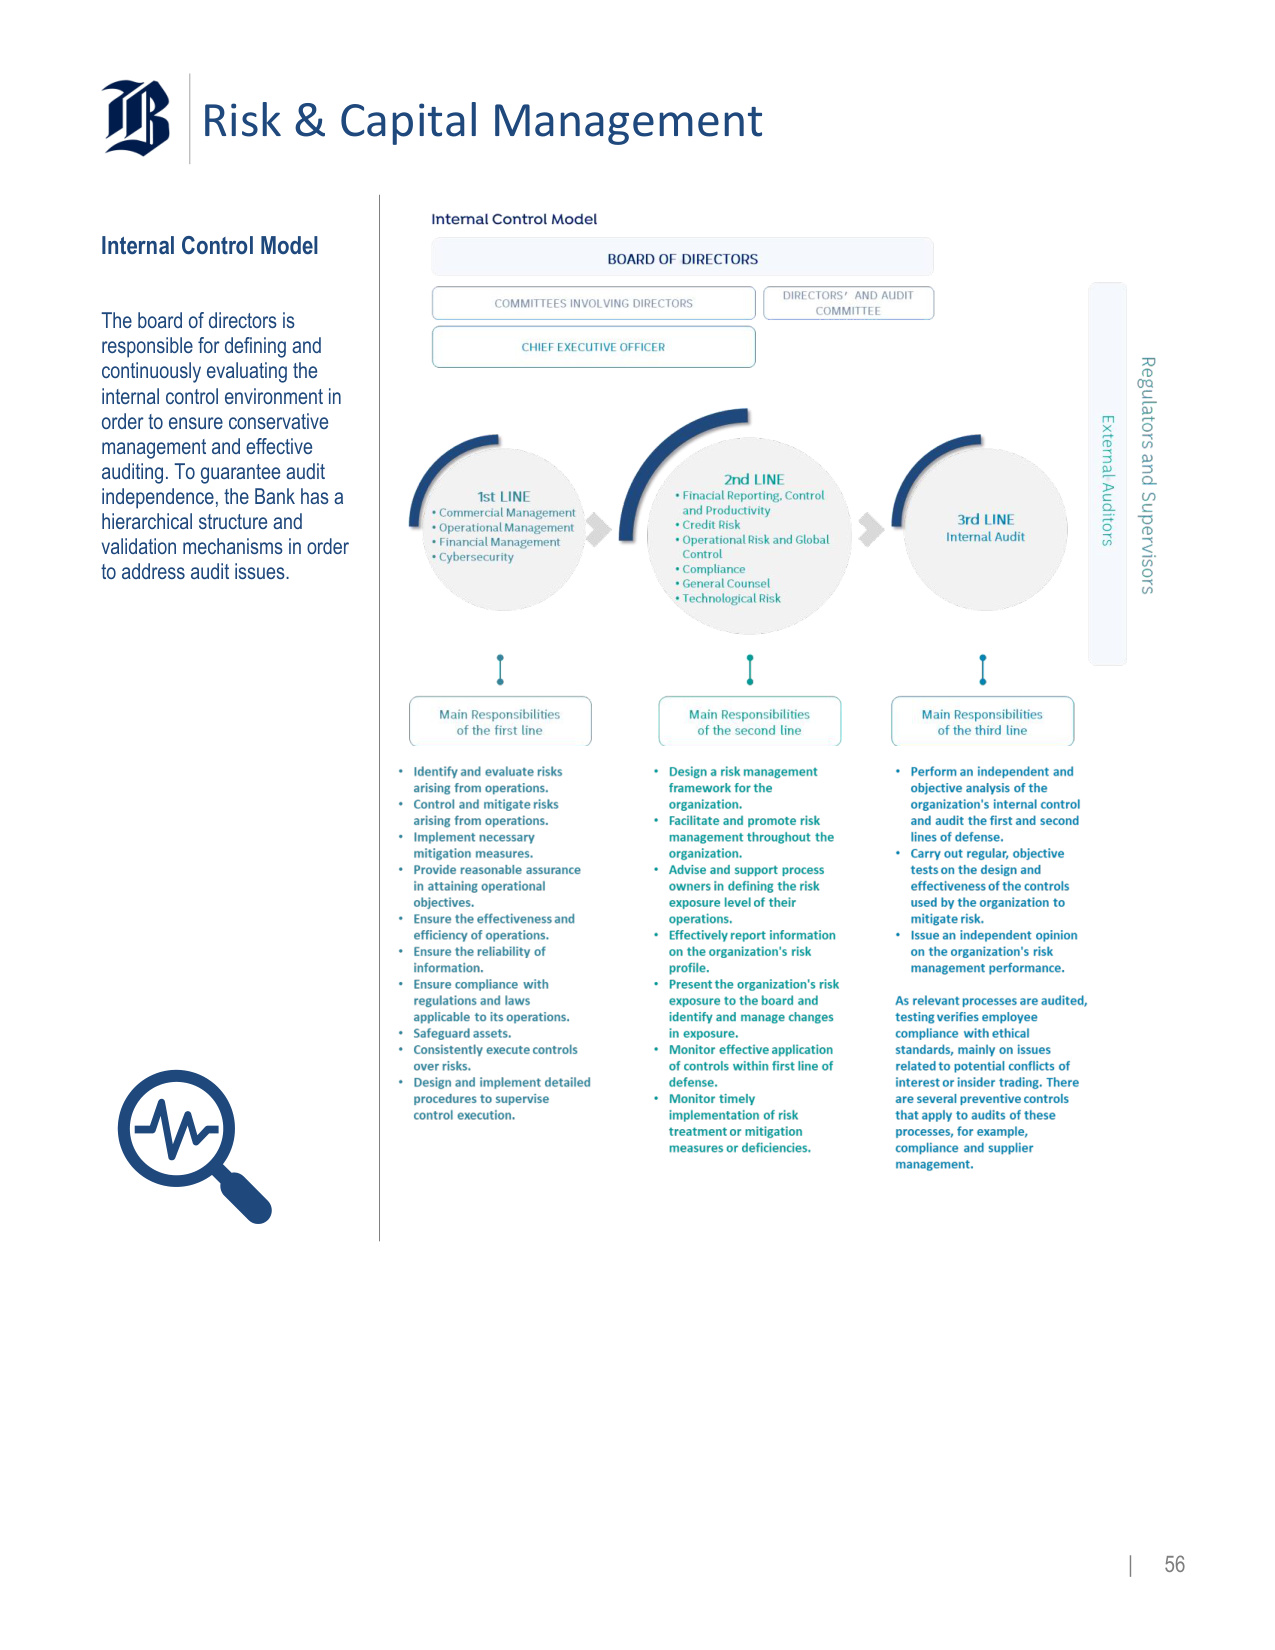
Risk & Capital Management | 56 Internal Control Model The board of directors is responsible for defining and continuously evaluating the internal control environment in order to ensure conservative management and effective auditing. To guarantee audit independence, the Bank has a hierarchical structure and validation mechanisms in order to address audit issues.
Risk & Capital Management | 57 Credit Risk Credit risk assesses the probability that the counterparty in a credit transaction does not meet its contractual obligation because of payment incapacity or financial insolvency, and that leads to a potential loan loss. The bank seeks an adequate risk-return and an appropriate risk balance, through careful credit risk management, which covers the loan origination, monitoring and recovery processes. It also continuously manages risk knowledge using an integral approach, in order to contribute to the business and anticipate threats that may damage its solvency or the quality of its loan portfolio, by developing a unique risk awareness culture throughout the corporation. This requires developing a risk management framework for the business segments served by the bank, responding to regulatory requirements and commercial dynamism, contributing to digital transformation, and contributing to the bank's businesses from a risk management perspective. It adopts a portfolio perspective that efficiently and proactively manages, resolves and controls the business approval process. The Bank integrates socio-environmental criteria into its evaluations for granting financing for domestic and regional projects that might generate such an impact, wherever executed. Projects must have all the permits, authorizations, licenses and studies required for their impacts in order to qualify for financing. For large customers, the bank also has specialized customer service units involved in the process of financing large-scale projects such as public works concessions that include building infrastructure and mining, power or real estate developments, all of which may have an environmental impact. Credit policies and processes are based on the following management principles, which use a specialized approach according to the characteristics of the bank's markets and segments, and acknowledge their peculiarities: • Perform a rigorous evaluation during the loan origination process • Implement a continuous, robust portfolio monitoring process • Develop credit risk modelling guidelines, covering regulatory and management aspects, for efficient decision making at each stage of the lending process. • Implement a timely, flexible, efficient collections structure • Efficiently manage teams, tools and information availability Our Credit Risk division uses these management principles to contribute to the business and anticipate threats that may affect solvency and portfolio quality, based on a segmentation by business, as follows: • Retail Banking Segment Loan origination for these segments is mainly managed using risk evaluation scoring tools, supported by an appropriate credit attribution model, which is required to approve each transaction. These evaluations examine factors such as total borrowings, payment capacity and maximum acceptable exposure for the customer. • Wholesale Banking Segment Origination management for this segment involves an individual assessment of the customer and, if it belongs to a group of companies, then this takes into consideration the bank's relationship with the rest of the group. This individual assessment considers income-generating capacity, financial capacity with emphasis on solvency, exposure levels, industry variables, an evaluation of the partners and management and aspects particular to the transaction, such as the financing structure, terms, products and any guarantees.
Risk & Capital Management | 58 Price Risk Price risk can be defined as the risk of losses in the Trading and / or the Banking Book, arising from adverse movements in market factors. The Bank separates this risk based on three types of market factors: spot prices, interest rates and option volatility. The Bank has a Market Risk Management policy, which is annually approved by the Board of Directors, where the types of internal limits and alerts are established, in addition to the regulatory ones, for the measurement of financial exposures and/or price risks. Measurement and control of the price risk, for management purposes, is carried out through several internal metrics and reports that differ from each other, depending on whether they are used for exposures in the Trading and Currency Book or for those belonging to the Banking Book. Regarding the internal tools designed for the Trading and Currency Book, the price risk management is deployed through the calculation and reporting of financial exposures through their sensitivities or greeks and the risk of the entire portfolio by means of the VaR model. Additionally, the Bank has established internal metrics for the management of the price risk of the Banking Book, defining limits and alerts for interest rate exposures. The Bank measures interest rate exposures through the Interest Rate Exposure (IRE) metric, and interest rate risk of the Banking Book using the EaR 12M (Earnings at Risk 12 months) methodology. In addition, internal policies establish the periodic carrying out of stress exercises on the positions of the Trading and Currency Book, and the Banking Book, which are used to contrast them against the maximum price risk tolerance defined by the Board of Directors. Limit usage and alert status are regularly reported to the respective business units. Likewise, the Bank's Senior Management is immediately notified in the case of excess limits or activation of alerts, including the monitoring of corrective action plans, if necessary. This information is reported monthly to the Finance, International and Financial Risk Committee and on a quarterly basis to the Board of Directors. Liquidity Risk Liquidity risk can arise either due to a reduction in the bank's funding capacity (funding liquidity risk) or a reduction in the traded value of its assets that can be liquidated or its market factors from derivatives held in its portfolios (transaction or trading liquidity risk). The Bank has a Liquidity Risk Management Policy, reviewed and approved at least annually by the Board, which establishes the main guidelines for measuring, limiting, reporting and controlling liquidity risk. Funding liquidity is measured, reported and controlled by means of using internal metrics, including the Market Access Report (MAR). MAR limits are established to ensure that funding can be obtained and / or renewed in professional markets under normal business conditions, in different time horizons and currencies. The Bank also sets a minimum amount of highly liquid assets (or liquidity buffer), and a limit of the cross-currency funding position. Concentration ratios and other complementary metrics are also periodically measured, reported and controlled against warning levels. In addition, the Bank reports standardized metrics to regulators in accordance with their guidelines, such as the Liquidity Coverage Ratio (LCR) and the Net Stable Financing Ratio (NSFR). It also continuously monitors and tracks market variables and/or material events that could affect our liquidity position. In accordance with its Liquidity Risk Management Policy, the Bank performs regular stress testing in order to quantify its cash needs in the event of adverse scenarios of varying severity, which are contrasted against potentially available action plans detailed within the Liquidity Contingency Plan. These results are daily reported, monitored and controlled based on the maximum liquidity risk appetite defined by the Board. On the other hand, trading liquidity is assured by using limits with certain specific maturities based on the amounts that are normally traded in professional markets for interest rate exposure generated by debt instruments and derivatives. The same process is used to limit the Bank's overall exposure to each currency and to exchange rate volatility with varying maturities. These internal and regulatory metrics are regularly reported to the business units responsible for managing liquidity risk. Similarly, senior management is immediately notified if the limits are exceeded or triggers are breached, including, if necessary, monitoring of corrective action plans. Finally, the general status of liquidity risk is reported to the Asset and Liabilities Committee on a monthly basis and to the Board on a quarterly basis.
Risk & Capital Management | 59 Operational Risk Operational risk is the risk of loss resulting from deficiencies or failures in internal processes, staff or systems, or from external events. This definition includes legal risks and excludes strategic and reputation risks. Operational risk is inherent to all activities, products and systems, as well as strategic, business and support processes throughout the organization. All bank employees are appropriately responsible for the management and control of operational risks inherent to their duties, since these risks may result in direct or indirect financial losses. The bank controls and manages operational risk by developing a regulatory and governance framework adapted to the complexity of its business. The Operational Risk Policy defines a comprehensive management framework that includes identifying, evaluating, controlling, mitigating, monitoring and reporting these risks. This requires executing several processes as follows: • Process Assessment • Supplier Management • Fraud Management • Management of Operational Events and Operational Losses • Operational Risk Assessment for Projects • Control Testing • Risk Appetite Profile and Framework • Self-Assessment Matrix • Relations with External Entities and Corporate Training Plan Business Continuity Different situations that could affect the business continuity of the organization or the country, which requires to be constantly prepared to keep operating the products and services that are critical to its customers. Being prepared to face any emergency is key to providing exceptional services to our customers. Therefore, we have developed a robust, consistent Business Continuity Plan to safeguard the bank and its subsidiaries. The objective of the plan is to establish general guidelines for ensuring the safety of our employees, protecting the organization's capital from catastrophic events, maintaining and updating documentation, and conducting training and testing. To comply with these guidelines, the bank has developed a strategy to meet this objective that covers the following areas: • Document Management • Business Continuity Testing • Crisis Management • Critical Supplier Management • Management of Alternative Sites • Relationship with Subsidiaries and External Organizations • Continuous Improvement • Training • Information Security Officer (ISO)
Risk & Capital Management | 60 Technological Risk, Cybersecurity and Data Protection Society is increasingly digitalized, so customer privacy and cybersecurity risk management is a priority for Banco de Chile. Therefore, the bank has developed a Strategic Cybersecurity Plan, which is aligned with the bank's business strategy. The main objectives of this plan are to protect customer and employee data, safeguard the bank's data, manage technological, cybersecurity and data security risks, and strengthen the risk prevention culture. This plan complies with the appropriate regulations, which include the Constitutional Law No. 21,096 on Personal Data Protection, the Protection of Privacy Law No. 19,628 (which will be replaced by Law No. 21,719 as of December 2026), the Cybersecurity Framework Law No. 21,663, and the provisions published in the Updated Compilation of Rules (RAN) issued by the CMF. This plan has been approved by senior management, who regularly receive associated progress reports. Data security and cybersecurity policies at Banco de Chile establish guidelines regarding the responsibility for and protection of data and its associated risk management, based on both regulatory aspects and international standards. These policies are reviewed annually and apply to employees, outsourced personnel, as well as suppliers and contractors of services who access its facilities or have access to bank and subsidiary data. The controls that protect this information and IT assets are defined by regulations, processes and the bank's internal procedures. Conduct Risk and Anti-Money Laundering Banco de Chile knows that sound ethical management is essential for its industry leading position. Therefore, the bank has diverse protocols, systems and models to ensure ethical behavior of all its employees. The Code of Conduct is the key guideline and essential component of the bank's corporate ethics. It contains the general principles and instructions that guide the ethical-professional conduct of the employees, directors and board advisors. The purpose of the code is to safeguard the fundamental values to properly conduct the bank's business, in accordance with the bank's corporate philosophy. The Ethics Committee is responsible for overseeing its implementation within the bank. Preventing corruption and the use of the bank and its subsidiaries to engage in unlawful practices has been a concern over the last few decades for Banco de Chile. Awareness-raising measures and controls have been intensified during recent years, in order to prevent this kind of behavior. The bank has approved a Code of Conduct, a Prevention of Dishonest Practices Policy and a Handling Conflicts of Interest Policy, which describe the main roles and responsibilities to avoid that anything may be interpreted as a violation of ethical conduct or imply the risk of corruption or bribery. The Compliance Division, by means of its Regulatory Compliance Area and the Ethics Committee, are responsible for ensuring compliance with the conduct described in these policies. Model Risk and Internal Control Its purpose is to manage the risks associated with models and their processes, so it relies on the model validation, model risk management and internal control functions. Model validation is responsible for performing an independent review of risk models, including risk-weighted assets and stress testing, during their construction and implementation stages. It validates compliance with board-approved guidelines and addresses aspects such as governance, data quality, modeling techniques, methodological and parametric implementation analysis and documentation. The results of these reviews are submitted to the respective committees. Model risk management is responsible for monitoring models and ensuring that they fulfill their life cycle status. The Model Risk Management Committee was created in July 2023 and is composed of members of the Bank' senior management.
Risk & Capital Management | 61 Capital Management The Bank supervises and manages its capital adequacy based on the principles and objectives set forth in its Corporate Capital Management Policy and current risk appetite framework, ensuring that its capital base provides adequate coverage for the material risks of the business and complies with the requirements established by the CMF on this matter. Through its Policy, the Bank seeks to ensure the adequacy and quality of the Bank's capital, establish sufficient capital levels through the definition of internal capital targets, ensure that capital metrics meet the internal capital targets defined by the Bank in the short and medium term, establish periodic and timely reports to meet the objectives set on this matter and ensure the existence of a governance structure with clear roles and responsibilities within the organization. In terms of capital management, Banco de Chile is governed by, among others, the following principles: (i) ensuring the solvency of the Bank, without losing focus on the profitability of the capital invested by shareholders, (ii) considering capital as a scarce resource, so business and investment decisions should be oriented towards value creation by optimizing the capital invested, (iii) the Board of Directors is ultimately responsible for strategies and decisions that affect capital management, (iv) having a comprehensive capital management model that allows monitoring and control, (v) implementing an annual capital planning process, consistent and aligned with the definition of the risk appetite and strategic goals, and (vi) ensuring the accuracy, reasonability, quality and integrity of information related to capital management. Regarding Governance Structure, Banco de Chile has an adequate segregation of duties that allows activities related to business, control and monitoring, risk measurement and assessment, and capital adequacy, to be executed and reported with sufficient independence and in alignment with best risk and capital management practices. The key participants in the Bank's corporate governance structure for capital management are: • Board of Directors: Is the Bank's highest decision-making body, responsible for the supervision of capital management, including regulatory and internal compliance, through the approval of the Policy, the definition of general guidelines for capital management based on the risk profile assumed by the Bank, as well as the approval of internal targets and capital planning, the Risk Internal Assessment Measurement (RIA), the Risk Appetite Framework (RAF) and associated contingency plans, among other elements. • Capital Management Committee: Among other matters, the main function of Committee is to oversee and supervise capital management while being responsible for reviewing and proposing changes to the Policy, at least once a year; reviewing and approving governance documentation associated with capital management; ensuring that the Bank has sufficient capital to meet both its current needs and those arising from stress scenarios.
Risk & Capital Management | 62 Funding Concentration & Liquidity Position Our liquidity position has continued to be solid as shown by both the Liquidity Coverage Ratio (LCR) and the Net Stable Funding Ratio (NSFR), both remaining well above the prevailing regulatory limits of 100% for each metric, as defined by banking liquidity regulation. Liquidity Ratios: LCR and NSFR (In percentage as of each date, based on CMF C49 report) 0% 50% 100% 150% 200% 250% 300% 350% 400% 450% 0% 50% 100% 150% 200% 250% 300% 350% 400% 450% Jun-24 Sep-24 Dec-24 Mar-25 Jun-25 Sep-25 Dec-25 Mar-26 Jun-26 LCR NSFR To achieve this position, we maintained high-quality liquid assets (HQLA) that averaged Ch$6,540 billion during the 2Q26, which explains the positive gap shown by the LCR in relation to both the regulatory and internal thresholds. From a composition standpoint, our HQLA continue to be primarily composed of fixed- income securities issued by both the Central Bank of Chile and the Chilean Government. During the 2Q26, the evolution of LCR was marked by increased HQLA over the first part of the quarter and, subsequently, an increase in the 30-day net cash outflows, mostly due to changes in short-term funding that became temporarily more concentrated in financial counterparties. As for the NSFR, given our balance sheet structure and solid management of liquidity gaps, the relationship between available and required funding has remained stable over time. From the funding concentration perspective, the composition of our deposit base remained relatively stable in 2026 in terms of types of instruments. In this regard, Time Deposits balances –as a percentage of total liabilities (i.e. excluding equity accounts) – showed a moderate decrease from 32.1% in June 2025 to 30.8% in June 2026. Demand Deposits, instead, remained almost flat YoY by representing 29.3% in June 2026. Furthermore, given our persistent position in liquid assets, the funding from institutional counterparties remains below the funding from non-financial ones. Thus, our liabilities structure continues to be well balanced, as reflected by a 43% share of retail counterparties, a 41% share of financial counterparties and a 16% composed of wholesale non-financial counterparties. Liability Concentration by Counterparty (As percentage of Total Liabilities) 41% 43% 16% Financial Counterparties Retail Counterparties Wholesale Non-Financial Counterparties It is important to note that 60.2% of our liabilities with financial counterparties are concentrated in long-term bonds, representing a 24.7% of our total liabilities (excluding equity accounts) as of June 30, 2026 while being a stable source of funding regardless of the counterparty.
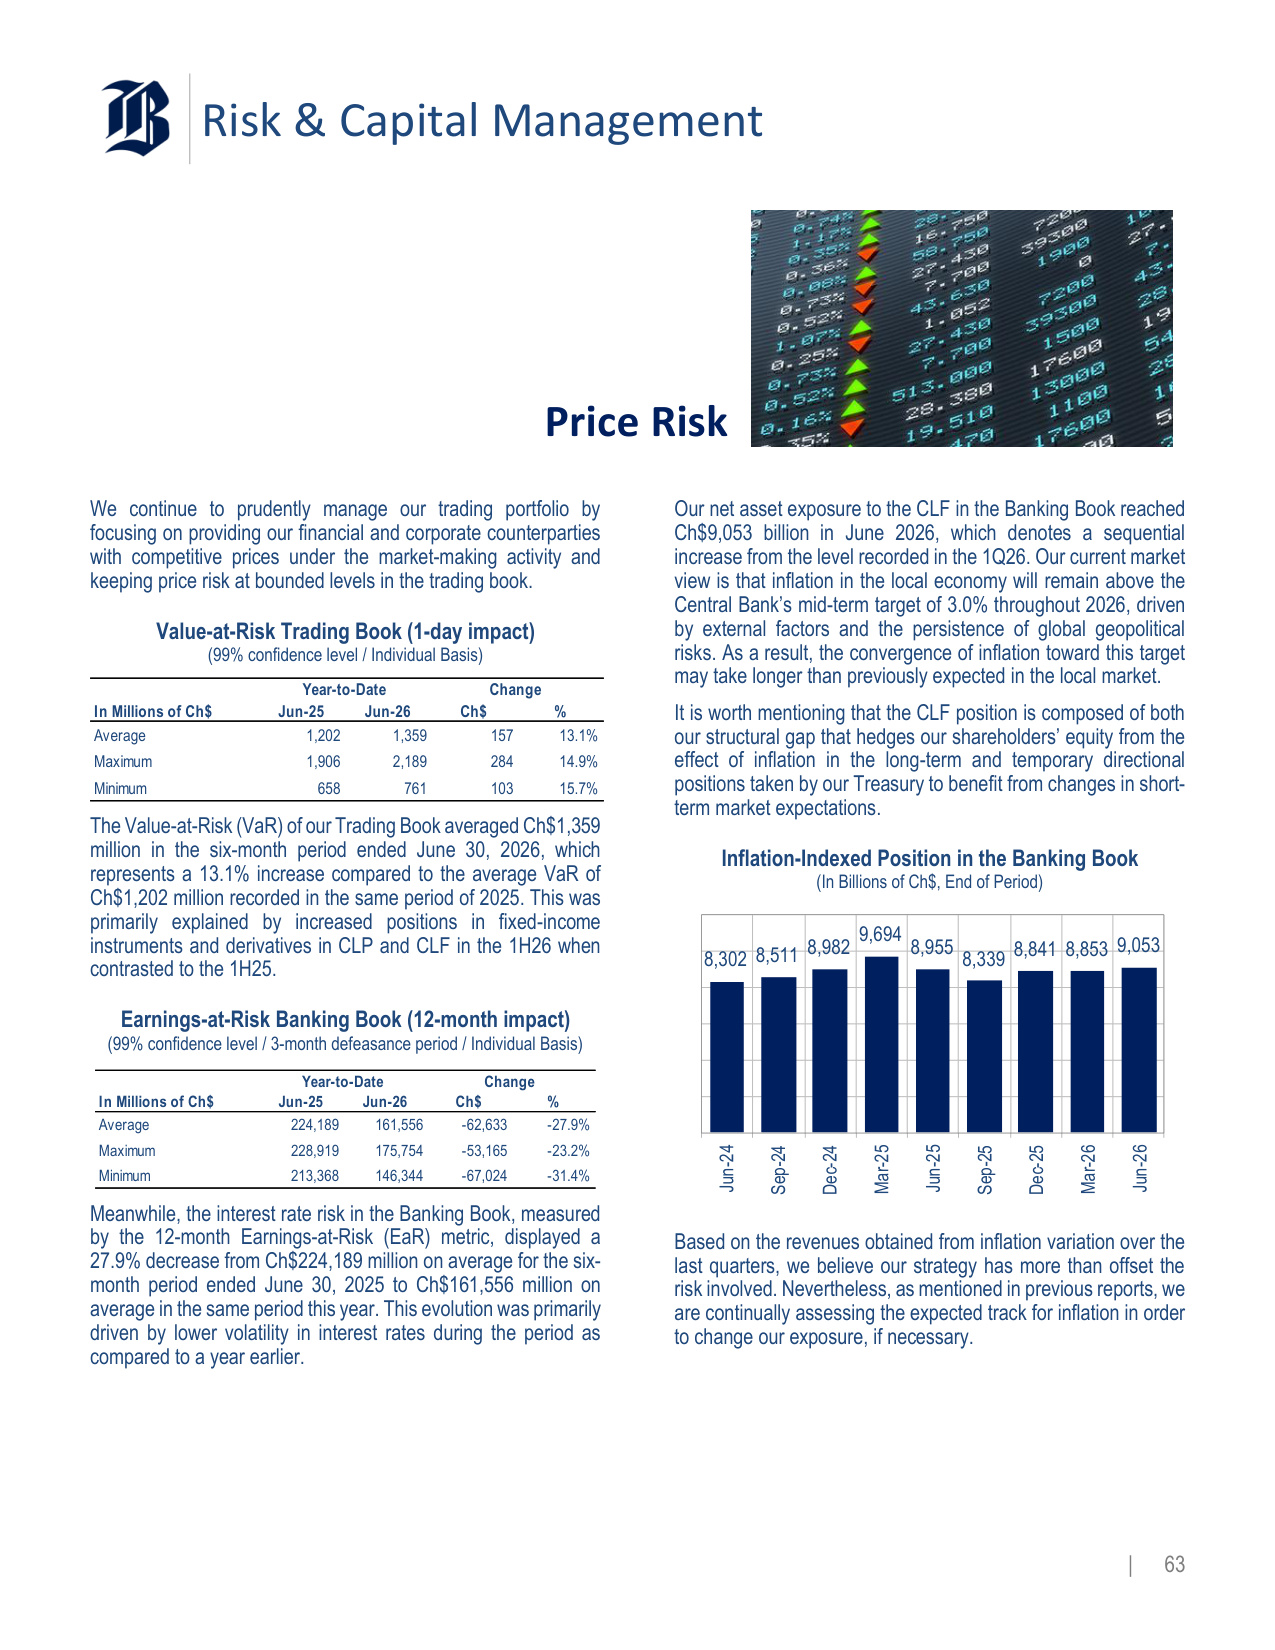
Risk & Capital Management | 63 Price Risk We continue to prudently manage our trading portfolio by focusing on providing our financial and corporate counterparties with competitive prices under the market-making activity and keeping price risk at bounded levels in the trading book. Value-at-Risk Trading Book (1-day impact) (99% confidence level / Individual Basis) In Millions of Ch$ Jun-25 Jun-26 Ch$ % Average 1,202 1,359 157 13.1% Maximum 1,906 2,189 284 14.9% Minimum 658 761 103 15.7% Year-to-Date Change The Value-at-Risk (VaR) of our Trading Book averaged Ch$1,359 million in the six-month period ended June 30, 2026, which represents a 13.1% increase compared to the average VaR of Ch$1,202 million recorded in the same period of 2025. This was primarily explained by increased positions in fixed-income instruments and derivatives in CLP and CLF in the 1H26 when contrasted to the 1H25. Earnings-at-Risk Banking Book (12-month impact) (99% confidence level / 3-month defeasance period / Individual Basis) In Millions of Ch$ Jun-25 Jun-26 Ch$ % Average 224,189 161,556 -62,633 -27.9% Maximum 228,919 175,754 -53,165 -23.2% Minimum 213,368 146,344 -67,024 -31.4% Year-to-Date Change Meanwhile, the interest rate risk in the Banking Book, measured by the 12-month Earnings-at-Risk (EaR) metric, displayed a 27.9% decrease from Ch$224,189 million on average for the six- month period ended June 30, 2025 to Ch$161,556 million on average in the same period this year. This evolution was primarily driven by lower volatility in interest rates during the period as compared to a year earlier. Our net asset exposure to the CLF in the Banking Book reached Ch$9,053 billion in June 2026, which denotes a sequential increase from the level recorded in the 1Q26. Our current market view is that inflation in the local economy will remain above the Central Bank's mid-term target of 3.0% throughout 2026, driven by external factors and the persistence of global geopolitical risks. As a result, the convergence of inflation toward this target may take longer than previously expected in the local market. It is worth mentioning that the CLF position is composed of both our structural gap that hedges our shareholders' equity from the effect of inflation in the long-term and temporary directional positions taken by our Treasury to benefit from changes in short- term market expectations. Inflation-Indexed Position in the Banking Book (In Billions of Ch$, End of Period) 8,302 8,511 8,982 9,694 8,955 8,339 8,841 8,853 9,053 Jun-24 Sep-24 Dec-24 Mar-25 Jun-25 Sep-25 Dec-25 Mar-26 Jun-26 Based on the revenues obtained from inflation variation over the last quarters, we believe our strategy has more than offset the risk involved. Nevertheless, as mentioned in previous reports, we are continually assessing the expected track for inflation in order to change our exposure, if necessary.
Risk & Capital Management | 64 Operational Risk Regarding Operational Risk, we aim to keep a reasonable level of losses, by means of monitoring and controlling the proper functioning of our processes, personnel and internal systems, while also considering external issues. To achieve this goal, we operate through a Comprehensive Risk Management Framework, as well as a governance structure that addresses the complexity of our business model. As of June 30, 2026, we incurred net operational losses by Ch$10,045 million, which was primarily composed of: (i) losses associated with external fraud representing 75.2%, (ii) losses related to Execution, Delivery and Process Management amounting to 15.5%, (iii) losses categorized as Work Practices and Safety in the Business Position representing 6.5%, and (iv) other effects that jointly accounted for 2.9% comprised of losses related to Business Interruption and System Failure, losses from Clients, Products & Business Practices as well as Damage to Physical Assets, and finally Internal Fraud. Net Operational Losses by Type (In Millions of Ch$ / Net of Recoveries) 7,549 1,561 649 84 38 163 1 6,607 890 804 144 363 288 85 0 2,000 4,000 6,000 8,000 10,000 External Fraud Execution, Delivery and Process Management Work Practices and Safety in the Business Position Customers, Products and Business Practices Damage to physical assets Business Interruption and System Failure Internal Fraud As of June 30, 2025 As of June 30, 2026 The amount of net operational losses recorded as of June 30, 2026 denotes a YoY increase of Ch$861 million or 9.4% when compared to the Ch$9,184 million recorded as of June 30, 2025. This change was conducted by specific drivers, as follows: A YoY growth of Ch$942 million or 14.3% in net losses related to External Fraud, explained by an increase in losses associated with electronic fraud, primarily in credit and debit card transactions. This effect was in part offset by lower losses associated with electronic funds transfer, due to a decrease in the occurrence of this type of events in the six- month period ended June 30, 2026 compared to a year earlier. A YoY increase of Ch$670 million or 75.3% in net losses related to Execution, Delivery and Process Management, primarily driven by higher provisions associated with leasing operations, mortgage credit insurance and sale of assets, as well as losses from mass payment processes, compared to the previous year. To mitigate these risks, we have implemented certain measures aimed at strengthening the control environment, including the centralization of activities and the reassessment of roles and responsibilities. These effects were partly counterbalanced by: Lower net losses associated with the Damage to Physical Assets category by Ch$325 million or 89.5% YoY, due to a YoY decrease in expenses related to fixed-asset repairs as a result of operational events, particularly in ATMs and branches occurred last year. A YoY decline of Ch$125 million or 43.5% in net operational losses associated with Business Disruption and System Failures, primarily driven by initiatives aimed at strengthening system control through improvements in system configurations.
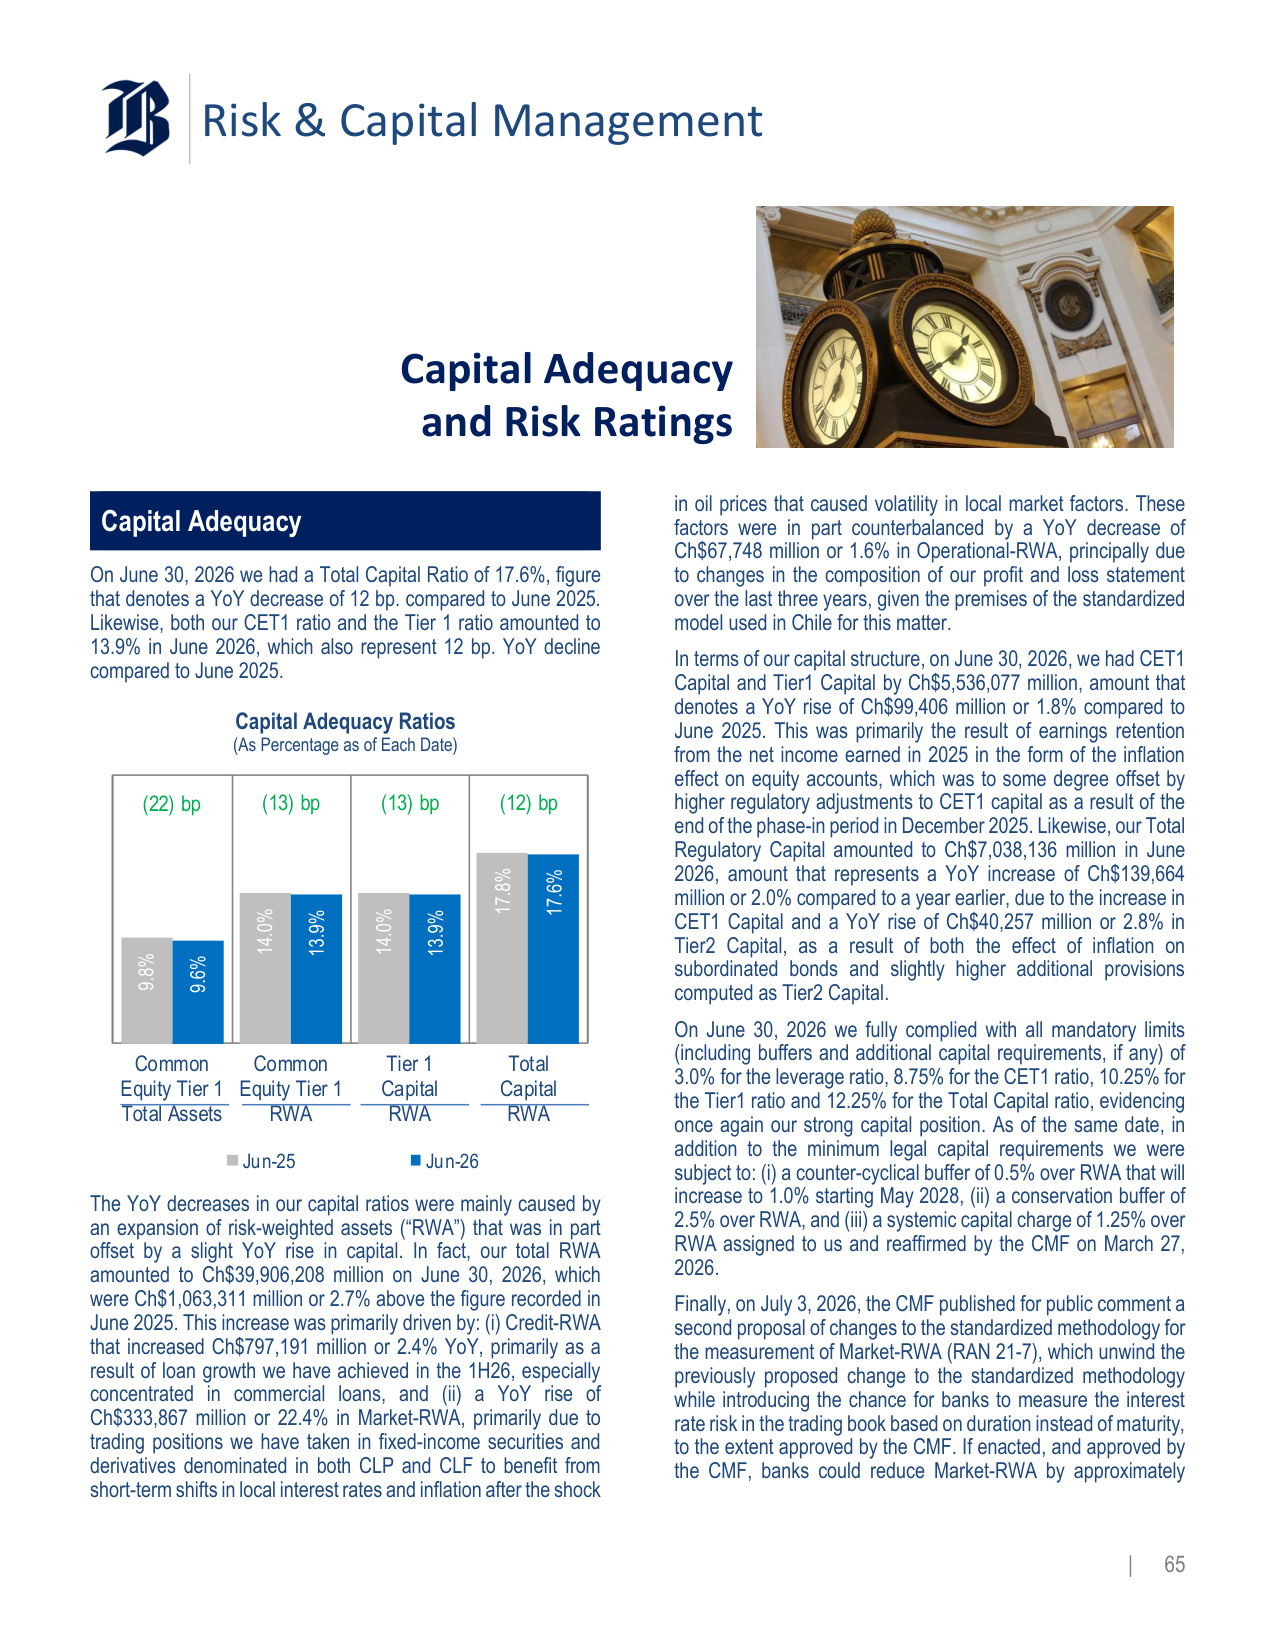
Risk & Capital Management | 65 Capital Adequacy and Risk Ratings Capital Adequacy On June 30, 2026 we had a Total Capital Ratio of 17.6%, figure that denotes a YoY decrease of 12 bp. compared to June 2025. Likewise, both our CET1 ratio and the Tier 1 ratio amounted to 13.9% in June 2026, which also represent 12 bp. YoY decline compared to June 2025. Capital Adequacy Ratios (As Percentage as of Each Date) 9.8% 14.0% 14.0% 17.8% 9.6% 13.9% 13.9% 17.6% (22) bp (13) bp (13) bp (12) bp (100, 00) bp (80,00) bp (60,00) bp (40,00) bp (20,00) bp +0 bp 0.0% 5.0% 10 .0 % 15 .0 % 20 .0 % 25 .0 % Common Equity Tier 1 Total Assets Common Equity Tier 1 RWA Tier 1 Capital RWA Total Capital RWA Jun-25 Jun-26 The YoY decreases in our capital ratios were mainly caused by an expansion of risk-weighted assets ("RWA") that was in part offset by a slight YoY rise in capital. In fact, our total RWA amounted to Ch$39,906,208 million on June 30, 2026, which were Ch$1,063,311 million or 2.7% above the figure recorded in June 2025. This increase was primarily driven by: (i) Credit-RWA that increased Ch$797,191 million or 2.4% YoY, primarily as a result of loan growth we have achieved in the 1H26, especially concentrated in commercial loans, and (ii) a YoY rise of Ch$333,867 million or 22.4% in Market-RWA, primarily due to trading positions we have taken in fixed-income securities and derivatives denominated in both CLP and CLF to benefit from short-term shifts in local interest rates and inflation after the shock in oil prices that caused volatility in local market factors. These factors were in part counterbalanced by a YoY decrease of Ch$67,748 million or 1.6% in Operational-RWA, principally due to changes in the composition of our profit and loss statement over the last three years, given the premises of the standardized model used in Chile for this matter. In terms of our capital structure, on June 30, 2026, we had CET1 Capital and Tier1 Capital by Ch$5,536,077 million, amount that denotes a YoY rise of Ch$99,406 million or 1.8% compared to June 2025. This was primarily the result of earnings retention from the net income earned in 2025 in the form of the inflation effect on equity accounts, which was to some degree offset by higher regulatory adjustments to CET1 capital as a result of the end of the phase-in period in December 2025. Likewise, our Total Regulatory Capital amounted to Ch$7,038,136 million in June 2026, amount that represents a YoY increase of Ch$139,664 million or 2.0% compared to a year earlier, due to the increase in CET1 Capital and a YoY rise of Ch$40,257 million or 2.8% in Tier2 Capital, as a result of both the effect of inflation on subordinated bonds and slightly higher additional provisions computed as Tier2 Capital. On June 30, 2026 we fully complied with all mandatory limits (including buffers and additional capital requirements, if any) of 3.0% for the leverage ratio, 8.75% for the CET1 ratio, 10.25% for the Tier1 ratio and 12.25% for the Total Capital ratio, evidencing once again our strong capital position. As of the same date, in addition to the minimum legal capital requirements we were subject to: (i) a counter-cyclical buffer of 0.5% over RWA that will increase to 1.0% starting May 2028, (ii) a conservation buffer of 2.5% over RWA, and (iii) a systemic capital charge of 1.25% over RWA assigned to us and reaffirmed by the CMF on March 27, 2026. Finally, on July 3, 2026, the CMF published for public comment a second proposal of changes to the standardized methodology for the measurement of Market-RWA (RAN 21-7), which unwind the previously proposed change to the standardized methodology while introducing the chance for banks to measure the interest rate risk in the trading book based on duration instead of maturity, to the extent approved by the CMF. If enacted, and approved by the CMF, banks could reduce Market-RWA by approximately
Risk & Capital Management | 66 34% (~25 bp. in capital adequacy depending on the indicator). The comment period for this proposal ended on July 20, 2026. Regarding the set of amendments to the corporate governance on capital and risk management matters, together with the introduction of a formal Recovery Planning process, no final rules have been published by the CMF yet. Credit Risk Ratings Our credit ratings determine the cost and terms upon which we are able to raise funding. Rating agencies evaluate us by considering diverse factors, including the financial strength, the business environment and the economic backdrop. International Credit Ratings MOODY'S Long-Term Short-Term Foreign Currency A2 P-1 Outlook Stable STANDARD & POOR'S Long-Term Short-Term Foreign Currency A A-1 Outlook Stable Local Credit Ratings HUMPHREYS Long-Term Short-Term Deposits AAA 1+ Level Outlook Stable FELLER RATE Long-Term Short-Term Deposits AAA 1+ Level Outlook Stable
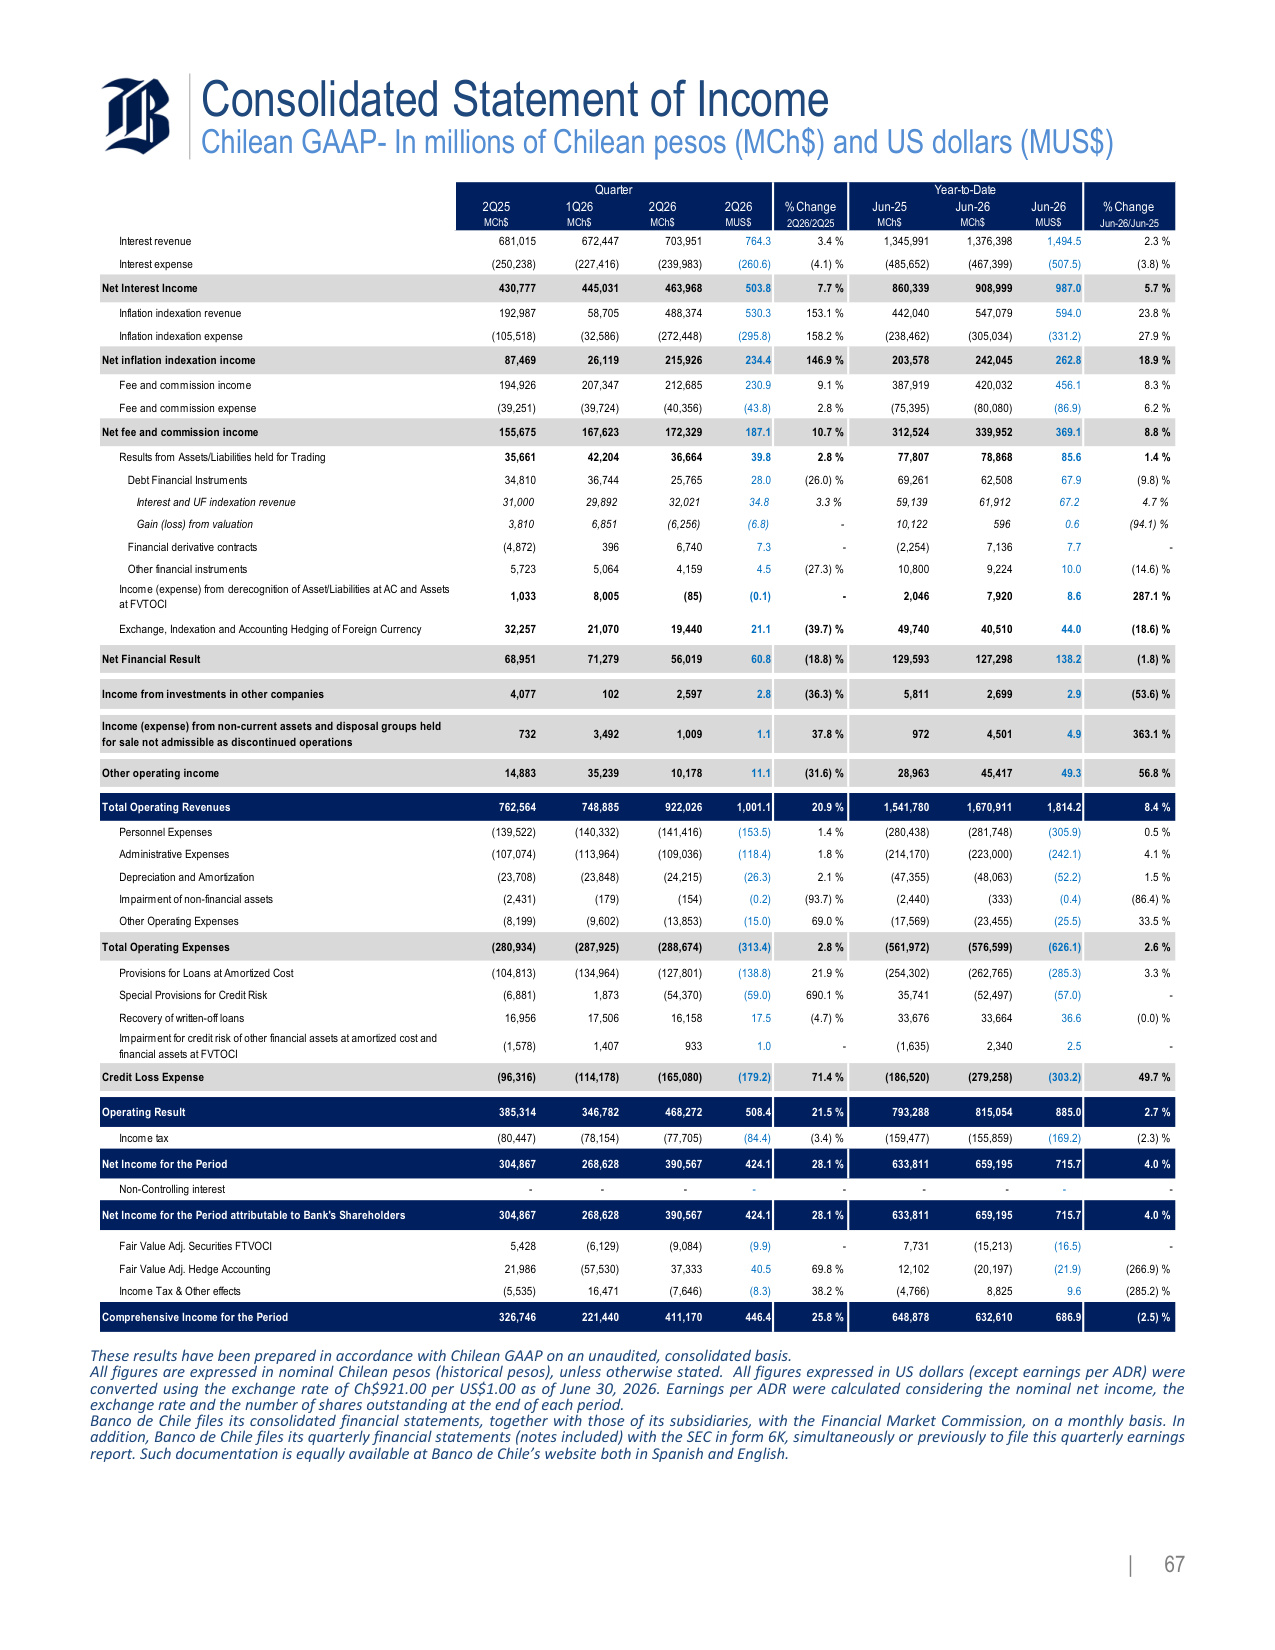
Consolidated Statement of Income Chilean GAAP- In millions of Chilean pesos (MCh$) and US dollars (MUS$) | 67 2Q25 1Q26 2Q26 2Q26 % Change Jun-25 Jun-26 Jun-26 % Change MCh$ MCh$ MCh$ MUS$ 2Q26/2Q25 MCh$ MCh$ MUS$ Jun-26/Jun-25 Interest revenue 681,015 672,447 703,951 764.3 3.4 % 1,345,991 1,376,398 1,494.5 2.3 % Interest expense (250,238) (227,416) (239,983) (260.6) (4.1) % (485,652) (467,399) (507.5) (3.8) % Net Interest Income 430,777 445,031 463,968 503.8 7.7 % 860,339 908,999 987.0 5.7 % Inflation indexation revenue 192,987 58,705 488,374 530.3 153.1 % 442,040 547,079 594.0 23.8 % Inflation indexation expense (105,518) (32,586) (272,448) (295.8) 158.2 % (238,462) (305,034) (331.2) 27.9 % Net inflation indexation income 87,469 26,119 215,926 234.4 146.9 % 203,578 242,045 262.8 18.9 % Fee and commission income 194,926 207,347 212,685 230.9 9.1 % 387,919 420,032 456.1 8.3 % Fee and commission expense (39,251) (39,724) (40,356) (43.8) 2.8 % (75,395) (80,080) (86.9) 6.2 % Net fee and commission income 155,675 167,623 172,329 187.1 10.7 % 312,524 339,952 369.1 8.8 % Results from Assets/Liabilities held for Trading 35,661 42,204 36,664 39.8 2.8 % 77,807 78,868 85.6 1.4 % Debt Financial Instruments 34,810 36,744 25,765 28.0 (26.0) % 69,261 62,508 67.9 (9.8) % Interest and UF indexation revenue 31,000 29,892 32,021 34.8 3.3 % 59,139 61,912 67.2 4.7 % Gain (loss) from valuation 3,810 6,851 (6,256) (6.8) - 10,122 596 0.6 (94.1) % Financial derivative contracts (4,872) 396 6,740 7.3 - (2,254) 7,136 7.7 - Other financial instruments 5,723 5,064 4,159 4.5 (27.3) % 10,800 9,224 10.0 (14.6) % Income (expense) from derecognition of Asset/Liabilities at AC and Assets at FVTOCI 1,033 8,005 (85) (0.1) - 2,046 7,920 8.6 287.1 % Exchange, Indexation and Accounting Hedging of Foreign Currency 32,257 21,070 19,440 21.1 (39.7) % 49,740 40,510 44.0 (18.6) % Net Financial Result 68,951 71,279 56,019 60.8 (18.8) % 129,593 127,298 138.2 (1.8) % Income from investments in other companies 4,077 102 2,597 2.8 (36.3) % 5,811 2,699 2.9 (53.6) % Income (expense) from non-current assets and disposal groups held for sale not admissible as discontinued operations 732 3,492 1,009 1.1 37.8 % 972 4,501 4.9 363.1 % Other operating income 14,883 35,239 10,178 11.1 (31.6) % 28,963 45,417 49.3 56.8 % Total Operating Revenues 762,564 748,885 922,026 1,001.1 20.9 % 1,541,780 1,670,911 1,814.2 8.4 % Personnel Expenses (139,522) (140,332) (141,416) (153.5) 1.4 % (280,438) (281,748) (305.9) 0.5 % Administrative Expenses (107,074) (113,964) (109,036) (118.4) 1.8 % (214,170) (223,000) (242.1) 4.1 % Depreciation and Amortization (23,708) (23,848) (24,215) (26.3) 2.1 % (47,355) (48,063) (52.2) 1.5 % Impairment of non-financial assets (2,431) (179) (154) (0.2) (93.7) % (2,440) (333) (0.4) (86.4) % Other Operating Expenses (8,199) (9,602) (13,853) (15.0) 69.0 % (17,569) (23,455) (25.5) 33.5 % Total Operating Expenses (280,934) (287,925) (288,674) (313.4) 2.8 % (561,972) (576,599) (626.1) 2.6 % Provisions for Loans at Amortized Cost (104,813) (134,964) (127,801) (138.8) 21.9 % (254,302) (262,765) (285.3) 3.3 % Special Provisions for Credit Risk (6,881) 1,873 (54,370) (59.0) 690.1 % 35,741 (52,497) (57.0) - Recovery of written-off loans 16,956 17,506 16,158 17.5 (4.7) % 33,676 33,664 36.6 (0.0) % Impairment for credit risk of other financial assets at amortized cost and financial assets at FVTOCI (1,578) 1,407 933 1.0 - (1,635) 2,340 2.5 - Credit Loss Expense (96,316) (114,178) (165,080) (179.2) 71.4 % (186,520) (279,258) (303.2) 49.7 % Operating Result 385,314 346,782 468,272 508.4 21.5 % 793,288 815,054 885.0 2.7 % Income tax (80,447) (78,154) (77,705) (84.4) (3.4) % (159,477) (155,859) (169.2) (2.3) % Net Income for the Period 304,867 268,628 390,567 424.1 28.1 % 633,811 659,195 715.7 4.0 % Non-Controlling interest - - - - - - - - - Net Income for the Period attributable to Bank's Shareholders 304,867 268,628 390,567 424.1 28.1 % 633,811 659,195 715.7 4.0 % Fair Value Adj. Securities FTVOCI 5,428 (6,129) (9,084) (9.9) - 7,731 (15,213) (16.5) - Fair Value Adj. Hedge Accounting 21,986 (57,530) 37,333 40.5 69.8 % 12,102 (20,197) (21.9) (266.9) % Income Tax & Other effects (5,535) 16,471 (7,646) (8.3) 38.2 % (4,766) 8,825 9.6 (285.2) % Comprehensive Income for the Period 326,746 221,440 411,170 446.4 25.8 % 648,878 632,610 686.9 (2.5) % Quarter Year-to-Date These results have been prepared in accordance with Chilean GAAP on an unaudited, consolidated basis. All figures are expressed in nominal Chilean pesos (historical pesos), unless otherwise stated. All figures expressed in US dollars (except earnings per ADR) were converted using the exchange rate of Ch$921.00 per US$1.00 as of June 30, 2026. Earnings per ADR were calculated considering the nominal net income, the exchange rate and the number of shares outstanding at the end of each period. Banco de Chile files its consolidated financial statements, together with those of its subsidiaries, with the Financial Market Commission, on a monthly basis. In addition, Banco de Chile files its quarterly financial statements (notes included) with the SEC in form 6K, simultaneously or previously to file this quarterly earnings report. Such documentation is equally available at Banco de Chile's website both in Spanish and English.
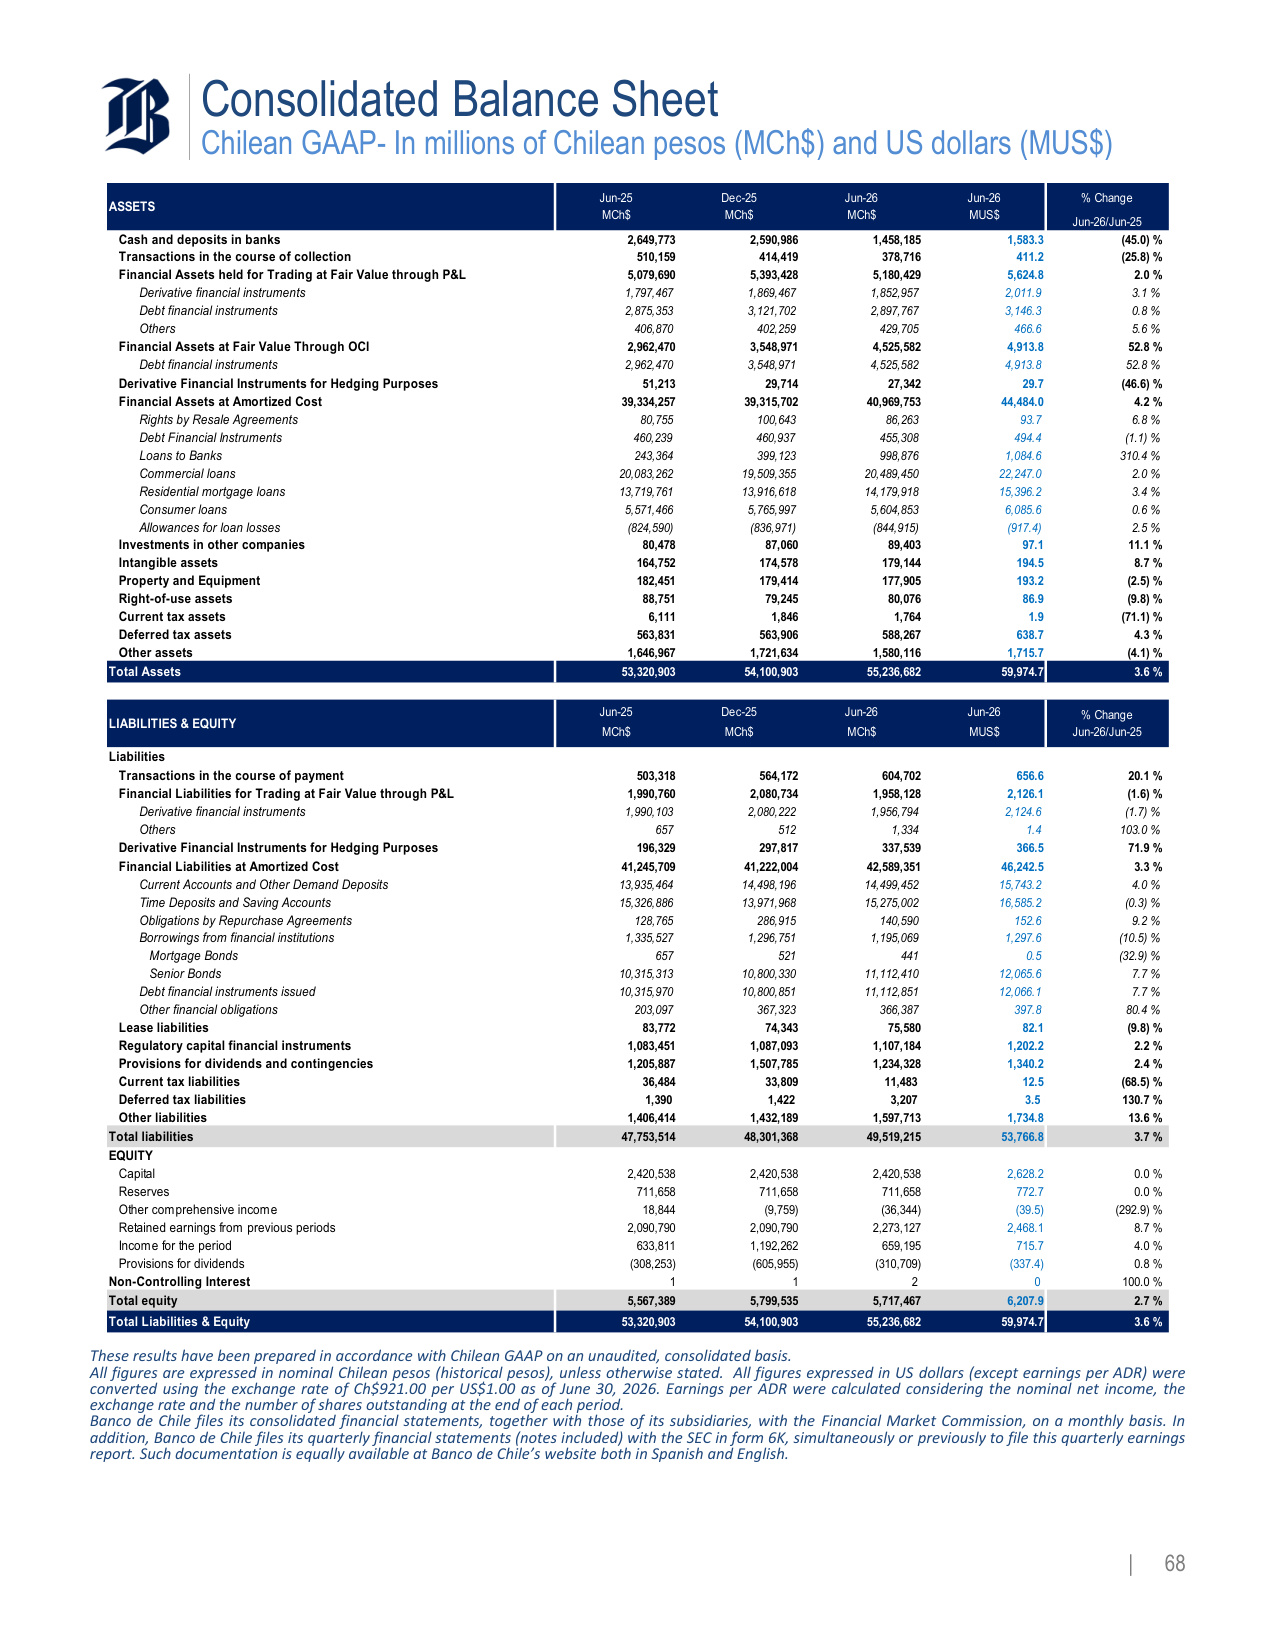
Consolidated Balance Sheet Chilean GAAP- In millions of Chilean pesos (MCh$) and US dollars (MUS$) | 68 Jun-25 Dec-25 Jun-26 Jun-26 MCh$ MCh$ MCh$ MUS$ Jun-26/Jun-25 Cash and deposits in banks 2,649,773 2,590,986 1,458,185 1,583.3 (45.0) % Transactions in the course of collection 510,159 414,419 378,716 411.2 (25.8) % Financial Assets held for Trading at Fair Value through P&L 5,079,690 5,393,428 5,180,429 5,624.8 2.0 % Derivative financial instruments 1,797,467 1,869,467 1,852,957 2,011.9 3.1 % Debt financial instruments 2,875,353 3,121,702 2,897,767 3,146.3 0.8 % Others 406,870 402,259 429,705 466.6 5.6 % Financial Assets at Fair Value Through OCI 2,962,470 3,548,971 4,525,582 4,913.8 52.8 % Debt financial instruments 2,962,470 3,548,971 4,525,582 4,913.8 52.8 % Derivative Financial Instruments for Hedging Purposes 51,213 29,714 27,342 29.7 (46.6) % Financial Assets at Amortized Cost 39,334,257 39,315,702 40,969,753 44,484.0 4.2 % Rights by Resale Agreements 80,755 100,643 86,263 93.7 6.8 % Debt Financial Instruments 460,239 460,937 455,308 494.4 (1.1) % Loans to Banks 243,364 399,123 998,876 1,084.6 310.4 % Commercial loans 20,083,262 19,509,355 20,489,450 22,247.0 2.0 % Residential mortgage loans 13,719,761 13,916,618 14,179,918 15,396.2 3.4 % Consumer loans 5,571,466 5,765,997 5,604,853 6,085.6 0.6 % Allowances for loan losses (824,590) (836,971) (844,915) (917.4) 2.5 % Investments in other companies 80,478 87,060 89,403 97.1 11.1 % Intangible assets 164,752 174,578 179,144 194.5 8.7 % Property and Equipment 182,451 179,414 177,905 193.2 (2.5) % Right-of-use assets 88,751 79,245 80,076 86.9 (9.8) % Current tax assets 6,111 1,846 1,764 1.9 (71.1) % Deferred tax assets 563,831 563,906 588,267 638.7 4.3 % Other assets 1,646,967 1,721,634 1,580,116 1,715.7 (4.1) % Total Assets 53,320,903 54,100,903 55,236,682 59,974.7 3.6 % Jun-25 Dec-25 Jun-26 Jun-26 MCh$ MCh$ MCh$ MUS$ Jun-26/Jun-25 Liabilities Transactions in the course of payment 503,318 564,172 604,702 656.6 20.1 % Financial Liabilities for Trading at Fair Value through P&L 1,990,760 2,080,734 1,958,128 2,126.1 (1.6) % Derivative financial instruments 1,990,103 2,080,222 1,956,794 2,124.6 (1.7) % Others 657 512 1,334 1.4 103.0 % Derivative Financial Instruments for Hedging Purposes 196,329 297,817 337,539 366.5 71.9 % Financial Liabilities at Amortized Cost 41,245,709 41,222,004 42,589,351 46,242.5 3.3 % Current Accounts and Other Demand Deposits 13,935,464 14,498,196 14,499,452 15,743.2 4.0 % Time Deposits and Saving Accounts 15,326,886 13,971,968 15,275,002 16,585.2 (0.3) % Obligations by Repurchase Agreements 128,765 286,915 140,590 152.6 9.2 % Borrowings from financial institutions 1,335,527 1,296,751 1,195,069 1,297.6 (10.5) % Mortgage Bonds 657 521 441 0.5 (32.9) % Senior Bonds 10,315,313 10,800,330 11,112,410 12,065.6 7.7 % Debt financial instruments issued 10,315,970 10,800,851 11,112,851 12,066.1 7.7 % Other financial obligations 203,097 367,323 366,387 397.8 80.4 % Lease liabilities 83,772 74,343 75,580 82.1 (9.8) % Regulatory capital financial instruments 1,083,451 1,087,093 1,107,184 1,202.2 2.2 % Provisions for dividends and contingencies 1,205,887 1,507,785 1,234,328 1,340.2 2.4 % Current tax liabilities 36,484 33,809 11,483 12.5 (68.5) % Deferred tax liabilities 1,390 1,422 3,207 3.5 130.7 % Other liabilities 1,406,414 1,432,189 1,597,713 1,734.8 13.6 % Total liabilities 47,753,514 48,301,368 49,519,215 53,766.8 3.7 % EQUITY Capital 2,420,538 2,420,538 2,420,538 2,628.2 0.0 % Reserves 711,658 711,658 711,658 772.7 0.0 % Other comprehensive income 18,844 (9,759) (36,344) (39.5) (292.9) % Retained earnings from previous periods 2,090,790 2,090,790 2,273,127 2,468.1 8.7 % Income for the period 633,811 1,192,262 659,195 715.7 4.0 % Provisions for dividends (308,253) (605,955) (310,709) (337.4) 0.8 % Non-Controlling Interest 1 1 2 0 100.0 % Total equity 5,567,389 5,799,535 5,717,467 6,207.9 2.7 % Total Liabilities & Equity 53,320,903 54,100,903 55,236,682 59,974.7 3.6 % ASSETS % Change LIABILITIES & EQUITY % Change These results have been prepared in accordance with Chilean GAAP on an unaudited, consolidated basis. All figures are expressed in nominal Chilean pesos (historical pesos), unless otherwise stated. All figures expressed in US dollars (except earnings per ADR) were converted using the exchange rate of Ch$921.00 per US$1.00 as of June 30, 2026. Earnings per ADR were calculated considering the nominal net income, the exchange rate and the number of shares outstanding at the end of each period. Banco de Chile files its consolidated financial statements, together with those of its subsidiaries, with the Financial Market Commission, on a monthly basis. In addition, Banco de Chile files its quarterly financial statements (notes included) with the SEC in form 6K, simultaneously or previously to file this quarterly earnings report. Such documentation is equally available at Banco de Chile's website both in Spanish and English.
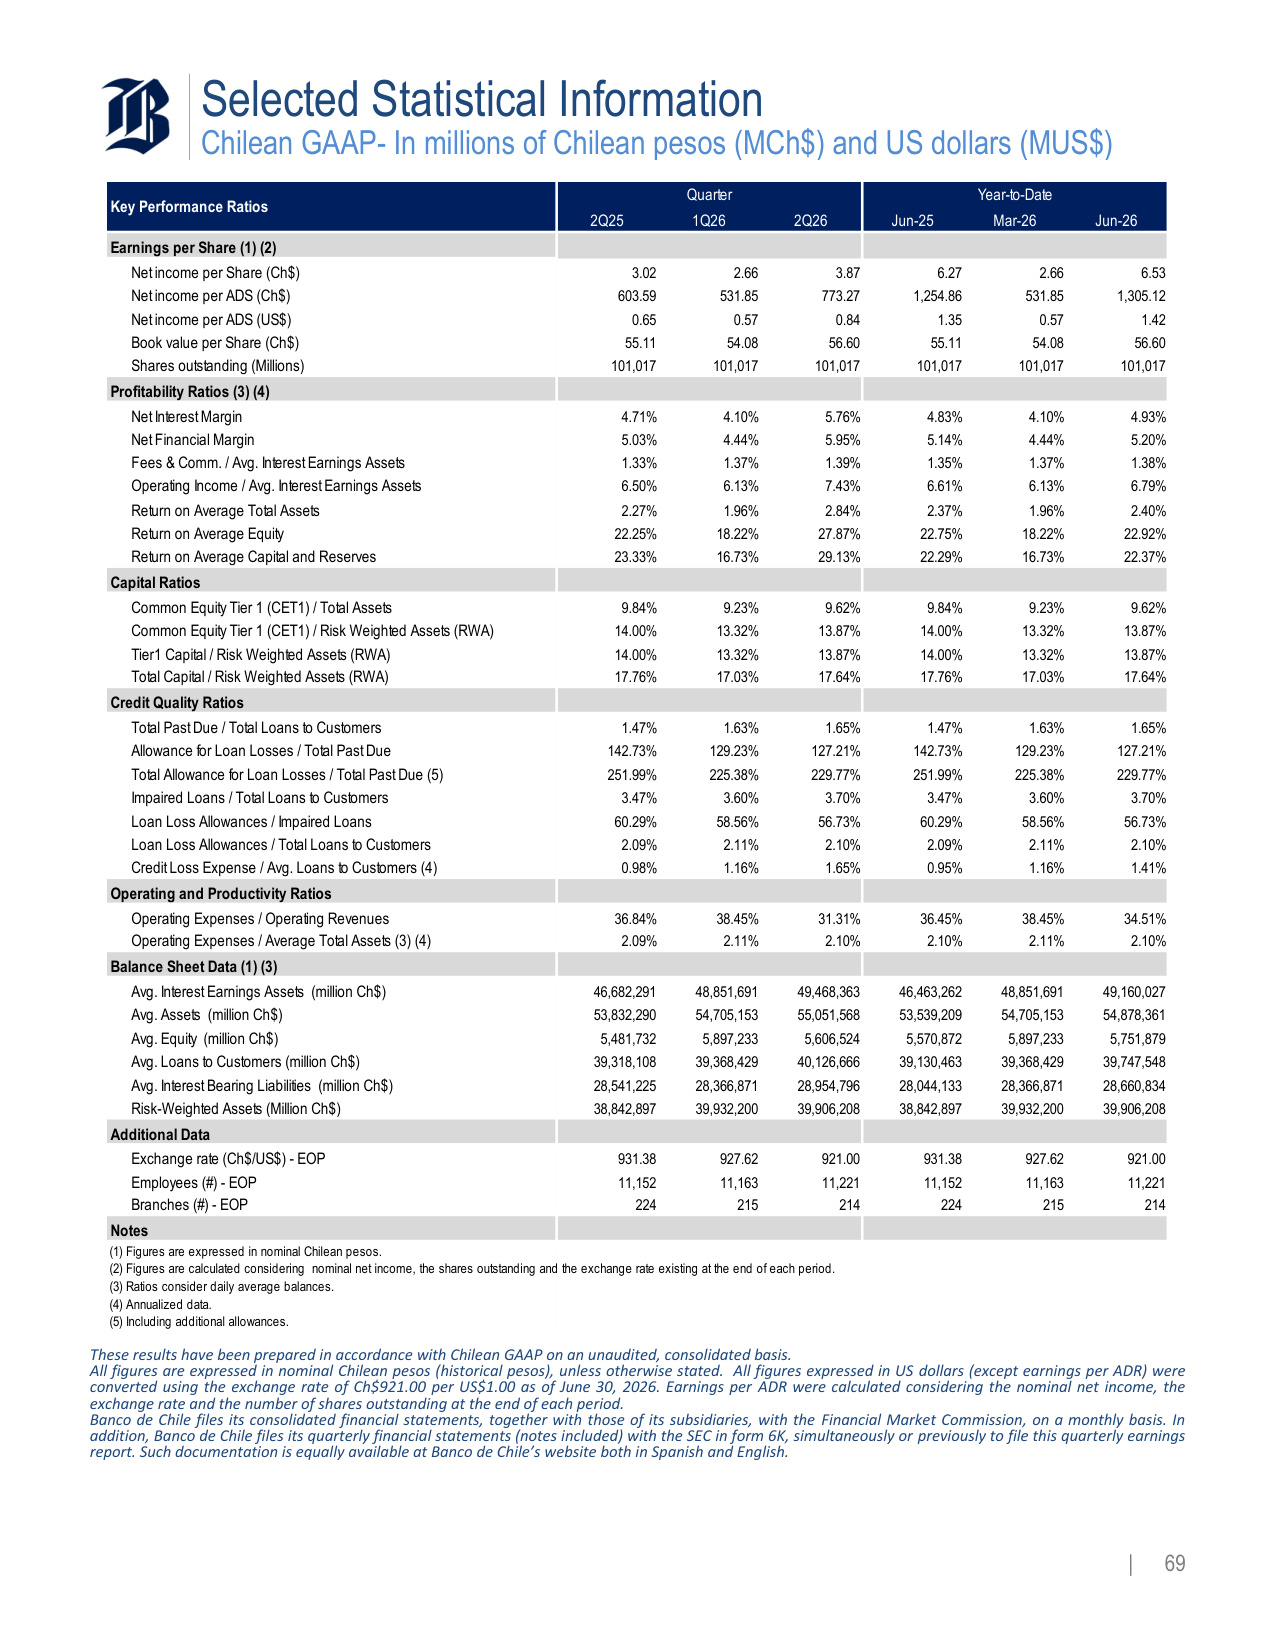
Selected Statistical Information Chilean GAAP- In millions of Chilean pesos (MCh$) and US dollars (MUS$) | 69 2Q25 1Q26 2Q26 Jun-25 Mar-26 Jun-26 Earnings per Share (1) (2) Net income per Share (Ch$) 3.02 2.66 3.87 6.27 2.66 6.53 Net income per ADS (Ch$) 603.59 531.85 773.27 1,254.86 531.85 1,305.12 Net income per ADS (US$) 0.65 0.57 0.84 1.35 0.57 1.42 Book value per Share (Ch$) 55.11 54.08 56.60 55.11 54.08 56.60 Shares outstanding (Millions) 101,017 101,017 101,017 101,017 101,017 101,017 Profitability Ratios (3) (4) Net Interest Margin 4.71% 4.10% 5.76% 4.83% 4.10% 4.93% Net Financial Margin 5.03% 4.44% 5.95% 5.14% 4.44% 5.20% Fees & Comm. / Avg. Interest Earnings Assets 1.33% 1.37% 1.39% 1.35% 1.37% 1.38% Operating Income / Avg. Interest Earnings Assets 6.50% 6.13% 7.43% 6.61% 6.13% 6.79% Return on Average Total Assets 2.27% 1.96% 2.84% 2.37% 1.96% 2.40% Return on Average Equity 22.25% 18.22% 27.87% 22.75% 18.22% 22.92% Return on Average Capital and Reserves 23.33% 16.73% 29.13% 22.29% 16.73% 22.37% Capital Ratios Common Equity Tier 1 (CET1) / Total Assets 9.84% 9.23% 9.62% 9.84% 9.23% 9.62% Common Equity Tier 1 (CET1) / Risk Weighted Assets (RWA) 14.00% 13.32% 13.87% 14.00% 13.32% 13.87% Tier1 Capital / Risk Weighted Assets (RWA) 14.00% 13.32% 13.87% 14.00% 13.32% 13.87% Total Capital / Risk Weighted Assets (RWA) 17.76% 17.03% 17.64% 17.76% 17.03% 17.64% Credit Quality Ratios Total Past Due / Total Loans to Customers 1.47% 1.63% 1.65% 1.47% 1.63% 1.65% Allowance for Loan Losses / Total Past Due 142.73% 129.23% 127.21% 142.73% 129.23% 127.21% Total Allowance for Loan Losses / Total Past Due (5) 251.99% 225.38% 229.77% 251.99% 225.38% 229.77% Impaired Loans / Total Loans to Customers 3.47% 3.60% 3.70% 3.47% 3.60% 3.70% Loan Loss Allowances / Impaired Loans 60.29% 58.56% 56.73% 60.29% 58.56% 56.73% Loan Loss Allowances / Total Loans to Customers 2.09% 2.11% 2.10% 2.09% 2.11% 2.10% Credit Loss Expense / Avg. Loans to Customers (4) 0.98% 1.16% 1.65% 0.95% 1.16% 1.41% Operating and Productivity Ratios Operating Expenses / Operating Revenues 36.84% 38.45% 31.31% 36.45% 38.45% 34.51% Operating Expenses / Average Total Assets (3) (4) 2.09% 2.11% 2.10% 2.10% 2.11% 2.10% Balance Sheet Data (1) (3) Avg. Interest Earnings Assets (million Ch$) 46,682,291 48,851,691 49,468,363 46,463,262 48,851,691 49,160,027 Avg. Assets (million Ch$) 53,832,290 54,705,153 55,051,568 53,539,209 54,705,153 54,878,361 Avg. Equity (million Ch$) 5,481,732 5,897,233 5,606,524 5,570,872 5,897,233 5,751,879 Avg. Loans to Customers (million Ch$) 39,318,108 39,368,429 40,126,666 39,130,463 39,368,429 39,747,548 Avg. Interest Bearing Liabilities (million Ch$) 28,541,225 28,366,871 28,954,796 28,044,133 28,366,871 28,660,834 Risk-Weighted Assets (Million Ch$) 38,842,897 39,932,200 39,906,208 38,842,897 39,932,200 39,906,208 Additional Data Exchange rate (Ch$/US$) - EOP 931.38 927.62 921.00 931.38 927.62 921.00 Employees (#) - EOP 11,152 11,163 11,221 11,152 11,163 11,221 Branches (#) - EOP 224 215 214 224 215 214 Notes (1) Figures are expressed in nominal Chilean pesos. (2) Figures are calculated considering nominal net income, the shares outstanding and the exchange rate existing at the end of each period. (3) Ratios consider daily average balances. (4) Annualized data. (5) Including additional allowances. Quarter Year-to-Date Key Performance Ratios These results have been prepared in accordance with Chilean GAAP on an unaudited, consolidated basis. All figures are expressed in nominal Chilean pesos (historical pesos), unless otherwise stated. All figures expressed in US dollars (except earnings per ADR) were converted using the exchange rate of Ch$921.00 per US$1.00 as of June 30, 2026. Earnings per ADR were calculated considering the nominal net income, the exchange rate and the number of shares outstanding at the end of each period. Banco de Chile files its consolidated financial statements, together with those of its subsidiaries, with the Financial Market Commission, on a monthly basis. In addition, Banco de Chile files its quarterly financial statements (notes included) with the SEC in form 6K, simultaneously or previously to file this quarterly earnings report. Such documentation is equally available at Banco de Chile's website both in Spanish and English.
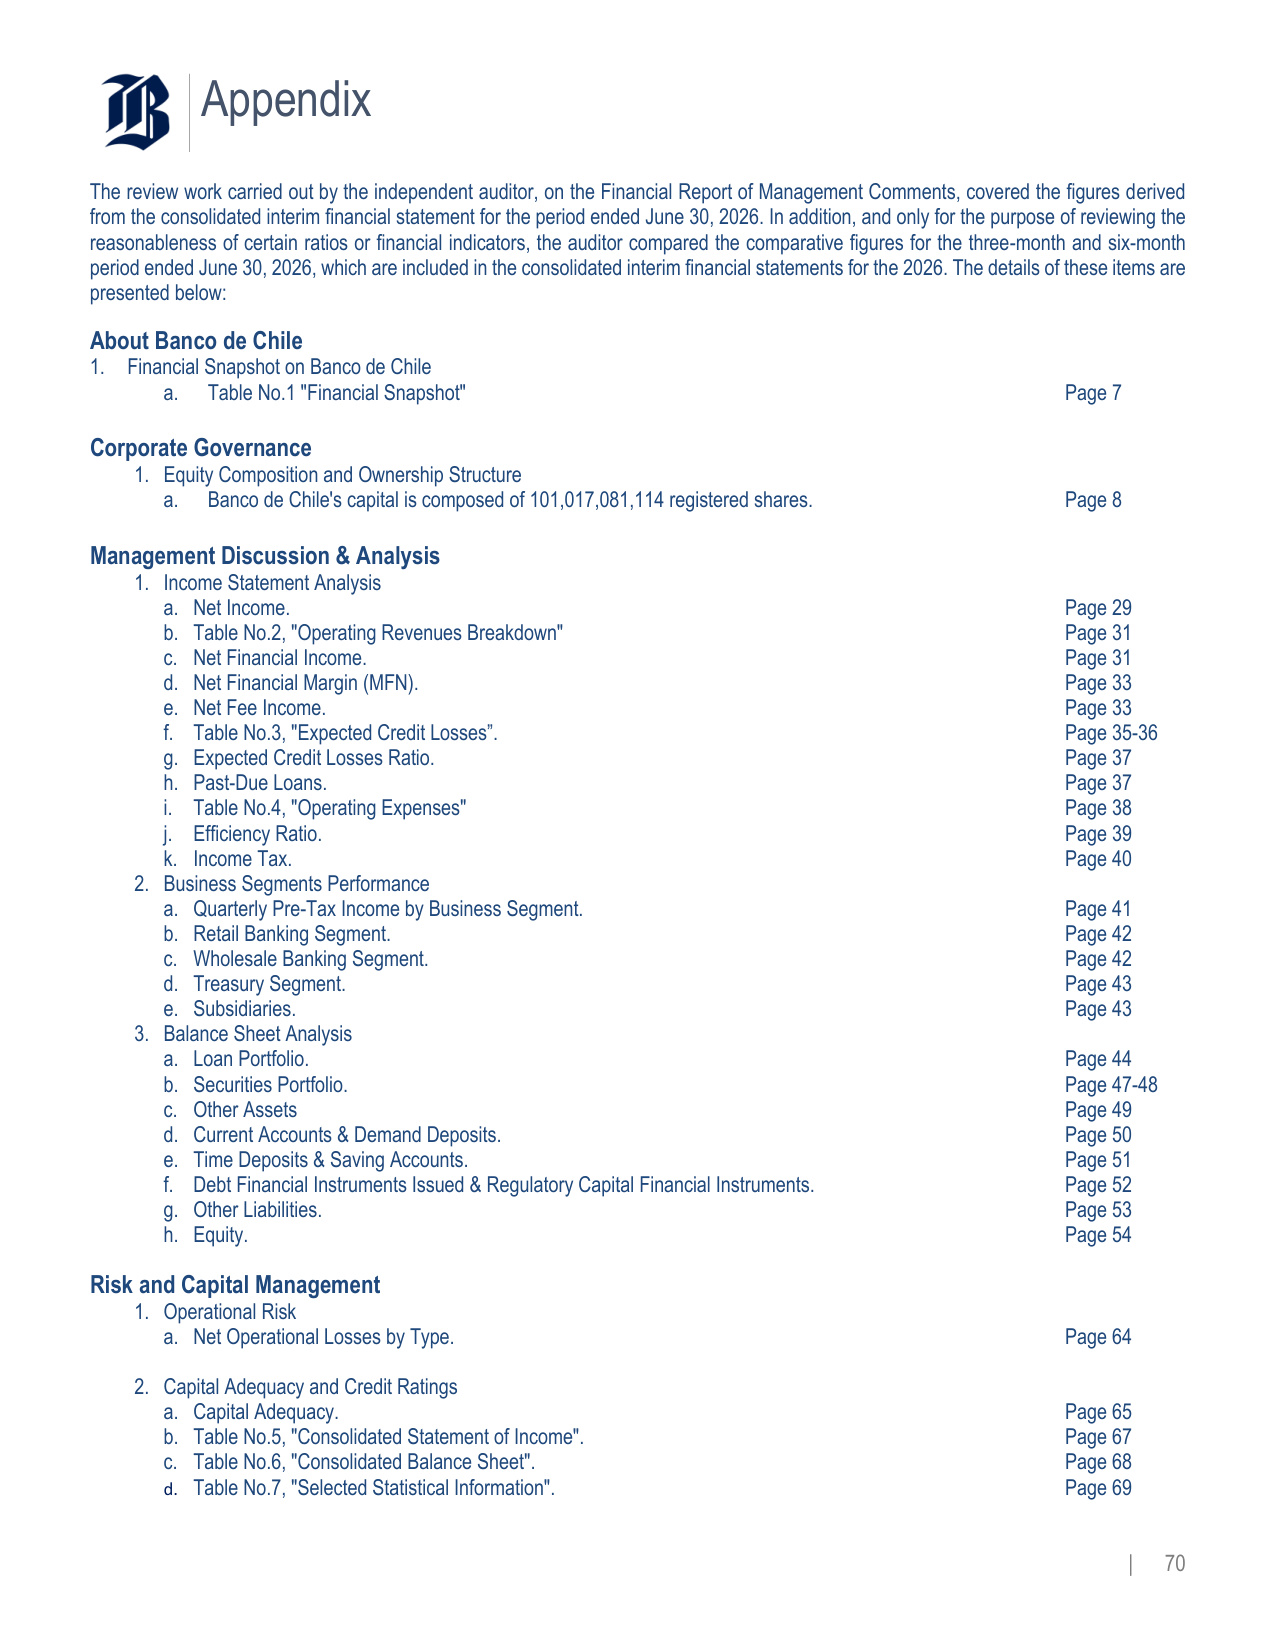
Appendix | 70 The review work carried out by the independent auditor, on the Financial Report of Management Comments, covered the figures derived from the consolidated interim financial statement for the period ended June 30, 2026. In addition, and only for the purpose of reviewing the reasonableness of certain ratios or financial indicators, the auditor compared the comparative figures for the three-month and six-month period ended June 30, 2026, which are included in the consolidated interim financial statements for the 2026. The details of these items are presented below: About Banco de Chile 1. Financial Snapshot on Banco de Chile a. Table No.1 "Financial Snapshot" Page 7 Corporate Governance 1. Equity Composition and Ownership Structure a. Banco de Chile's capital is composed of 101,017,081,114 registered shares. Page 8 Management Discussion & Analysis 1. Income Statement Analysis a. Net Income. Page 29 b. Table No.2, "Operating Revenues Breakdown" Page 31 c. Net Financial Income. Page 31 d. Net Financial Margin (MFN). Page 33 e. Net Fee Income. Page 33 f. Table No.3, "Expected Credit Losses". Page 35-36 g. Expected Credit Losses Ratio. Page 37 h. Past-Due Loans. Page 37 i. Table No.4, "Operating Expenses" Page 38 j. Efficiency Ratio. Page 39 k. Income Tax. Page 40 2. Business Segments Performance a. Quarterly Pre-Tax Income by Business Segment. Page 41 b. Retail Banking Segment. Page 42 c. Wholesale Banking Segment. Page 42 d. Treasury Segment. Page 43 e. Subsidiaries. Page 43 3. Balance Sheet Analysis a. Loan Portfolio. Page 44 b. Securities Portfolio. Page 47-48 c. Other Assets Page 49 d. Current Accounts & Demand Deposits. Page 50 e. Time Deposits & Saving Accounts. Page 51 f. Debt Financial Instruments Issued & Regulatory Capital Financial Instruments. Page 52 g. Other Liabilities. Page 53 h. Equity. Page 54 Risk and Capital Management 1. Operational Risk a. Net Operational Losses by Type. Page 64 2. Capital Adequacy and Credit Ratings a. Capital Adequacy. Page 65 b. Table No.5, "Consolidated Statement of Income". Page 67 c. Table No.6, "Consolidated Balance Sheet". Page 68 d. Table No.7, "Selected Statistical Information". Page 69