Shareholder Report
May 31, 2026
USD ($)
Holding
What were the fund costs for the last year?
(based on a hypothe
tical $10,000
inv
est
m
e
nt
)| Share class | Costs of a $10 ,000 i nvestm e nt | Costs paid as a percentage of a $10,000 investment |
| Class A | $ 71 | 0.69 % |
Management's discussion of fund performance
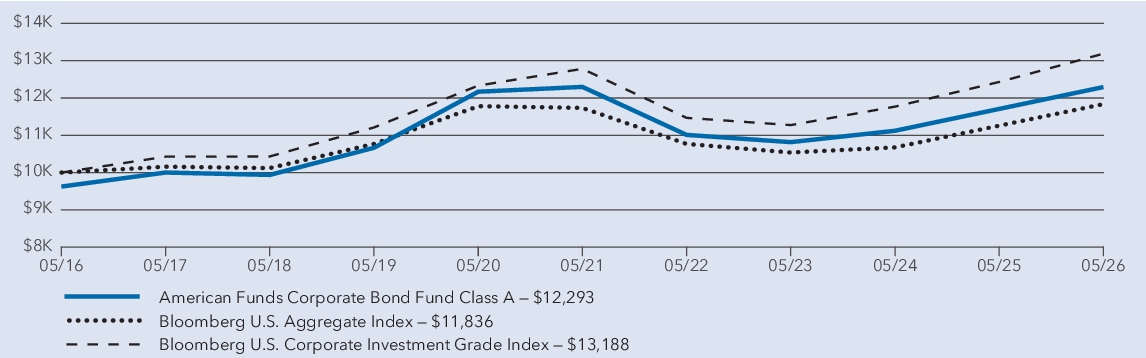
The fund’s Class A shares gained 5.01% for the year ended May 31, 2026. That result compares with a 6.09% gain for the Bloomberg U.S. Corporate Investment Grade Index. For information on returns for additional periods, including the fund lifetime, please refer to
capitalgroup.com/mutual-fund-returns-A
.What factors influenced results
During the fund’s fiscal year, U.S. corporate bonds posted strong returns. The U.S. economy remained resilient, although a softening labor market prompted the U.S. Federal Reserve to implement three 25-basis-point rate cuts over the period. Treasury yields varied, ending the period at their highest level since January. Meanwhile, credit spreads tightened modestly, underpinned by strong investor demand and resilient corporate fundamentals.
Within the fund, holdings in consumer non-cyclical and Treasuries sectors were particularly additive to results, relative to the benchmark, the Bloomberg U.S. Corporate Investment Grade Index. Similarly, holdings in electric utilities and insurance contributed to relative returns.
Conversely, investments in banking and energy-related bonds weighed on results, relative to the index. To a lesser degree, holdings in technology and consumer cyclical sectors detracted. Additionally, exposure to derivatives, duration and curve positioning lagged the overall portfolio.
Average
annual
total returns| 1 year | 5 years | 10 years | |
| American Funds Corporate Bond Fund — Class A (with sales charge) * | 1.02 % | (0.78 ) % | 2.09 % |
| American Funds Corporate Bond Fund — Class A (without sales charge) * | 5.01 % | (0.01 ) % | 2.48 % |
| Bloomberg U.S. Aggregate Index † | 5.13 % | 0.17 % | 1.70 % |
| Bloomberg U.S. Corporate Investment Grade Index † | 6.09 % | 0.63 % | 2.81 % |
*
Investment results assume all distributions are reinvested and reflect applicable
fees and expenses. When applicable, results reflect fee waivers and/or expense reimbursements, without which they would have been lower.†
Results assume all distributions are reinvested. Any market index shown is unmanaged, and therefore, has no expenses. Investors cannot invest directly in an index. Source(s): Bloomberg Index Services Ltd.Key fund statistics
| Fund net assets (in millions) | $ 1,938 |
| Total number of portfolio holdings | 737 |
| Total advisory fees paid (in millions) | $ 5 |
| Portfolio turnover rate | 226 % |
Portfolio holdings by s
(percent of net assets)ect
or 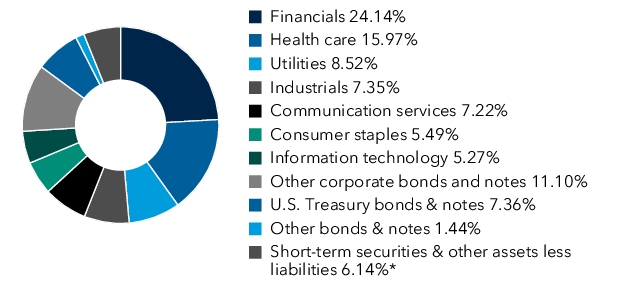
*Includes derivatives.
What were the fund costs for the last year?
(based on a hypothetical
$10,000 invest
me
nt)| Share class | Costs of a $10,000 investment | Costs paid as a percentage of a $10,000 investment |
| Class C | $ 146 | 1.43 % |
Management's discussion of fund performance
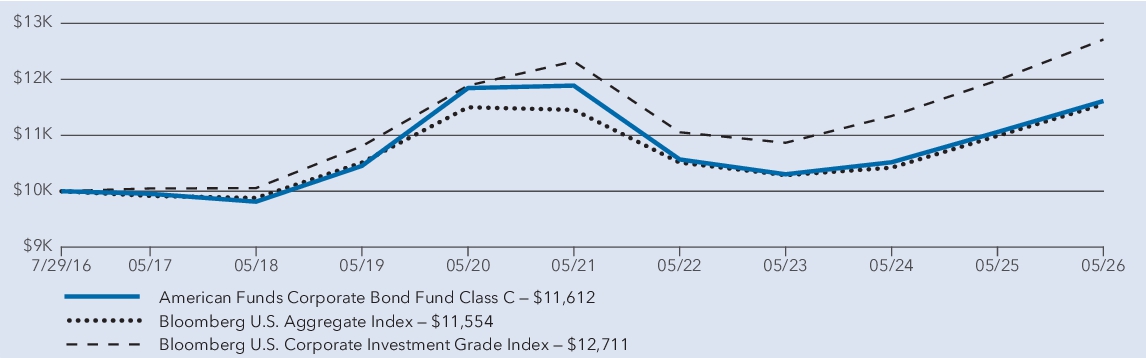
The fund’s Class C shares gained 4.24% for the year ended May 31, 2026. That result compares with a 6.09% gain for the Bloomberg U.S. Corporate Investment Grade Index. For information on returns for additional periods, including the fund lifetime, please refer to
capitalgroup.com/mutual-fund-returns-C
.What factors influenced results
During the fund’s fiscal year, U.S. corporate bonds posted strong returns. The U.S. economy remained resilient, although a softening labor market prompted the U.S. Federal Reserve to implement three 25-basis-point rate cuts over the period. Treasury yields varied, ending the period at their highest level since January. Meanwhile, credit spreads tightened modestly, underpinned by strong investor demand and resilient corporate fundamentals.
Within the fund, holdings in consumer non-cyclical and Treasuries sectors were particularly additive to results, relative to the benchmark, the Bloomberg U.S. Corporate Investment Grade Index. Similarly, holdings in electric utilities and insurance contributed to relative returns.
Conversely, investments in banking and energy-related bonds weighed on results, relative to the index. To a lesser degree, holdings in technology and consumer cyclical sectors detracted. Additionally, exposure to derivatives, duration and curve positioning lagged the overall portfolio.
Average annual total
returns
| 1 year | 5 years | Since inception 1 | |
| American Funds Corporate Bond Fund — Class C (with sales charge) 2 | 3.24 % | (0.74 ) % | 1.53 % |
| American Funds Corporate Bond Fund — Class C (without sales charge) 2 | 4.24 % | (0.74 ) % | 1.53 % |
| Bloomberg U.S. Aggregate Index 3 | 5.13 % | 0.17 % | 1.48 % |
| Bloomberg U.S. Corporate Investment Grade Index 3 | 6.09 % | 0.63 % | 2.47 % |
1
Class C shares were first offered on July 29, 2016.2
Investment results assume all distributions are reinvested and reflect applicable fees and expenses. When applicable, results reflect fee waivers and/or expense reimbursements, without which they would have been lower.3
Results assume all distributions are reinvested. Any market index shown is unmanaged, and therefore, has no expenses. Investors cannot invest directly in an index. Source(s): Bloomberg Index Services Ltd.Key fund statistics
| Fund net assets (in millions) | $ 1,938 |
| Total number of portfolio holdings | 737 |
| Total advisory fees paid (in millions) | $ 5 |
| Portfolio turnover rate | 226 % |
Portfolio holdings by sector
(percent of net assets)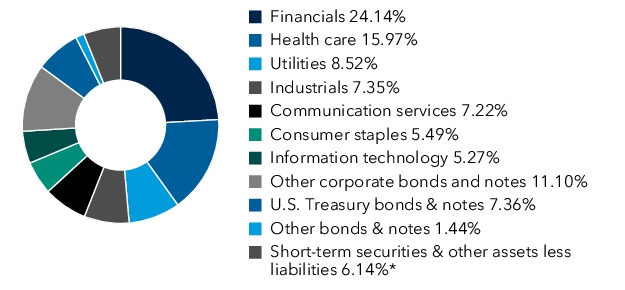
*Includes derivatives.
What were the fund costs for the last year?
(base
d on a hypothetical $10,000 investment)| Share class | Costs of a $10,000 investment | Costs paid as a percentage of a $10,000 investment |
| Class T | $ 44 | 0.43 % |
Management's discussion of fund performance
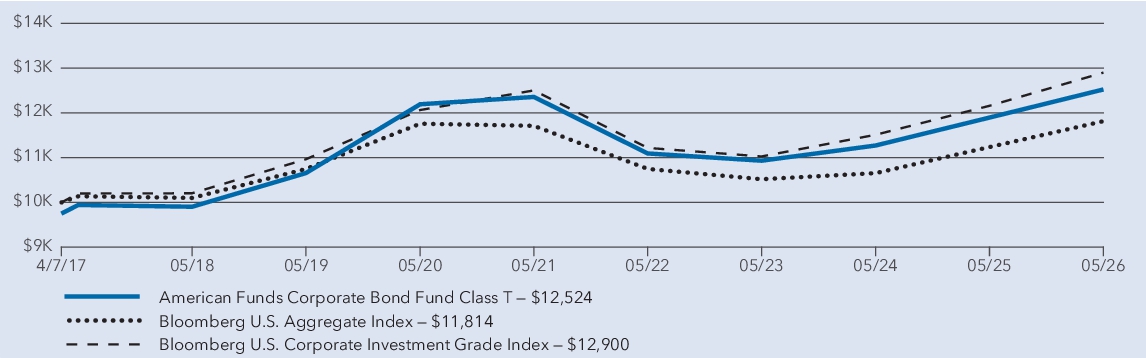
The fund’s Class T shares gained 5.28% for the year ended May 31, 2026. That result compares with a 6.09% gain for the Bloomberg U.S. Corporate Investment Grade Index.
What factors influenced results
During the fund’s fiscal year, U.S. corporate bonds posted strong returns. The U.S. economy remained resilient, although a softening labor market prompted the U.S. Federal Reserve to implement three 25-basis-point rate cuts over the period. Treasury yields varied, ending the period at their highest level since January. Meanwhile, credit spreads tightened modestly, underpinned by strong investor demand and resilient corporate fundamentals.
Within the fund, holdings in consumer non-cyclical and Treasuries sectors were particularly additive to results, relative to the benchmark, the Bloomberg U.S. Corporate Investment Grade Index. Similarly, holdings in electric utilities and insurance contributed to relative returns.
Conversely, investments in banking and energy-related bonds weighed on results, relative to the index. To a lesser degree, holdings in technology and consumer cyclical sectors detracted. Additionally, exposure to derivatives, duration and curve positioning lagged the overall portfolio.
Average annual
total
returns| 1 year | 5 years | Since inception 1 | |
| American Funds Corporate Bond Fund — Class T (with sales charge) 2 | 2.65 % | (0.24 ) % | 2.49 % |
| American Funds Corporate Bond Fund — Class T (without sales charge) 2 | 5.28 % | 0.27 % | 2.77 % |
| Bloomberg U.S. Aggregate Index 3 | 5.13 % | 0.17 % | 1.84 % |
| Bloomberg U.S. Corporate Investment Grade Index 3 | 6.09 % | 0.63 % | 2.82 % |
1
Class T shares were first offered on April 7, 2017.2
Investment results assume all distributions are reinvested and reflect applicable fees and expenses. When applicable, results reflect fee waivers and/or expense reimbursements, without which they would have been lower.3
Results assume all distributions are reinvested. Any market index shown is unmanaged, and therefore, has no expenses. Investors cannot invest directly in an index. Source(s): Bloomberg Index Services Ltd.Key fund statistics
| Fund net assets (in millions) | $ 1,938 |
| Total number of portfolio holdings | 737 |
| Total advisory fees paid (in millions) | $ 5 |
| Portfolio turnover rate | 226 % |
Portfolio holdings by sector
(percent of net assets)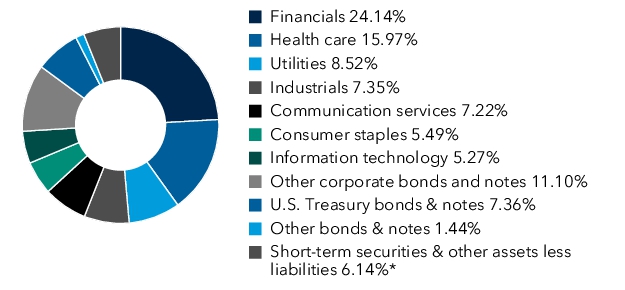
*Includes derivatives.
What were the fund
(based on a hypothetical $10,000 investment)costs
for the last year?| Share class | Costs of a $10,000 investment | Costs paid as a percentage of a $10,000 investment |
| Class F-1 | $ 71 | 0.69 % |
Management's discussion of fund performance
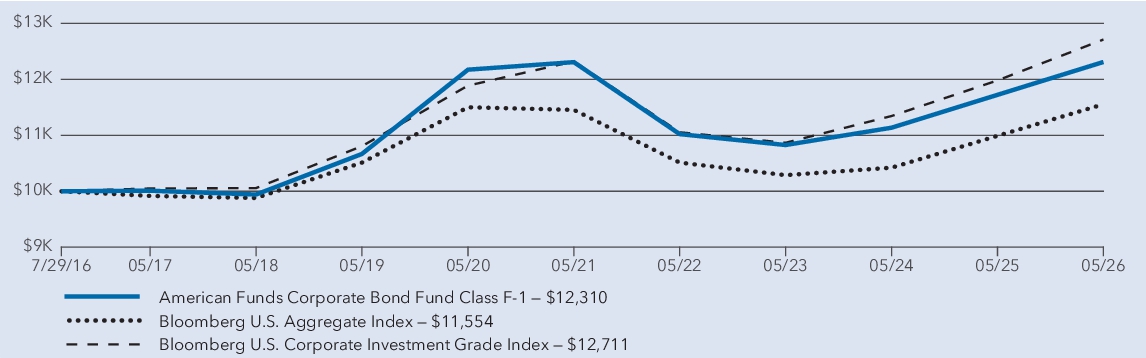
The fund’s Class F-1 shares gained 5.01% for the year ended May 31, 2026. That result compares with a 6.09% gain for the Bloomberg U.S. Corporate Investment Grade Index. For information on returns for additional periods, including the fund lifetime, please refer to
capitalgroup.com/mutual-fund-returns-F1
.What factors influenced results
During the fund’s fiscal year, U.S. corporate bonds posted strong returns. The U.S. economy remained resilient, although a softening labor market prompted the U.S. Federal Reserve to implement three 25-basis-point rate cuts over the period. Treasury yields varied, ending the period at their highest level since January. Meanwhile, credit spreads tightened modestly, underpinned by strong investor demand and resilient corporate fundamentals.
Within the fund, holdings in consumer non-cyclical and Treasuries sectors were particularly additive to results, relative to the benchmark, the Bloomberg U.S. Corporate Investment Grade Index. Similarly, holdings in electric utilities and insurance contributed to relative returns.
Conversely, investments in banking and energy-related bonds weighed on results, relative to the index. To a lesser degree, holdings in technology and consumer cyclical sectors detracted. Additionally, exposure to derivatives, duration and curve positioning lagged the overall portfolio.
Average annual total returns
| 1 year | 5 years | Since inception 1 | |
| American Funds Corporate Bond Fund — Class F-1 2 | 5.01 % | 0.00 % | 2.13 % |
| Bloomberg U.S. Aggregate Index 3 | 5.13 % | 0.17 % | 1.48 % |
| Bloomberg U.S. Corporate Investment Grade Index 3 | 6.09 % | 0.63 % | 2.47 % |
1
Class F-1 shares were first offered on July 29, 2016.2
Investment results assume all distributions are reinvested and reflect applicable fees and expenses. When applicable
, results reflect fee waivers and/or expense reimbursements, without which they would have been lower.3
Results assume all distributions are reinvested. Any market index shown is unmanaged, and therefore, has no expenses. Investors cannot invest directly in an index. Source(s): Bloomberg Index Services Ltd.Key fund statistics
| Fund net assets (in millions) | $ 1,938 |
| Total number of portfolio holdings | 737 |
| Total advisory fees paid (in millions) | $ 5 |
| Portfolio turnover rate | 226 % |
Portfolio holdings by sector
(percent of net assets)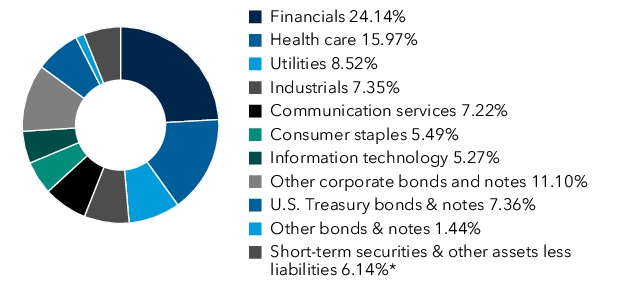
*Includes derivatives.
What were the fund costs for the last year?
(based on a hypothetical $10,000 investment)| Share class | Costs of a $10,000 investment | Costs paid as a percentage of a $10,000 investment |
| Class F-2 | $ 44 | 0.43 % |
Management's discussion of fund performance
The fund’s Class F-2 shares gained 5.28% for the year ended May 31, 2026. That result compares with a 6.09% gain for the Bloomberg U.S. Corporate Investment Grade Index. For information on returns for additional periods, including the fund lifetime, please refer to
capitalgroup.com/mutual-fund-returns-F2
.What factors influenced results
During the fund’s fiscal year, U.S. corporate bonds posted strong returns. The U.S. economy remained resilient, although a softening labor market prompted the U.S. Federal Reserve to implement three 25-basis-point rate cuts over the period. Treasury yields varied, ending the period at their highest level since January. Meanwhile, credit spreads tightened modestly, underpinned by strong investor demand and resilient corporate fundamentals.
Within the fund, holdings in consumer non-cyclical and Treasuries sectors were particularly additive to results, relative to the benchmark, the Bloomberg U.S. Corporate Investment Grade Index. Similarly, holdings in electric utilities and insurance contributed to relative returns.
Conversely, investments in banking and energy-related bonds weighed on results, relative to the index. To a lesser degree, holdings in technology and consumer cyclical sectors detracted. Additionally, exposure to derivatives, duration and curve positioning lagged the overall portfolio.
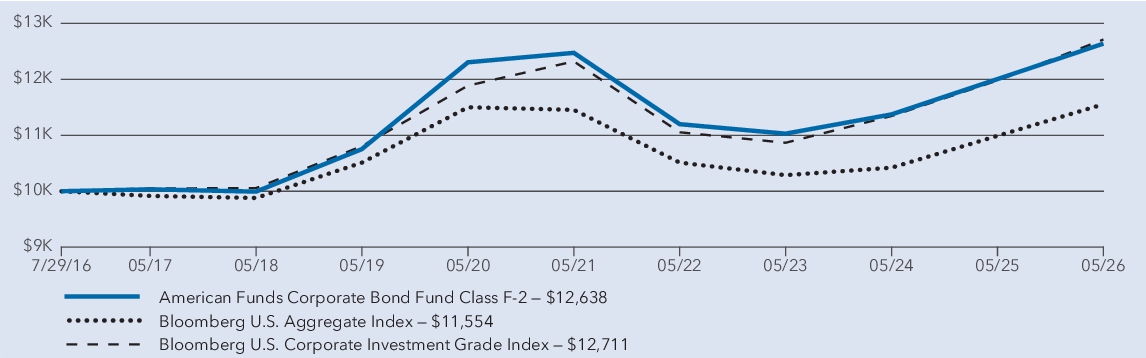
Average annual total returns
| 1 year | 5 years | Since inception 1 | |
| American Funds Corporate Bond Fund — Class F-2 2 | 5.28 % | 0.26 % | 2.41 % |
| Bloomberg U.S. Aggregate Index 3 | 5.13 % | 0.17 % | 1.48 % |
| Bloomberg U.S. Corporate Investment Grade Index 3 | 6.09 % | 0.63 % | 2.47 % |
1
Class F-2 shares were first offered on July 29, 2016.2
Investment results assume all distributions are reinvested and reflect applicable fees and expenses. When applicable, results reflect fee waivers and/or expense reimbursements, without which they would have been lower.3
Results assume all distributions are reinvested. Any market index shown is unmanaged, and therefore, has no expenses. Investors cannot invest directly in an index. Source(s): Bloomberg Index Services Ltd.Key fund statistics
| Fund net assets (in millions) | $ 1,938 |
| Total number of portfolio holdings | 737 |
| Total advisory fees paid (in millions) | $ 5 |
| Portfolio turnover rate | 226 % |
Portfolio holdings by sector
(percent of net assets)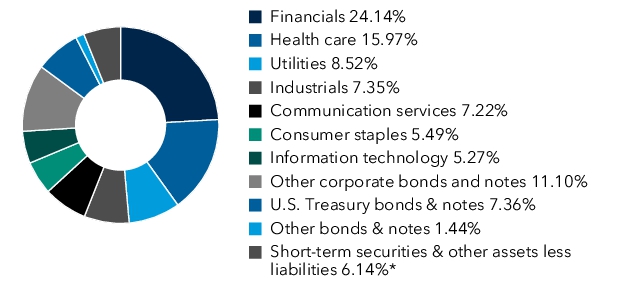
*Includes derivatives.
What were the fund costs for the last year?
(based on a hypothetical $10,000 investment)| Share class | Costs of a $10,000 investment | Costs paid as a percentage of a $10,000 investment |
| Class F-3 | $ 33 | 0.32 % |
Management's discussion of fund performance
The fund’s Class F-3 shares gained 5.40% for the year ended May 31, 2026. That result compares with a 6.09% gain for the Bloomberg U.S. Corporate Investment Grade Index. For information on returns for additional periods, including the fund lifetime, please refer to
capitalgroup.com/mutual-fund-returns-F3
.What factors influenced results
During the fund’s fiscal year, U.S. corporate bonds posted strong returns. The U.S. economy remained resilient, although a softening labor market prompted the U.S. Federal Reserve to implement three 25-basis-point rate cuts over the period. Treasury yields varied, ending the period at their highest level since January. Meanwhile, credit spreads tightened modestly, underpinned by strong investor demand and resilient corporate fundamentals.
Within the fund, holdings in consumer non-cyclical and Treasuries sectors were particularly additive to results, relative to the benchmark, the Bloomberg U.S. Corporate Investment Grade Index. Similarly, holdings in electric utilities and insurance contributed to relative returns.
Conversely, investments in banking and energy-related bonds weighed on results, relative to the index. To a lesser degree, holdings in technology and consumer cyclical sectors detracted. Additionally, exposure to derivatives, duration and curve positioning lagged the overall portfolio.
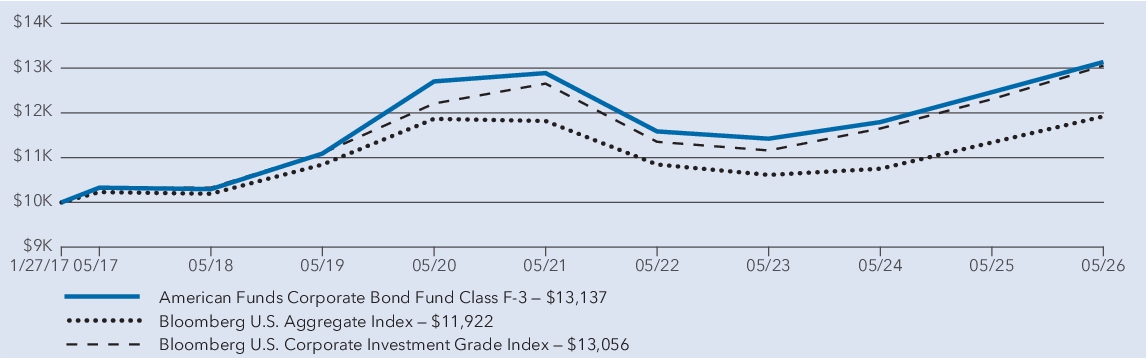
Average annual total returns
| 1 year | 5 years | Since inception 1 | |
| American Funds Corporate Bond Fund — Class F-3 2 | 5.40 % | 0.38 % | 2.96 % |
| Bloomberg U.S. Aggregate Index 3 | 5.13 % | 0.17 % | 1.90 % |
| Bloomberg U.S. Corporate Investment Grade Index 3 | 6.09 % | 0.63 % | 2.90 % |
1
Class F-3 shares were first offered on January 27, 2017.2
Investment results assume all distributions are reinvested and reflect applicable fees and expenses. When applicable, results reflect fee waivers and/or expense reimbursements, without which they would have been lower.3
Results assume all distributions are reinvested. Any market index shown is unmanaged, and therefore, has no expenses. Investors cannot invest directly in an index. Source(s): Bloomberg Index Services Ltd.Key fund statistics
| Fund net as se ts (in millions) | $ 1,938 |
| Total number of portfolio holdings | 737 |
| Total advisory fees paid (in millions) | $ 5 |
| Portfolio turnover rate | 226 % |
Portfolio holdings by sector
(percent of net assets)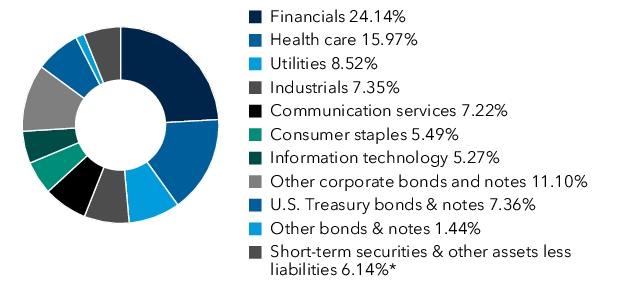
*Includes derivatives.
What were the fund costs for the last year?
(based on a hypothetical $10,000 investment)| Share class | Costs of a $10,000 investment | Costs paid as a percentage of a $10,000 investment |
| Class 529-A | $ 73 | 0.71 % |
Management's discussion of fund performance
The fund’s Class 529-A shares gained 4.99% for the year ended May 31, 2026. That result compares with a 6.09% gain for the Bloomberg U.S. Corporate Investment Grade Index. For information on returns for additional periods, including the fund lifetime, please refer to
capitalgroup.com/mutual-fund-returns-529A
.What factors influenced results
During the fund’s fiscal year, U.S. corporate bonds posted strong returns. The U.S. economy remained resilient, although a softening labor market prompted the U.S. Federal Reserve to implement three 25-basis-point rate cuts over the period. Treasury yields varied, ending the period at their highest level since January. Meanwhile, credit spreads tightened modestly, underpinned by strong investor demand and resilient corporate fundamentals.
Within the fund, holdings in consumer non-cyclical and Treasuries sectors were particularly additive to results, relative to the benchmark, the Bloomberg U.S. Corporate Investment Grade Index. Similarly, holdings in electric utilities and insurance contributed to relative returns.
Conversely, investments in banking and energy-related bonds weighed on results, relative to the index. To a lesser degree, holdings in technology and consumer cyclical sectors detracted. Additionally, exposure to derivatives, duration and curve positioning lagged the overall portfolio.
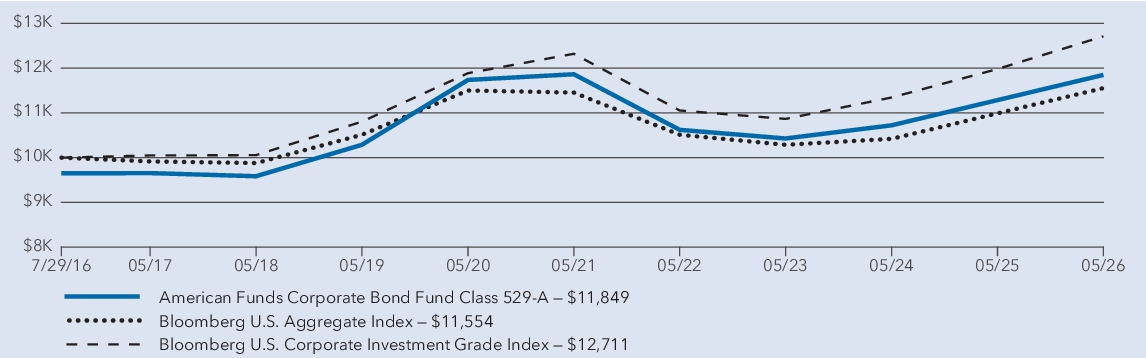
Average annual total returns
| 1 year | 5 years | Since inception 1 | |
| American Funds Corporate Bond Fund — Class 529-A (with sales charge) 2 | 1.32 % | (0.73 ) % | 1.74 % |
| American Funds Corporate Bond Fund — Class 529-A (without sales charge) 2 | 4.99 % | (0.02 ) % | 2.11 % |
| Bloomberg U.S. Aggregate Index 3 | 5.13 % | 0.17 % | 1.48 % |
| Bloomberg U.S. Corporate Investment Grade Index 3 | 6.09 % | 0.63 % | 2.47 % |
1
Class 529-A shares were first offered on July 29, 2016.2
Investment results assume all distributions are reinvested and reflect applicable fees and expenses. When applicable, results reflect fee waivers and/or expense reimbursements, without which they would have been lower.3
Results assume all distributions are reinvested. Any market index shown is unmanaged, and therefore, has no expenses. Investors cannot invest directly in an index. Source(s): Bloomberg Index Services Ltd.Key fund statistics
| Fund net assets (in millions) | $ 1,938 |
| Total number of portfolio holdings | 737 |
| Total advisory fees paid (in millions) | $ 5 |
| Portfolio turnover rate | 226 % |
Portfolio holdings by sector
(percent of net assets)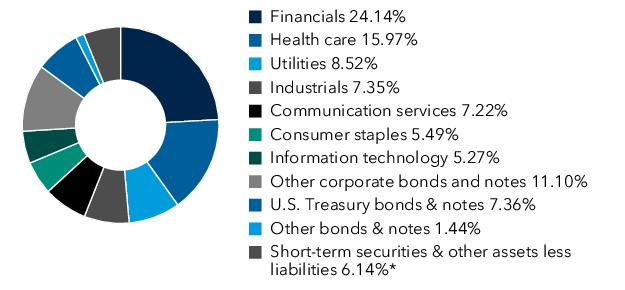
*Includes derivatives.
What were the fund costs for the last year?
(based on a hypothetical $10,000 investment)| Share class | Costs of a $10,000 investment | Costs paid as a percentage of a $10,000 investment |
| Class 529-C | $ 151 | 1.48 % |
Management's discussion of fund performance
The fund’s Class 529-C shares gained 4.19% for the year ended May 31, 2026. That result compares with a 6.09% gain for the Bloomberg U.S. Corporate Investment Grade Index. For information on returns for additional periods, including the fund lifetime, please refer to
capitalgroup.com/mutual-fund-returns-529C
.What factors influenced results
During the fund’s fiscal year, U.S. corporate bonds posted strong returns. The U.S. economy remained resilient, although a softening labor market prompted the U.S. Federal Reserve to implement three 25-basis-point rate cuts over the period. Treasury yields varied, ending the period at their highest level since January. Meanwhile, credit spreads tightened modestly, underpinned by strong investor demand and resilient corporate fundamentals.
Within the fund, holdings in consumer non-cyclical and Treasuries sectors were particularly additive to results, relative to the benchmark, the Bloomberg U.S. Corporate Investment Grade Index. Similarly, holdings in electric utilities and insurance contributed to relative returns.
Conversely, investments in banking and energy-related bonds weighed on results, relative to the index. To a lesser degree, holdings in technology and consumer cyclical sectors detracted. Additionally, exposure to derivatives, duration and curve positioning lagged the overall portfolio.
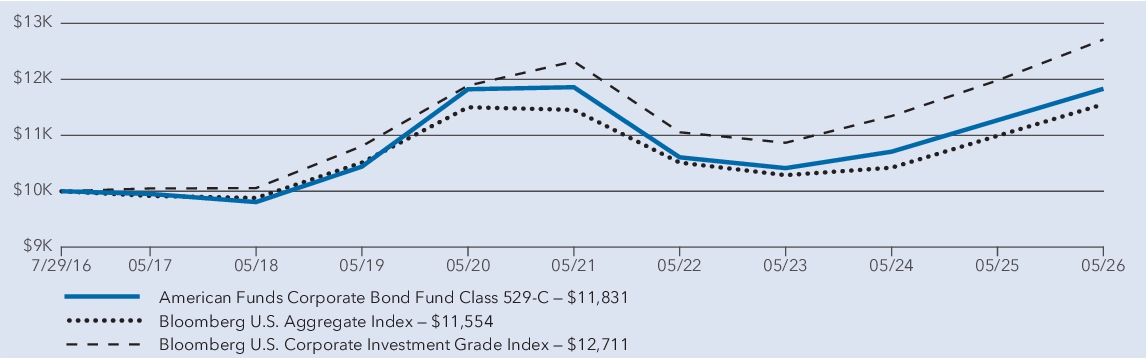
Average annual total returns
| 1 year | 5 years | Since inception 1 | |
| American Funds Corporate Bond Fund — Class 529-C (with sales charge) 2 | 3.19 % | (0.78 ) % | 1.72 % |
| American Funds Corporate Bond Fund — Class 529-C (without sales charge) 2 | 4.19 % | (0.78 ) % | 1.72 % |
| Bloomberg U.S. Aggregate Index 3 | 5.13 % | 0.17 % | 1.48 % |
| Bloomberg U.S. Corporate Investment Grade Index 3 | 6.09 % | 0.63 % | 2.47 % |
1
Class 529-C shares were first offered on July 29, 2016.2
Investment results assume all distributions are reinvested and reflect applicable fees and expenses. When applicable, results reflect fee waivers and/or expense reimbursements, without which they would have been lower.3
Results assume all distributions are reinvested. Any market index shown is unmanaged, and therefore, has no expenses. Investors cannot invest directly in an index. Source(s): Bloomberg Index Services Ltd.Key fund statistics
| Fund net assets (in millions) | $ 1,938 |
| Total number of portfolio holdings | 737 |
| Total advisory fees paid (in millions) | $ 5 |
| Portfolio turnover rate | 226 % |
Portfolio holdings by sector
(percent of net assets)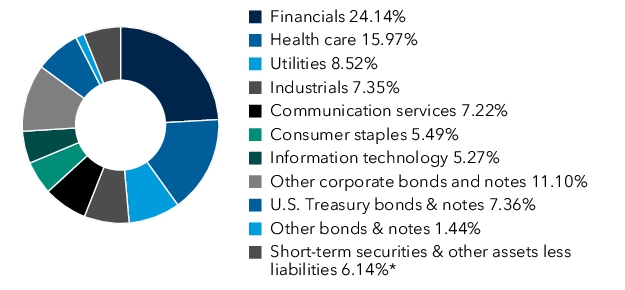
*Includes derivatives.
What were the fund costs for the last year?
(based on a hypothetical $10,000 investment)| Share class | Costs of a $10,000 investment | Costs paid as a percentage of a $10,000 investment |
| Class 529-E | $ 93 | 0.91 % |
Management's discussion of fund performance
The fund’s Class 529-E shares gained 4.78% for the year ended May 31, 2026. That result compares with a 6.09% gain for the Bloomberg U.S. Corporate Investment Grade Index. For information on returns for additional periods, including the fund lifetime, please refer to
capitalgroup.com/mutual-fund-returns-529E
.What factors influenced results
During the fund’s fiscal year, U.S. corporate bonds posted strong returns. The U.S. economy remained resilient, although a softening labor market prompted the U.S. Federal Reserve to implement three 25-basis-point rate cuts over the period. Treasury yields varied, ending the period at their highest level since January. Meanwhile, credit spreads tightened modestly, underpinned by strong investor demand and resilient corporate fundamentals.
Within the fund, holdings in consumer non-cyclical and Treasuries sectors were particularly additive to results, relative to the benchmark, the Bloomberg U.S. Corporate Investment Grade Index. Similarly, holdings in electric utilities and insurance contributed to relative returns.
Conversely, investments in banking and energy-related bonds weighed on results, relative to the index. To a lesser degree, holdings in technology and consumer cyclical sectors detracted. Additionally, exposure to derivatives, duration and curve positioning lagged the overall portfolio.
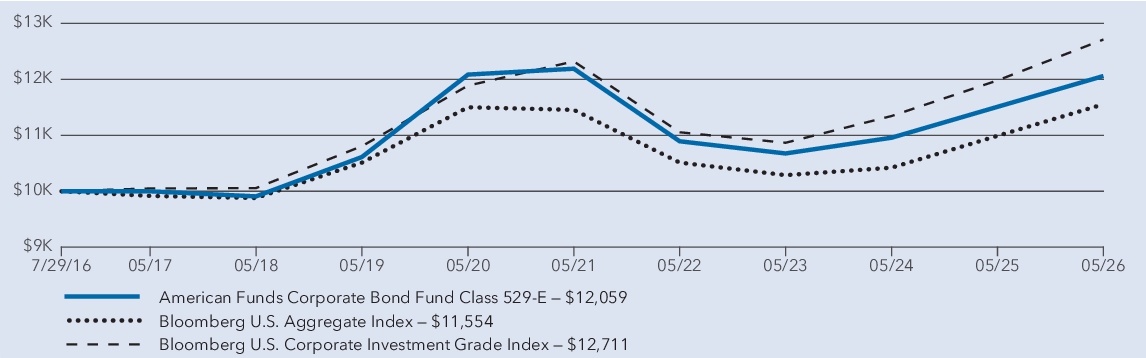
Average annual total returns
| 1 year | 5 years | Since inception 1 | |
| American Funds Corporate Bond Fund — Class 529-E 2 | 4.78 % | (0.22 ) % | 1.92 % |
| Bloomberg U.S. Aggregate Index 3 | 5.13 % | 0.17 % | 1.48 % |
| Bloomberg U.S. Corporate Investment Grade Index 3 | 6.09 % | 0.63 % | 2.47 % |
1
Class 529-E shares were first offered on July 29, 2016.2
Investment results assume all distributions are reinvested and reflect applicable fees and expenses. When applicable, results reflect fee waivers and/or expense reimbursements, without which they would have been lower.3
Results assume all distributions are reinvested. Any market index shown is unmanaged, and therefore, has no expenses. Investors cannot invest directly in an index. Source(s): Bloomberg Index Services Ltd.Key fund statistics
| Fund net assets (in millions) | $ 1,938 |
| Total number of portfolio holdings | 737 |
| Total advisory fees paid (in millions) | $ 5 |
| Portfolio turnover rate | 226 % |
Portfolio holdings by sector
(percent of net assets)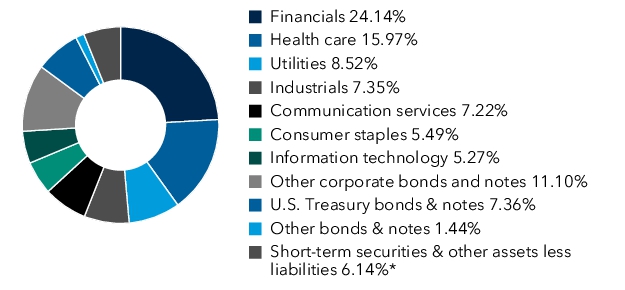
*Includes derivatives.
What were the fund costs for the last year?
(based on a hypothetical $10,000 investment)| Share class | Costs of a $10,000 investment | Costs paid as a percentage of a $10,000 investment |
| Class 529-T | $ 49 | 0.48 % |
Management's discussion of fund performance
The fund’s Class 529-T shares gained 5.22% for the year ended May 31, 2026. That result compares with a 6.09% gain for the Bloomberg U.S. Corporate Investment Grade Index.
What factors influenced results
During the fund’s fiscal year, U.S. corporate bonds posted strong returns. The U.S. economy remained resilient, although a softening labor market prompted the U.S. Federal Reserve to implement three 25-basis-point rate cuts over the period. Treasury yields varied, ending the period at their highest level since January. Meanwhile, credit spreads tightened modestly, underpinned by strong investor demand and resilient corporate fundamentals.
Within the fund, holdings in consumer non-cyclical and Treasuries sectors were particularly additive to results, relative to the benchmark, the Bloomberg U.S. Corporate Investment Grade Index. Similarly, holdings in electric utilities and insurance contributed to relative returns.
Conversely, investments in banking and energy-related bonds weighed on results, relative to the index. To a lesser degree, holdings in technology and consumer cyclical sectors detracted. Additionally, exposure to derivatives, duration and curve positioning lagged the overall portfolio.
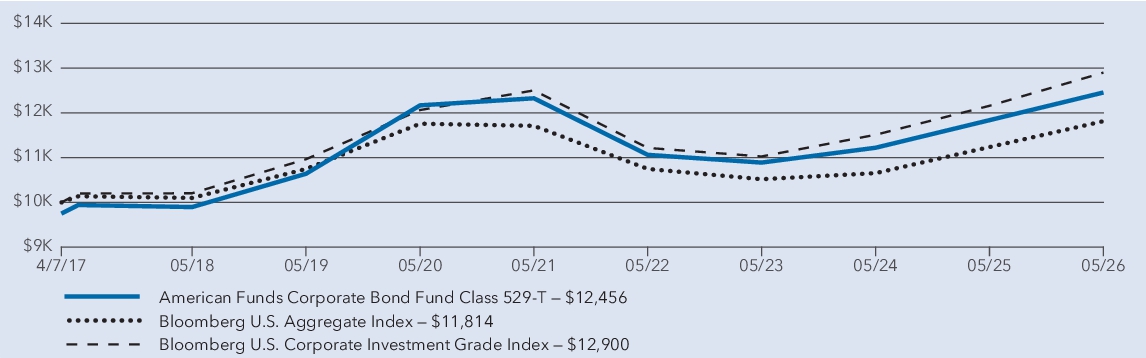
Average annual total returns
| 1 year | 5 years | Since inception 1 | |
| American Funds Corporate Bond Fund — Class 529-T (with sales charge) 2 | 2.59 % | (0.30 ) % | 2.43 % |
| American Funds Corporate Bond Fund — Class 529-T (without sales charge) 2 | 5.22 % | 0.21 % | 2.71 % |
| Bloomberg U.S. Aggregate Index 3 | 5.13 % | 0.17 % | 1.84 % |
| Bloomberg U.S. Corporate Investment Grade Index 3 | 6.09 % | 0.63 % | 2.82 % |
1
Class 529-T shares were first offered on April 7, 2017.2
Investment results assume all distributions are reinvested and reflect applicable fees and expenses. When applicable, results reflect fee waivers and/or expense reimbursements, without which they would have been lower.3
Results assume all distributions are reinvested. Any market index shown is unmanaged, and therefore, has no expenses. Investors cannot invest directly in an index. Source(s): Bloomberg Index Services Ltd.Key fund statistics
| Fund net assets (in millions) | $ 1,938 |
| Total number of portfolio holdings | 737 |
| Total advisory fees paid (in millions) | $ 5 |
| Portfolio turnover rate | 226 % |
Portfolio holdings by sector
(percent of net assets)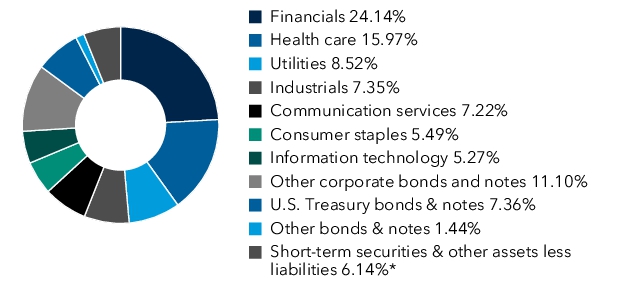
*Includes derivatives.
What were the fund costs for the last year?
(based on a hypothetical $10,000 investment)| Share class | Costs of a $10,000 investment | Costs paid as a percentage of a $10,000 investment |
| Class 529-F-1 | $ 50 | 0.49 % |
Management's discussion of fund performance
The fund’s Class 529-F-1 shares gained 5.22% for the year ended May 31, 2026. That result compares with a 6.09% gain for the Bloomberg U.S. Corporate Investment Grade Index. For information on returns for additional periods, including the fund lifetime, please refer to
capitalgroup.com/mutual-fund-returns-529F1
.What factors influenced results
During the fund’s fiscal year, U.S. corporate bonds posted strong returns. The U.S. economy remained resilient, although a softening labor market prompted the U.S. Federal Reserve to implement three 25-basis-point rate cuts over the period. Treasury yields varied, ending the period at their highest level since January. Meanwhile, credit spreads tightened modestly, underpinned by strong investor demand and resilient corporate fundamentals.
Within the fund, holdings in consumer non-cyclical and Treasuries sectors were particularly additive to results, relative to the benchmark, the Bloomberg U.S. Corporate Investment Grade Index. Similarly, holdings in electric utilities and insurance contributed to relative returns.
Conversely, investments in banking and energy-related bonds weighed on results, relative to the index. To a lesser degree, holdings in technology and consumer cyclical sectors detracted. Additionally, exposure to derivatives, duration and curve positioning lagged the overall portfolio.
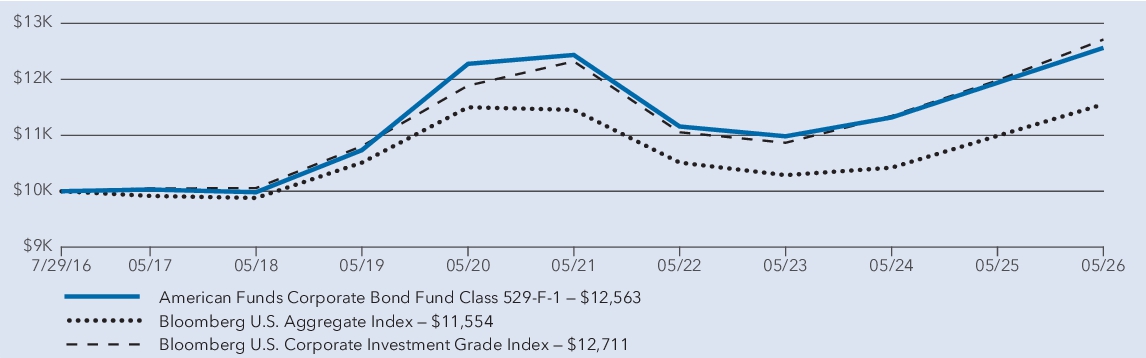
Average annual total returns
| 1 year | 5 years | Since inception 1 | |
| American Funds Corporate Bond Fund — Class 529-F-1 2 | 5.22 % | 0.20 % | 2.35 % |
| Bloomberg U.S. Aggregate Index 3 | 5.13 % | 0.17 % | 1.48 % |
| Bloomberg U.S. Corporate Investment Grade Index 3 | 6.09 % | 0.63 % | 2.47 % |
1
Class 529-F-1 shares were first offered on July 29, 2016.2
Investment results assume all distributions are reinvested and reflect applicable fees and expenses. When applicable, results reflect fee waivers and/or expense reimbursements, without which they would have been lower.3
Results assume all distributions are reinvested. Any market index shown is unmanaged, and therefore, has no expenses. Investors cannot invest directly in an index. Source(s): Bloomberg Index Services Ltd.Key fund statistics
| Fund net assets (in millions) | $ 1,938 |
| Total number of portfolio holdings | 737 |
| Total advisory fees paid (in millions) | $ 5 |
| Portfolio turnover rate | 226 % |
Portfolio holdings by sector
(percent of net assets)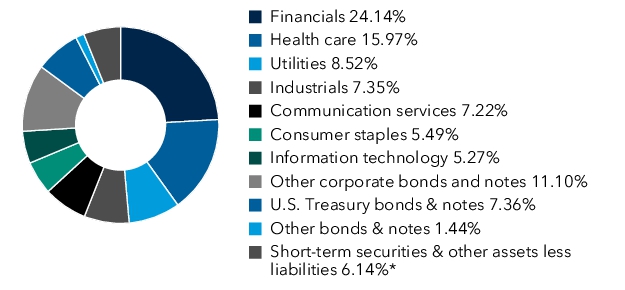
*Includes derivatives.
What were the fund costs for the last year?
(based on a hypothetical $10,000 investment)Share class | Costs of a $10,000 investment | Costs paid as a percentage of a $10,000 investment |
| Class 529-F-2 | $ 43 | 0.42 % |
Management's discussion of fund performance
The fund’s Class 529-F-2 shares gained 5.30% for the year ended May 31, 2026. That result compares with a 6.09% gain for the Bloomberg U.S. Corporate Investment Grade Index. For information on returns for additional periods, including the fund lifetime, please refer to .
capitalgroup.com/mutual-fund-returns-529F2
What factors influenced results
During the fund’s fiscal year, U.S. corporate bonds posted strong returns. The U.S. economy remained resilient, although a softening labor market prompted the U.S. Federal Reserve to implement three 25-basis-point rate cuts over the period. Treasury yields varied, ending the period at their highest level since January. Meanwhile, credit spreads tightened modestly, underpinned by strong investor demand and resilient corporate fundamentals.
Within the fund, holdings in consumer non-cyclical and Treasuries sectors were particularly additive to results, relative to the benchmark, the Bloomberg U.S. Corporate Investment Grade Index. Similarly, holdings in electric utilities and insurance contributed to relative returns.
Conversely, investments in banking and energy-related bonds weighed on results, relative to the index. To a lesser degree, holdings in technology and consumer cyclical sectors detracted. Additionally, exposure to derivatives, duration and curve positioning lagged the overall portfolio.
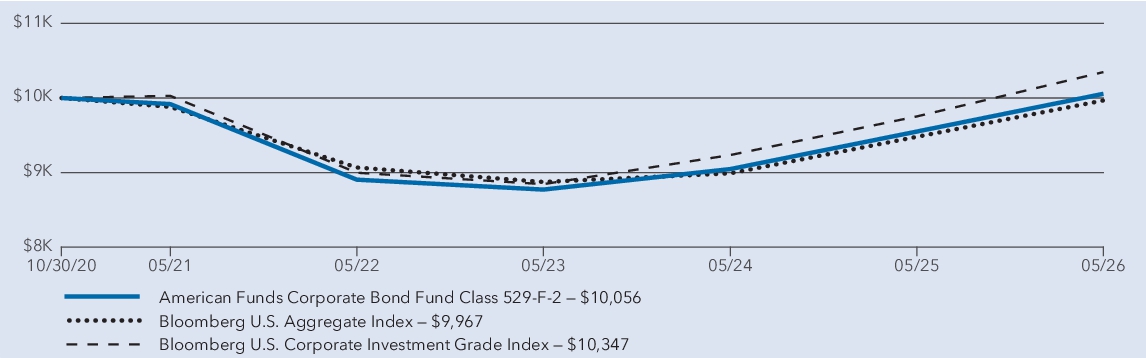
Average annual total returns
1 year | 5 years | Since inception 1 | |
| American Funds Corporate Bond Fund — Class 529-F-2 2 | 5.30 % | 0.27 % | 0.10 % |
| Bloomberg U.S. Aggregate Index 3 | 5.13 % | 0.17 % | (0.06 ) % |
| Bloomberg U.S. Corporate Investment Grade Index 3 | 6.09 % | 0.63 % | 0.61 % |
1
Class 529-F-2 shares were first offered on October 30, 2020.2
Investment results assume all distributions are reinvested and reflect applicable fees and expenses. When applicable, results reflect fee waivers and/or expense reimbursements, without which they would have been lower.3
Results assume all distributions are reinvested. Any market index shown is unmanaged, and therefore, has no expenses. Investors cannot invest directly in an index. Source(s): Bloomberg Index Services Ltd.Key fund statistics
| Fund net assets (in millions) | $ 1,938 |
| Total number of portfolio holdings | 737 |
| Total advisory fees paid (in millions) | $ 5 |
| Portfolio turnover rate | 226 % |
Portfolio holdings by sector
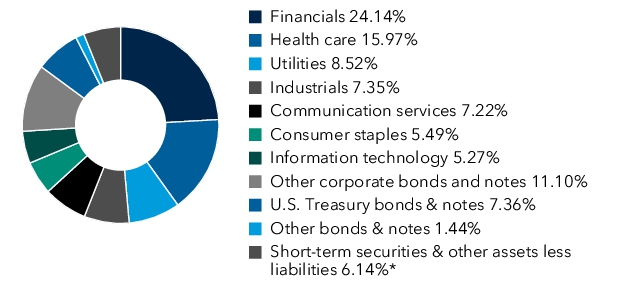
*Includes derivatives.
What were the fund costs for the last year?
(based on a hypothetical $10,000 investment)| Share class | Costs of a $10,000 investment | Costs paid as a percentage of a $10,000 investment |
| Class 529-F-3 | $ 36 | 0.35 % |
Management's discussion of fund performance
The fund’s Class 529-F-3 shares gained 5.36% for the year ended May 31, 2026. That result compares with a 6.09% gain for the Bloomberg U.S. Corporate Investment Grade Index. For information on returns for additional periods, including the fund lifetime, please refer to
capitalgroup.com/mutual-fund-returns-529F3
.What factors influenced results
During the fund’s fiscal year, U.S. corporate bonds posted strong returns. The U.S. economy remained resilient, although a softening labor market prompted the U.S. Federal Reserve to implement three 25-basis-point rate cuts over the period. Treasury yields varied, ending the period at their highest level since January. Meanwhile, credit spreads tightened modestly, underpinned by strong investor demand and resilient corporate fundamentals.
Within the fund, holdings in consumer non-cyclical and Treasuries sectors were particularly additive to results, relative to the benchmark, the Bloomberg U.S. Corporate Investment Grade Index. Similarly, holdings in electric utilities and insurance contributed to relative returns.
Conversely, investments in banking and energy-related bonds weighed on results, relative to the index. To a lesser degree, holdings in technology and consumer cyclical sectors detracted. Additionally, exposure to derivatives, duration and curve positioning lagged the overall portfolio.
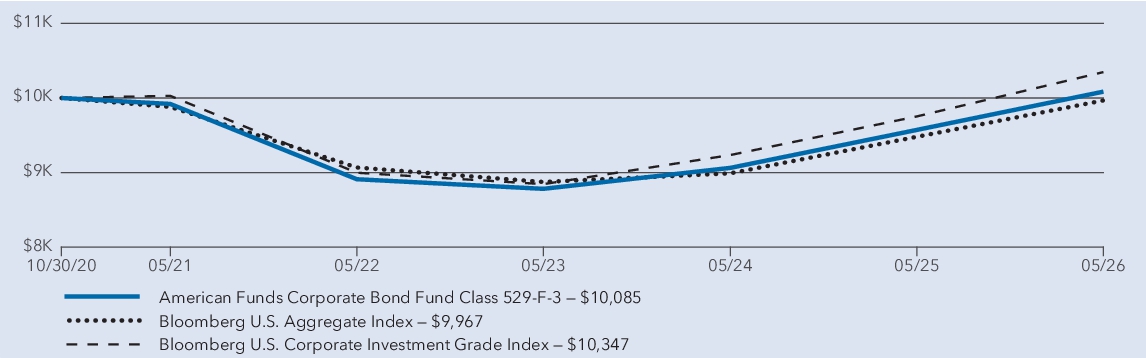
Average annual total returns
| 1 year | 5 years | Since inception 1 | |
| American Funds Corporate Bond Fund — Class 529-F-3 2 | 5.36 % | 0.33 % | 0.15 % |
| Bloomberg U.S. Aggregate Index 3 | 5.13 % | 0.17 % | (0.06 ) % |
| Bloomberg U.S. Corporate Investment Grade Index 3 | 6.09 % | 0.63 % | 0.61 % |
1
Class 529-F-3 shares were first offered on October 30, 2020.2
Investment results assume all distributions are reinvested and reflect applicable fees and expenses. When applicable, results reflect fee waivers and/or expense reimbursements, without which they would have been lower.3
Results assume all distributions are reinvested. Any market index shown is unmanaged, and therefore, has no expenses. Investors cannot invest directly in an index. Source(s): Bloomberg Index Services Ltd.Key fund statistics
| Fund net assets (in millions) | $ 1,938 |
| Total number of portfolio holdings | 737 |
| Total advisory fees paid (in millions) | $ 5 |
| Portfolio turnover rate | 226 % |
Portfolio holdings by sector
(percent of net assets)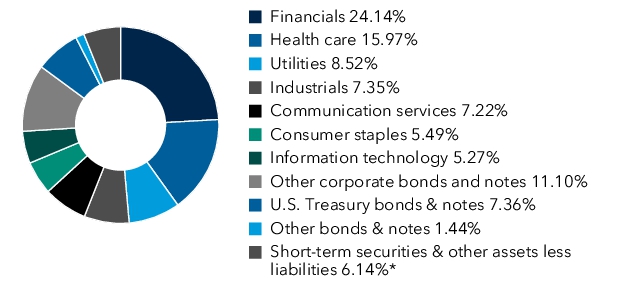
*Includes derivatives.
What were the fund costs for the last year?
(based on a hypothetical $10,00
0 investm
ent)| Share class | Costs of a $10,000 investment | Costs paid as a percentage of a $10,000 investment |
| Class R-1 | $ 144 | 1.41 % |
Management's discussion of fund performance
The fund’s Class R-1 shares gained 4.26% for the year ended May 31, 2026. That result compares with a 6.09% gain for the Bloomberg U.S. Corporate Investment Grade Index. For information on returns for additional periods, including the fund lifetime, please refer to
capitalgroup.com/mutual-fund-returns-R1
.What factors influenced results
During the fund’s fiscal year, U.S. corporate bonds posted strong returns. The U.S. economy remained resilient, although a softening labor market prompted the U.S. Federal Reserve to implement three 25-basis-point rate cuts over the period. Treasury yields varied, ending the period at their highest level since January. Meanwhile, credit spreads tightened modestly, underpinned by strong investor demand and resilient corporate fundamentals.
Within the fund, holdings
in
consumer non-cyclical and Treasuries sectors were particularly additive to results, relative to the benchmark, the Bloomberg U.S. Corporate Investment Grade Index. Similarly, holdings in electric utilities and insurance contributed to relative returns.Conversely, investments
in
banking and energy-related bonds weighed on results, relative to the index. To a lesser degree, holdings in technology and consumer cyclical sectors detracted. Additionally, exposure to derivatives, duration and curve positioning lagged the overall portfolio.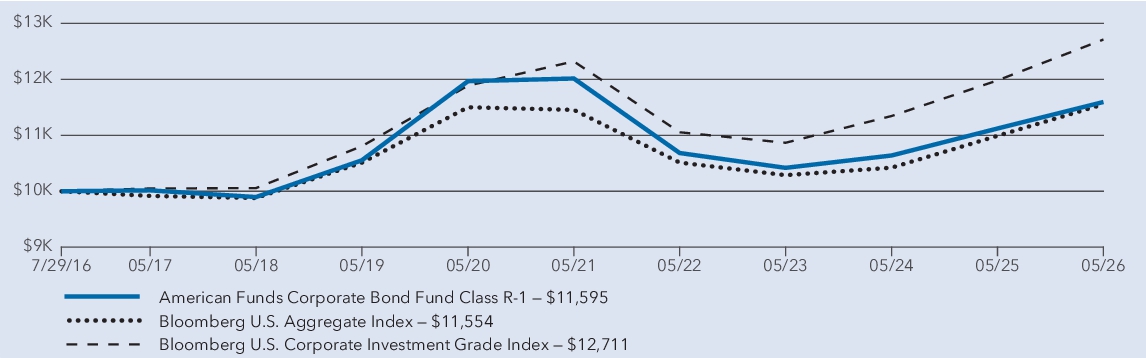
Average annual
total
returns| 1 year | 5 years | Since inception 1 | |
| American Funds Corporate Bond Fund — Class R-1 2 | 4.26 % | (0.71 ) % | 1.52 % |
| Bloomberg U.S. Aggregate Index 3 | 5.13 % | 0.17 % | 1.48 % |
| Bloomberg U.S. Corporate Investment Grade Index 3 | 6.09 % | 0.63 % | 2.47 % |
1
Class R-1 shares were first offered on July 29, 2016.2
Investment results assume all distributions are reinvested and reflect applicable fees and expenses. When applicable, results reflect fee waivers and/or expense reimbursements, without which they would have been lower.3
Results assume all distributions are reinvested. Any market index shown is unmanaged, and therefore, has no expenses. Investors cannot invest directly in an index. Source(s): Bloomberg Index Services Ltd.Key
fund
statistics| Fund net assets (in millions) | $ 1,938 |
| Total number of portfolio holdings | 737 |
| Total advisory fees paid (in millions) | $ 5 |
| Portfolio turnover rate | 226 % |
Portfolio holdings by sector
(percent of net assets)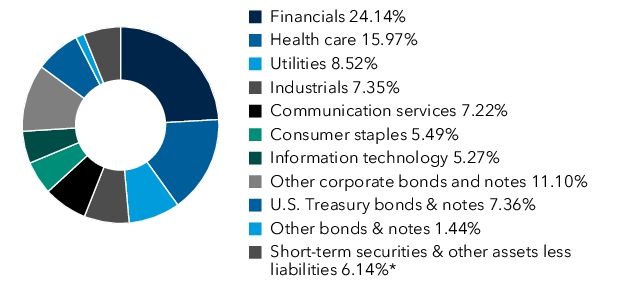
*Includes derivatives.
What were the fund costs for the last year?
(based on a hypothetical $10,000 invest
ment)| Share class | Costs of a $10,000 investment | Costs paid as a percentage of a $10,000 investment |
| Class R-2 | $ 143 | 1.40 % |
Management's discussion of fund performance
The fund’s Class R-2 shares gained 4.27% for the year ended May 31, 2026. That result compares with a 6.09% gain for the Bloomberg U.S. Corporate Investment Grade Index. For information on returns for additional periods, including the fund lifetime, please refer to
capitalgroup.com/mutual-fund-returns-R2
.What factors influenced results
During the fund’s fiscal year, U.S. corporate bonds posted strong returns. The U.S. economy remained resilient, although a softening labor market prompted the U.S. Federal Reserve to implement three 25-basis-point rate cuts over the period. Treasury yields varied, ending the period at their highest level since January. Meanwhile, credit spreads tightened modestly, underpinned by strong investor demand and resilient corporate fundamentals.
Within the fund,
holdings
in consumer non-cyclical and Treasuries sectors were particularly additive to results, relative to the benchmark, the Bloomberg U.S. Corporate Investment Grade Index. Similarly, holdings in electric utilities and insurance contributed to relative returns.Conversely, investments in banking
and
energy-related bonds weighed on results, relative to the index. To a lesser degree, holdings in technology and consumer cyclical sectors detracted. Additionally, exposure to derivatives, duration and curve positioning lagged the overall portfolio.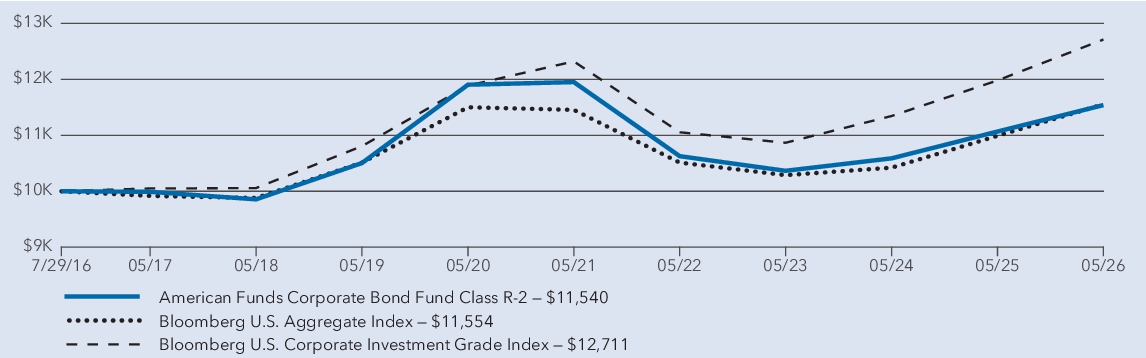
Average
annual
total returns| 1 year | 5 years | Since inception 1 | |
| American Funds Corporate Bond Fund — Class R-2 2 | 4.27 % | (0.70 ) % | 1.47 % |
| Bloomberg U.S. Aggregate Index 3 | 5.13 % | 0.17 % | 1.48 % |
| Bloomberg U.S. Corporate Investment Grade Index 3 | 6.09 % | 0.63 % | 2.47 % |
1
Class R-2 shares were first offered on July 29, 2016.2
Investment results assume all distributions are reinvested and reflect applicable fees and expenses. When applicable, results reflect fee waivers and/or expense reimbursements, without which they would have been lower.3
Results assume all distributions are reinvested. Any market index shown is unmanaged, and therefore, has no expenses. Investors cannot invest directly in an index. Source(s): Bloomberg Index Services Ltd.Key
fund
statistics| Fund net assets (in millions) | $ 1,938 |
| Total number of portfolio holdings | 737 |
| Total advisory fees paid (in millions) | $ 5 |
| Portfolio turnover rate | 226 % |
Portfolio holdings by sector
(percent of net assets)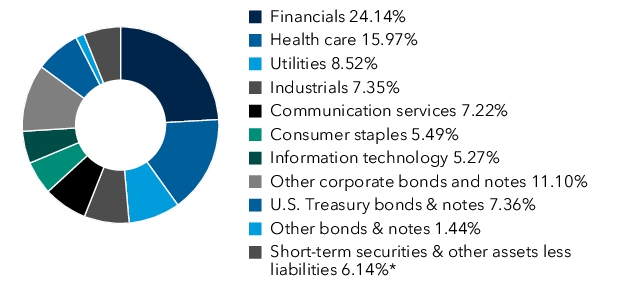
*Includes derivatives.
What were the fund costs for the last year?
(based on a hypothetical $10,000 investme
nt)| Share class | Costs of a $10,000 investment | Costs paid as a percentage of a $10,000 investment |
| Class R-2E | $ 114 | 1.11 % |
Management's discussion of fund performance
The fund’s Class R-2E shares gained 4.57% for the year ended May 31, 2026. That result compares with a 6.09% gain for the Bloomberg U.S. Corporate Investment Grade Index. For information on returns for additional periods, including the fund lifetime, please refer to
capitalgroup.com/mutual-fund-returns-R2E
.What factors influenced results
During the fund’s fiscal year, U.S. corporate bonds posted strong returns. The U.S. economy remained resilient, although a softening labor market prompted the U.S. Federal Reserve to implement three 25-basis-point rate cuts over the period. Treasury yields varied, ending the period at their highest level since January. Meanwhile, credit spreads tightened modestly, underpinned by strong investor demand and resilient corporate fundamentals.
Within the fund, holdings in consumer
non
-cyclical and Treasuries sectors were particularly additive to results, relative to the benchmark, the Bloomberg U.S. Corporate Investment Grade Index. Similarly, holdings in electric utilities and insurance contributed to relative returns.Conversely, investments in
banking
and energy-related bonds weighed on results, relative to the index. To a lesser degree, holdings in technology and consumer cyclical sectors detracted. Additionally, exposure to derivatives, duration and curve positioning lagged the overall portfolio.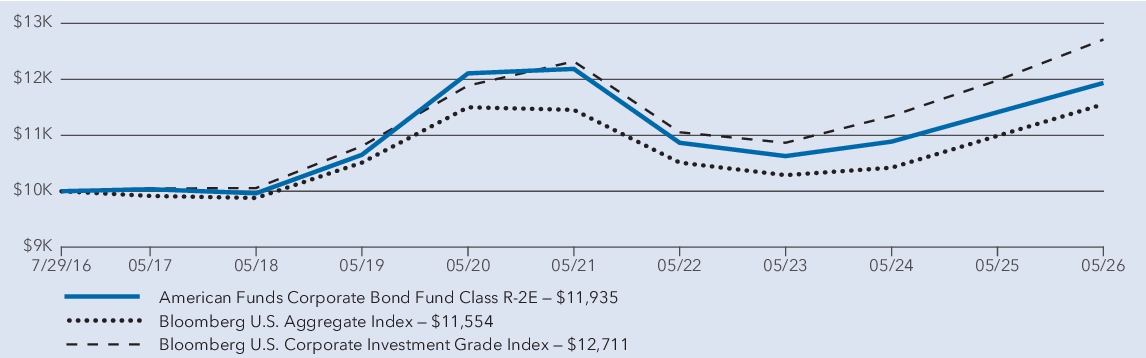
Average
annual
total returns| 1 year | 5 years | Since inception 1 | |
| American Funds Corporate Bond Fund — Class R-2E 2 | 4.57 % | (0.42 ) % | 1.81 % |
| Bloomberg U.S. Aggregate Index 3 | 5.13 % | 0.17 % | 1.48 % |
| Bloomberg U.S. Corporate Investment Grade Index 3 | 6.09 % | 0.63 % | 2.47 % |
1
Class R-2E shares were first offered on July 29, 2016.2
Investment results assume all distributions are reinvested and reflect applicable fees and expenses. When applicable, results reflect fee waivers and/or expense reimbursements, without which they would have been lower.3
Results assume all distributions are reinvested. Any market index shown is unmanaged, and therefore, has no expenses. Investors cannot invest directly in an index. Source(s): Bloomberg Index Services Ltd.Key
fund
statistics| Fund net assets (in millions) | $ 1,938 |
| Total number of portfolio holdings | 737 |
| Total advisory fees paid (in millions) | $ 5 |
| Portfolio turnover rate | 226 % |
Portfolio holdings by sector
(percent of net assets)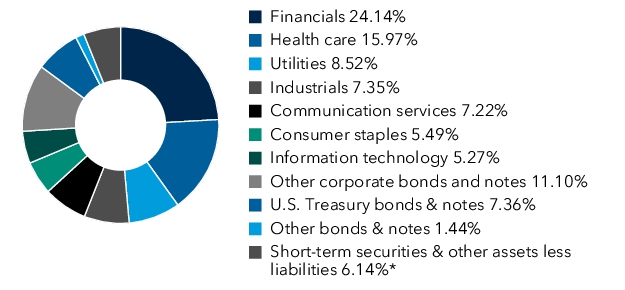
*Includes derivatives.
What were the fund costs for the last year?
(based on a hypothetical $10,000 investment)| Share class | Costs of a $10,000 investment | Costs paid as a percentage of a $10, 000 invest ment |
| Class R-3 | $ 97 | 0.95 % |
Management's discussion of fund performance
The fund’s Class R-3 shares gained 4.74% for the year ended May 31, 2026. That result compares with a 6.09% gain for the Bloomberg U.S. Corporate Investment Grade Index. For information on returns for additional periods, including the fund lifetime, please refer to
capitalgroup.com/mutual-fund-returns-R3
.What factors influenced results
During the fund’s fiscal year, U.S. corporate bonds posted strong returns. The U.S. economy remained resilient, although a softening labor market prompted the U.S. Federal Reserve to implement three 25-basis-point rate cuts over the period. Treasury yields varied, ending the period at their highest level since January. Meanwhile, credit spreads tightened modestly, underpinned by strong investor demand and resilient corporate fundamentals.
Within the fund, holdings in
consumer
non-cyclical and Treasuries sectors were particularly additive to results, relative to the benchmark, the Bloomberg U.S. Corporate Investment Grade Index. Similarly, holdings in electric utilities and insurance contributed to relative returns.Conversely, investments in banking and
energy
-related bonds weighed on results, relative to the index. To a lesser degree, holdings in technology and consumer cyclical sectors detracted. Additionally, exposure to derivatives, duration and curve positioning lagged the overall portfolio.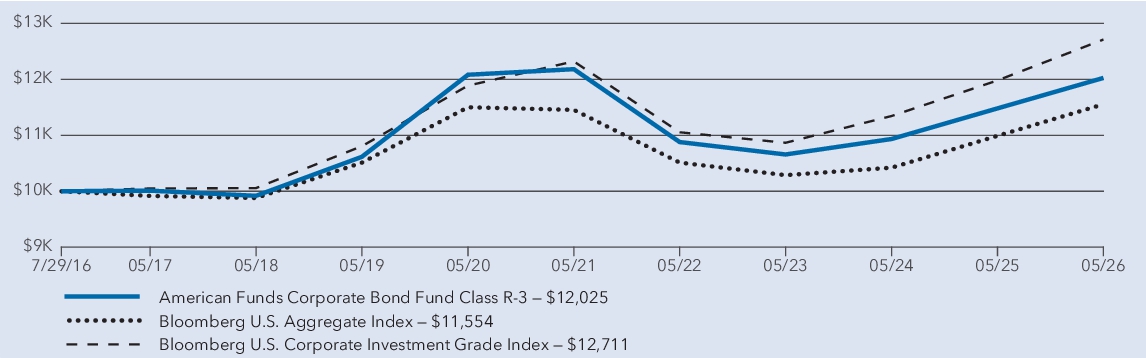
Average
annual
total returns| 1 year | 5 years | Since inception 1 | |
| American Funds Corporate Bond Fund — Class R-3 2 | 4.74 % | (0.26 ) % | 1.89 % |
| Bloomberg U.S. Aggregate Index 3 | 5.13 % | 0.17 % | 1.48 % |
| Bloomberg U.S. Corporate Investment Grade Index 3 | 6.09 % | 0.63 % | 2.47 % |
1
Class R-3 shares were first offered on July 29, 2016.2
Investment results assume all distributions are reinvested and reflect applicable fees and expenses. When applicable, results reflect fee waivers and/or expense reimbursements, without which they would have been lower.3
Results assume all distributions are reinvested. Any market index shown is unmanaged, and therefore, has no expenses. Investors cannot invest directly in an index. Source(s): Bloomberg Index Services Ltd.Key
fund
statistics| Fund net assets (in millions) | $ 1,938 |
| Total number of portfolio holdings | 737 |
| Total advisory fees paid (in millions) | $ 5 |
| Portfolio turnover rate | 226 % |
Portfolio holdings by sector
(percent of net assets)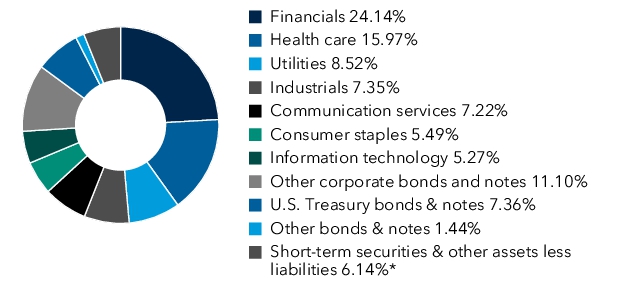
*Includes derivatives.
What were the fund costs for the last year?
(based on a hypothetical $10,000 investment)| Share class | Costs of a $10,00 0 invest ment | Costs paid as a percentage of a $10,000 investment |
| Class R-4 | $ 68 | 0.66 % |
Management's discussion of fund performance
The fund’s Class R-4 shares gained 5.04% for the year ended May 31, 2026. That result compares with a 6.09% gain for the Bloomberg U.S. Corporate Investment Grade Index. For information on returns for additional periods, including the fund lifetime, please refer to
capitalgroup.com/mutual-fund-returns-R4
.What factors influenced results
During the fund’s fiscal year, U.S. corporate bonds posted strong returns. The U.S. economy remained resilient, although a softening labor market prompted the U.S. Federal Reserve to implement three 25-basis-point rate cuts over the period. Treasury yields varied, ending the period at their highest level since January. Meanwhile, credit spreads tightened modestly, underpinned by strong investor demand and resilient corporate fundamentals.
Within the fund,
holdings
in consumer non-cyclical and Treasuries sectors were particularly additive to results, relative to the benchmark, the Bloomberg U.S. Corporate Investment Grade Index. Similarly, holdings in electric utilities and insurance contributed to relative returns.Conversely, investments in banking
and
energy-related bonds weighed on results, relative to the index. To a lesser degree, holdings in technology and consumer cyclical sectors detracted. Additionally, exposure to derivatives, duration and curve positioning lagged the overall portfolio.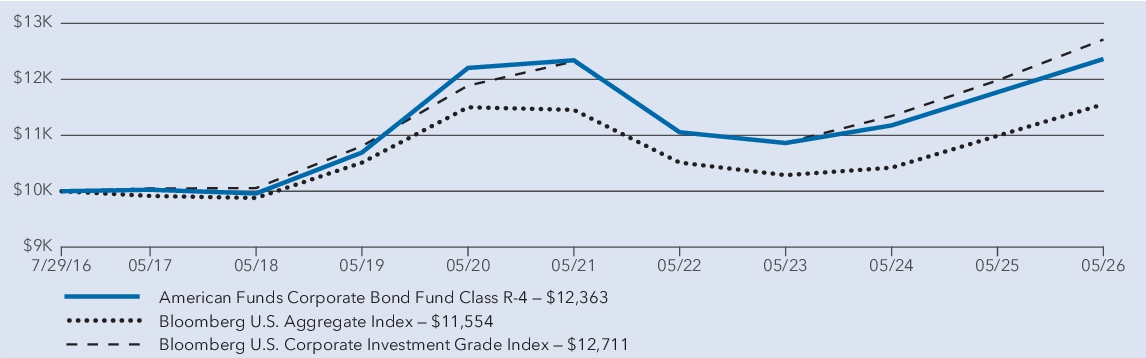
Average
annual
total returns| 1 year | 5 years | Since inception 1 | |
| American Funds Corporate Bond Fund — Class R-4 2 | 5.04 % | 0.04 % | 2.18 % |
| Bloomberg U.S. Aggregate Index 3 | 5.13 % | 0.17 % | 1.48 % |
| Bloomberg U.S. Corporate Investment Grade Index 3 | 6.09 % | 0.63 % | 2.47 % |
1
Class R-4 shares were first offered on July 29, 2016.2
Investment results assume all distributions are reinvested and reflect applicable fees and expenses. When applicable, results reflect fee waivers and/or expense reimbursements, without which they would have been lower.3
Results assume all distributions are reinvested. Any market index shown is unmanaged, and therefore, has no expenses. Investors cannot invest directly in an index. Source(s): Bloomberg Index Services Ltd.Key
fund
statistics| Fund net assets (in millions) | $ 1,938 |
| Total number of portfolio holdings | 737 |
| Total advisory fees paid (in millions) | $ 5 |
| Portfolio turnover rate | 226 % |
Portfolio holdings by sector
(percent of net assets)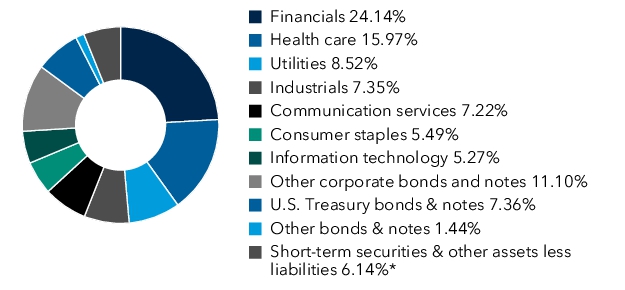
*Includes derivatives.
What were the fund costs for the last year?
(based on a hypothetical $10,000 i
nvestment)| Share class | Costs of a $10,000 investment | Costs paid as a per centag e of a $10,000 investment |
| Class R-5E | $ 49 | 0.48 % |
Management's discussion of fund performance
The fund’s Class R-5E shares gained 5.23% for the year ended May 31, 2026. That result compares with a 6.09% gain for the Bloomberg U.S. Corporate Investment Grade Index. For information on returns for additional periods, including the fund lifetime, please refer to
capitalgroup.com/mutual-fund-returns-R5E
.What factors influenced results
During the fund’s fiscal year, U.S. corporate bonds posted strong returns. The U.S. economy remained resilient, although a softening labor market prompted the U.S. Federal Reserve to implement three 25-basis-point rate cuts over the period. Treasury yields varied, ending the period at their highest level since January. Meanwhile, credit spreads tightened modestly, underpinned by strong investor demand and resilient corporate fundamentals.
Within the fund, holdings in
consumer
non-cyclical and Treasuries sectors were particularly additive to results, relative to the benchmark, the Bloomberg U.S. Corporate Investment Grade Index. Similarly, holdings in electric utilities and insurance contributed to relative returns.Conversely, investments in
banking
and energy-related bonds weighed on results, relative to the index. To a lesser degree, holdings in technology and consumer cyclical sectors detracted. Additionally, exposure to derivatives, duration and curve positioning lagged the overall portfolio.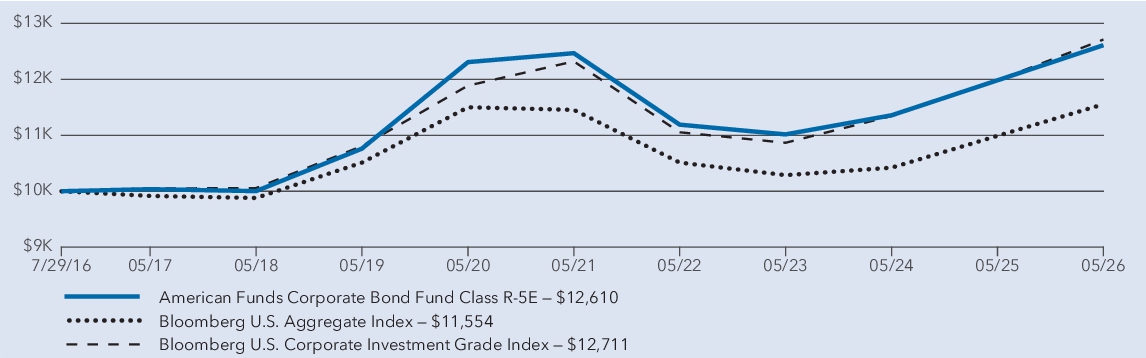
Average
annual
total returns| 1 year | 5 years | Since inception 1 | |
| American Funds Corporate Bond Fund — Class R-5E 2 | 5.23 % | 0.23 % | 2.39 % |
| Bloomberg U.S. Aggregate Index 3 | 5.13 % | 0.17 % | 1.48 % |
| Bloomberg U.S. Corporate Investment Grade Index 3 | 6.09 % | 0.63 % | 2.47 % |
1
Class R-5E shares were first offered on July 29, 2016.2
Investment results assume all distributions are reinvested and reflect applicable fees and expenses. When applicable, results reflect fee waivers and/or expense reimbursements, without which they would have been lower.3
Results assume all distributions are reinvested. Any market index shown is unmanaged, and therefore, has no expenses. Investors cannot invest directly in an index. Source(s): Bloomberg Index Services Ltd.Key
fund
statistics| Fund net assets (in millions) | $ 1,938 |
| Total number of portfolio holdings | 737 |
| Total advisory fees paid (in millions) | $ 5 |
| Portfolio turnover rate | 226 % |
Portfolio holdings by sector
(percent of net assets)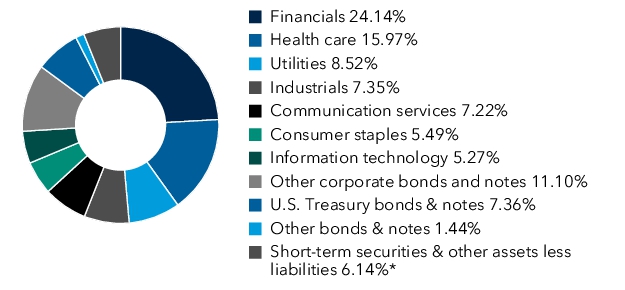
*Includes derivatives.
What were the fund costs for the last year?
(based on a hypot
hetical $10,000 investment)| Share class | Costs of a $10,000 investment | Costs paid as a percentage of a $10,000 investment |
| Class R-5 | $ 46 | 0.45 % |
Management's discussion of fund performance
The fund’s Class R-5 shares gained 5.26% for the year ended May 31, 2026. That result compares with a 6.09% gain for the Bloomberg U.S. Corporate Investment Grade Index. For information on returns for additional periods, including the fund lifetime, please refer to
capitalgroup.com/mutual-fund-returns-R5
.What factors influenced results
During the fund’s fiscal year, U.S. corporate bonds posted strong returns. The U.S. economy remained resilient, although a softening labor market prompted the U.S. Federal Reserve to implement three 25-basis-point rate cuts over the period. Treasury yields varied, ending the period at their highest level since January. Meanwhile, credit spreads tightened modestly, underpinned by strong investor demand and resilient corporate fundamentals.
Within the fund, holdings in
consumer
non-cyclical and Treasuries sectors were particularly additive to results, relative to the benchmark, the Bloomberg U.S. Corporate Investment Grade Index. Similarly, holdings in electric utilities and insurance contributed to relative returns.Conversely, investments in
banking
and energy-related bonds weighed on results, relative to the index. To a lesser degree, holdings in technology and consumer cyclical sectors detracted. Additionally, exposure to derivatives, duration and curve positioning lagged the overall portfolio.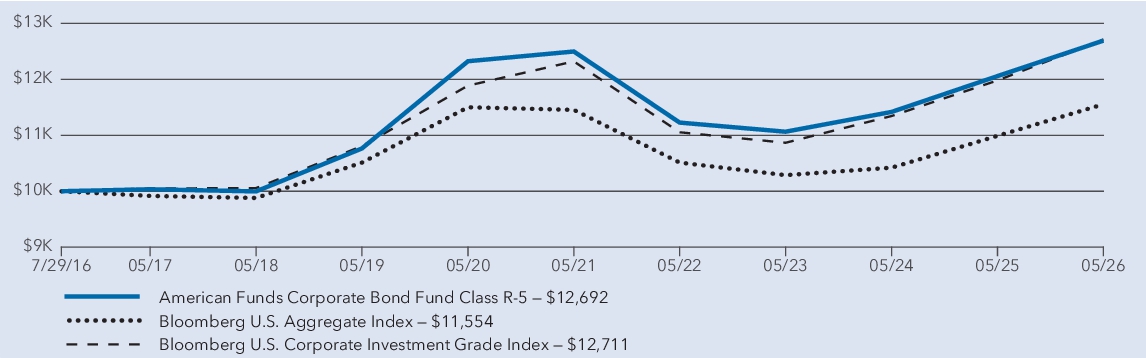
Average
annual
total returns| 1 year | 5 years | Since inception 1 | |
| American Funds Corporate Bond Fund — Class R-5 2 | 5.26 % | 0.31 % | 2.45 % |
| Bloomberg U.S. Aggregate Index 3 | 5.13 % | 0.17 % | 1.48 % |
| Bloomberg U.S. Corporate Investment Grade Index 3 | 6.09 % | 0.63 % | 2.47 % |
1
Class R-5 shares were first offered on July 29, 2016.2
Investment results assume all distributions are reinvested and reflect applicable fees and expenses. When applicable, results reflect fee waivers and/or expense reimbursements, without which they would have been lower.3
Results assume all distributions are reinvested. Any market index shown is unmanaged, and therefore, has no expenses. Investors cannot invest directly in an index. Source(s): Bloomberg Index Services Ltd.Key
fund
statistics| Fund net assets (in millions) | $ 1,938 |
| Total number of portfolio holdings | 737 |
| Total advisory fees paid (in millions) | $ 5 |
| Portfolio turnover rate | 226 % |
Portfolio holdings by sector
(percent of net assets)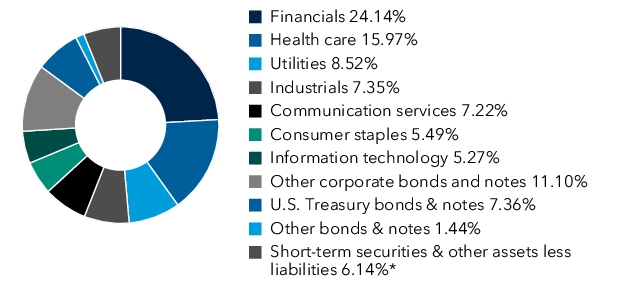
*Includes derivatives.
Material fund changes
This is a summary of certain changes to the fund since June 1, 2025. For more complete information, you may review the fund’s next prospectus, which we expect to be available by September 1, 2026 at
capitalgroup.com/mutual-fund-literature-R5
or upon request at (800) 421-4225
.The total annual
operating
expense ratio for Class R-5 shares increased from 0.37% to 0.45% during the reporting period. The increase was primarily due to an increase in transfer agent fees driven by changes in net assets and the number of shareholder accounts serviced.operating
expense ratio for Class R-5 shares increased from 0.37% to 0.45% during the reporting period. The increase was primarily due to an increase in transfer agent fees driven by changes in net assets and the number of shareholder accounts serviced.
capitalgroup.com/mutual-fund-literature-R5
or upon request at (800) 421-4225
.
What were the fund costs for the last year?
(based on a hypothetical $10,000 investment)| Share class | Costs of a $10,000 investment | Costs paid as a percentage of a $10,000 investment |
| Class R-6 | $ 33 | 0.32 % |
Management's discussion of fund performance
The fund’s Class R-6 shares gained 5.40% for the year ended May 31, 2026. That result compares with a 6.09% gain for the Bloomberg U.S. Corporate Investment Grade Index. For information on returns for additional periods, including the fund lifetime, please refer to
capitalgroup.com/mutual-fund-returns-R6
.What factors influenced results
During the fund’s fiscal year, U.S. corporate bonds posted strong returns. The U.S. economy remained resilient, although a softening labor market prompted the U.S. Federal Reserve to implement three 25-basis-point rate cuts over the period. Treasury yields varied, ending the period at their highest level since January. Meanwhile, credit spreads tightened modestly, underpinned by strong investor demand and resilient corporate fundamentals.
Within the fund, holdings in consumer non-
cyclical
and Treasuries sectors were particularly additive to results, relative to the benchmark, the Bloomberg U.S. Corporate Investment Grade Index. Similarly, holdings in electric utilities and insurance contributed to relative returns.Conversely, investments in banking
and
energy-related bonds weighed on results, relative to the index. To a lesser degree, holdings in technology and consumer cyclical sectors detracted. Additionally, exposure to derivatives, duration and curve positioning lagged the overall portfolio.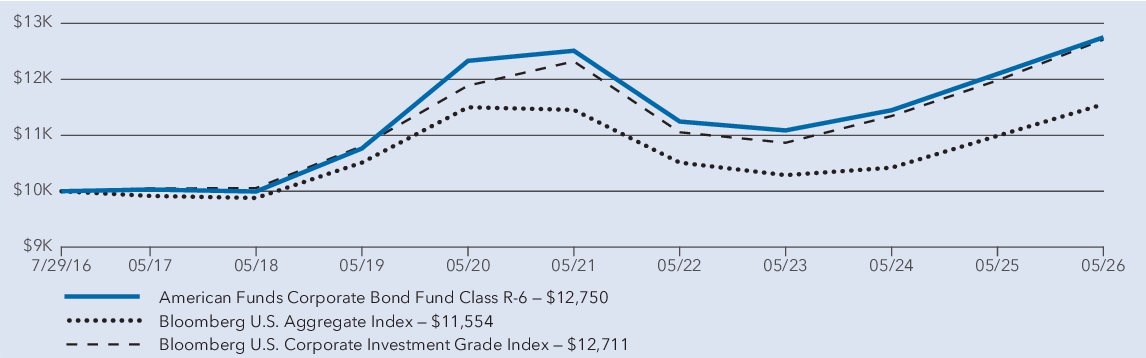
Average annual
total
returns| 1 year | 5 years | Since inception 1 | |
| American Funds Corporate Bond Fund — Class R-6 2 | 5.40 % | 0.38 % | 2.50 % |
| Bloomberg U.S. Aggregate Index 3 | 5.13 % | 0.17 % | 1.48 % |
| Bloomberg U.S. Corporate Investment Grade Index 3 | 6.09 % | 0.63 % | 2.47 % |
1
Class R-6 shares were first offered on July 29, 2016.2
Investment results assume all distributions are reinvested and reflect applicable fees and expenses. When applicable, results reflect fee waivers and/or expense reimbursements, without which they would have been lower.3
Results assume all distributions are reinvested. Any market index shown is unmanaged, and therefore, has no expenses. Investors cannot invest directly in an index. Source(s): Bloomberg Index Services Ltd.Key
fund
statistics| Fund net assets (in millions) | $ 1,938 |
| Total number of portfolio holdings | 737 |
| Total advisory fees paid (in millions) | $ 5 |
| Portfolio turnover rate | 226 % |
Portfolio holdings by sector
(percent of net assets)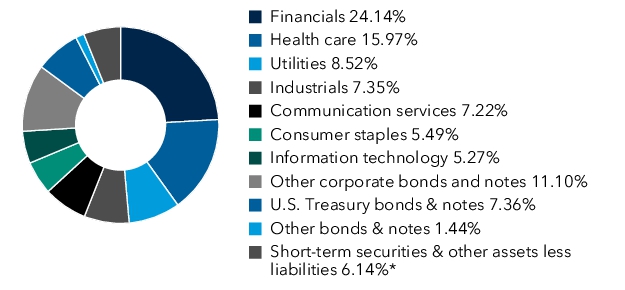
*Includes derivatives.