The fund’s investment objective is to provide prudent growth of capital and conservation of principal.
This table describes the fees and expenses that you may pay if you buy, hold and sell shares of the fund. You may pay other fees, such as brokerage commissions and other fees to financial intermediaries, which are not reflected in the table and example below.
| Shareholder fees (fees paid directly from your investment) |
| None |
| Annual fund operating expenses* (expenses that you pay each year as a percentage of the net asset value of your investment) | |
| Management fees | 0.54% |
| Other expenses | 0.00 |
| Total annual fund operating expenses | 0.54 |
* The fund’s Investment Advisory and Service Agreement provides that the investment adviser will pay all operating expenses of the fund, except for the management fees, interest expenses, taxes, acquired fund fees and expenses, costs of holding shareholder meetings, legal fees and expenses relating to arbitration or litigation, payments under the fund’s 12b-1 plan (if any) and other non-routine or extraordinary expenses. Additionally, the fund will be responsible for its non-operating expenses, including brokerage commissions and fees and expenses associated with the fund’s securities lending program, if any.
This example is intended to help you compare the cost of investing in the fund with the cost of investing in other funds.
The example assumes that you invest $10,000 in the fund for the time periods indicated and then sell all of your shares at the end of those periods. The example also assumes that your investment has a 5% return each year and that the fund’s operating expenses remain the same. No fees are charged by the fund upon the sale of fund shares, so you would incur these hypothetical costs whether or not you were to sell your shares at the end of the given period.
| 1 year | 3 years | 5 years | 10 years | |
| $55 | $173 | $302 | $677 |
| 1 year | 3 years | 5 years | 10 years | |
| $55 | $173 | $302 | $677 |
The fund pays transaction costs, such as commissions, when it buys and sells securities (or “turns over” its portfolio). A higher portfolio turnover rate may indicate higher transaction costs and may result in higher taxes when fund shares are held in a taxable account. These costs, which are not reflected in annual fund operating expenses or in the example, affect the fund’s investment results. During the most recent fiscal year, the fund’s portfolio turnover rate was 43% of the average value of its portfolio.
The fund invests primarily in common stocks outside of the United States that the investment adviser believes have the potential for growth, many of which have the potential to pay dividends. Under normal market conditions, the fund will invest at least 80% of its net assets in equity securities. For purposes of this policy, equity-type securities are securities that exhibit ownership characteristics, including common and preferred stock, securities convertible into common and preferred stock and depositary receipts representing ownership in common and preferred stock. The fund will also normally invest at least 80% of its net assets outside the United States. The fund therefore expects to be invested in a number of countries outside the United States. The fund may invest up to 10% of its net assets in emerging markets. In determining the domicile of an issuer, the fund’s investment adviser will generally look to the determination of MSCI Inc. (MSCI).
In pursuing the fund’s objective, the fund’s investment adviser focuses primarily on companies with attributes that are associated with long-term growth and resilience to market declines, such as strong management, participation in a growing market, strong balance sheets, payment of dividends and the potential for above average growth in earnings, revenues, book value, cash flow and/or return on assets.
The fund is nondiversified, which means it may invest a greater portion of its assets in fewer issuers than would otherwise be the case.
The investment adviser uses a system of multiple portfolio managers in managing assets. Under this approach, a portfolio is divided into segments managed by individual managers. For more information regarding the investment process of the fund, see the “Management and organization” section of this prospectus.
The fund relies on the professional judgment of its investment adviser to make decisions about the fund’s portfolio investments. The basic investment philosophy of the investment adviser is to seek to invest in attractively valued companies that, in its opinion, represent good, long-term investment opportunities. Securities may be sold when the investment adviser believes that they no longer represent relatively attractive investment opportunities.
The following bar chart shows how the fund’s investment results have varied from year to year, and the following table shows how the fund’s average annual total returns for various periods compare with a broad measure of securities market results and, if applicable, other measures of market results that reflect the fund’s investment universe. This information provides some indication of the risks of investing in the fund. Past investment results (before and after taxes) are not predictive of future investment results. Updated information on the fund’s investment results can be obtained by visiting capitalgroup.com/etf.
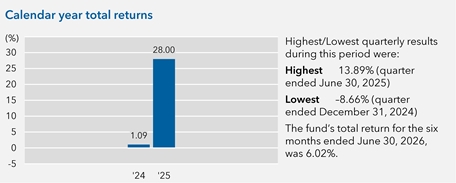
Highest/Lowest quarterly results during this period were:
Highest 13.89% (quarter ended June 30, 2025)
Lowest -8.66% (quarter ended December 31, 2024)
The fund's total return for the six months ended June 30, 2026, was 6.02%.
| Average annual total returns For the periods ended December 31, 2025: | 1 year | Lifetime |
| Fund (inception date – 9/26/2023) | 28.00% | 17.52% |
| − After taxes on distributions | 27.69 | 17.24 |
| − After taxes on distributions and sale of fund shares | 16.88 | 13.66 |
| Indexes | 1 year | Lifetime (since fund’s inception) |
| MSCI EAFE (Europe, Australasia, Far East) Index (reflects no deductions for account fees, expenses or U.S. federal income taxes) | 31.22% | 19.87% |
After-tax returns are calculated using the highest individual federal income tax rates in effect during each year of the periods shown and do not reflect the impact of state and local taxes. Your actual after-tax returns depend on your individual tax situation and likely will differ from the results shown above.