Pay vs Performance Disclosure - USD ($)
Dec. 31, 2025
Dec. 31, 2024
Dec. 31, 2023
PAY VERSUS PERFORMANCE
As required by Section 953(a) of the Dodd-Frank Wall Street
Reform
and Consumer Protection Act, and Item 402(v) of Regulation S-K,
we are providing the following information about the relationship between executive compensation actually paid and certain financial performance of the Company. Year (a) |
Summary Compensation Table Total for Dirk Thye (b) (1) |
Compensation Actually Paid to Dirk Thye (c) (2) |
Average Summary Compensation Table Total for Non-CEO NEOs (d) (3) |
Average Compensation Actually Paid to Non-CEO NEOs (e) (4) |
Fixed $100 Investment Based on Total Shareholder Return (f) (5) |
Net Income (Loss) (in millions) (h) (6) | ||||||
| 2025 | $2,411,125 | $3,944,367 | $1,169,613 | $1,727,759 | $525.57 | $(83.98) | ||||||
| 2024 | $2,732,125 | $3,365,648 | $1,129,463 | $1,289,891 | $293.38 | $(56.83) | ||||||
| 2023 | $1,330,500 | $2,491,503 | $1,004,325 | $948,782 | $164.73 | $(31.39) |
| (1) | The dollar amounts reported in column (b) are the amounts of total compensation reported for Dr. Thye (who served as Chief Executive Officer during each of fiscal years 2025, 2024, and 2023) for each corresponding year in the “Total” column of the Summary Compensation Table. Dr. Thye is referred to herein as a “PEO.” Refer to “ Executive Compensation Tables—Summary Compensation Table |
| (2) | The dollar amounts reported in column (c) represent the amount of “compensation actually paid” to each PEO, respectively, as computed in accordance with Item 402(v) of Regulation S-K. The dollar amounts do not reflect the actual amount of compensation earned by or paid to each PEO in the applicable year. In accordance with the requirements of Item 402(v) of Regulation S-K, the following adjustments were made to PEO’s respective total compensation to determine the compensation actually paid in the applicable year: |
2025 Thye |
||||
Adjustments to Determine Compensation Actually Paid for PEO | ||||
Summary Compensation Table Total (a) |
$ | 2,411,125 | ||
Subtract: Adjustment for Grant Date Fair Value of Equity Awards Granted in Fiscal Year |
(1,644,000 | ) | ||
Add: Fair Value at Fiscal Year End of Outstanding and Unvested Equity Awards Granted in the Fiscal Year (b) |
2,094,017 | |||
Add/Subtract: Change in Fair Value of Outstanding and Unvested Equity Awards Granted in Prior Fiscal Years |
990,280 | |||
Add: Fair Value at Vesting of Equity Awards Granted and Vested in the Fiscal Year |
359,956 | |||
Add/Subtract: Change in Fair Value as of the Vesting Date of Equity Awards Granted in Prior Fiscal Years that Vested in the Fiscal Year |
(267,011 | ) | ||
Subtract: Fair Value as of the Prior Fiscal Year End of Equity Awards Granted in Prior Fiscal Years that Failed to Meet Vesting Conditions in the Fiscal Year |
— | |||
Add: Value of Dividends or Other Earnings Paid on Equity Awards Not Otherwise Reflected in Total Compensation |
— | |||
Compensation Actually Paid |
$ | 3,944,367 | ||
| (a) | We have not reported any amounts in our Summary Compensation Table for a change in pension value and, accordingly, the adjustments with respect to such items prescribed by the pay-versus-performance rules are not relevant to our analysis and no adjustments have been made. |
| (b) | The grant date fair value of equity awards represents the total of the amounts reported in the “Option Awards” column in the Summary Compensation Table for the applicable year. |
| (3) | The dollar amounts reported in column (d) represent the average of the amounts reported for the Company’s NEOs as a group (excluding the PEOs for each applicable year) (the “Non-PEO NEOs”) in the “Total” column of the Summary Compensation Table in each applicable year. The names of each of the Non-PEO NEOs included for purposes of calculating the average amounts in each applicable year are as follows: |
2025 and 2024: Charles Ryan, Ph.D. and Brendan Hannah; and
2023: Charles Ryan, Ph.D., Brendan Hannah, and Karen Smith, M.D., Ph.D.
| (4) | The dollar amounts reported in column (e) represent the average amount of “compensation actually paid” to the Non-PEO NEOs as a group , as computed in accordance with Item 402(v) of Regulation S-K. The dollar amounts do not reflect the actual average amount of compensation earned by or paid to the Non-PEO NEOs as a group during the applicable year. The following adjustments were made to average total compensation for the Non-PEO NEOs as a group for each year to determine the compensation actually paid in the applicable year: |
Adjustments to Determine Average Compensation Actually Paid for non-PEO NEOs |
2025 |
|||
Total Reported in Summary Compensation Table(a) |
$ | 1,169,613 | ||
Subtract: Adjustment for Grant Date Fair Value of Equity Awards Granted in Fiscal Year |
(513,750 | ) | ||
Add: Fair Value at Fiscal Year End of Outstanding and Unvested Equity Awards Granted in the Fiscal Year(b) |
654,382 | |||
Add/Subtract: Change in Fair Value of Outstanding and Unvested Equity Awards Granted in Prior Fiscal Years |
362,051 | |||
Add: Fair Value at Vesting of Equity Awards Granted and Vested in the Fiscal Year |
112,485 | |||
Add/Subtract: Change in Fair Value as of the Vesting Date of Equity Awards Granted in Prior Fiscal Years that Vested in the Fiscal Year |
(57,022 | ) | ||
Subtract: Fair Value as of the Prior Fiscal Year End of Equity Awards Granted in Prior Fiscal Years that Failed to Meet Vesting Conditions in the Fiscal Year |
— | |||
Add: Value of Dividends or Other Earnings Paid on Equity Awards Not Otherwise Reflected in Total Compensation |
— | |||
Compensation Actually Paid |
$ | 1,727,759 | ||
| (a) | We have not reported any amounts in our Summary Compensation Table for a change in pension value and, accordingly, the adjustments with respect to such items prescribed by the pay-versus-performance rules are not relevant to our analysis and no adjustments have been made. |
| (b) | The grant date fair value of equity awards represents the total of the amounts reported in the “Option Awards” column in the Summary Compensation Table for the applicable year. |
| (5) | Cumulative total shareholder return (“TSR”) is calculated by dividing the sum of the cumulative amount of dividends for the measurement period, assuming dividend reinvestment, and the difference between the Company’s share price at the end and the beginning of the measurement period by the Company’s share price at the beginning of the measurement period. |
| (6) | The dollar amounts reported represent the amount of net income (loss) reflected in the Company’s audited financial statements for the applicable year. |
The dollar amounts reported in column (d) represent the average of the amounts reported for the Company’s NEOs as a group (excluding the PEOs for each applicable year) (the
“Non-PEO
NEOs”) in the “Total” column of the Summary Compensation Table in each applicable year. The names of each of the Non-PEO
NEOs included for purposes of calculating the average amounts in each applicable year are as follows: 2025 and 2024: Charles Ryan, Ph.D. and Brendan Hannah; and
2023: Charles Ryan, Ph.D., Brendan Hannah, and Karen Smith, M.D., Ph.D.
The dollar amounts reported in column (c) represent the amount of “compensation actually paid” to each PEO, respectively, as computed in accordance with Item 402(v) of Regulation
S-K.
The dollar amounts do not reflect the actual amount of compensation earned by or paid to each PEO in the applicable year. In accordance with the requirements of Item 402(v) of Regulation S-K,
the following adjustments were made to PEO’s respective total compensation to determine the compensation actually paid in the applicable year: 2025 Thye |
||||
Adjustments to Determine Compensation Actually Paid for PEO | ||||
Summary Compensation Table Total (a) |
$ | 2,411,125 | ||
Subtract: Adjustment for Grant Date Fair Value of Equity Awards Granted in Fiscal Year |
(1,644,000 | ) | ||
Add: Fair Value at Fiscal Year End of Outstanding and Unvested Equity Awards Granted in the Fiscal Year (b) |
2,094,017 | |||
Add/Subtract: Change in Fair Value of Outstanding and Unvested Equity Awards Granted in Prior Fiscal Years |
990,280 | |||
Add: Fair Value at Vesting of Equity Awards Granted and Vested in the Fiscal Year |
359,956 | |||
Add/Subtract: Change in Fair Value as of the Vesting Date of Equity Awards Granted in Prior Fiscal Years that Vested in the Fiscal Year |
(267,011 | ) | ||
Subtract: Fair Value as of the Prior Fiscal Year End of Equity Awards Granted in Prior Fiscal Years that Failed to Meet Vesting Conditions in the Fiscal Year |
— | |||
Add: Value of Dividends or Other Earnings Paid on Equity Awards Not Otherwise Reflected in Total Compensation |
— | |||
Compensation Actually Paid |
$ | 3,944,367 | ||
| (a) | We have not reported any amounts in our Summary Compensation Table for a change in pension value and, accordingly, the adjustments with respect to such items prescribed by the pay-versus-performance rules are not relevant to our analysis and no adjustments have been made. |
| (b) | The grant date fair value of equity awards represents the total of the amounts reported in the “Option Awards” column in the Summary Compensation Table for the applicable year. |
The dollar amounts reported in column (e) represent the average amount of “compensation actually paid” to the
Non-PEO
NEOs as a group , as computed in accordance with Item 402(v) of Regulation S-K.
The dollar amounts do not reflect the actual average amount of compensation earned by or paid to the Non-PEO
NEOs as a group during the applicable year. The following adjustments were made to average total compensation for the Non-PEO
NEOs as a group for each year to determine the compensation actually paid in the applicable year: Adjustments to Determine Average Compensation Actually Paid for non-PEO NEOs |
2025 |
|||
Total Reported in Summary Compensation Table(a) |
$ | 1,169,613 | ||
Subtract: Adjustment for Grant Date Fair Value of Equity Awards Granted in Fiscal Year |
(513,750 | ) | ||
Add: Fair Value at Fiscal Year End of Outstanding and Unvested Equity Awards Granted in the Fiscal Year(b) |
654,382 | |||
Add/Subtract: Change in Fair Value of Outstanding and Unvested Equity Awards Granted in Prior Fiscal Years |
362,051 | |||
Add: Fair Value at Vesting of Equity Awards Granted and Vested in the Fiscal Year |
112,485 | |||
Add/Subtract: Change in Fair Value as of the Vesting Date of Equity Awards Granted in Prior Fiscal Years that Vested in the Fiscal Year |
(57,022 | ) | ||
Subtract: Fair Value as of the Prior Fiscal Year End of Equity Awards Granted in Prior Fiscal Years that Failed to Meet Vesting Conditions in the Fiscal Year |
— | |||
Add: Value of Dividends or Other Earnings Paid on Equity Awards Not Otherwise Reflected in Total Compensation |
— | |||
Compensation Actually Paid |
$ | 1,727,759 | ||
| (a) | We have not reported any amounts in our Summary Compensation Table for a change in pension value and, accordingly, the adjustments with respect to such items prescribed by the pay-versus-performance rules are not relevant to our analysis and no adjustments have been made. |
| (b) | The grant date fair value of equity awards represents the total of the amounts reported in the “Option Awards” column in the Summary Compensation Table for the applicable year. |
Compensation Actually Paid and Cumulative TSR
The following graph sets forth the relationship between Compensation Actually Paid to our PEOs, the average of Compensation Actually Paid to our
Non-PEO
NEOs, and the Company’s cumulative TSR over the three most recently completed fiscal years. 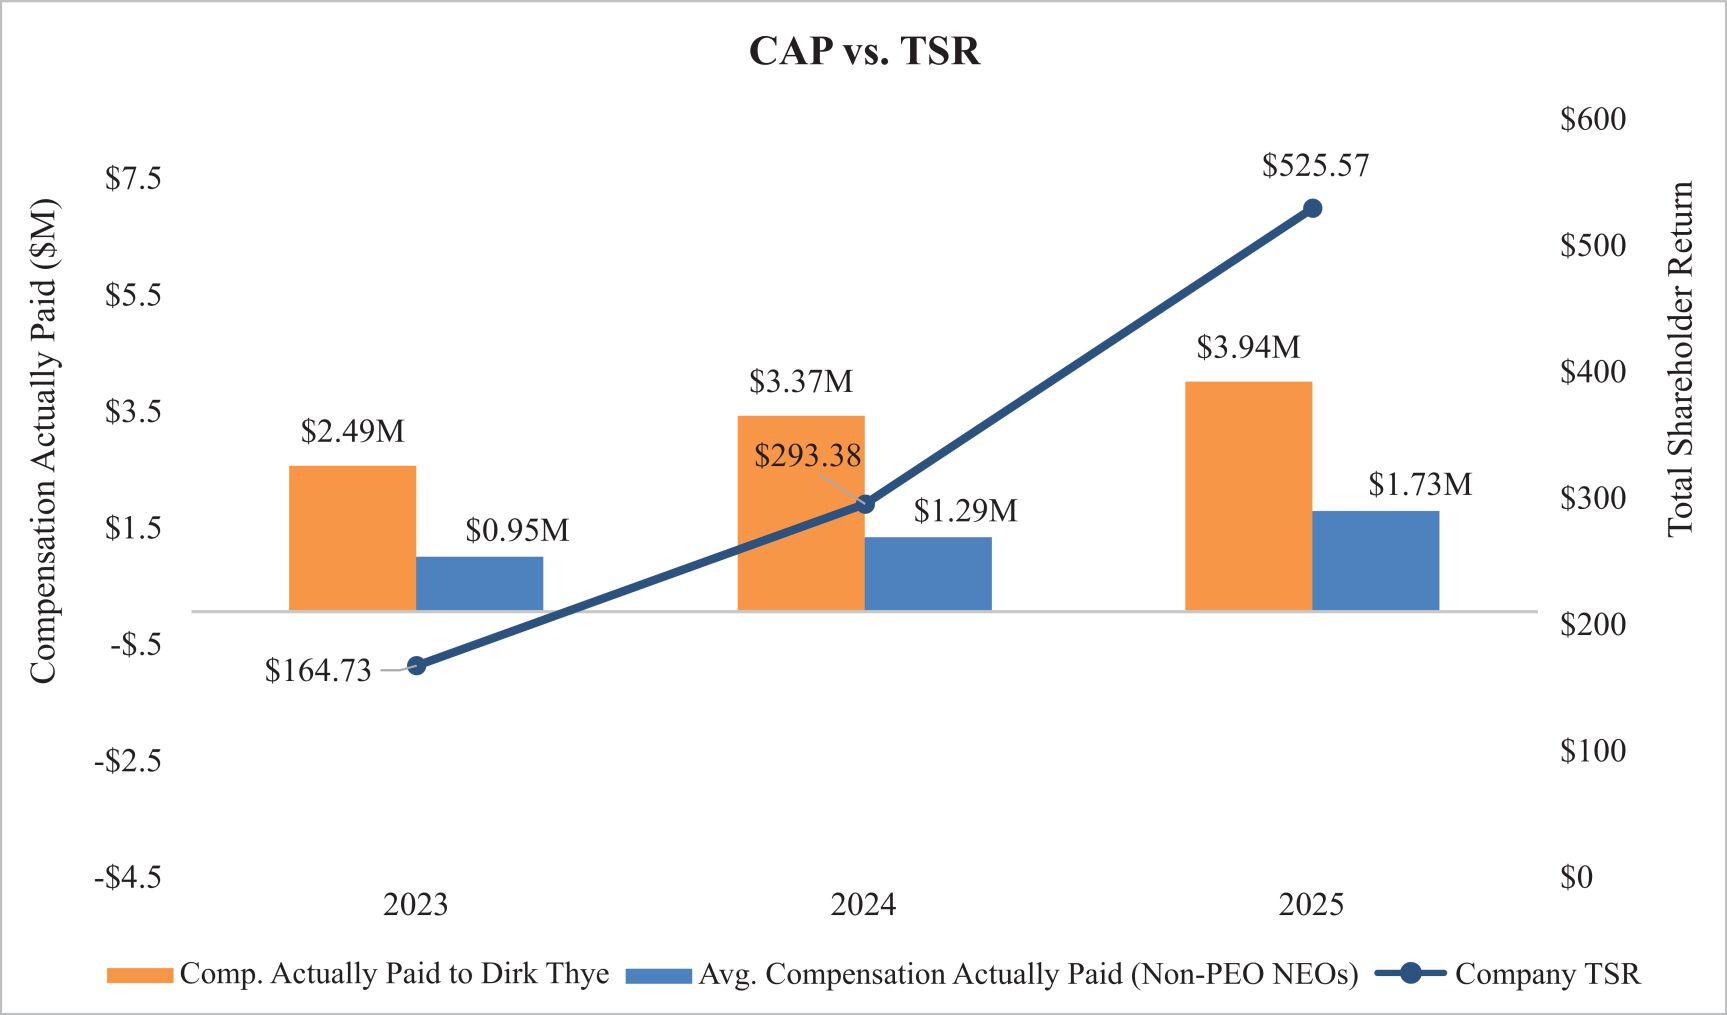
Compensation Actually Paid and Net Income (Loss)
The following graph sets forth the relationship between Compensation Actually Paid to our PEO, the average of Compensation Actually Paid to our
Non-PEO
NEOs, and the Company’s net income (loss) over the three most recently completed fiscal years. 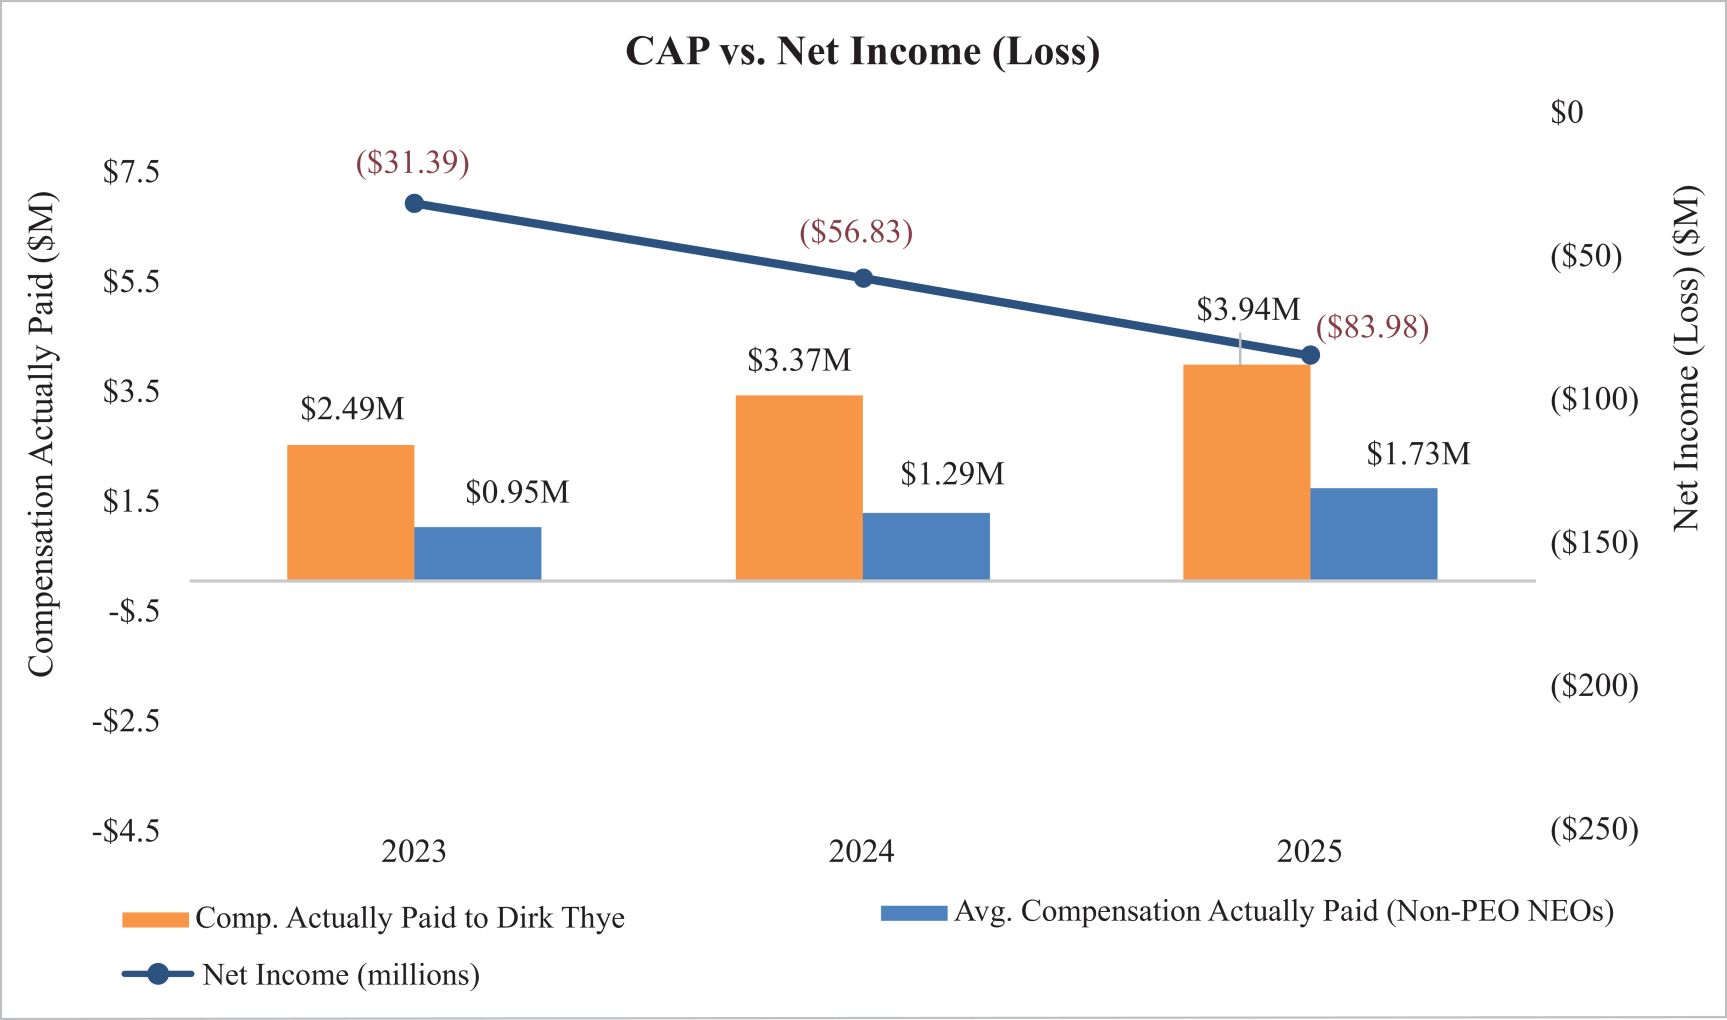
| (5) | Cumulative total shareholder return (“TSR”) is calculated by dividing the sum of the cumulative amount of dividends for the measurement period, assuming dividend reinvestment, and the difference between the Company’s share price at the end and the beginning of the measurement period by the Company’s share price at the beginning of the measurement period. |
| (6) | The dollar amounts reported represent the amount of net income (loss) reflected in the Company’s audited financial statements for the applicable year. |
Analysis of the Information Presented in the Pay versus Performance Table
In accordance with Item 402(v) of Regulation
S-K,
we are providing the following descriptions of the relationships between information presented in the Pay Versus Performance table above.