Pay vs Performance Disclosure
Jul. 15, 2024
May 01, 2024
Jan. 29, 2024
May 03, 2025
May 02, 2026
USD ($)
Companies
May 03, 2025
USD ($)
Apr. 27, 2024
USD ($)
Apr. 29, 2023
USD ($)
Apr. 30, 2022
USD ($)
PAY VS. PERFORMANCE
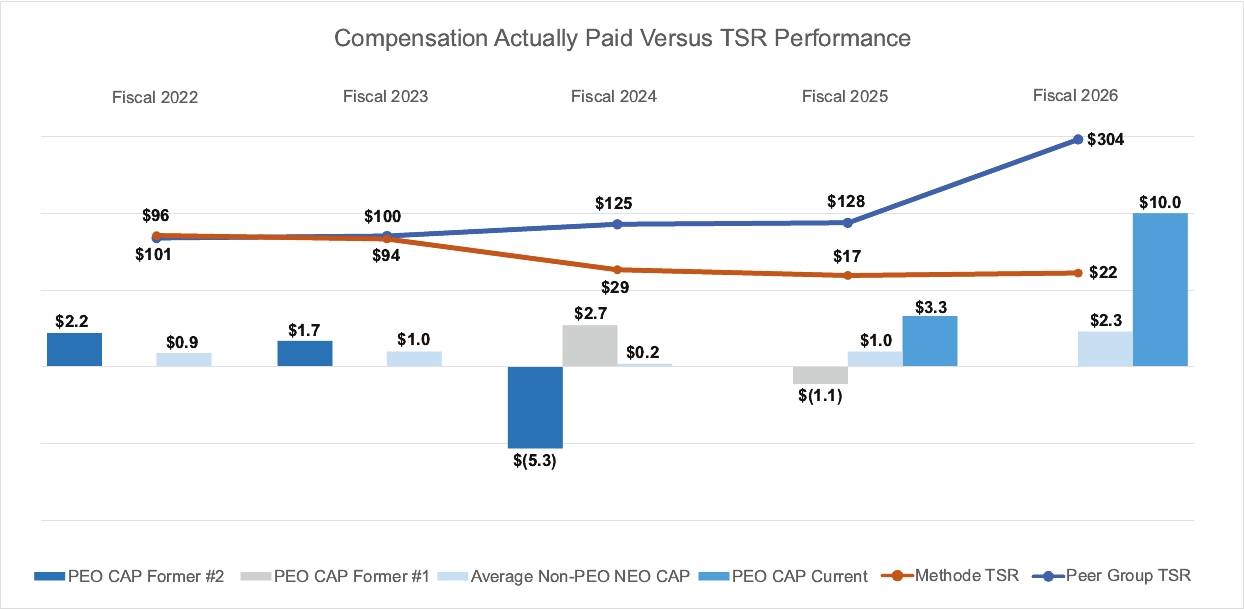
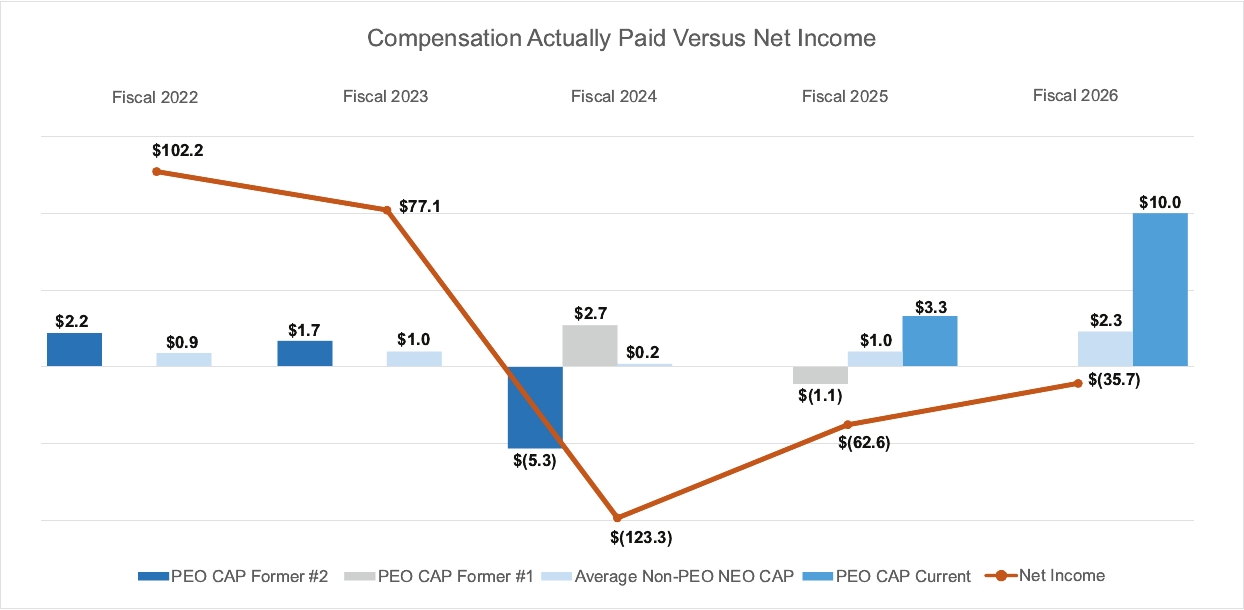
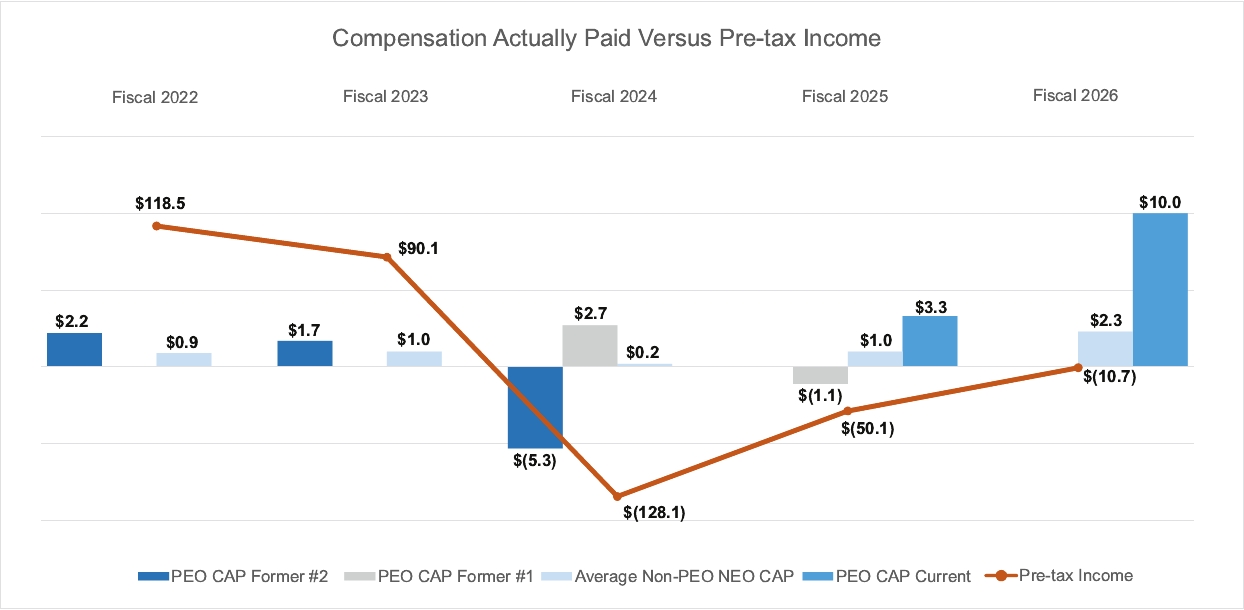
As required by SEC rules, we are providing the following information regarding the relationship between executive compensation and our financial performance for each of the last five completed fiscal years. In determining the “compensation actually paid” to our named executive officers in the table below, we are required to make various adjustments to amounts reported in the Summary Compensation Table for this year and in previous years, as the SEC’s valuation methods for this section differ from those required in the Summary Compensation Table. The “compensation actually paid” data reflected in the table below may not reflect amounts actually realized by our named executive officers.
For information concerning the decisions made by our Compensation Committee with respect to compensation for the named executive officers for each fiscal year, please see the Compensation Discussion and Analysis sections of this proxy statement and the proxy statements for the other fiscal years covered in the table below. A significant portion of “compensation actually paid” amounts shown relates to changes in values of unvested awards over the course of the reporting year. These unvested awards remain subject to significant risk from forfeiture conditions and possible future declines in value based on changes in our stock price. The ultimate values actually realized by our named executive officers from unvested equity awards will not be determined until the awards fully vest.
Fiscal Year | SCT Total for PEO ($)(1) | Compensation Actually Paid to PEO ($)(2) | SCT Total for Interim PEO ($) | Compensation Actually Paid for Interim PEO | SCT Total for Former PEO #1 ($)(1) | Compensation Actually Paid to Former PEO #1 ($)(2) | SCT Total for Former PEO #2 ($)(1) | Compensation Actually Paid to Former PEO #2 ($)(2) | Average SCT Total for Non-PEO NEOs ($)(3) | Average Compensation Actually Paid to Non-PEO NEOs ($)(2) | Value of Initial Fixed $100 Investment Based On: | Net Income ($ In Million)(6) | Pre-Tax Income ($ In Million)(7) | |||||||||||||||||||||||||||||||
Total Shareholder Return($)(4) | Peer Group Total Shareholder Return ($)(5) | |||||||||||||||||||||||||||||||||||||||||||
2026 | 8,090,756 | 10,006,757 | — | — | — | — | — | — | 1,984,336 | 2,332,296 | 22 | 304 | (35.7) | (10.7) | ||||||||||||||||||||||||||||||
2025 | 5,739,219 | 3,286,285 | 718,609 | 718,609 | 677,365 | (1,093,032) | — | — | 1,200,082 | 984,535 | 17 | 128 | (62.6) | (50.1) | ||||||||||||||||||||||||||||||
2024 | — | — | — | — | 4,017,227 | 2,662,627 | 2,206,047 | (5,346,078) | 807,926 | 228,210 | 29 | 125 | (123.3) | (128.1) | ||||||||||||||||||||||||||||||
2023 | — | — | — | — | — | — | 3,088,086 | 1,730,586 | 1,213,051 | 960,800 | 94 | 100 | 77.1 | 90.1 | ||||||||||||||||||||||||||||||
2022 | — | — | — | — | — | — | 2,297,776 | 2,177,776 | 933,371 | 907,572 | 101 | 96 | 102.2 | 118.5 | ||||||||||||||||||||||||||||||
(1) | Mr. Avula (Former PEO #1 in the table) was appointed CEO on January 29, 2024, and held that position through May 1, 2024. Mr. Duda (Former PEO #2 in the table) was the CEO from the start of fiscal 2021 through January 29, 2024. Mr. Nystrom served as Interim CEO from May 5, 2024 through Mr. DeGaynor’s appointment on July 15, 2024. These amounts reflect the total compensation reported for Messrs. DeGaynor, Nystrom, Avula or Duda, as applicable, in the “Total” column of the Summary Compensation Table for the relevant fiscal year. |
(2) | The chart below details the additions to and deductions from the total compensation reported for Mr. DeGaynor and the other NEOs as a group in the Summary Compensation Table in order to calculate and reflect the adjusted values of the Compensation Actually Paid for fiscal 2026. |
PEO ($) | Average of other NEOs ($) | |||||||
Summary Compensation Table Total | 8,090,756 | 1,984,336 | ||||||
Adjustments: | ||||||||
Deduction for amounts reported under the “Stock Awards” column in the Summary Compensation Table | 4,456,045 | 664,358 | ||||||
Increase based on ASC 718 fair value of awards granted during fiscal year that remain unvested as of fiscal year end, determined as of fiscal year end | 6,249,764 | 931,787 | ||||||
Increase based on ASC 718 fair value of awards granted during fiscal year that vested during fiscal year, determined as of vesting date | 0 | 0 | ||||||
Increase (decrease) for awards granted prior to fiscal year that were outstanding and unvested as of fiscal year end, determined based on change in ASC 718 fair value from prior fiscal year end to fiscal year end | 105,268 | 61,685 | ||||||
Increase (decrease) for awards granted prior to fiscal year that vested during fiscal year, determined based on change in ASC 718 fair value from prior fiscal year end to vesting date | 17,014 | 18,847 | ||||||
Deduction of ASC 718 fair value of awards granted prior to fiscal year that were forfeited during fiscal year, determined as of prior fiscal year end | 0 | 0 | ||||||
Compensation Actually Paid | 10,006,757 | 2,332,296 | ||||||
(3) | These amounts reflect the average total compensation reported for the Company’s named executive officers as a group (excluding PEOs) in the “Total” column of the Summary Compensation Table for each corresponding year. The Non-PEO named executive officers are comprised of |
the following: fiscal 2026 – Ms. Kowalchik, Mr. Ullrich, Mr. Erwin and Ms. Vyverberg; fiscal 2025 – Ms. Kowalchik, Mr. Ullrich, Mr. Erwin, Ms. Vyverberg, Mr. Rawden, Mr. Tsoumas and Ms. Barry; fiscal 2024 – Mr. Tsoumas, Ms. Barry, Mr. Martin and Mr. Shetty; fiscal 2023 – Mr. Tsoumas, Mr. Khoury, Ms. Barry and Ms. Vyverberg; and fiscal 2022 – Mr. Tsoumas, Mr. Khoury, Ms. Barry and Mr. Martin.
(4) | Total Shareholder Return (TSR) assumes that $100 was invested in the Company’s common stock beginning on May 2, 2021 and that all dividends and distributions were reinvested on a quarterly basis. |
(5) | The peer group is made up of the same 15 companies in our peer group used for executive compensation benchmarking as described above under “Compensation Discussion and Analysis – Market Benchmarking and Positioning of Fiscal 2026 Executive Compensation.” Peer group TSR is calculated under the same assumptions as Company TSR. |
(6) | Reflects “Net income” or “Net loss” in the Company’s Consolidated Income Statements included in the Company’s Annual Reports on Form 10-K for each of the applicable fiscal years. |
(7) | Pre-tax income was selected as the additional metric to be included in the table above (as the Company-Selected Measure under applicable SEC rules), as the financial performance measure that, in the Company’s assessment, represents the most important performance measure not otherwise required to be disclosed in the table and used by the Company to link executive compensation to Company performance. A detailed Pre-Tax Income reconciliation for our fiscal year 2026 can be found in our fourth quarter fiscal 2026 earnings release included as Exhibit 99.1 to the Company’s Current Report on Form 8-K furnished with the SEC on June 24, 2026. |
(1) | Mr. Avula (Former PEO #1 in the table) was appointed CEO on January 29, 2024, and held that position through May 1, 2024. Mr. Duda (Former PEO #2 in the table) was the CEO from the start of fiscal 2021 through January 29, 2024. Mr. Nystrom served as Interim CEO from May 5, 2024 through Mr. DeGaynor’s appointment on July 15, 2024. These amounts reflect the total compensation reported for Messrs. DeGaynor, Nystrom, Avula or Duda, as applicable, in the “Total” column of the Summary Compensation Table for the relevant fiscal year. |
(3) | These amounts reflect the average total compensation reported for the Company’s named executive officers as a group (excluding PEOs) in the “Total” column of the Summary Compensation Table for each corresponding year. The Non-PEO named executive officers are comprised of |
the following: fiscal 2026 – Ms. Kowalchik, Mr. Ullrich, Mr. Erwin and Ms. Vyverberg; fiscal 2025 – Ms. Kowalchik, Mr. Ullrich, Mr. Erwin, Ms. Vyverberg, Mr. Rawden, Mr. Tsoumas and Ms. Barry; fiscal 2024 – Mr. Tsoumas, Ms. Barry, Mr. Martin and Mr. Shetty; fiscal 2023 – Mr. Tsoumas, Mr. Khoury, Ms. Barry and Ms. Vyverberg; and fiscal 2022 – Mr. Tsoumas, Mr. Khoury, Ms. Barry and Mr. Martin.
(5) | The peer group is made up of the same 15 companies in our peer group used for executive compensation benchmarking as described above under “Compensation Discussion and Analysis – Market Benchmarking and Positioning of Fiscal 2026 Executive Compensation.” Peer group TSR is calculated under the same assumptions as Company TSR. |
(2) | The chart below details the additions to and deductions from the total compensation reported for Mr. DeGaynor and the other NEOs as a group in the Summary Compensation Table in order to calculate and reflect the adjusted values of the Compensation Actually Paid for fiscal 2026. |
PEO ($) | Average of other NEOs ($) | |||||||
Summary Compensation Table Total | 8,090,756 | 1,984,336 | ||||||
Adjustments: | ||||||||
Deduction for amounts reported under the “Stock Awards” column in the Summary Compensation Table | 4,456,045 | 664,358 | ||||||
Increase based on ASC 718 fair value of awards granted during fiscal year that remain unvested as of fiscal year end, determined as of fiscal year end | 6,249,764 | 931,787 | ||||||
Increase based on ASC 718 fair value of awards granted during fiscal year that vested during fiscal year, determined as of vesting date | 0 | 0 | ||||||
Increase (decrease) for awards granted prior to fiscal year that were outstanding and unvested as of fiscal year end, determined based on change in ASC 718 fair value from prior fiscal year end to fiscal year end | 105,268 | 61,685 | ||||||
Increase (decrease) for awards granted prior to fiscal year that vested during fiscal year, determined based on change in ASC 718 fair value from prior fiscal year end to vesting date | 17,014 | 18,847 | ||||||
Deduction of ASC 718 fair value of awards granted prior to fiscal year that were forfeited during fiscal year, determined as of prior fiscal year end | 0 | 0 | ||||||
Compensation Actually Paid | 10,006,757 | 2,332,296 | ||||||
(2) | The chart below details the additions to and deductions from the total compensation reported for Mr. DeGaynor and the other NEOs as a group in the Summary Compensation Table in order to calculate and reflect the adjusted values of the Compensation Actually Paid for fiscal 2026. |
PEO ($) | Average of other NEOs ($) | |||||||
Summary Compensation Table Total | 8,090,756 | 1,984,336 | ||||||
Adjustments: | ||||||||
Deduction for amounts reported under the “Stock Awards” column in the Summary Compensation Table | 4,456,045 | 664,358 | ||||||
Increase based on ASC 718 fair value of awards granted during fiscal year that remain unvested as of fiscal year end, determined as of fiscal year end | 6,249,764 | 931,787 | ||||||
Increase based on ASC 718 fair value of awards granted during fiscal year that vested during fiscal year, determined as of vesting date | 0 | 0 | ||||||
Increase (decrease) for awards granted prior to fiscal year that were outstanding and unvested as of fiscal year end, determined based on change in ASC 718 fair value from prior fiscal year end to fiscal year end | 105,268 | 61,685 | ||||||
Increase (decrease) for awards granted prior to fiscal year that vested during fiscal year, determined based on change in ASC 718 fair value from prior fiscal year end to vesting date | 17,014 | 18,847 | ||||||
Deduction of ASC 718 fair value of awards granted prior to fiscal year that were forfeited during fiscal year, determined as of prior fiscal year end | 0 | 0 | ||||||
Compensation Actually Paid | 10,006,757 | 2,332,296 | ||||||
Most Important Financial Performance Measures. The four items listed below are the most important financial performance measures we used in fiscal 2026 to determine compensation for our named executive officers, as further described above in the Compensation Discussion and Analysis section under “Key Components of Fiscal 2026 Compensation.”
• | Pre-tax income |
• | Free cash flow |
• | Return on invested capital |
• | Total shareholder return |
(7) | Pre-tax income was selected as the additional metric to be included in the table above (as the Company-Selected Measure under applicable SEC rules), as the financial performance measure that, in the Company’s assessment, represents the most important performance measure not otherwise required to be disclosed in the table and used by the Company to link executive compensation to Company performance. A detailed Pre-Tax Income reconciliation for our fiscal year 2026 can be found in our fourth quarter fiscal 2026 earnings release included as Exhibit 99.1 to the Company’s Current Report on Form 8-K furnished with the SEC on June 24, 2026. |