Pay Versus Performance Disclosure
In accordance with rules adopted by the Securities and Exchange Commission pursuant to the Dodd-Frank Wall Street Reform and Consumer Protection Act of 2010, we provide the following disclosure regarding executive compensation for our principal executive officer (“PEO”) and Non-PEO NEOs and Company performance for the fiscal years listed below. For the most recently completed fiscal year, we did not use any financial performance measure to link Compensation Actually Paid to our NEOs to the Company’s performance; accordingly, this disclosure does not present a company-selected measure in the table below nor a tabular list of our most important performance measures, as permitted under the rules promulgated by the Securities and Exchange Commission. The Compensation Committee did not consider the pay versus performance disclosure below in making its pay decisions for any of the years shown.
Year | Summary Compensation Table Total for Jean Madar1 ($) | Compensation Actually Paid to Jean Madar1,2,3 ($) | Average Summary Compensation Table Total for Non-PEO NEOs1 | Average Compensation Actually Paid to Non-PEO NEOs1,2,3 ($) | Value of Initial Fixed $100 Investment based on:4 | Net Income | |
TSR | Peer Group TSR | ||||||
2025 | 2,097,316 | 2,125,044 | 1,186,734 | 1,052,057 | 156.51 | 111.40 | 208 |
2024 | 2,000,000 | 1,896,779 | 1,505,205 | 1,409,911 | 235.65 | 105.41 | 203 |
2023 | 2,000,000 | 2,775,201 | 964,922 | 1,502,589 | 251.87 | 117.76 | 188 |
2022 | 1,369,077 | 945,026 | 890,907 | 696,314 | 165.76 | 108.18 | 151 |
2021 | 1,230,000 | 3,199,857 | 904,237 | 2,316,873 | 179.01 | 125.72 | 110 |
1. Jean Madar was our PEO for each year presented. The individuals comprising the Non-PEO NEOs for each year presented are listed below.
2021 | 2022 | 2023 - 2024 | 2025 |
Russell Greenberg | Russell Greenberg | Michel Atwood | Michel Atwood |
Philippe Benacin | Michel Atwood | Philippe Benacin | Philippe Benacin |
Philippe Santi | Philippe Benacin | Philippe Santi | Philippe Santi |
Philippe Santi | Frédéric Garcia-Pelayo | Herve Bouillonnec | |
| Frédéric Garcia-Pelayo |
|
|
2. The amounts shown for Compensation Actually Paid have been calculated in accordance with Item 402(v) of Regulation S-K and do not reflect compensation actually earned, realized, or received by the Company’s NEOs. These amounts reflect the Summary Compensation Table Total with certain adjustments as described in footnote 3 below.
3. Compensation Actually Paid reflects the exclusions and inclusions of certain amounts for the PEO and the Non-PEO NEOs as set forth below. Equity values are calculated in accordance with FASB ASC Topic 718. Amounts in the Exclusion of Option Awards column are the totals from the Option Awards columns set forth in the Summary Compensation Table.
Year | Summary Compensation Table Total for Jean Madar | Exclusion of Stock and Option Awards for Jean Madar | Inclusion of Equity Values for Jean Madar | Compensation Actually Paid to Jean Madar |
2025 | 2,097,316 | (97,316) | 125,044 | 2,125,044 |
Year | Average Summary Compensation Table Total for Non-PEO NEOs | Average Exclusion of Change in Pension Value for Non-PEO NEOs | Average Exclusion of Option Awards for Non-PEO NEOs | Average Inclusion of Equity Values for Non-PEO NEOs | Average Compensation Actually Paid to Non-PEO NEOs |
2025 | 1,186,734 | (9,977) | (89,685) | (35,015) | 1,052,057 |
The amounts in the Inclusion of Equity Values in the tables above are derived from the amounts set forth in the following tables:
Year | Year-End Fair Value of Equity Awards Granted During Year That Remained Unvested as of Last Day of Year for Jean Madar | Change in Fair Value from Last Day of Prior Year to Last Day of Year of Unvested Equity Awards for Jean Madar | Vesting-Date Fair Value of Equity Awards Granted During Year that Vested During Year for Jean Madar | Change in Fair Value from Last Day of Prior Year to Vesting Date of Unvested Equity Awards that Vested During Year for Jean Madar | Fair Value at Last Day of Prior Year of Equity Awards Forfeited During Year for Jean Madar | Total - Inclusion of |
2025 | 116,548 | — | — | 8,496 | — | 125,044 |
Year | Average Year-End Fair Value of Equity Awards Granted During Year That Remained Unvested as of Last Day of Year for Non-PEO NEOs | Average Change in Fair Value from Last Day of Prior Year to Last Day of Year of Unvested Equity Awards for Non-PEO NEOs | Average Vesting-Date Fair Value of Equity Awards Granted During Year that Vested During Year for Non-PEO NEOs | Average Change in Fair Value from Last Day of Prior Year to Vesting Date of Unvested Equity Awards that Vested During Year for Non-PEO NEOs | Average Fair Value at Last Day of Prior Year of Equity Awards Forfeited During Year for Non-PEO NEOs | Total - Average Inclusion of |
2025 | 99,301 | (101,771) | — | (32,545) | — | (35,015) |
4. The Peer Group TSR set forth in this table utilizes a custom group of industry peers, weighted according to the respective peer companies’ stock market capitalization on December 31, 2020, which we also utilize in the stock performance graph required by Item 201(e) of Regulation S-K included in our Annual Report for the year ended December 31, 2025. The Company changed its peer group in 2023 in order to reflect the current competitive landscape in our industry more accurately. The comparison assumes $100 was invested for the period starting December 31, 2020, through the end of the listed year in the Company and the peer group, respectively. Historical stock performance is not necessarily indicative of future stock performance. The following table shows the peer group constituents.
2022 | 2023-2025 |
CCA Industries, Inc. | The Estée Lauder Companies Inc. |
Colgate-Palmolive Company | The Procter & Gamble Company |
Kimberly-Clark Corporation | e.l.f. Beauty, Inc. |
Natural Health Trends Corp. | Coty Inc. |
Summer Infant, Inc. | L’Oréal SA |
The Estée Lauder Companies Inc. | LVMH Moët Hennessy Louis Vuitton |
The Procter & Gamble Company | Natura &Co Holding SS |
The Stephan Co. | Olaplex Holdings, Inc. |
United-Guardian, Inc. | Shiseido Co Ltd. |
1. Jean Madar was our PEO for each year presented. The individuals comprising the Non-PEO NEOs for each year presented are listed below.
2021 | 2022 | 2023 - 2024 | 2025 |
Russell Greenberg | Russell Greenberg | Michel Atwood | Michel Atwood |
Philippe Benacin | Michel Atwood | Philippe Benacin | Philippe Benacin |
Philippe Santi | Philippe Benacin | Philippe Santi | Philippe Santi |
Philippe Santi | Frédéric Garcia-Pelayo | Herve Bouillonnec | |
| Frédéric Garcia-Pelayo |
|
|
Year | Summary Compensation Table Total for Jean Madar | Exclusion of Stock and Option Awards for Jean Madar | Inclusion of Equity Values for Jean Madar | Compensation Actually Paid to Jean Madar |
2025 | 2,097,316 | (97,316) | 125,044 | 2,125,044 |
Year | Year-End Fair Value of Equity Awards Granted During Year That Remained Unvested as of Last Day of Year for Jean Madar | Change in Fair Value from Last Day of Prior Year to Last Day of Year of Unvested Equity Awards for Jean Madar | Vesting-Date Fair Value of Equity Awards Granted During Year that Vested During Year for Jean Madar | Change in Fair Value from Last Day of Prior Year to Vesting Date of Unvested Equity Awards that Vested During Year for Jean Madar | Fair Value at Last Day of Prior Year of Equity Awards Forfeited During Year for Jean Madar | Total - Inclusion of |
2025 | 116,548 | — | — | 8,496 | — | 125,044 |
Year | Average Summary Compensation Table Total for Non-PEO NEOs | Average Exclusion of Change in Pension Value for Non-PEO NEOs | Average Exclusion of Option Awards for Non-PEO NEOs | Average Inclusion of Equity Values for Non-PEO NEOs | Average Compensation Actually Paid to Non-PEO NEOs |
2025 | 1,186,734 | (9,977) | (89,685) | (35,015) | 1,052,057 |
Year | Average Year-End Fair Value of Equity Awards Granted During Year That Remained Unvested as of Last Day of Year for Non-PEO NEOs | Average Change in Fair Value from Last Day of Prior Year to Last Day of Year of Unvested Equity Awards for Non-PEO NEOs | Average Vesting-Date Fair Value of Equity Awards Granted During Year that Vested During Year for Non-PEO NEOs | Average Change in Fair Value from Last Day of Prior Year to Vesting Date of Unvested Equity Awards that Vested During Year for Non-PEO NEOs | Average Fair Value at Last Day of Prior Year of Equity Awards Forfeited During Year for Non-PEO NEOs | Total - Average Inclusion of |
2025 | 99,301 | (101,771) | — | (32,545) | — | (35,015) |
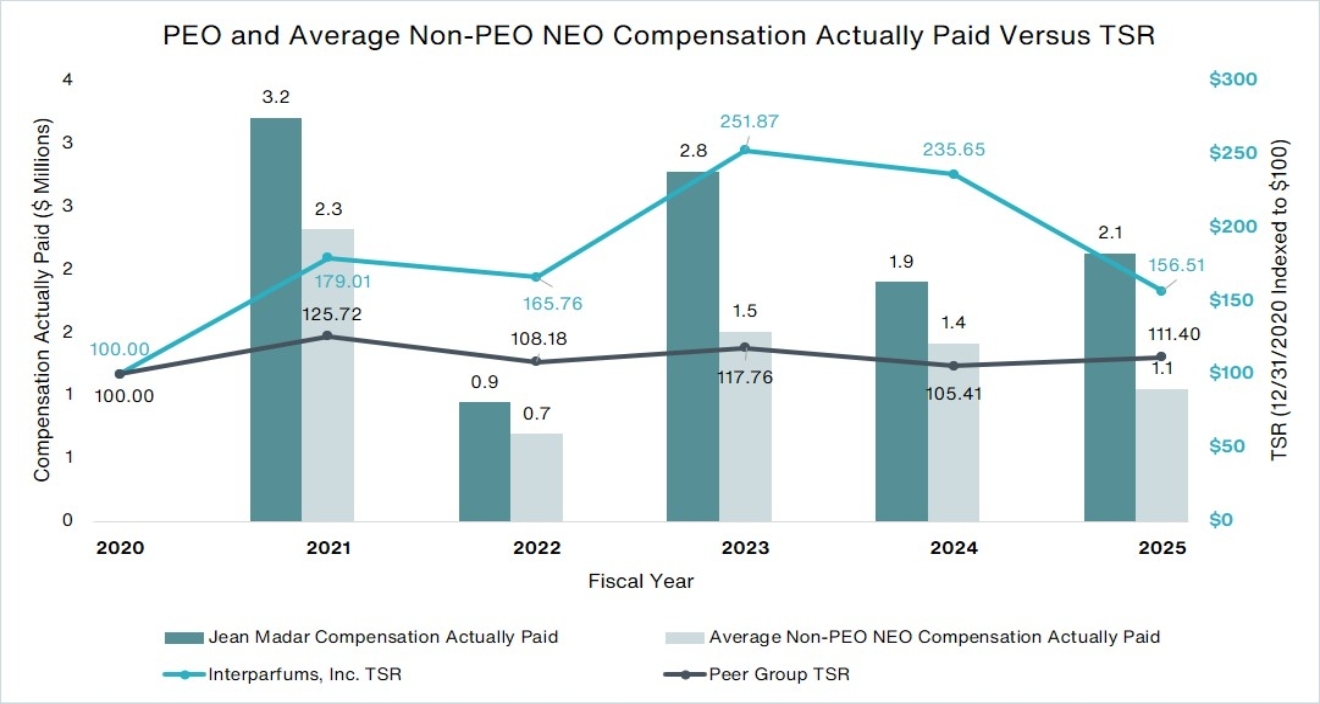
Relationship Between PEO and Non-PEO NEO Average Compensation Actually Paid and Total Shareholder Return (“TSR”)
The following chart sets forth the relationship between Compensation Actually Paid to our PEO, the average of Compensation Actually Paid to our Non-PEO NEOs, the Company’s cumulative TSR over the five most recently completed fiscal years and the Peer Group TSR over the same period.
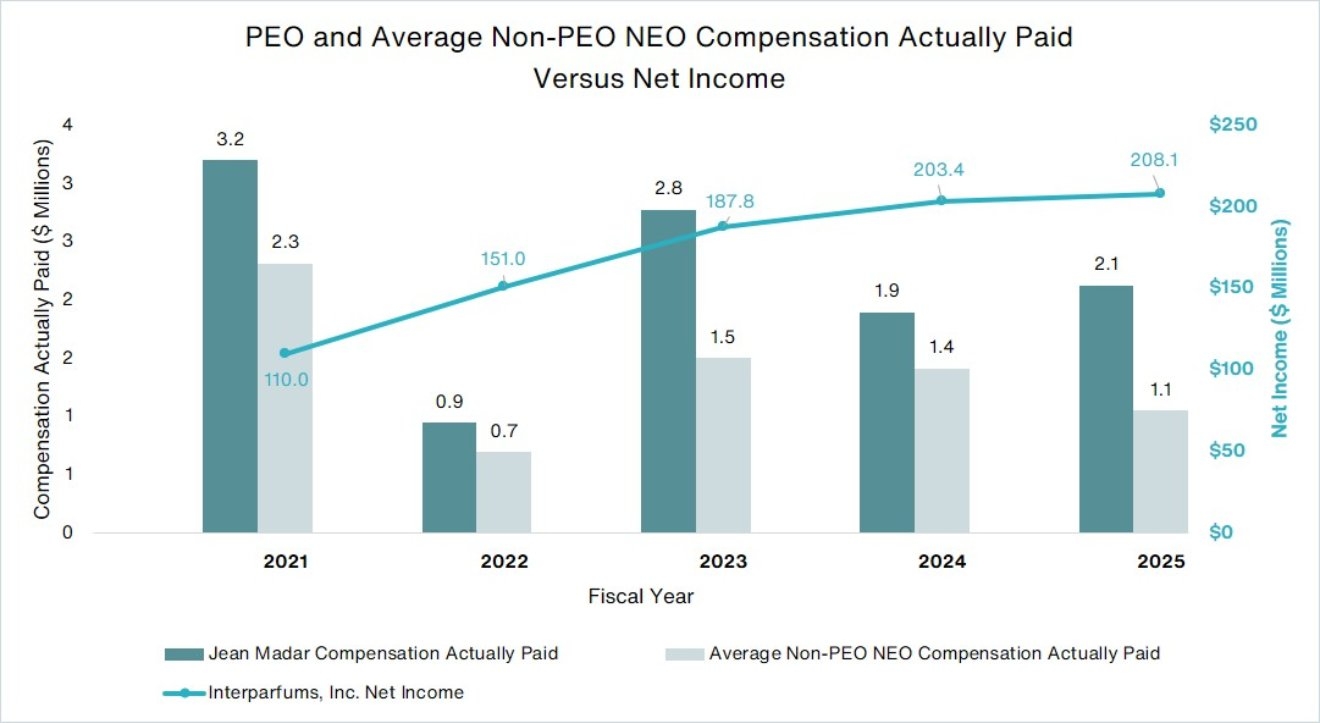
Relationship Between PEO and Non-PEO NEO Average Compensation Actually Paid and Net Income
The following chart sets forth the relationship between Compensation Actually Paid to our PEO, the average of Compensation Actually Paid to our Non-PEO NEOs, and our Net Income during the five most recently completed fiscal years.
| [1] | Jean Madar was our PEO for each year presented. The individuals comprising the Non-PEO NEOs for each year presented are listed below. |
| [2] | The amounts shown for Compensation Actually Paid have been calculated in accordance with Item 402(v) of Regulation S-K and do not reflect compensation actually earned, realized, or received by the Company’s NEOs. These amounts reflect the Summary Compensation Table Total with certain adjustments as described in footnote 3 below. |
| [3] | Compensation Actually Paid reflects the exclusions and inclusions of certain amounts for the PEO and the Non-PEO NEOs as set forth below. Equity values are calculated in accordance with FASB ASC Topic 718. Amounts in the Exclusion of Option Awards column are the totals from the Option Awards columns set forth in the Summary Compensation Table. |
| [4] | The Peer Group TSR set forth in this table utilizes a custom group of industry peers, weighted according to the respective peer companies’ stock market capitalization on December 31, 2020, which we also utilize in the stock performance graph required by Item 201(e) of Regulation S-K included in our Annual Report for the year ended December 31, 2025. The Company changed its peer group in 2023 in order to reflect the current competitive landscape in our industry more accurately. The comparison assumes $100 was invested for the period starting December 31, 2020, through the end of the listed year in the Company and the peer group, respectively. Historical stock performance is not necessarily indicative of future stock performance. The following table shows the peer group constituents. |