Shareholder Report
May 31, 2026
USD ($)
Holding
What were the fund costs for the last year?
(based on a hypothetical $10,000 investment)Fund | Cost of $10,000 Investment | Costs paid as a percentage of a $10,000 investment |
| CGIE | $ 58 | 0.54 % |
Management's discussion of fund performance
The fund's shares gained 14.63% on a net asset value (NAV) basis and 14.39% on a market price basis for the year ended
May 31, 2026. These results compare with a 22.80% gain for the MSCI EAFE (Europe, Australasia, Far East) Index. For information on returns for additional periods, including the fund lifetime, please refer to.
May 31, 2026. These results compare with a 22.80% gain for the MSCI EAFE (Europe, Australasia, Far East) Index. For information on returns for additional periods, including the fund lifetime, please refer to
capitalgroup.com/ETF-returns
What factors influenced results
During the fund’s fiscal year, international equities posted solid gains, overcoming volatility driven by trade tensions and geopolitical uncertainty. Heavy investment in artificial intelligence continued to boost large-cap technology stocks. Meanwhile, energy shares surged on higher oil prices, driven by the Middle East conflict. European markets rose, aided by stronger domestic demand and a European Central Bank rate cut. Japanese equities also climbed due to strong corporate earnings, structural reforms and a weaker yen.
Within the fund, most sectors contributed to the overall portfolio, with information technology, financials and industrials being particularly additive. Results in utilities and energy sectors outpaced the overall fund results. Geographically, investments in the U.K., Netherlands and France contributed positively to absolute returns.
Conversely, holdings in the consumer discretionary, heathcare and communication services sectors lagged. Likewise, Denmark and Germany posted negative overall returns.
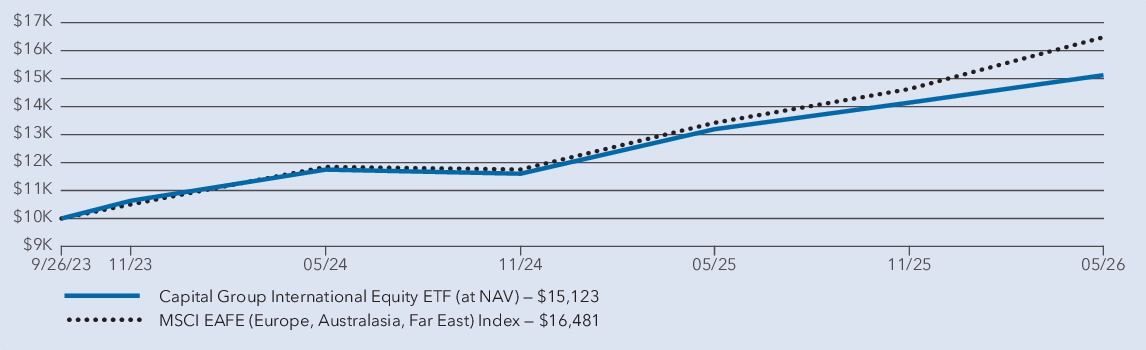
Average annual total returns
1 year | Since inception 1 | |
| Capital Group International Equity ETF (at NAV) 2 | 14.63 % | 16.69 % |
| MSCI EAFE (Europe, Australasia, Far East) Index 3 | 22.80 % | 20.50 % |
1
The fund began investment operations on September 26, 2023.2
Investment results assume all distributions are reinvested and reflect applicable fees and expenses. When applicable, results reflect fee waivers and/or expense reimbursements, without which they would have been lower.3
Results assume all distributions are reinvested. Any market index shown is unmanaged, and therefore, has no expenses. Investors cannot invest directly in an index. Source(s): MSCI.Key fund statistics
| Fund net assets (in millions) | $ 2,244 |
| Total number of portfolio holdings | 73 |
| Total advisory fees paid (in millions) | $ 8 |
| Portfolio turnover rate | 43 % |
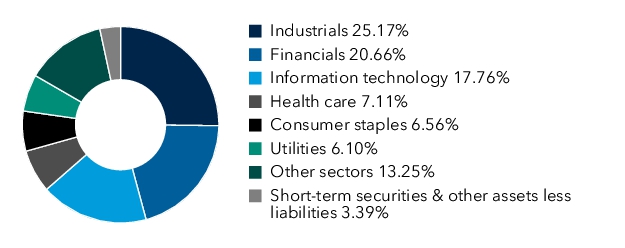
Portfolio holdings by sector