Shareholder Report
May 31, 2026
USD ($)
Holding
What were the fund costs for the last year?
(based on a hypothetical $10,000 investment)Fund | Cost of $10,000 Investment | Costs paid as a percentage of a $10,000 investment |
| CGGO | $ 56 | 0.47 % |
Management's discussion of fund performance
The fund's shares gained 38.02% on a net asset value (NAV) basis and 37.83% on a market price basis for the year ended May 31, 2026. These results compare with a 30.27% gain for the MSCI ACWI (All Country World Index). For information on returns for additional periods, including the fund lifetime, please refer to .
capitalgroup.com/ETF-returns
What factors influenced results
During the fund’s fiscal year, global equity markets delivered robust gains despite persistent trade tensions and geopolitical uncertainty. Strong corporate earnings lifted equities to record highs, including those within the U.S. and Japan. Heavy investment in artificial intelligence continued to boost large-cap technology stocks. Meanwhile, energy stocks surged on higher oil prices, driven by the Middle East conflict. Emerging markets also advanced, as strong semiconductor demand supported stocks in South Korea and Taiwan.
Holdings in multiple sectors contributed positively to the portfolio, with information technology being the most additive. Returns from the industrials, health care and materials sectors also supported results. U.S.-based companies, which represent about half of the portfolio, posted gains but lagged the fund’s overall results. Companies in South Korea and Taiwan also made meaningful contributions.
In contrast, the utilities sector in the portfolio was the only detractor during the period. Investments in companies based in Japan, Denmark and the Philippines detracted from the portfolio.
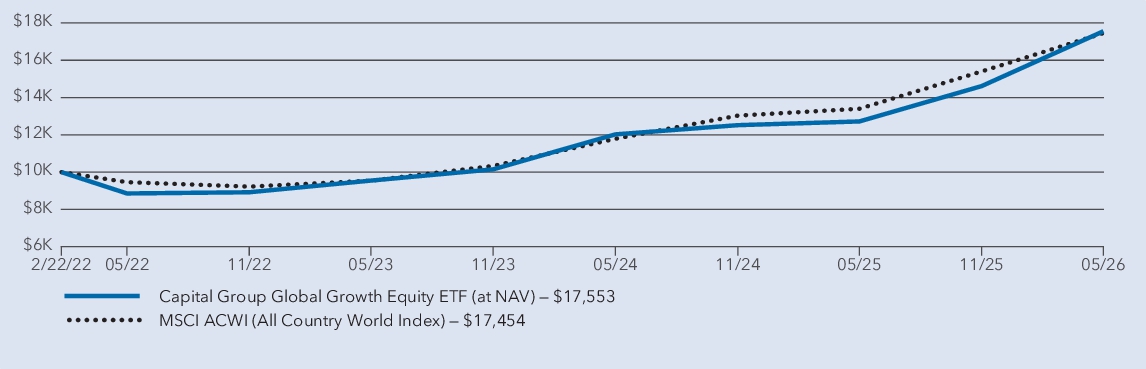
Average annual total returns
1 year | Since inception 1 | |
| Capital Group Global Growth Equity ETF (at NAV) 2 | 38.02 % | 14.09 % |
| MSCI ACWI (All Country World Index) 3 | 30.27 % | 13.94 % |
1
The fund began investment operations on February 22, 2022.2
Investment results assume all distributions are reinvested and reflect applicable fees and expenses. When applicable, results reflect fee waivers and/or expense reimbursements, without which they would have been lower.3
Results assume all distributions are reinvested. Any market index shown is unmanaged, and therefore, has no expenses. Investors cannot invest directly in an index. Source(s): MSCI.Key fund statistics
| Fund net assets (in millions) | $ 11,366 |
| Total number of portfolio holdings | 107 |
| Total advisory fees paid (in millions) | $ 38 |
| Portfolio turnover r a te | 42 % |
Portfolio holdings by sector
(percent of net assets)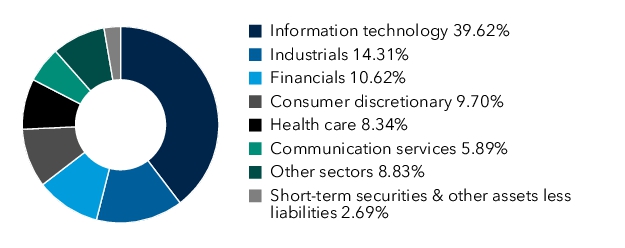
Changes in and disagreements with accountants
On
July 3, 2025
, PricewaterhouseCoopers LLP (“PwC”) was dismi
ssed and Del
oitte & Touche LLP was appointed as the fun
d’s independent registered public accounting firm for the fiscal year ending May 31, 2026 audit. The change in the fund’s independent registered public accounting firm was approved by the fund’s board of trustees, including a majority of the independent trustees, upon recommendation of the audit committee, as part of a broader effort to update board oversight and fund operations. At no point during the fund’s fiscal years ended May 31, 2024 and May 31, 2025 and the subsequent interim period through July 14, 2025, were there any disagreements between management and PwC on any matter of accounting principles or practices, financial statement disclosure or auditing scope or procedure.