July 30, 2026 Earnings Conference Call Second Quarter 2026
2 Cautionary Statements Regarding Forward-Looking Information This presentation contains certain forward-looking statements within the meaning of federal securities laws that are subject to risks and uncertainties. Words such as “could,” “may,” “expects,” “anticipates,” “will,” “targets,” “goals,” “projects,” “intends,” “plans,” “believes,” “seeks,” “estimates,” “predicts,” “should,” and variations on such words, and similar expressions that reflect our current views with respect to future events and operational, economic, and financial performance, are intended to identify such forward-looking statements. Accordingly, any such statements are qualified in their entirety by reference to, and are accompanied by, the following important factors that may cause our actual results or outcomes to differ materially from those contained in our forward-looking statements, including, but not limited to: unfavorable legislative and/or regulatory actions; uncertainty as to outcomes and timing of regulatory approval proceedings and/or negotiated settlements thereof; environmental liabilities and remediation costs; state and federal legislation requiring use of low- emission, renewable, and/or alternate fuel sources and/or mandating implementation of energy conservation programs requiring implementation of new technologies; challenges to tax positions taken, tax law changes, and difficulty in quantifying potential tax effects of business decisions; negative outcomes in legal proceedings; physical security and cybersecurity risks; extreme weather events, natural disasters, operational accidents such as wildfires or natural gas explosions, war, acts and threats of terrorism, public health crises, epidemics, pandemics, or other significant events; disruptions or cost increases in the supply chain, including shortages in labor, materials or parts, or significant increases in relevant tariffs; lack of sufficient power generation resources to meet actual or forecasted demand or disruptions at generation facilities owned by third parties; emerging technologies that could affect or transform the energy industry; instability in capital and credit markets; a downgrade of any Registrant’s credit ratings or other failure to satisfy the credit standards in the Registrants’ agreements or regulatory financial requirements; significant economic downturns or increases in customer rates; impacts of climate change and weather on energy usage and maintenance and capital costs; and impairment of long-lived assets, goodwill, and other assets. New factors emerge from time to time, and it is impossible for us to predict all of such factors, nor can we assess the impact of each such factor on the business or the extent to which any factor, or combination of factors, may cause actual results to differ materially from those contained in any forward-looking statements. For more information, see those factors discussed in the 2025 Form 10-K filed by the Registrants, including in Part I, ITEM 1A. Risk Factors, and this Report including in Part II, ITEM 1A. Risk Factors, and in other reports filed by the Registrants from time to time with the SEC. Investors are cautioned not to place undue reliance on these forward-looking statements, which apply only as of the date of this presentation. None of the Registrants undertakes any obligation to publicly release any revision to its forward-looking statements to reflect events or circumstances after the date of this presentation.
3 Non-GAAP Financial Measures Exelon reports its financial results in accordance with accounting principles generally accepted in the United States (GAAP). Exelon supplements the reporting of financial information determined in accordance with GAAP with certain non-GAAP financial measures, including: • Adjusted operating earnings (operating EPS) excludes certain costs, expenses, gains, and losses and other specified items that are considered by management to be not directly related to the ongoing operations of the business as described in Reconciliation of Non-GAAP Measures. • Adjusted operating and maintenance (O&M) expense excludes regulatory operating and maintenance costs for the utility businesses and certain excluded items. • Operating ROE is calculated using operating net income divided by average equity for the period. The operating income reflects all lines of business for the utility business (gas distribution, electric transmission, and electric distribution). • S&P FFO/Debt and Moody’s CFO (Pre-WC)/Debt are calculated using the respective S&P and Moody’s methodologies described in Reconciliation of Non-GAAP Measures. Due to the forward-looking nature of some forecasted non-GAAP measures, information to reconcile the forecasted adjusted (non-GAAP) measures to the most directly comparable GAAP measure may not be currently available, therefore, management is unable to reconcile these measures. This information is intended to enhance an investor’s overall understanding of period over period financial results and provide an indication of Exelon’s baseline operating performance by excluding items that are considered by management to be not directly related to the ongoing operations of the business. In addition, this information is among the primary indicators management uses as a basis for evaluating performance, allocating resources, setting incentive compensation targets, and planning and forecasting of future periods. These non-GAAP financial measures are not a presentation defined under GAAP and may not be comparable to other companies’ presentations. Exelon has provided these non- GAAP financial measures as supplemental information and in addition to the financial measures that are calculated and presented in accordance with GAAP. These non-GAAP measures should not be deemed more useful than, a substitute for, or an alternative to the most comparable GAAP measures provided in the materials presented. Non-GAAP financial measures are identified by the phrase “non-GAAP” or an asterisk (*). Reconciliations of these non-GAAP measures to the most comparable GAAP measures are provided in this presentation in Reconciliation of Non-GAAP Measures.
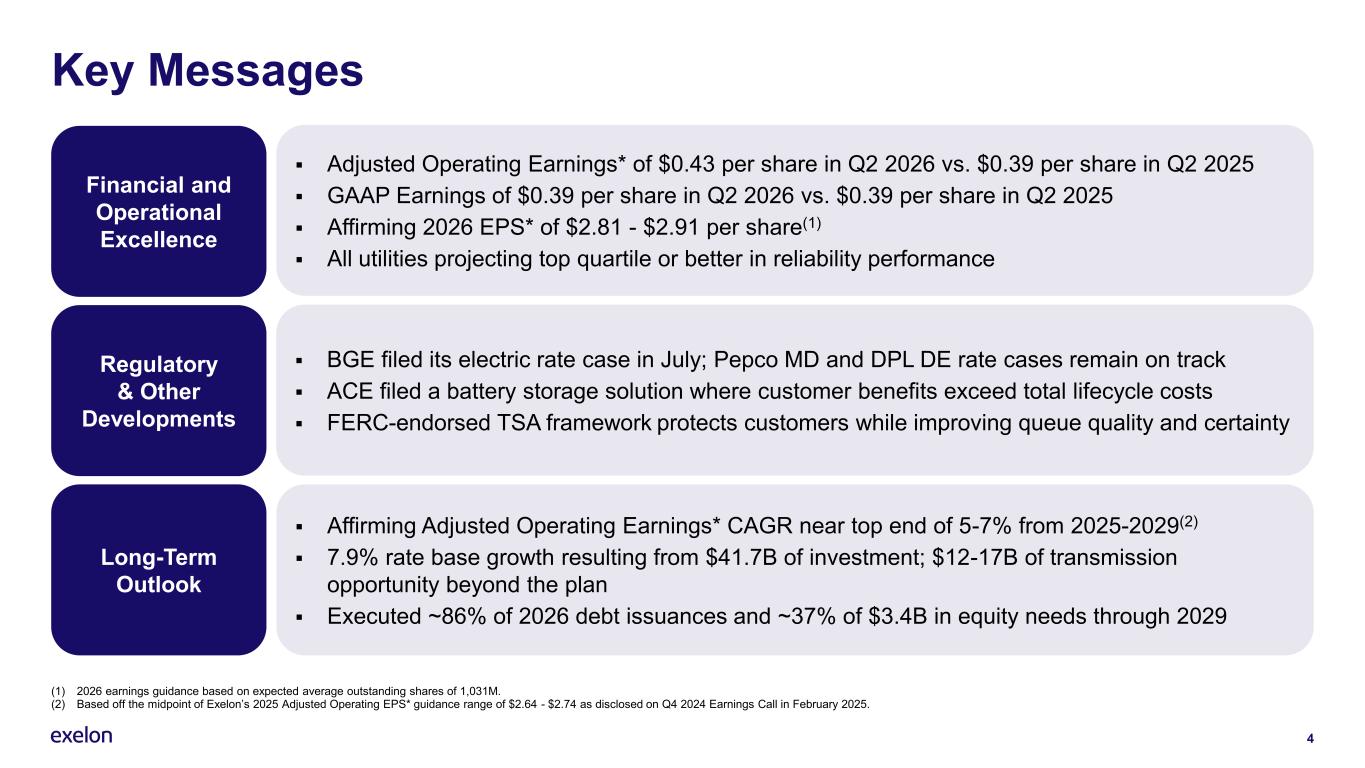
4 Key Messages Financial and Operational Excellence Regulatory & Other Developments Long-Term Outlook ▪ Adjusted Operating Earnings* of $0.43 per share in Q2 2026 vs. $0.39 per share in Q2 2025 ▪ GAAP Earnings of $0.39 per share in Q2 2026 vs. $0.39 per share in Q2 2025 ▪ Affirming 2026 EPS* of $2.81 - $2.91 per share(1) ▪ All utilities projecting top quartile or better in reliability performance ▪ BGE filed its electric rate case in July; Pepco MD and DPL DE rate cases remain on track ▪ ACE filed a battery storage solution where customer benefits exceed total lifecycle costs ▪ FERC-endorsed TSA framework protects customers while improving queue quality and certainty ▪ Affirming Adjusted Operating Earnings* CAGR near top end of 5-7% from 2025-2029(2) ▪ 7.9% rate base growth resulting from $41.7B of investment; $12-17B of transmission opportunity beyond the plan ▪ Executed ~86% of 2026 debt issuances and ~37% of $3.4B in equity needs through 2029 (1) 2026 earnings guidance based on expected average outstanding shares of 1,031M. (2) Based off the midpoint of Exelon’s 2025 Adjusted Operating EPS* guidance range of $2.64 - $2.74 as disclosed on Q4 2024 Earnings Call in February 2025.
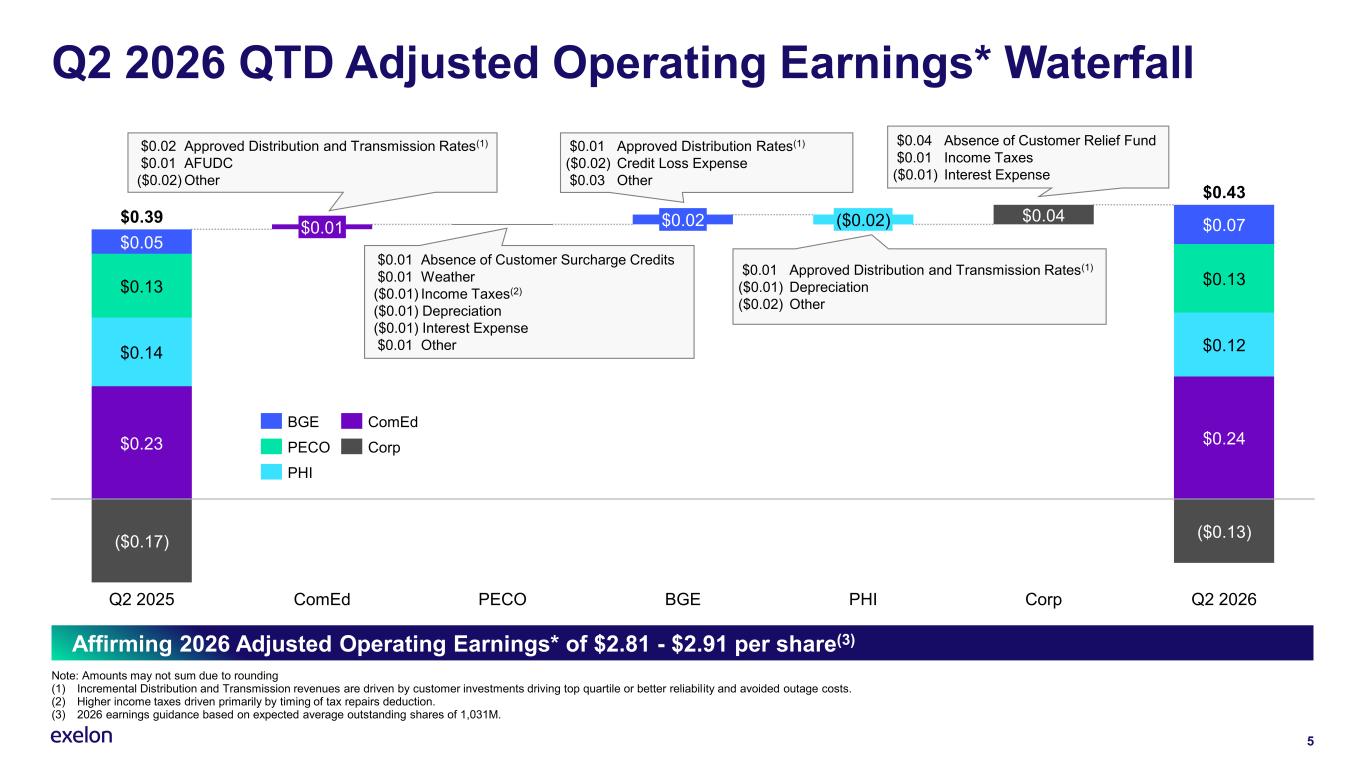
5 Q2 2026 QTD Adjusted Operating Earnings* Waterfall Note: Amounts may not sum due to rounding (1) Incremental Distribution and Transmission revenues are driven by customer investments driving top quartile or better reliability and avoided outage costs. (2) Higher income taxes driven primarily by timing of tax repairs deduction. (3) 2026 earnings guidance based on expected average outstanding shares of 1,031M. $0.23 $0.14 $0.04 $0.13 $0.05 ($0.17) ($0.13) Q2 2025 $0.01 ComEd PECO $0.02 BGE ($0.02) PHI Corp $0.07 $0.13 $0.12 $0.24 Q2 2026 $0.39 $0.43 BGE PECO PHI ComEd Corp $0.04 Absence of Customer Relief Fund $0.01 Income Taxes ($0.01) Interest Expense $0.02 Approved Distribution and Transmission Rates(1) $0.01 AFUDC ($0.02) Other $0.01 Absence of Customer Surcharge Credits $0.01 Weather ($0.01) Income Taxes(2) ($0.01) Depreciation ($0.01) Interest Expense $0.01 Other $0.01 Approved Distribution Rates(1) ($0.02) Credit Loss Expense $0.03 Other $0.01 Approved Distribution and Transmission Rates(1) ($0.01) Depreciation ($0.02) Other Affirming 2026 Adjusted Operating Earnings* of $2.81 - $2.91 per share(3)
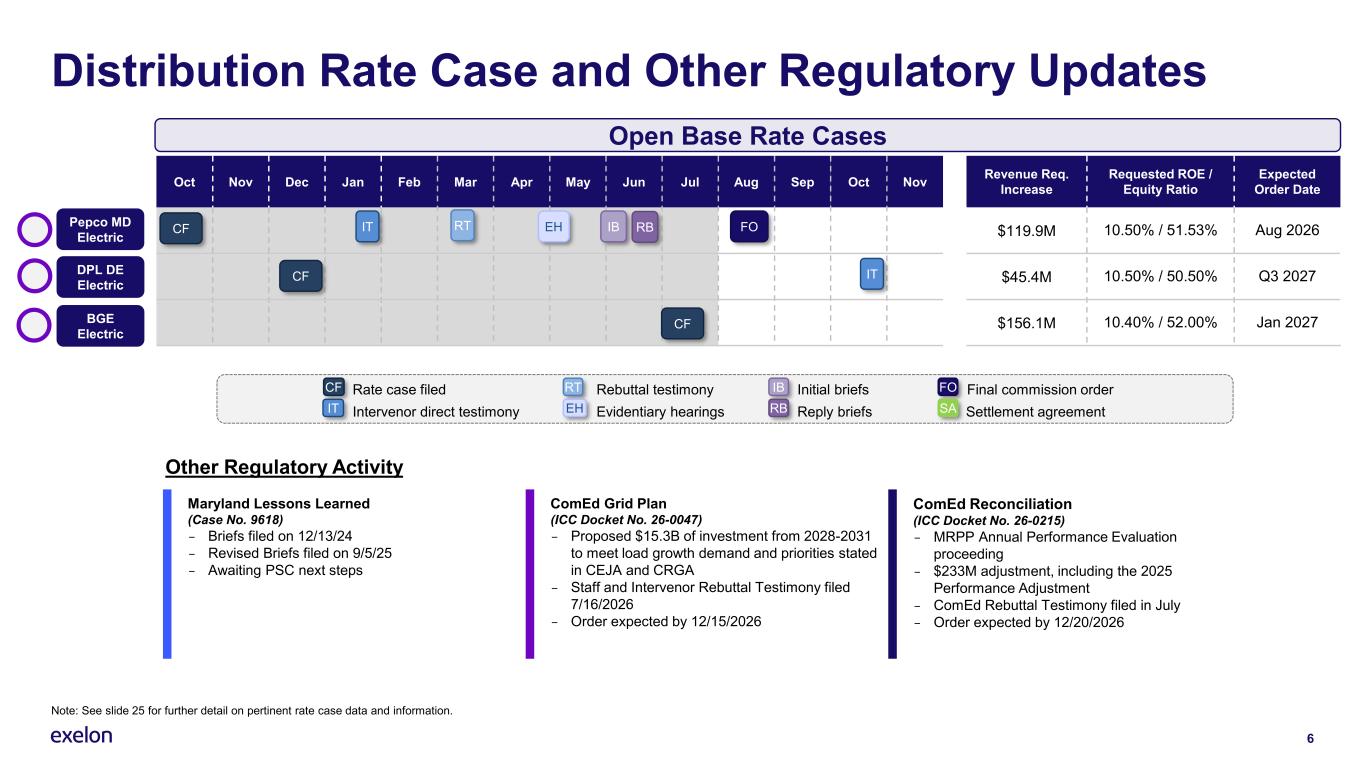
Distribution Rate Case and Other Regulatory Updates 6 Note: See slide 25 for further detail on pertinent rate case data and information. Rate case filed Rebuttal testimony Initial briefs Final commission order Intervenor direct testimony Evidentiary hearings Reply briefs Settlement agreement CF IT RT EH IB RB FO SA Oct Nov Dec Jan Feb Mar Apr May Jun Jul Aug Sep Oct Nov Revenue Req. Increase Requested ROE / Equity Ratio Expected Order Date $119.9M 10.50% / 51.53% Aug 2026 $45.4M 10.50% / 50.50% Q3 2027 $156.1M 10.40% / 52.00% Jan 2027 Pepco MD Electric DPL DE Electric CF Open Base Rate Cases IT RT EH FO CF IT IB RB BGE Electric Maryland Lessons Learned (Case No. 9618) – Briefs filed on 12/13/24 – Revised Briefs filed on 9/5/25 – Awaiting PSC next steps ComEd Grid Plan (ICC Docket No. 26-0047) – Proposed $15.3B of investment from 2028-2031 to meet load growth demand and priorities stated in CEJA and CRGA – Staff and Intervenor Rebuttal Testimony filed 7/16/2026 – Order expected by 12/15/2026 ComEd Reconciliation (ICC Docket No. 26-0215) – MRPP Annual Performance Evaluation proceeding – $233M adjustment, including the 2025 Performance Adjustment – ComEd Rebuttal Testimony filed in July – Order expected by 12/20/2026 Other Regulatory Activity CF
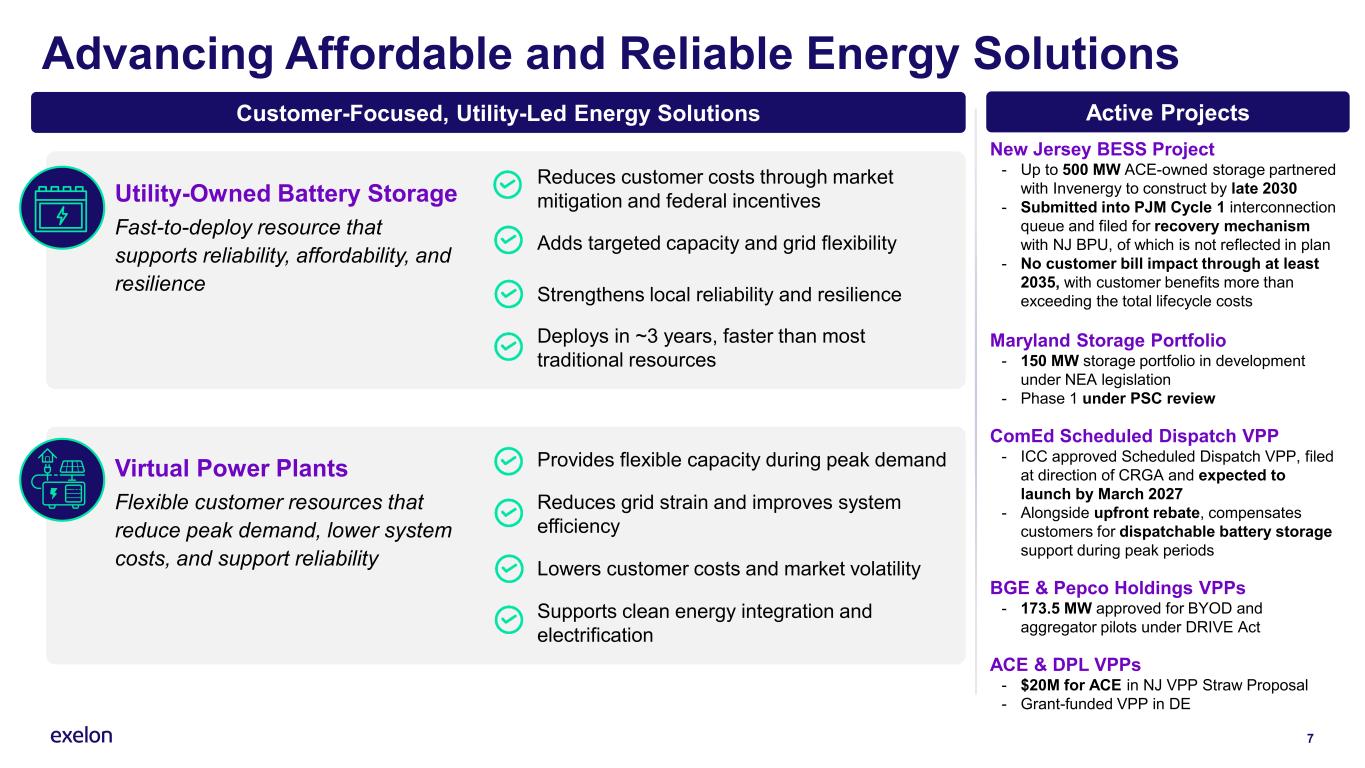
7 Advancing Affordable and Reliable Energy Solutions Utility-Owned Battery Storage Fast-to-deploy resource that supports reliability, affordability, and resilience Reduces customer costs through market mitigation and federal incentives Adds targeted capacity and grid flexibility Strengthens local reliability and resilience Deploys in ~3 years, faster than most traditional resources New Jersey BESS Project - Up to 500 MW ACE-owned storage partnered with Invenergy to construct by late 2030 - Submitted into PJM Cycle 1 interconnection queue and filed for recovery mechanism with NJ BPU, of which is not reflected in plan - No customer bill impact through at least 2035, with customer benefits more than exceeding the total lifecycle costs Maryland Storage Portfolio - 150 MW storage portfolio in development under NEA legislation - Phase 1 under PSC review ComEd Scheduled Dispatch VPP - ICC approved Scheduled Dispatch VPP, filed at direction of CRGA and expected to launch by March 2027 - Alongside upfront rebate, compensates customers for dispatchable battery storage support during peak periods BGE & Pepco Holdings VPPs - 173.5 MW approved for BYOD and aggregator pilots under DRIVE Act ACE & DPL VPPs - $20M for ACE in NJ VPP Straw Proposal - Grant-funded VPP in DE Customer-Focused, Utility-Led Energy Solutions Active Projects Provides flexible capacity during peak demand Reduces grid strain and improves system efficiency Lowers customer costs and market volatility Supports clean energy integration and electrification Virtual Power Plants Flexible customer resources that reduce peak demand, lower system costs, and support reliability
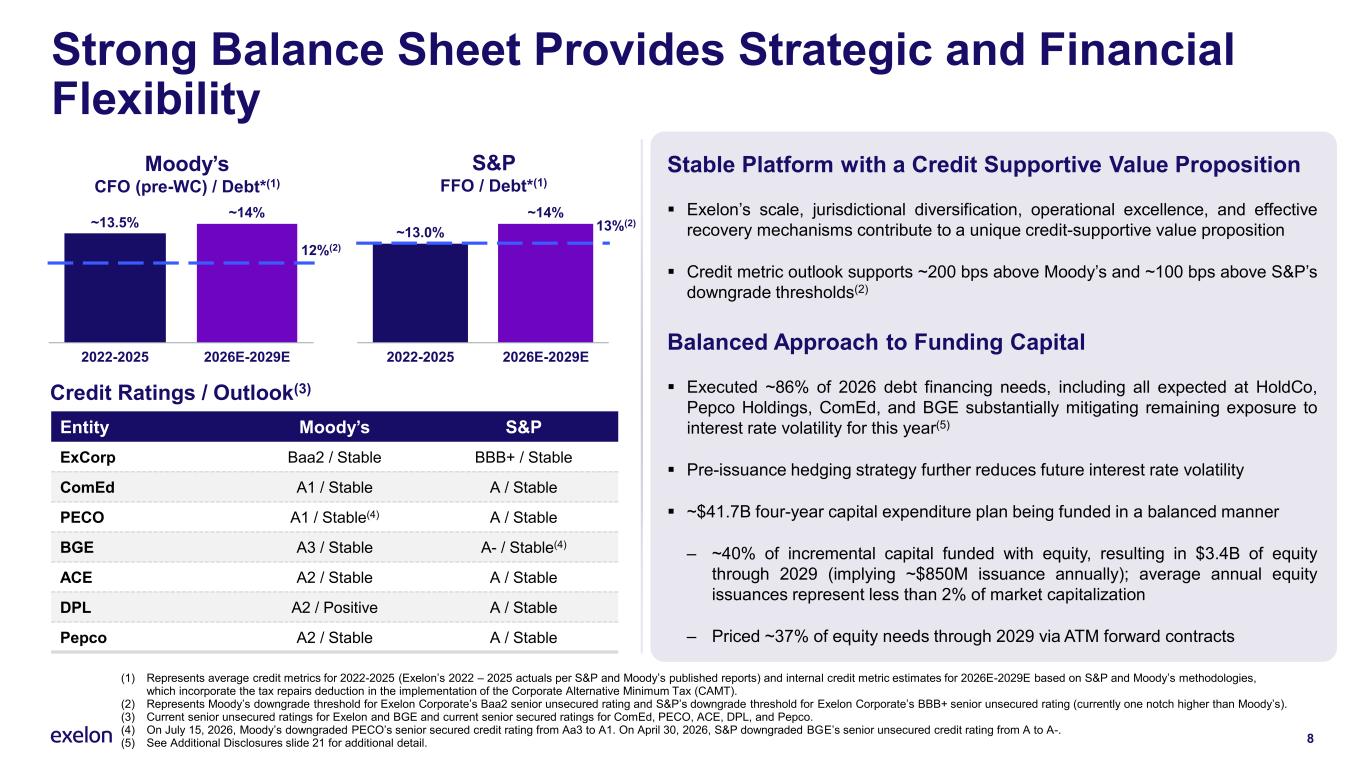
Strong Balance Sheet Provides Strategic and Financial Flexibility Entity Moody’s S&P ExCorp Baa2 / Stable BBB+ / Stable ComEd A1 / Stable A / Stable PECO A1 / Stable(4) A / Stable BGE A3 / Stable A- / Stable(4) ACE A2 / Stable A / Stable DPL A2 / Positive A / Stable Pepco A2 / Stable A / Stable 8 (1) Represents average credit metrics for 2022-2025 (Exelon’s 2022 – 2025 actuals per S&P and Moody’s published reports) and internal credit metric estimates for 2026E-2029E based on S&P and Moody’s methodologies, which incorporate the tax repairs deduction in the implementation of the Corporate Alternative Minimum Tax (CAMT). (2) Represents Moody’s downgrade threshold for Exelon Corporate’s Baa2 senior unsecured rating and S&P’s downgrade threshold for Exelon Corporate’s BBB+ senior unsecured rating (currently one notch higher than Moody’s). (3) Current senior unsecured ratings for Exelon and BGE and current senior secured ratings for ComEd, PECO, ACE, DPL, and Pepco. (4) On July 15, 2026, Moody’s downgraded PECO’s senior secured credit rating from Aa3 to A1. On April 30, 2026, S&P downgraded BGE’s senior unsecured credit rating from A to A-. (5) See Additional Disclosures slide 21 for additional detail. 2022-2025 2026E-2029E ~13.5% ~14% Credit Ratings / Outlook(3) 12%(2) 13%(2) Moody’s CFO (pre-WC) / Debt*(1) 2022-2025 2026E-2029E ~13.0% ~14% S&P FFO / Debt*(1) Stable Platform with a Credit Supportive Value Proposition ▪ Exelon’s scale, jurisdictional diversification, operational excellence, and effective recovery mechanisms contribute to a unique credit-supportive value proposition ▪ Credit metric outlook supports ~200 bps above Moody’s and ~100 bps above S&P’s downgrade thresholds(2) Balanced Approach to Funding Capital ▪ Executed ~86% of 2026 debt financing needs, including all expected at HoldCo, Pepco Holdings, ComEd, and BGE substantially mitigating remaining exposure to interest rate volatility for this year(5) ▪ Pre-issuance hedging strategy further reduces future interest rate volatility ▪ ~$41.7B four-year capital expenditure plan being funded in a balanced manner ‒ ~40% of incremental capital funded with equity, resulting in $3.4B of equity through 2029 (implying ~$850M issuance annually); average annual equity issuances represent less than 2% of market capitalization ‒ Priced ~37% of equity needs through 2029 via ATM forward contracts
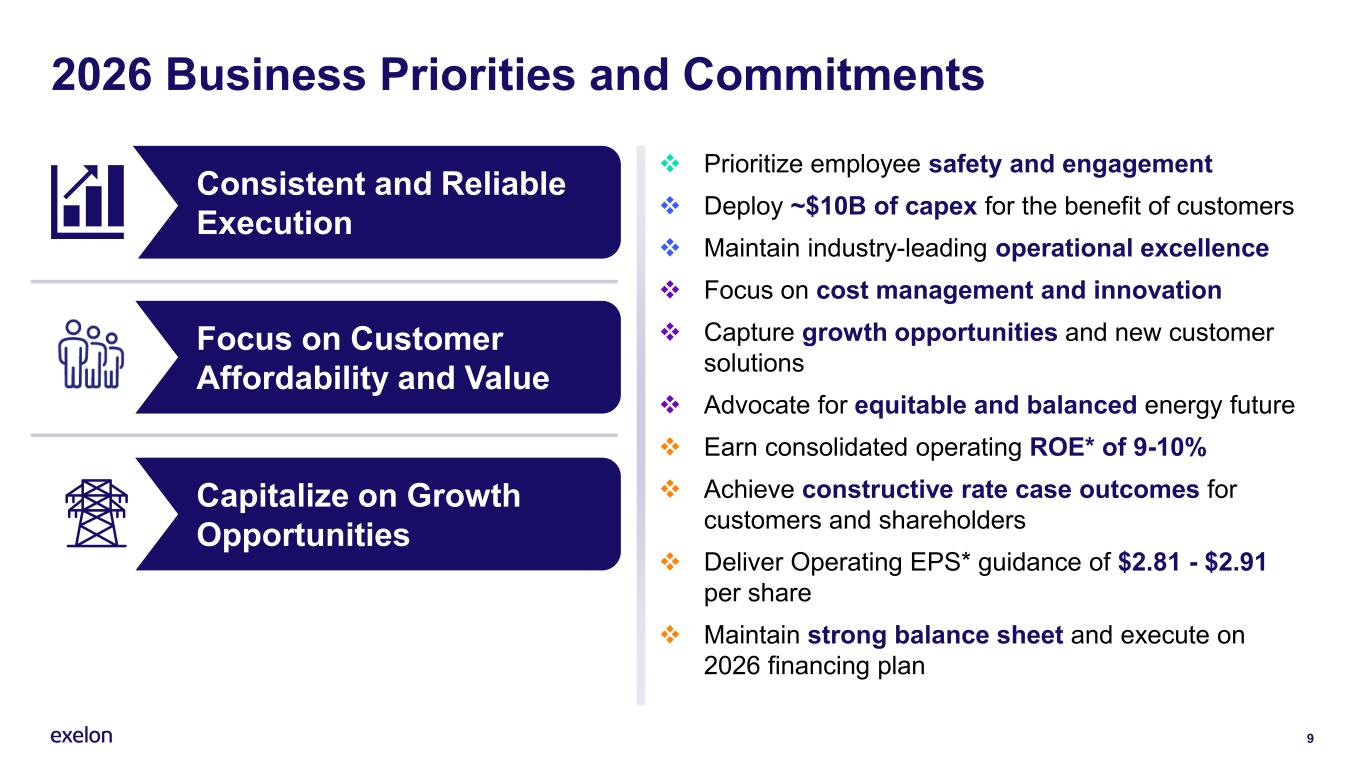
Capitalize on Growth Opportunities Focus on Customer Affordability and Value 9 2026 Business Priorities and Commitments ❖ Prioritize employee safety and engagement ❖ Deploy ~$10B of capex for the benefit of customers ❖ Maintain industry-leading operational excellence ❖ Focus on cost management and innovation ❖ Capture growth opportunities and new customer solutions ❖ Advocate for equitable and balanced energy future ❖ Earn consolidated operating ROE* of 9-10% ❖ Achieve constructive rate case outcomes for customers and shareholders ❖ Deliver Operating EPS* guidance of $2.81 - $2.91 per share ❖ Maintain strong balance sheet and execute on 2026 financing plan Execute Plan Consistent and Reliable Execution
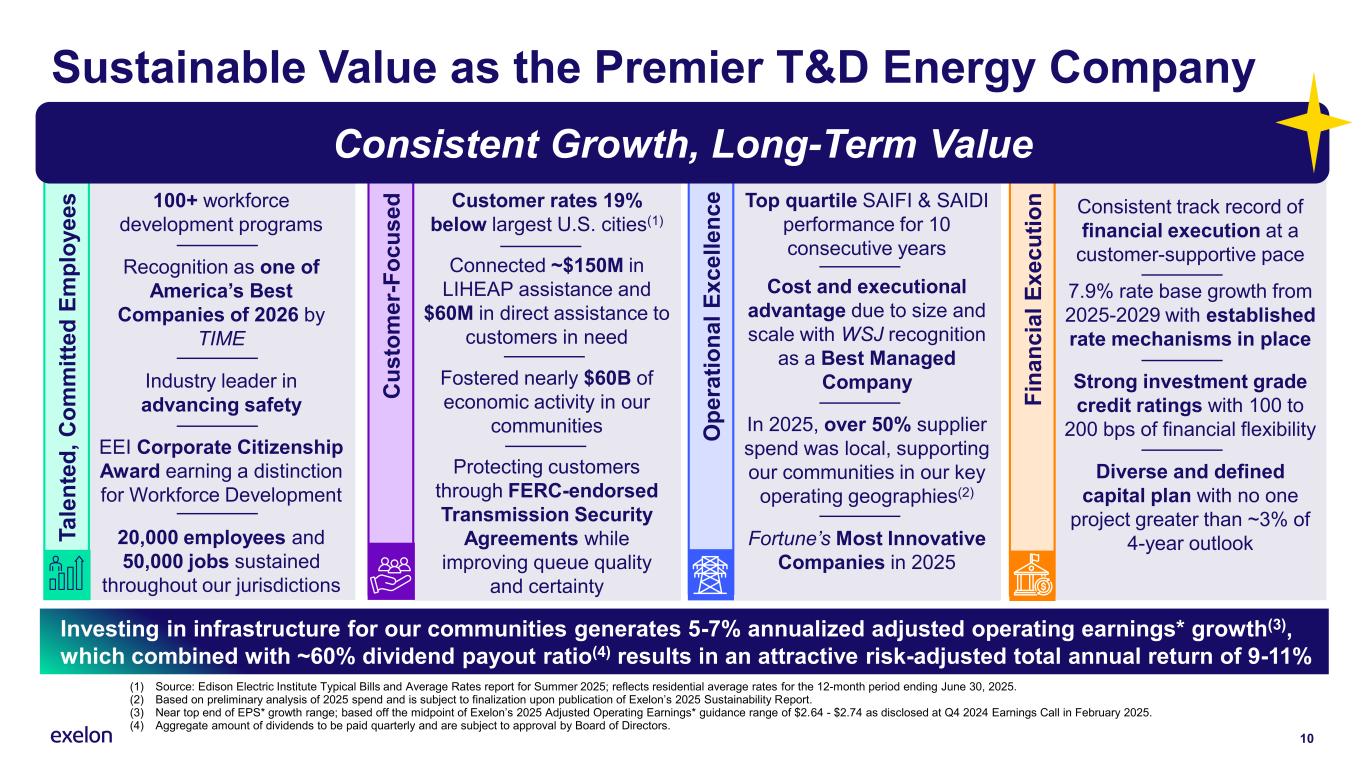
Customer rates 19% below largest U.S. cities(1) Connected ~$150M in LIHEAP assistance and $60M in direct assistance to customers in need Fostered nearly $60B of economic activity in our communities Protecting customers through FERC-endorsed Transmission Security Agreements while improving queue quality and certainty C u s to m e r- F o c u s e d Consistent track record of financial execution at a customer-supportive pace 7.9% rate base growth from 2025-2029 with established rate mechanisms in place Strong investment grade credit ratings with 100 to 200 bps of financial flexibility Diverse and defined capital plan with no one project greater than ~3% of 4-year outlook 10 Sustainable Value as the Premier T&D Energy Company (1) Source: Edison Electric Institute Typical Bills and Average Rates report for Summer 2025; reflects residential average rates for the 12-month period ending June 30, 2025. (2) Based on preliminary analysis of 2025 spend and is subject to finalization upon publication of Exelon’s 2025 Sustainability Report. (3) Near top end of EPS* growth range; based off the midpoint of Exelon’s 2025 Adjusted Operating Earnings* guidance range of $2.64 - $2.74 as disclosed at Q4 2024 Earnings Call in February 2025. (4) Aggregate amount of dividends to be paid quarterly and are subject to approval by Board of Directors. Investing in infrastructure for our communities generates 5-7% annualized adjusted operating earnings* growth(3), which combined with ~60% dividend payout ratio(4) results in an attractive risk-adjusted total annual return of 9-11% Top quartile SAIFI & SAIDI performance for 10 consecutive years Cost and executional advantage due to size and scale with WSJ recognition as a Best Managed Company In 2025, over 50% supplier spend was local, supporting our communities in our key operating geographies(2) Fortune’s Most Innovative Companies in 2025 100+ workforce development programs Recognition as one of America’s Best Companies of 2026 by TIME Industry leader in advancing safety EEI Corporate Citizenship Award earning a distinction for Workforce Development 20,000 employees and 50,000 jobs sustained throughout our jurisdictions F in a n c ia l E x e c u ti o n O p e ra ti o n a l E x c e ll e n c e T a le n te d , C o m m it te d E m p lo y e e s Consistent Growth, Long-Term Value

11 Additional Disclosures
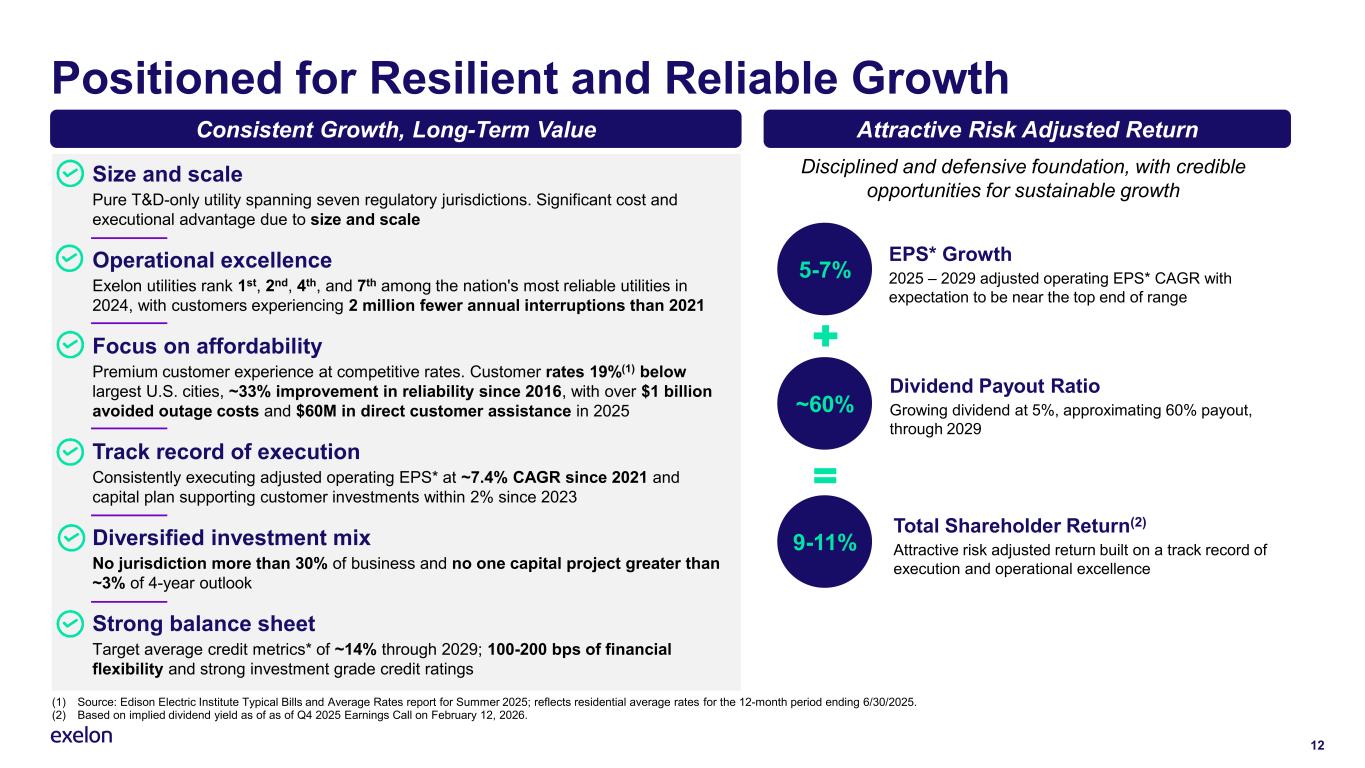
12 Positioned for Resilient and Reliable Growth (1) Source: Edison Electric Institute Typical Bills and Average Rates report for Summer 2025; reflects residential average rates for the 12-month period ending 6/30/2025. (2) Based on implied dividend yield as of as of Q4 2025 Earnings Call on February 12, 2026. Size and scale Pure T&D-only utility spanning seven regulatory jurisdictions. Significant cost and executional advantage due to size and scale Operational excellence Exelon utilities rank 1st, 2nd, 4th, and 7th among the nation's most reliable utilities in 2024, with customers experiencing 2 million fewer annual interruptions than 2021 Focus on affordability Premium customer experience at competitive rates. Customer rates 19%(1) below largest U.S. cities, ~33% improvement in reliability since 2016, with over $1 billion avoided outage costs and $60M in direct customer assistance in 2025 Track record of execution Consistently executing adjusted operating EPS* at ~7.4% CAGR since 2021 and capital plan supporting customer investments within 2% since 2023 Diversified investment mix No jurisdiction more than 30% of business and no one capital project greater than ~3% of 4-year outlook Strong balance sheet Target average credit metrics* of ~14% through 2029; 100-200 bps of financial flexibility and strong investment grade credit ratings Consistent Growth, Long-Term Value Attractive Risk Adjusted Return EPS* Growth 2025 – 2029 adjusted operating EPS* CAGR with expectation to be near the top end of range 5-7% ~60% 9-11% Dividend Payout Ratio Growing dividend at 5%, approximating 60% payout, through 2029 Total Shareholder Return(2) Attractive risk adjusted return built on a track record of execution and operational excellence Disciplined and defensive foundation, with credible opportunities for sustainable growth
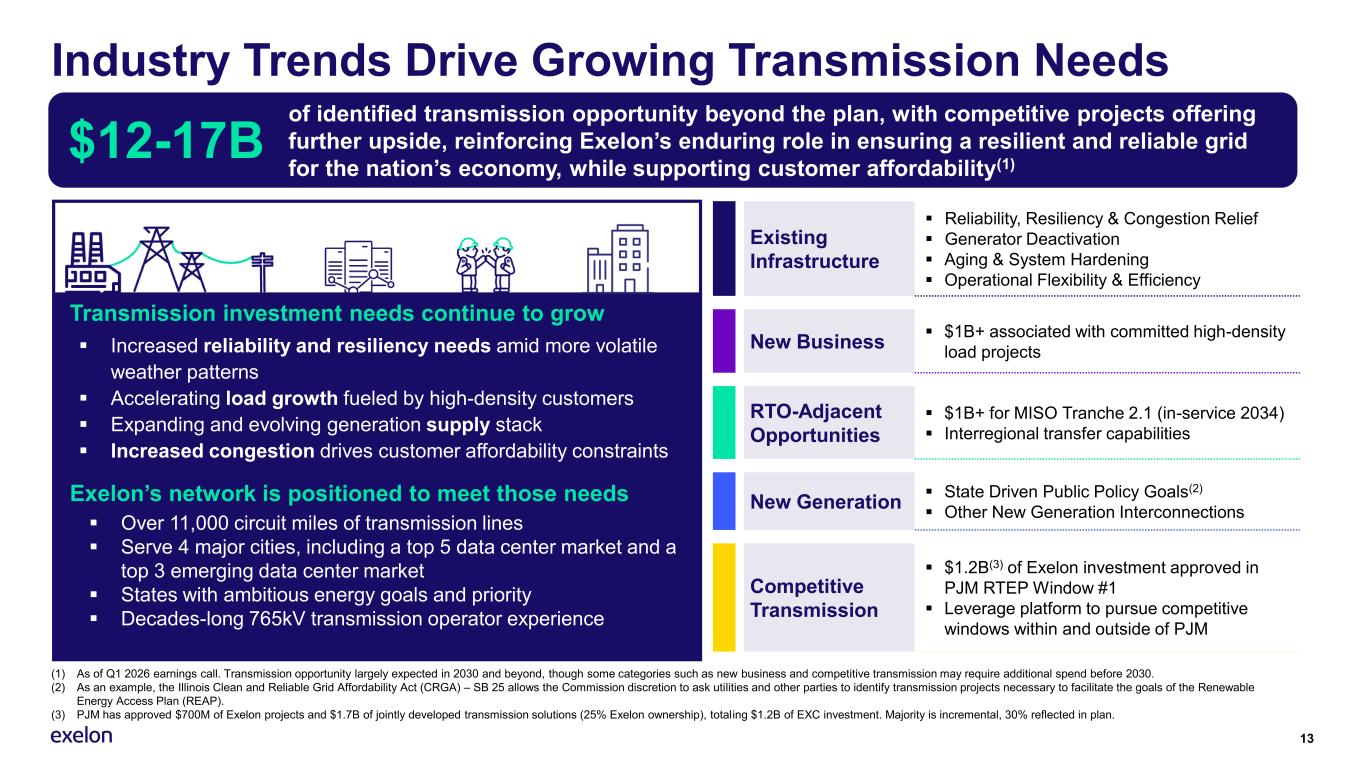
Industry Trends Drive Growing Transmission Needs 13 Existing Infrastructure ▪ Reliability, Resiliency & Congestion Relief ▪ Generator Deactivation ▪ Aging & System Hardening ▪ Operational Flexibility & Efficiency New Business ▪ $1B+ associated with committed high-density load projects RTO-Adjacent Opportunities ▪ $1B+ for MISO Tranche 2.1 (in-service 2034) ▪ Interregional transfer capabilities New Generation ▪ State Driven Public Policy Goals(2) ▪ Other New Generation Interconnections Competitive Transmission ▪ $1.2B(3) of Exelon investment approved in PJM RTEP Window #1 ▪ Leverage platform to pursue competitive windows within and outside of PJM Transmission investment needs continue to grow ▪ Increased reliability and resiliency needs amid more volatile weather patterns ▪ Accelerating load growth fueled by high-density customers ▪ Expanding and evolving generation supply stack ▪ Increased congestion drives customer affordability constraints of identified transmission opportunity beyond the plan, with competitive projects offering further upside, reinforcing Exelon’s enduring role in ensuring a resilient and reliable grid for the nation’s economy, while supporting customer affordability(1) $12-17B Exelon’s network is positioned to meet those needs ▪ Over 11,000 circuit miles of transmission lines ▪ Serve 4 major cities, including a top 5 data center market and a top 3 emerging data center market ▪ States with ambitious energy goals and priority ▪ Decades-long 765kV transmission operator experience (1) As of Q1 2026 earnings call. Transmission opportunity largely expected in 2030 and beyond, though some categories such as new business and competitive transmission may require additional spend before 2030. (2) As an example, the Illinois Clean and Reliable Grid Affordability Act (CRGA) – SB 25 allows the Commission discretion to ask utilities and other parties to identify transmission projects necessary to facilitate the goals of the Renewable Energy Access Plan (REAP). (3) PJM has approved $700M of Exelon projects and $1.7B of jointly developed transmission solutions (25% Exelon ownership), totaling $1.2B of EXC investment. Majority is incremental, 30% reflected in plan.
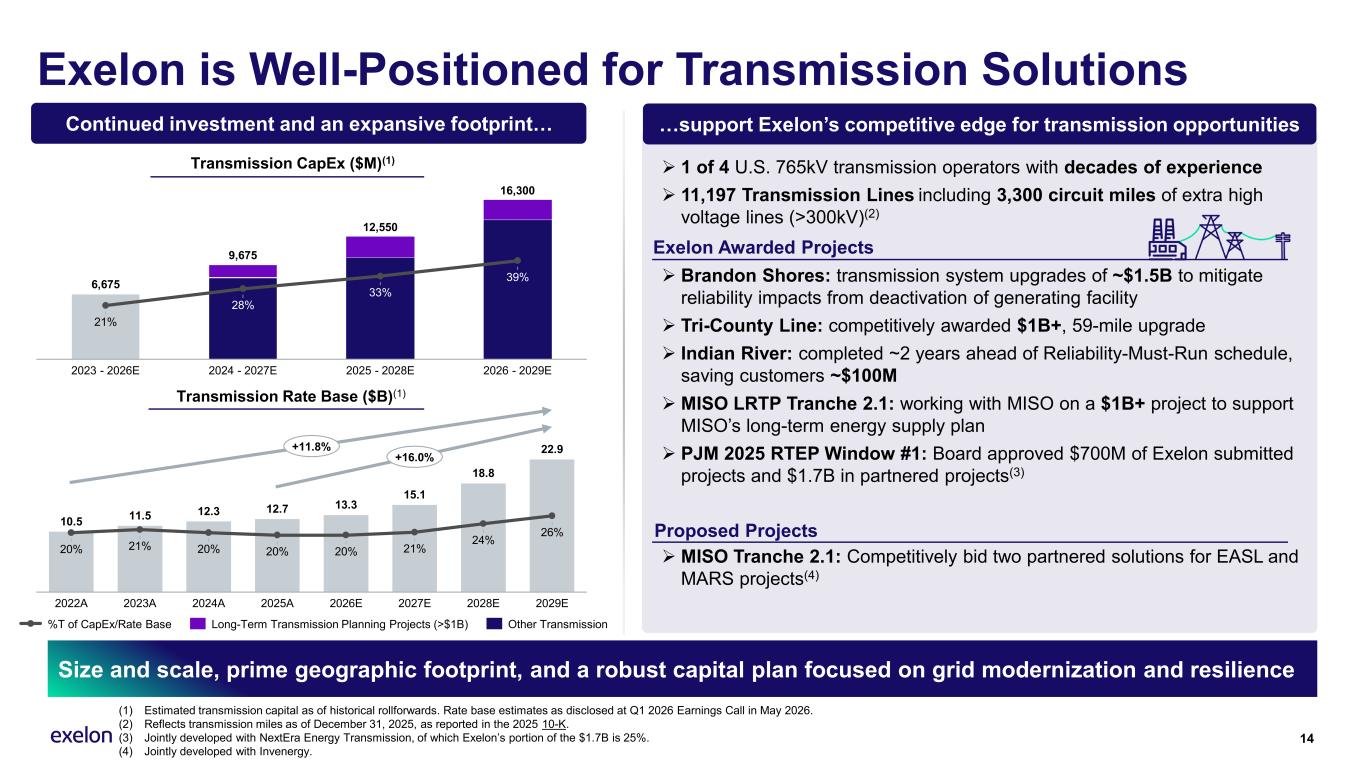
Exelon is Well-Positioned for Transmission Solutions 14 Size and scale, prime geographic footprint, and a robust capital plan focused on grid modernization and resilience (1) Estimated transmission capital as of historical rollforwards. Rate base estimates as disclosed at Q1 2026 Earnings Call in May 2026. (2) Reflects transmission miles as of December 31, 2025, as reported in the 2025 10-K. (3) Jointly developed with NextEra Energy Transmission, of which Exelon’s portion of the $1.7B is 25%. (4) Jointly developed with Invenergy. …support Exelon’s competitive edge for transmission opportunities ➢ 1 of 4 U.S. 765kV transmission operators with decades of experience ➢ 11,197 Transmission Lines including 3,300 circuit miles of extra high voltage lines (>300kV)(2) ➢ Brandon Shores: transmission system upgrades of ~$1.5B to mitigate reliability impacts from deactivation of generating facility ➢ Tri-County Line: competitively awarded $1B+, 59-mile upgrade ➢ Indian River: completed ~2 years ahead of Reliability-Must-Run schedule, saving customers ~$100M ➢ MISO LRTP Tranche 2.1: working with MISO on a $1B+ project to support MISO’s long-term energy supply plan ➢ PJM 2025 RTEP Window #1: Board approved $700M of Exelon submitted projects and $1.7B in partnered projects(3) ➢ MISO Tranche 2.1: Competitively bid two partnered solutions for EASL and MARS projects(4) 10.5 11.5 12.3 12.7 13.3 15.1 18.8 22.9 20% 2022A 21% 2023A 20% 2024A 20% 2025A 20% 2026E 21% 2027E 24% 2028E 26% 2029E +11.8% +16.0% Transmission CapEx ($M)(1) Transmission Rate Base ($B)(1) 6,675 21% 2023 - 2026E 28% 2024 - 2027E 33% 2025 - 2028E 39% 2026 - 2029E 9,675 12,550 16,300 %T of CapEx/Rate Base Long-Term Transmission Planning Projects (>$1B) Other Transmission Continued investment and an expansive footprint… Proposed Projects Exelon Awarded Projects
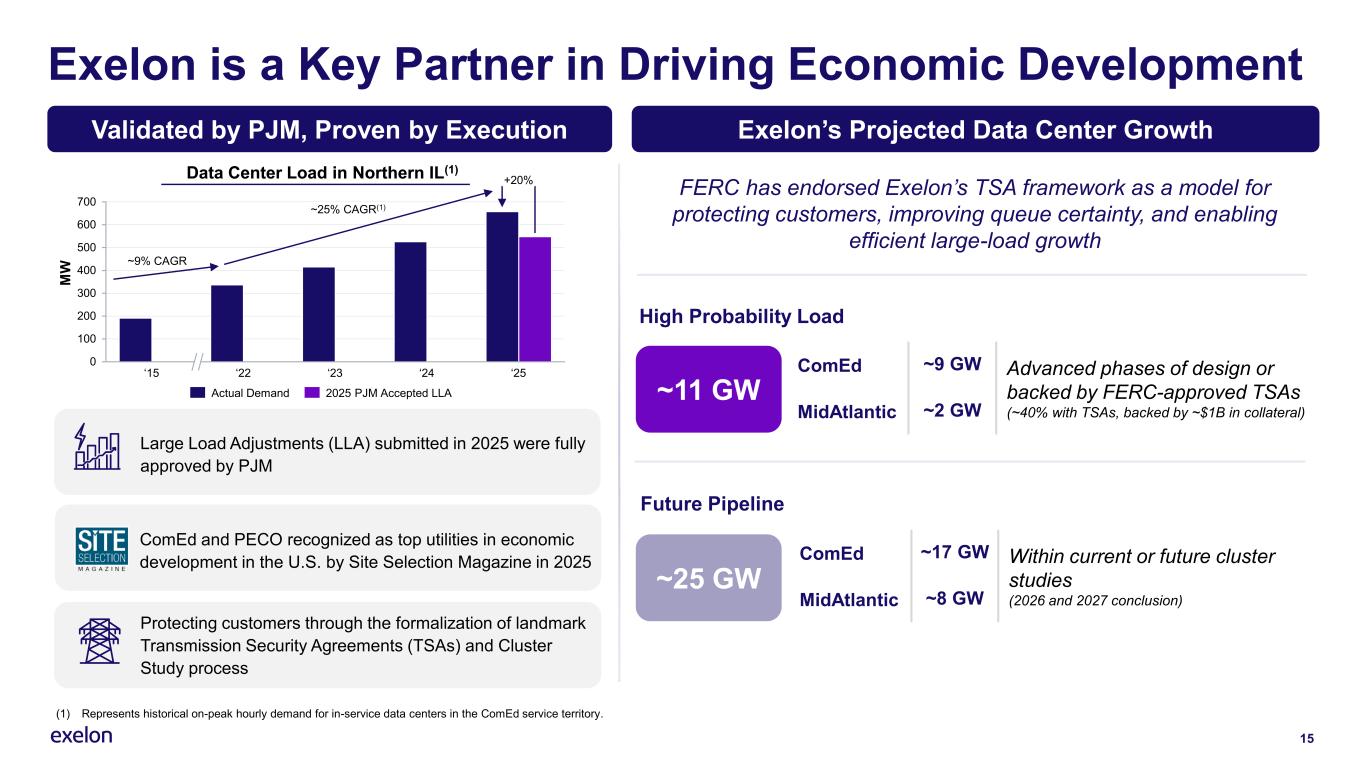
FERC has endorsed Exelon’s TSA framework as a model for protecting customers, improving queue certainty, and enabling efficient large-load growth 15 Exelon is a Key Partner in Driving Economic Development (1) Represents historical on-peak hourly demand for in-service data centers in the ComEd service territory. Validated by PJM, Proven by Execution Exelon’s Projected Data Center Growth ComEd ~9 GW Advanced phases of design or backed by FERC-approved TSAs (~40% with TSAs, backed by ~$1B in collateral)MidAtlantic ~2 GW ~11 GW High Probability Load ComEd ~17 GW Within current or future cluster studies (2026 and 2027 conclusion)MidAtlantic ~8 GW Future Pipeline ~25 GW Large Load Adjustments (LLA) submitted in 2025 were fully approved by PJM ComEd and PECO recognized as top utilities in economic development in the U.S. by Site Selection Magazine in 2025 Protecting customers through the formalization of landmark Transmission Security Agreements (TSAs) and Cluster Study process Data Center Load in Northern IL(1) 0 100 200 300 400 500 600 700 ‘15 ‘22 ‘23 ‘24 ‘25 +20% ~25% CAGR(1) M W ~9% CAGR Actual Demand 2025 PJM Accepted LLA
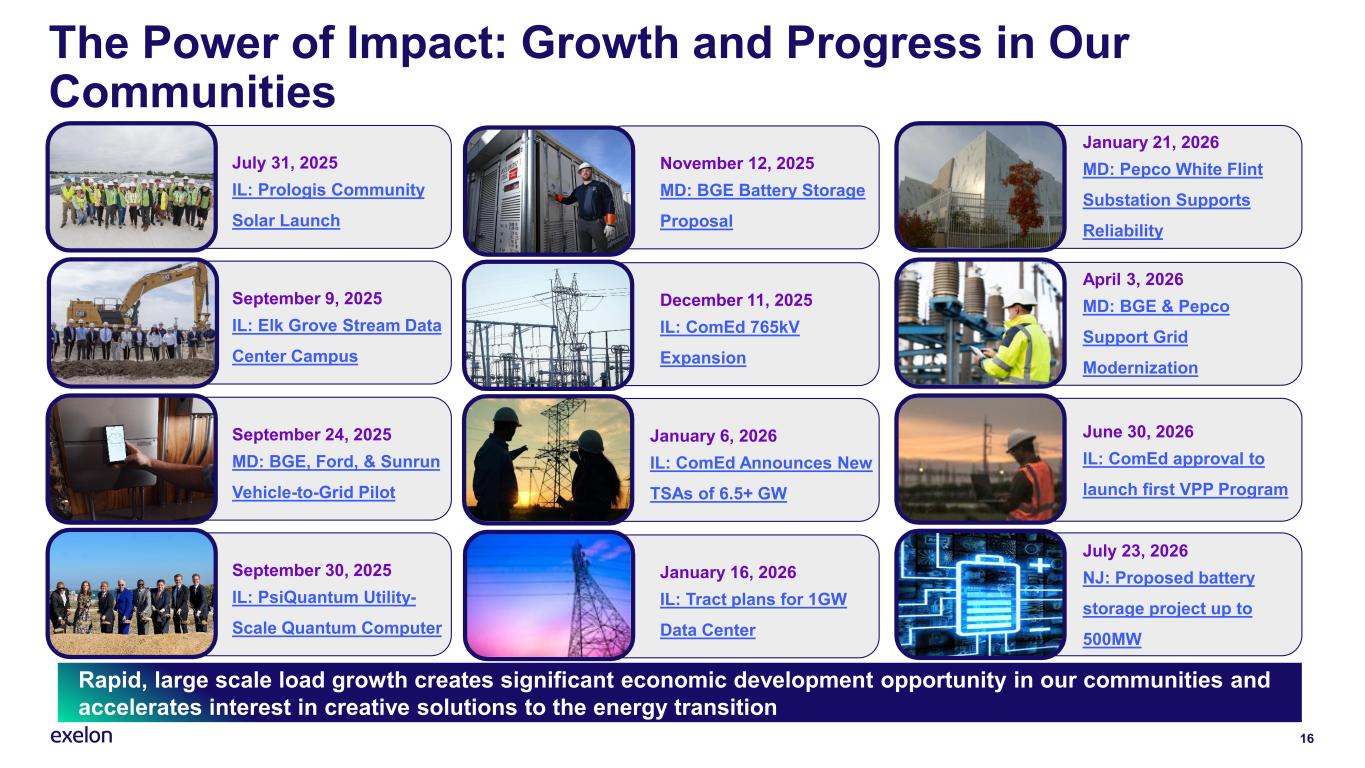
16 Rapid, large scale load growth creates significant economic development opportunity in our communities and accelerates interest in creative solutions to the energy transition The Power of Impact: Growth and Progress in Our Communities July 31, 2025 IL: Prologis Community Solar Launch November 12, 2025 MD: BGE Battery Storage Proposal September 9, 2025 IL: Elk Grove Stream Data Center Campus December 11, 2025 IL: ComEd 765kV Expansion January 21, 2026 MD: Pepco White Flint Substation Supports Reliability September 24, 2025 MD: BGE, Ford, & Sunrun Vehicle-to-Grid Pilot April 3, 2026 MD: BGE & Pepco Support Grid Modernization January 6, 2026 IL: ComEd Announces New TSAs of 6.5+ GW June 30, 2026 IL: ComEd approval to launch first VPP Program September 30, 2025 IL: PsiQuantum Utility- Scale Quantum Computer January 16, 2026 IL: Tract plans for 1GW Data Center July 23, 2026 NJ: Proposed battery storage project up to 500MW
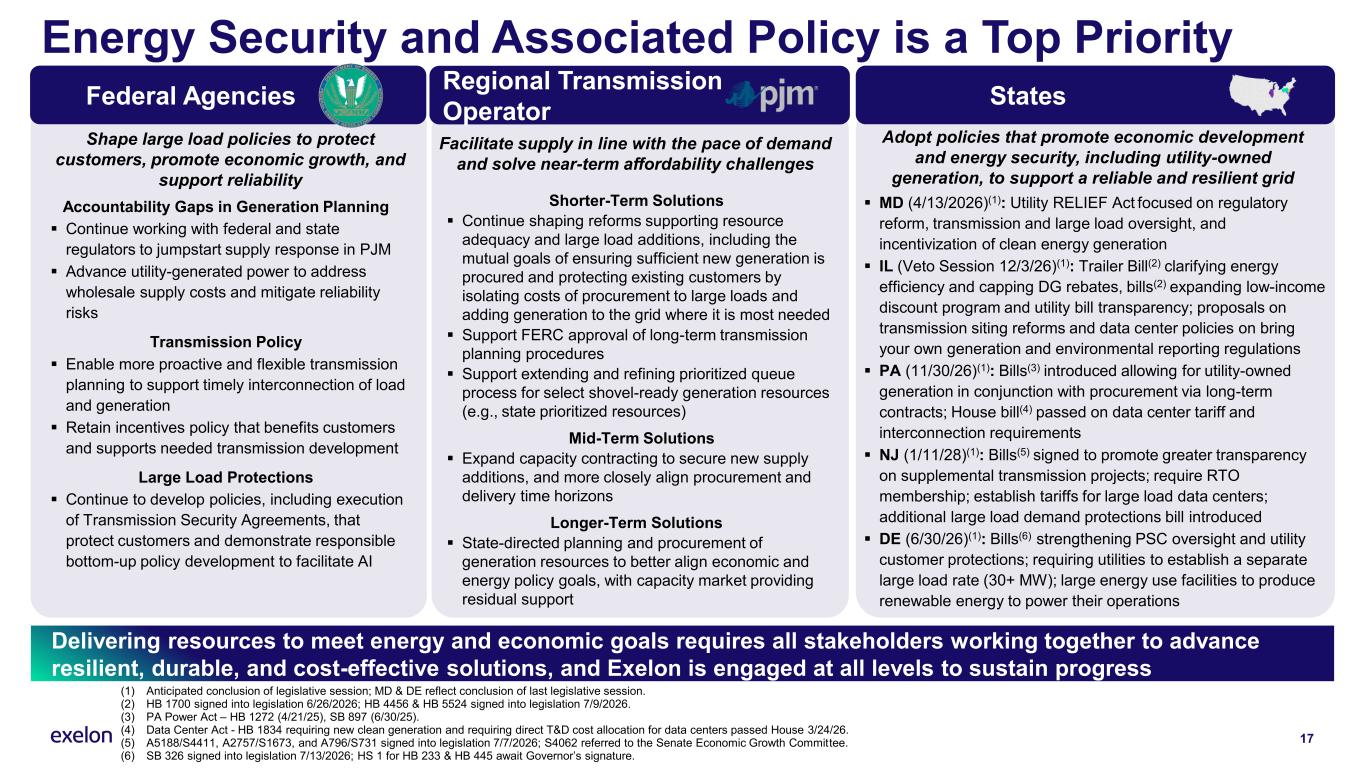
Energy Security and Associated Policy is a Top Priority Delivering resources to meet energy and economic goals requires all stakeholders working together to advance resilient, durable, and cost-effective solutions, and Exelon is engaged at all levels to sustain progress 17 StatesFederal Agencies Regional Transmission Operator (1) Anticipated conclusion of legislative session; MD & DE reflect conclusion of last legislative session. (2) HB 1700 signed into legislation 6/26/2026; HB 4456 & HB 5524 signed into legislation 7/9/2026. (3) PA Power Act – HB 1272 (4/21/25), SB 897 (6/30/25). (4) Data Center Act - HB 1834 requiring new clean generation and requiring direct T&D cost allocation for data centers passed House 3/24/26. (5) A5188/S4411, A2757/S1673, and A796/S731 signed into legislation 7/7/2026; S4062 referred to the Senate Economic Growth Committee. (6) SB 326 signed into legislation 7/13/2026; HS 1 for HB 233 & HB 445 await Governor’s signature. ▪ MD (4/13/2026)(1): Utility RELIEF Act focused on regulatory reform, transmission and large load oversight, and incentivization of clean energy generation ▪ IL (Veto Session 12/3/26)(1): Trailer Bill(2) clarifying energy efficiency and capping DG rebates, bills(2) expanding low-income discount program and utility bill transparency; proposals on transmission siting reforms and data center policies on bring your own generation and environmental reporting regulations ▪ PA (11/30/26)(1): Bills(3) introduced allowing for utility-owned generation in conjunction with procurement via long-term contracts; House bill(4) passed on data center tariff and interconnection requirements ▪ NJ (1/11/28)(1): Bills(5) signed to promote greater transparency on supplemental transmission projects; require RTO membership; establish tariffs for large load data centers; additional large load demand protections bill introduced ▪ DE (6/30/26)(1): Bills(6) strengthening PSC oversight and utility customer protections; requiring utilities to establish a separate large load rate (30+ MW); large energy use facilities to produce renewable energy to power their operations Adopt policies that promote economic development and energy security, including utility-owned generation, to support a reliable and resilient grid Shorter-Term Solutions ▪ Continue shaping reforms supporting resource adequacy and large load additions, including the mutual goals of ensuring sufficient new generation is procured and protecting existing customers by isolating costs of procurement to large loads and adding generation to the grid where it is most needed ▪ Support FERC approval of long-term transmission planning procedures ▪ Support extending and refining prioritized queue process for select shovel-ready generation resources (e.g., state prioritized resources) Mid-Term Solutions ▪ Expand capacity contracting to secure new supply additions, and more closely align procurement and delivery time horizons Longer-Term Solutions ▪ State-directed planning and procurement of generation resources to better align economic and energy policy goals, with capacity market providing residual support Facilitate supply in line with the pace of demand and solve near-term affordability challenges Shape large load policies to protect customers, promote economic growth, and support reliability Accountability Gaps in Generation Planning ▪ Continue working with federal and state regulators to jumpstart supply response in PJM ▪ Advance utility-generated power to address wholesale supply costs and mitigate reliability risks Transmission Policy ▪ Enable more proactive and flexible transmission planning to support timely interconnection of load and generation ▪ Retain incentives policy that benefits customers and supports needed transmission development Large Load Protections ▪ Continue to develop policies, including execution of Transmission Security Agreements, that protect customers and demonstrate responsible bottom-up policy development to facilitate AI
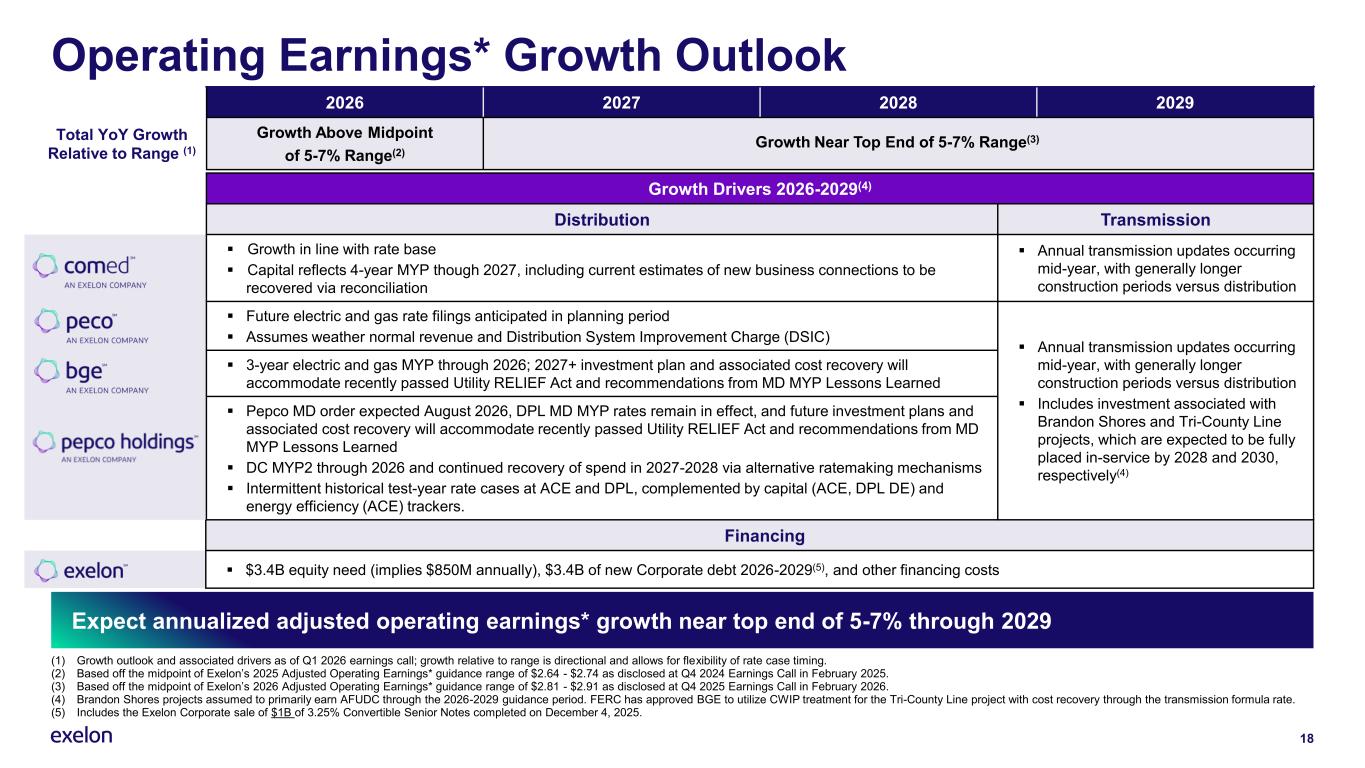
Financing ▪ $3.4B equity need (implies $850M annually), $3.4B of new Corporate debt 2026-2029(5), and other financing costs Operating Earnings* Growth Outlook 2026 2027 2028 2029 Total YoY Growth Relative to Range (1) Growth Above Midpoint of 5-7% Range(2) (1) Growth outlook and associated drivers as of Q1 2026 earnings call; growth relative to range is directional and allows for flexibility of rate case timing. (2) Based off the midpoint of Exelon’s 2025 Adjusted Operating Earnings* guidance range of $2.64 - $2.74 as disclosed at Q4 2024 Earnings Call in February 2025. (3) Based off the midpoint of Exelon’s 2026 Adjusted Operating Earnings* guidance range of $2.81 - $2.91 as disclosed at Q4 2025 Earnings Call in February 2026. (4) Brandon Shores projects assumed to primarily earn AFUDC through the 2026-2029 guidance period. FERC has approved BGE to utilize CWIP treatment for the Tri-County Line project with cost recovery through the transmission formula rate. (5) Includes the Exelon Corporate sale of $1B of 3.25% Convertible Senior Notes completed on December 4, 2025. Expect annualized adjusted operating earnings* growth near top end of 5-7% through 2029 18 Growth Drivers 2026-2029(4) Distribution Transmission ▪ Growth in line with rate base ▪ Capital reflects 4-year MYP though 2027, including current estimates of new business connections to be recovered via reconciliation ▪ Annual transmission updates occurring mid-year, with generally longer construction periods versus distribution ▪ Future electric and gas rate filings anticipated in planning period ▪ Assumes weather normal revenue and Distribution System Improvement Charge (DSIC) ▪ Annual transmission updates occurring mid-year, with generally longer construction periods versus distribution ▪ Includes investment associated with Brandon Shores and Tri-County Line projects, which are expected to be fully placed in-service by 2028 and 2030, respectively(4) ▪ 3-year electric and gas MYP through 2026; 2027+ investment plan and associated cost recovery will accommodate recently passed Utility RELIEF Act and recommendations from MD MYP Lessons Learned ▪ Pepco MD order expected August 2026, DPL MD MYP rates remain in effect, and future investment plans and associated cost recovery will accommodate recently passed Utility RELIEF Act and recommendations from MD MYP Lessons Learned ▪ DC MYP2 through 2026 and continued recovery of spend in 2027-2028 via alternative ratemaking mechanisms ▪ Intermittent historical test-year rate cases at ACE and DPL, complemented by capital (ACE, DPL DE) and energy efficiency (ACE) trackers. Growth Near Top End of 5-7% Range(3)
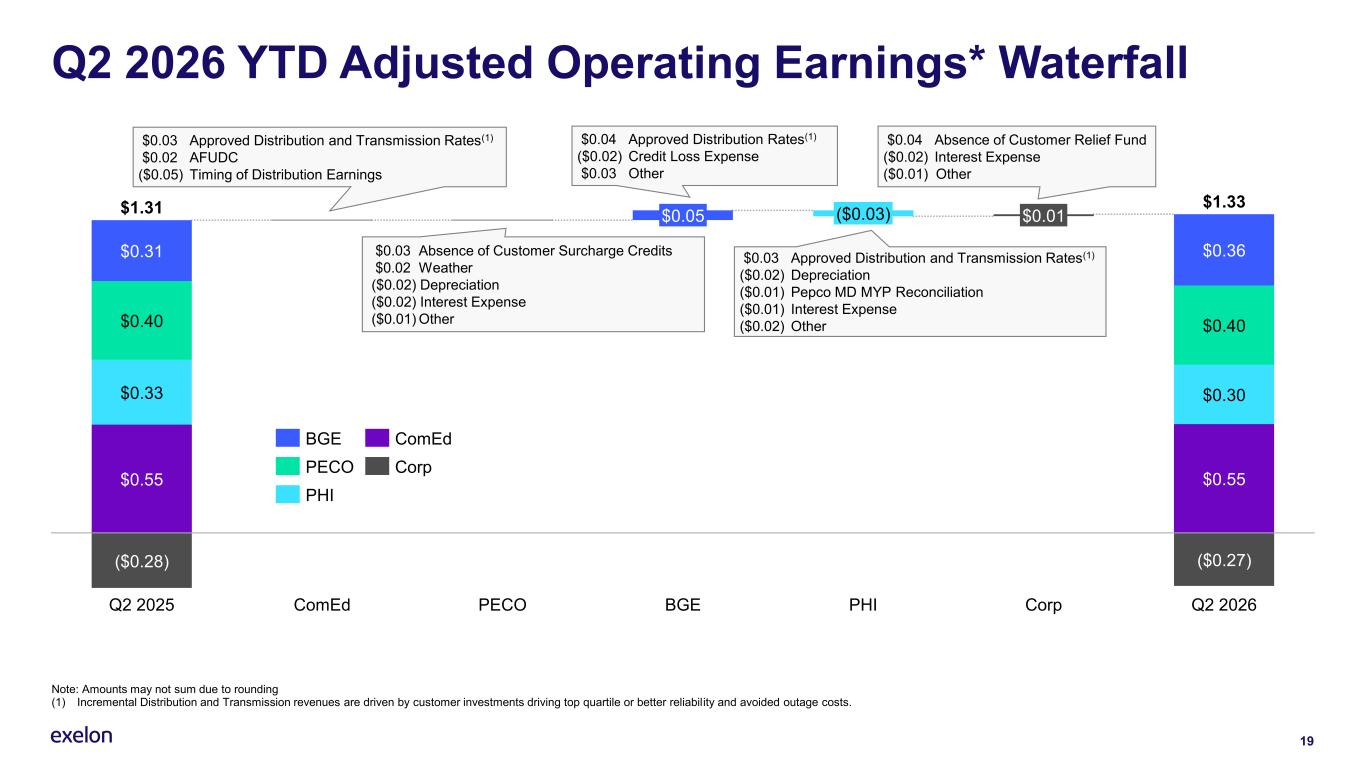
19 Q2 2026 YTD Adjusted Operating Earnings* Waterfall Note: Amounts may not sum due to rounding (1) Incremental Distribution and Transmission revenues are driven by customer investments driving top quartile or better reliability and avoided outage costs. ($0.28) ($0.27) $0.31 $0.40 $0.33 $0.55 Q2 2025 ComEd PECO $0.05 BGE ($0.03) PHI $0.01 Corp $0.36 $0.40 $0.30 $0.55 Q2 2026 $1.31 $1.33 BGE PECO PHI ComEd Corp $0.04 Absence of Customer Relief Fund ($0.02) Interest Expense ($0.01) Other $0.03 Approved Distribution and Transmission Rates(1) $0.02 AFUDC ($0.05) Timing of Distribution Earnings $0.03 Absence of Customer Surcharge Credits $0.02 Weather ($0.02) Depreciation ($0.02) Interest Expense ($0.01) Other $0.04 Approved Distribution Rates(1) ($0.02) Credit Loss Expense $0.03 Other $0.03 Approved Distribution and Transmission Rates(1) ($0.02) Depreciation ($0.01) Pepco MD MYP Reconciliation ($0.01) Interest Expense ($0.02) Other
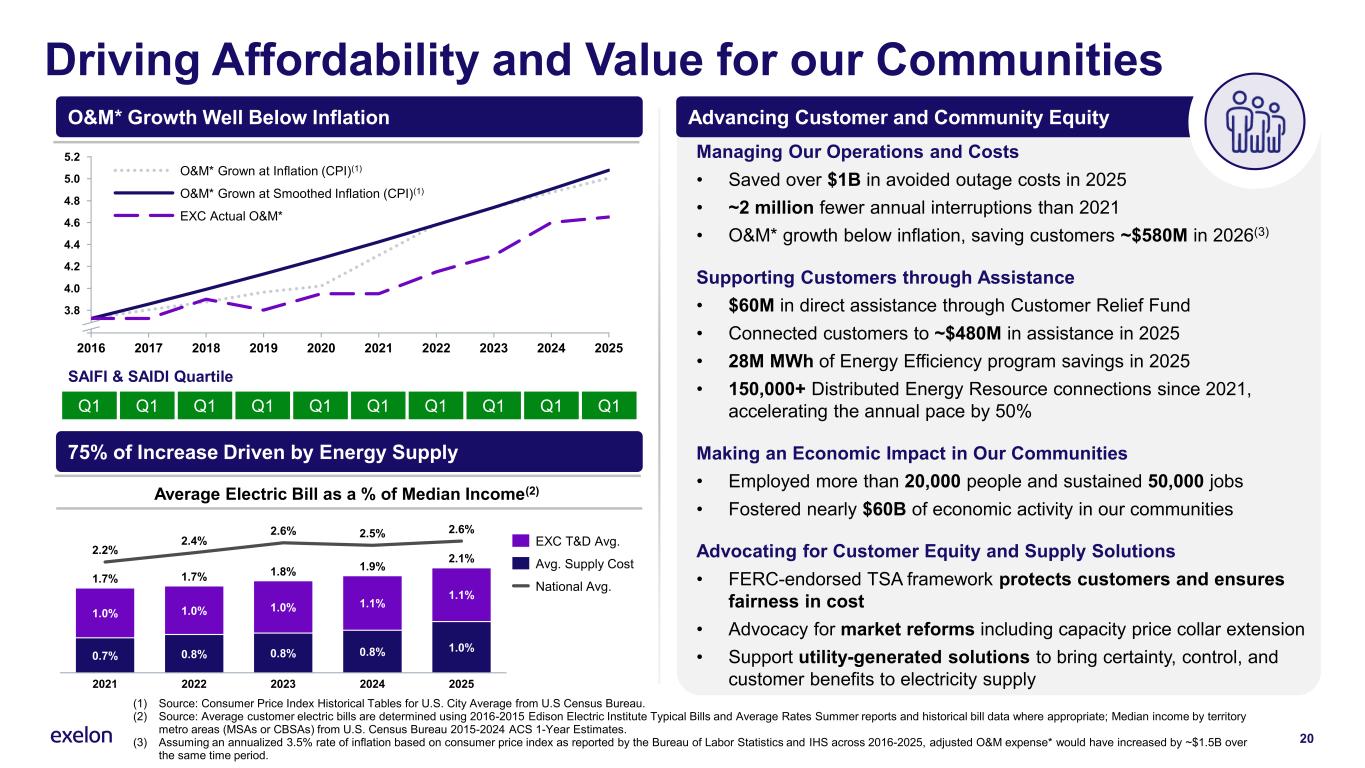
Managing Our Operations and Costs • Saved over $1B in avoided outage costs in 2025 • ~2 million fewer annual interruptions than 2021 • O&M* growth below inflation, saving customers ~$580M in 2026(3) Supporting Customers through Assistance • $60M in direct assistance through Customer Relief Fund • Connected customers to ~$480M in assistance in 2025 • 28M MWh of Energy Efficiency program savings in 2025 • 150,000+ Distributed Energy Resource connections since 2021, accelerating the annual pace by 50% Making an Economic Impact in Our Communities • Employed more than 20,000 people and sustained 50,000 jobs • Fostered nearly $60B of economic activity in our communities Advocating for Customer Equity and Supply Solutions • FERC-endorsed TSA framework protects customers and ensures fairness in cost • Advocacy for market reforms including capacity price collar extension • Support utility-generated solutions to bring certainty, control, and customer benefits to electricity supply 20 Driving Affordability and Value for our Communities (1) Source: Consumer Price Index Historical Tables for U.S. City Average from U.S Census Bureau. (2) Source: Average customer electric bills are determined using 2016-2015 Edison Electric Institute Typical Bills and Average Rates Summer reports and historical bill data where appropriate; Median income by territory metro areas (MSAs or CBSAs) from U.S. Census Bureau 2015-2024 ACS 1-Year Estimates. (3) Assuming an annualized 3.5% rate of inflation based on consumer price index as reported by the Bureau of Labor Statistics and IHS across 2016-2025, adjusted O&M expense* would have increased by ~$1.5B over the same time period. O&M* Growth Well Below Inflation Advancing Customer and Community Equity 75% of Increase Driven by Energy Supply 1.0% 0.7% 2.2% 2021 1.0% 0.8% 2.4% 2022 1.0% 0.8% 2.6% 2023 1.1% 0.8% 2.5% 2024 1.1% 1.0% 2.6% 2025 1.7% 1.7% 1.8% 1.9% 2.1% EXC T&D Avg. Avg. Supply Cost National Avg. 2016 2017 2018 2019 2020 2021 2022 2023 2024 2025 3.8 4.0 4.2 4.4 4.6 4.8 5.0 5.2 O&M* Grown at Inflation (CPI)(1) O&M* Grown at Smoothed Inflation (CPI)(1) EXC Actual O&M* Q1 Q1 Q1 Q1 Q1 Q1 Q1 Q1 Q1 Q1 SAIFI & SAIDI Quartile Average Electric Bill as a % of Median Income(2)
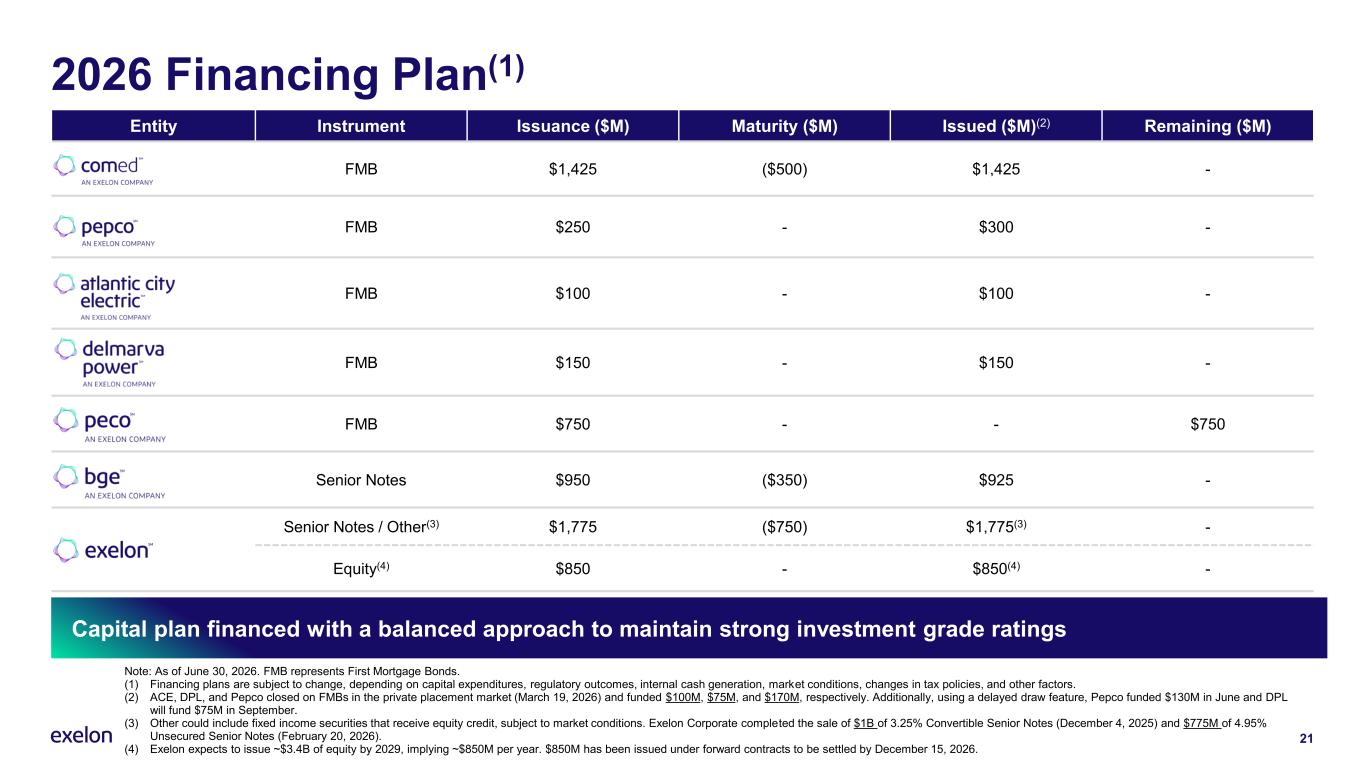
2026 Financing Plan(1) Capital plan financed with a balanced approach to maintain strong investment grade ratings Entity Instrument Issuance ($M) Maturity ($M) Issued ($M)(2) Remaining ($M) FMB $1,425 ($500) $1,425 - FMB $250 - $300 - FMB $100 - $100 - FMB $150 - $150 - FMB $750 - - $750 Senior Notes $950 ($350) $925 - Senior Notes / Other(3) $1,775 ($750) $1,775(3) - Equity(4) $850 - $850(4) - 21 Note: As of June 30, 2026. FMB represents First Mortgage Bonds. (1) Financing plans are subject to change, depending on capital expenditures, regulatory outcomes, internal cash generation, market conditions, changes in tax policies, and other factors. (2) ACE, DPL, and Pepco closed on FMBs in the private placement market (March 19, 2026) and funded $100M, $75M, and $170M, respectively. Additionally, using a delayed draw feature, Pepco funded $130M in June and DPL will fund $75M in September. (3) Other could include fixed income securities that receive equity credit, subject to market conditions. Exelon Corporate completed the sale of $1B of 3.25% Convertible Senior Notes (December 4, 2025) and $775M of 4.95% Unsecured Senior Notes (February 20, 2026). (4) Exelon expects to issue ~$3.4B of equity by 2029, implying ~$850M per year. $850M has been issued under forward contracts to be settled by December 15, 2026.
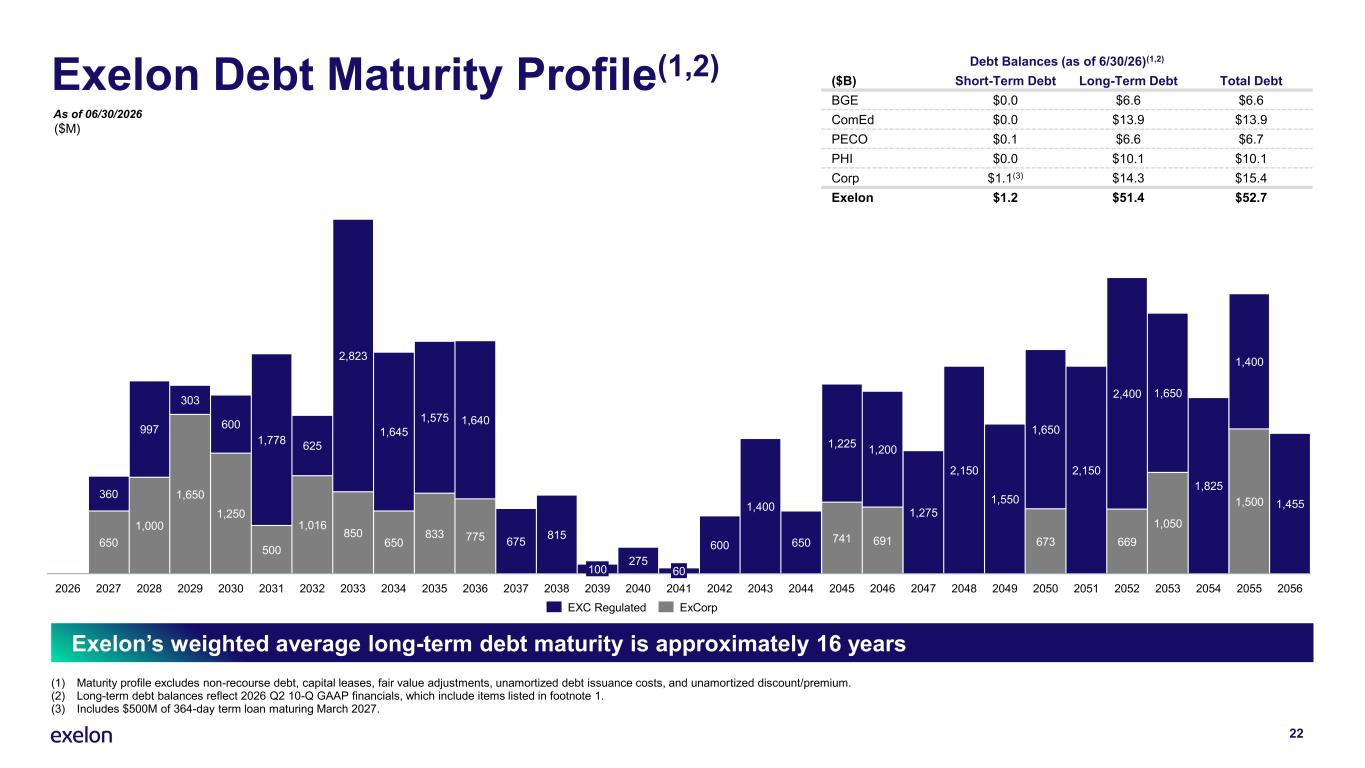
Exelon Debt Maturity Profile(1,2) Debt Balances (as of 6/30/26)(1,2) ($B) Short-Term Debt Long-Term Debt Total Debt BGE $0.0 $6.6 $6.6 ComEd $0.0 $13.9 $13.9 PECO $0.1 $6.6 $6.7 PHI $0.0 $10.1 $10.1 Corp $1.1(3) $14.3 $15.4 Exelon $1.2 $51.4 $52.7 650 1,000 1,650 1,250 500 1,016 850 650 833 775 675 815 275 600 1,400 650 741 691 1,275 2,150 1,550 673 2,150 669 1,050 1,825 1,500 1,455 360 997 303 600 1,778 625 2,823 1,645 1,575 1,640 1,225 1,200 1,650 2,400 1,650 1,400 2027 2028 2029 2030 2031 2032 2033 2034 2035 2036 2037 2038 100 2039 2040 60 2026 2042 2043 2044 2045 2046 2047 2048 2049 2050 2051 2052 2053 2054 2055 20562041 (1) Maturity profile excludes non-recourse debt, capital leases, fair value adjustments, unamortized debt issuance costs, and unamortized discount/premium. (2) Long-term debt balances reflect 2026 Q2 10-Q GAAP financials, which include items listed in footnote 1. (3) Includes $500M of 364-day term loan maturing March 2027. Exelon’s weighted average long-term debt maturity is approximately 16 years ($M) As of 06/30/2026 EXC Regulated ExCorp 22
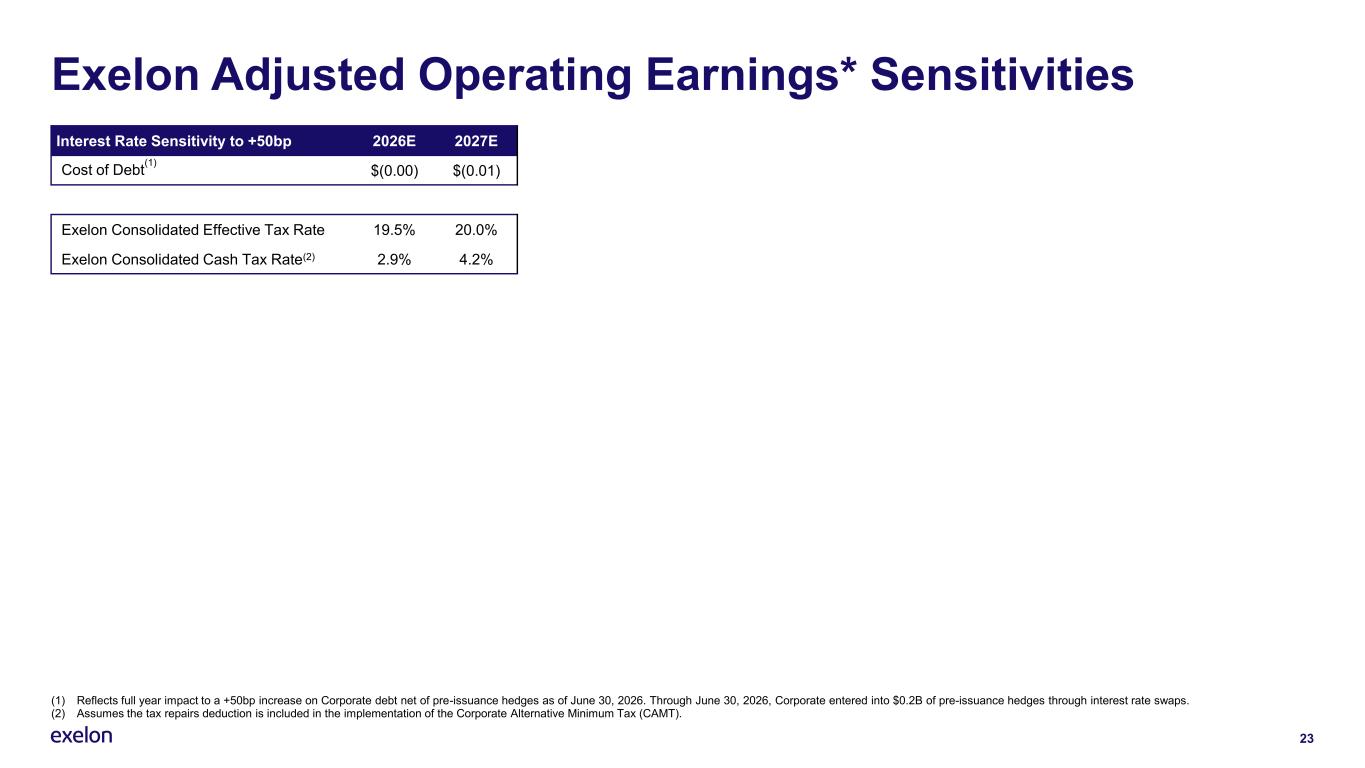
(1) Reflects full year impact to a +50bp increase on Corporate debt net of pre-issuance hedges as of June 30, 2026. Through June 30, 2026, Corporate entered into $0.2B of pre-issuance hedges through interest rate swaps. (2) Assumes the tax repairs deduction is included in the implementation of the Corporate Alternative Minimum Tax (CAMT). 23 Exelon Adjusted Operating Earnings* Sensitivities Interest Rate Sensitivity to +50bp 2026E 2027E Cost of Debt (1) $(0.00) $(0.01) Exelon Consolidated Effective Tax Rate 19.5% 20.0% Exelon Consolidated Cash Tax Rate(2) 2.9% 4.2%
24 Rate Case Details
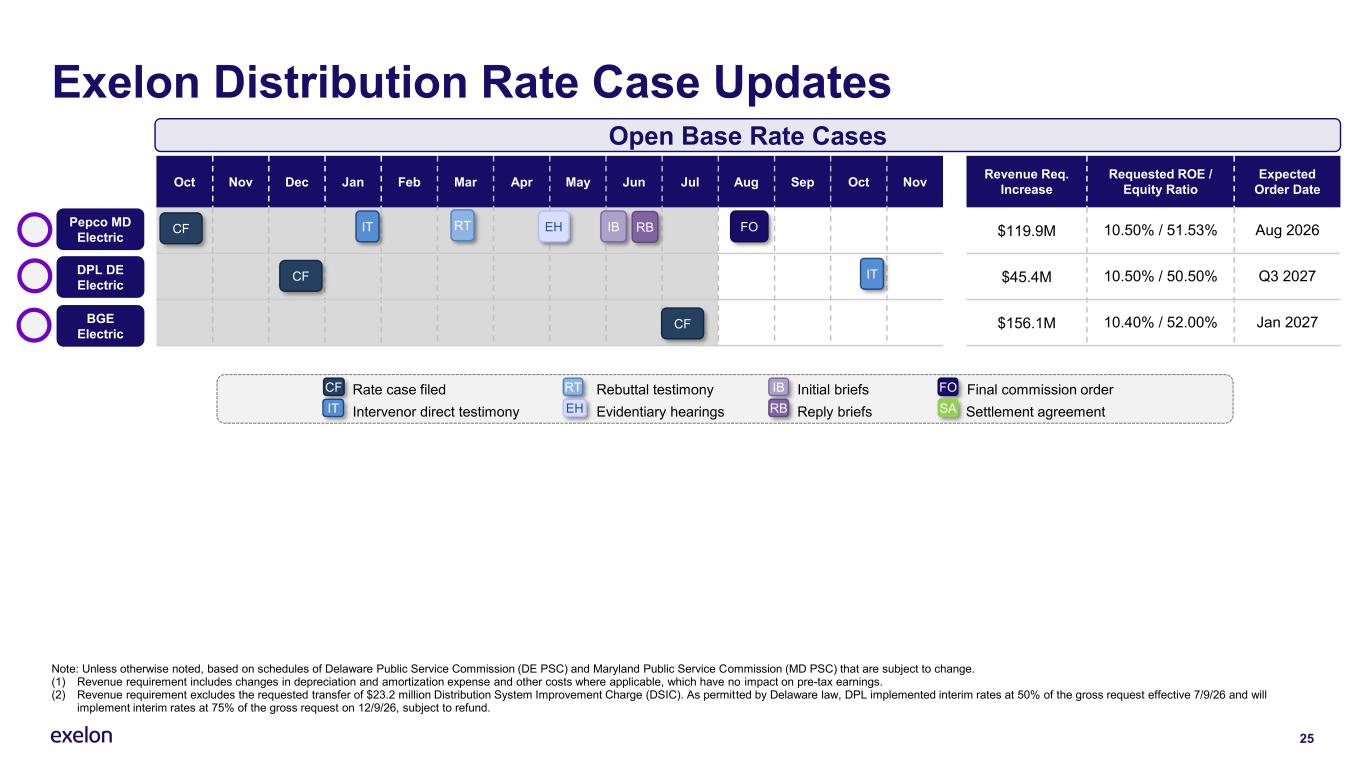
25 Exelon Distribution Rate Case Updates Rate case filed Rebuttal testimony Initial briefs Final commission order Intervenor direct testimony Evidentiary hearings Reply briefs Settlement agreement CF IT RT EH IB RB FO SA Oct Nov Dec Jan Feb Mar Apr May Jun Jul Aug Sep Oct Nov Revenue Req. Increase Requested ROE / Equity Ratio Expected Order Date $119.9M 10.50% / 51.53% Aug 2026 $45.4M 10.50% / 50.50% Q3 2027 $156.1M 10.40% / 52.00% Jan 2027 CF Open Base Rate Cases IT RT EH FO CF IT IB RB Note: Unless otherwise noted, based on schedules of Delaware Public Service Commission (DE PSC) and Maryland Public Service Commission (MD PSC) that are subject to change. (1) Revenue requirement includes changes in depreciation and amortization expense and other costs where applicable, which have no impact on pre-tax earnings. (2) Revenue requirement excludes the requested transfer of $23.2 million Distribution System Improvement Charge (DSIC). As permitted by Delaware law, DPL implemented interim rates at 50% of the gross request effective 7/9/26 and will implement interim rates at 75% of the gross request on 12/9/26, subject to refund. CF Pepco MD Electric DPL DE Electric BGE Electric
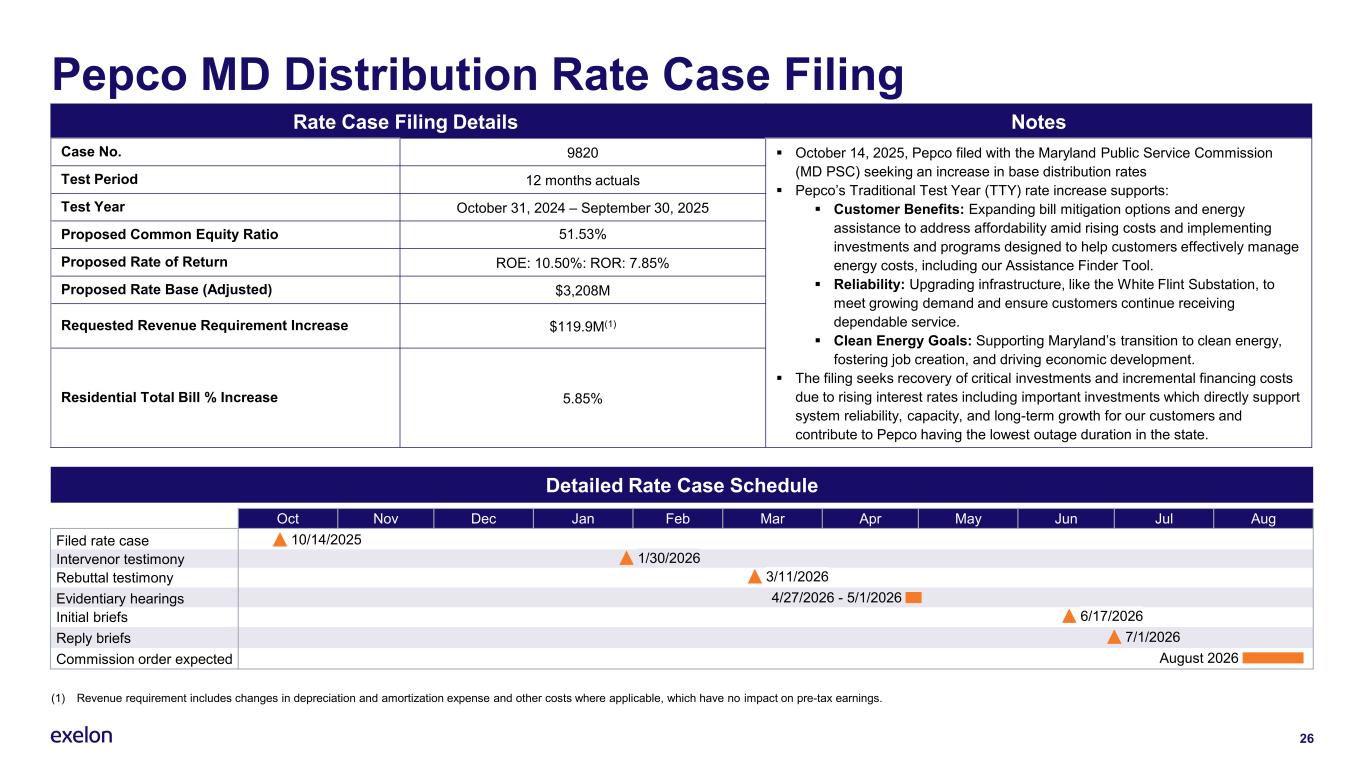
26 Pepco MD Distribution Rate Case Filing Rate Case Filing Details Notes Case No. 9820 ▪ October 14, 2025, Pepco filed with the Maryland Public Service Commission (MD PSC) seeking an increase in base distribution rates ▪ Pepco’s Traditional Test Year (TTY) rate increase supports: ▪ Customer Benefits: Expanding bill mitigation options and energy assistance to address affordability amid rising costs and implementing investments and programs designed to help customers effectively manage energy costs, including our Assistance Finder Tool. ▪ Reliability: Upgrading infrastructure, like the White Flint Substation, to meet growing demand and ensure customers continue receiving dependable service. ▪ Clean Energy Goals: Supporting Maryland’s transition to clean energy, fostering job creation, and driving economic development. ▪ The filing seeks recovery of critical investments and incremental financing costs due to rising interest rates including important investments which directly support system reliability, capacity, and long-term growth for our customers and contribute to Pepco having the lowest outage duration in the state. Test Period 12 months actuals Test Year October 31, 2024 – September 30, 2025 Proposed Common Equity Ratio 51.53% Proposed Rate of Return ROE: 10.50%: ROR: 7.85% Proposed Rate Base (Adjusted) $3,208M Requested Revenue Requirement Increase $119.9M(1) Residential Total Bill % Increase 5.85% Detailed Rate Case Schedule Oct Nov Dec Jan Feb Mar Apr May Jun Jul Aug 10/14/2025 4/27/2026 - 5/1/2026Evidentiary hearings 6/17/2026Initial briefs 3/11/2026 7/1/2026Reply briefs August 2026Commission order expected Intervenor testimony 1/30/2026 Filed rate case Rebuttal testimony (1) Revenue requirement includes changes in depreciation and amortization expense and other costs where applicable, which have no impact on pre-tax earnings.
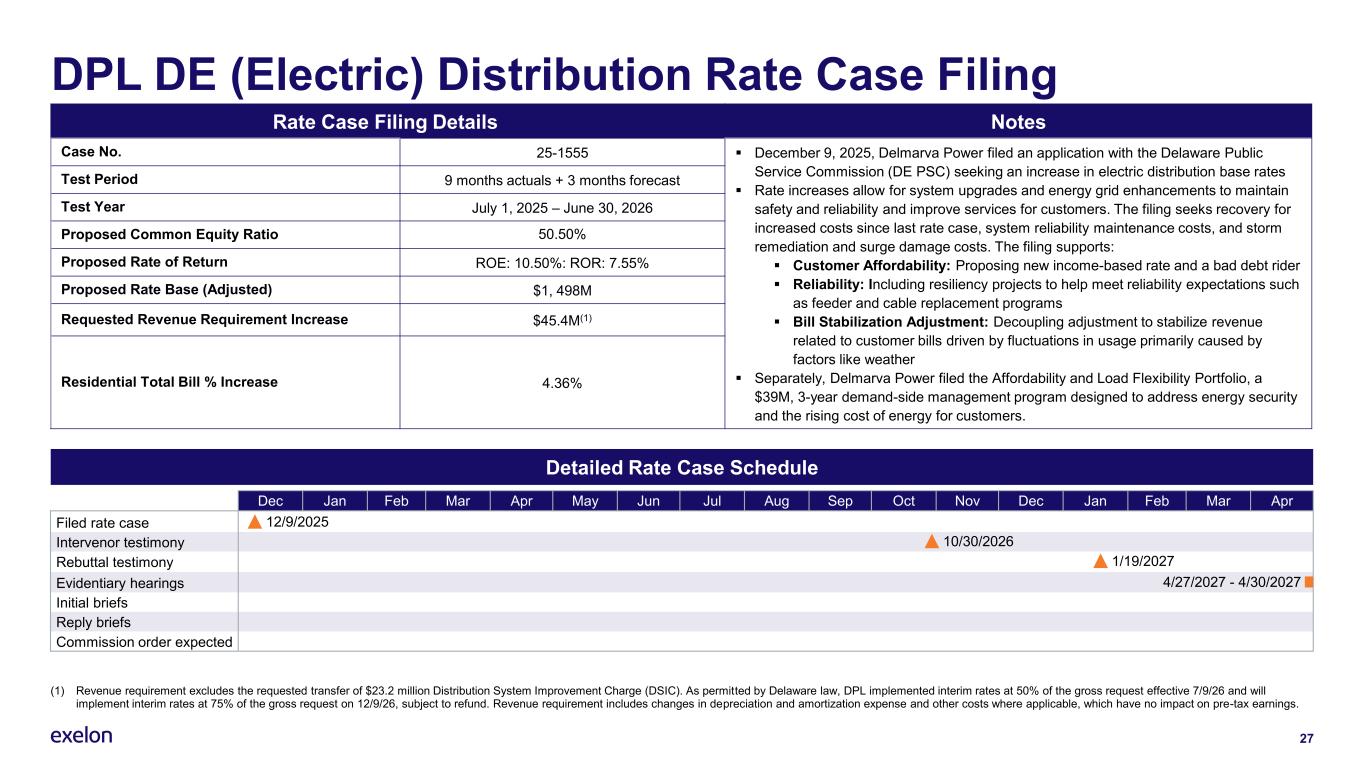
27 DPL DE (Electric) Distribution Rate Case Filing Rate Case Filing Details Notes Case No. 25-1555 ▪ December 9, 2025, Delmarva Power filed an application with the Delaware Public Service Commission (DE PSC) seeking an increase in electric distribution base rates ▪ Rate increases allow for system upgrades and energy grid enhancements to maintain safety and reliability and improve services for customers. The filing seeks recovery for increased costs since last rate case, system reliability maintenance costs, and storm remediation and surge damage costs. The filing supports: ▪ Customer Affordability: Proposing new income-based rate and a bad debt rider ▪ Reliability: Including resiliency projects to help meet reliability expectations such as feeder and cable replacement programs ▪ Bill Stabilization Adjustment: Decoupling adjustment to stabilize revenue related to customer bills driven by fluctuations in usage primarily caused by factors like weather ▪ Separately, Delmarva Power filed the Affordability and Load Flexibility Portfolio, a $39M, 3-year demand-side management program designed to address energy security and the rising cost of energy for customers. Test Period 9 months actuals + 3 months forecast Test Year July 1, 2025 – June 30, 2026 Proposed Common Equity Ratio 50.50% Proposed Rate of Return ROE: 10.50%: ROR: 7.55% Proposed Rate Base (Adjusted) $1, 498M Requested Revenue Requirement Increase $45.4M(1) Residential Total Bill % Increase 4.36% Detailed Rate Case Schedule Dec Jan Feb Mar Apr May Jun Jul Aug Sep Oct Nov Dec Jan Feb Mar Apr Filed rate case 12/9/2025 Reply briefs 10/30/2026 Initial briefs Evidentiary hearings Rebuttal testimony Intervenor testimony 1/19/2027 4/27/2027 - 4/30/2027 Commission order expected (1) Revenue requirement excludes the requested transfer of $23.2 million Distribution System Improvement Charge (DSIC). As permitted by Delaware law, DPL implemented interim rates at 50% of the gross request effective 7/9/26 and will implement interim rates at 75% of the gross request on 12/9/26, subject to refund. Revenue requirement includes changes in depreciation and amortization expense and other costs where applicable, which have no impact on pre-tax earnings.
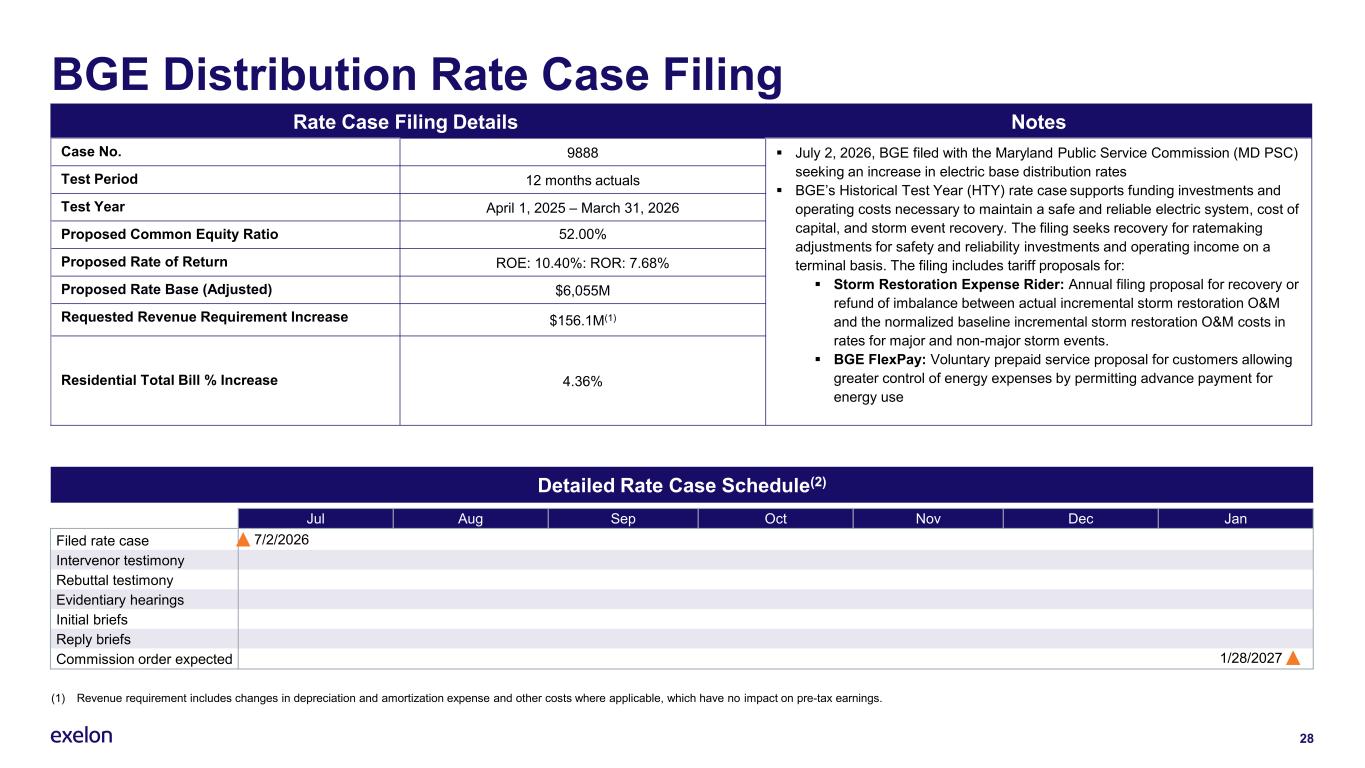
(1) Revenue requirement includes changes in depreciation and amortization expense and other costs where applicable, which have no impact on pre-tax earnings. 28 BGE Distribution Rate Case Filing Rate Case Filing Details Notes Case No. 9888 ▪ July 2, 2026, BGE filed with the Maryland Public Service Commission (MD PSC) seeking an increase in electric base distribution rates ▪ BGE’s Historical Test Year (HTY) rate case supports funding investments and operating costs necessary to maintain a safe and reliable electric system, cost of capital, and storm event recovery. The filing seeks recovery for ratemaking adjustments for safety and reliability investments and operating income on a terminal basis. The filing includes tariff proposals for: ▪ Storm Restoration Expense Rider: Annual filing proposal for recovery or refund of imbalance between actual incremental storm restoration O&M and the normalized baseline incremental storm restoration O&M costs in rates for major and non-major storm events. ▪ BGE FlexPay: Voluntary prepaid service proposal for customers allowing greater control of energy expenses by permitting advance payment for energy use Test Period 12 months actuals Test Year April 1, 2025 – March 31, 2026 Proposed Common Equity Ratio 52.00% Proposed Rate of Return ROE: 10.40%: ROR: 7.68% Proposed Rate Base (Adjusted) $6,055M Requested Revenue Requirement Increase $156.1M(1) Residential Total Bill % Increase 4.36% Detailed Rate Case Schedule(2) Jul Aug Sep Oct Nov Dec Jan 7/2/2026Filed rate case Intervenor testimony Rebuttal testimony Evidentiary hearings Initial briefs Reply briefs 1/28/2027Commission order expected
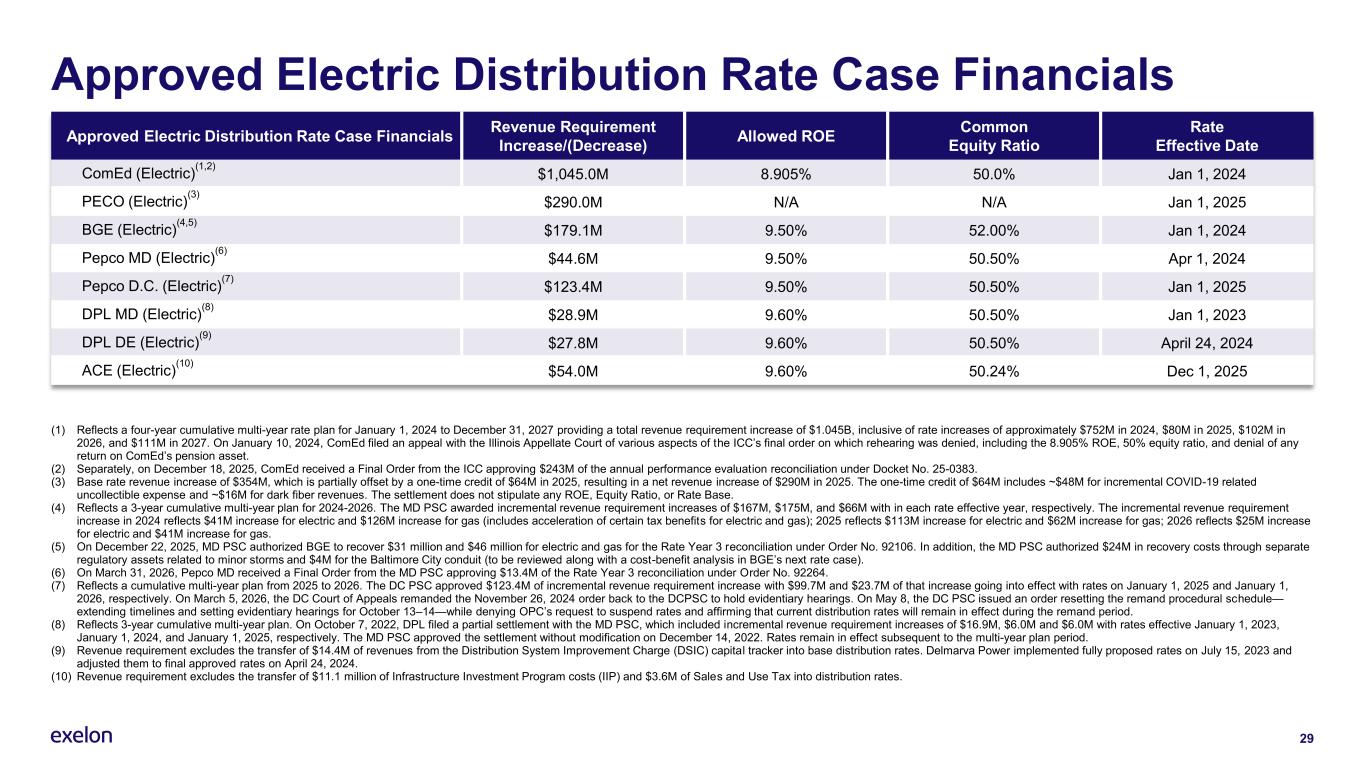
29 Approved Electric Distribution Rate Case Financials Approved Electric Distribution Rate Case Financials Revenue Requirement Increase/(Decrease) Allowed ROE Common Equity Ratio Rate Effective Date ComEd (Electric) (1,2) $1,045.0M 8.905% 50.0% Jan 1, 2024 PECO (Electric) (3) $290.0M N/A N/A Jan 1, 2025 BGE (Electric) (4,5) $179.1M 9.50% 52.00% Jan 1, 2024 Pepco MD (Electric) (6) $44.6M 9.50% 50.50% Apr 1, 2024 Pepco D.C. (Electric) (7) $123.4M 9.50% 50.50% Jan 1, 2025 DPL MD (Electric) (8) $28.9M 9.60% 50.50% Jan 1, 2023 DPL DE (Electric) (9) $27.8M 9.60% 50.50% April 24, 2024 ACE (Electric) (10) $54.0M 9.60% 50.24% Dec 1, 2025 (1) Reflects a four-year cumulative multi-year rate plan for January 1, 2024 to December 31, 2027 providing a total revenue requirement increase of $1.045B, inclusive of rate increases of approximately $752M in 2024, $80M in 2025, $102M in 2026, and $111M in 2027. On January 10, 2024, ComEd filed an appeal with the Illinois Appellate Court of various aspects of the ICC’s final order on which rehearing was denied, including the 8.905% ROE, 50% equity ratio, and denial of any return on ComEd’s pension asset. (2) Separately, on December 18, 2025, ComEd received a Final Order from the ICC approving $243M of the annual performance evaluation reconciliation under Docket No. 25-0383. (3) Base rate revenue increase of $354M, which is partially offset by a one-time credit of $64M in 2025, resulting in a net revenue increase of $290M in 2025. The one-time credit of $64M includes ~$48M for incremental COVID-19 related uncollectible expense and ~$16M for dark fiber revenues. The settlement does not stipulate any ROE, Equity Ratio, or Rate Base. (4) Reflects a 3-year cumulative multi-year plan for 2024-2026. The MD PSC awarded incremental revenue requirement increases of $167M, $175M, and $66M with in each rate effective year, respectively. The incremental revenue requirement increase in 2024 reflects $41M increase for electric and $126M increase for gas (includes acceleration of certain tax benefits for electric and gas); 2025 reflects $113M increase for electric and $62M increase for gas; 2026 reflects $25M increase for electric and $41M increase for gas. (5) On December 22, 2025, MD PSC authorized BGE to recover $31 million and $46 million for electric and gas for the Rate Year 3 reconciliation under Order No. 92106. In addition, the MD PSC authorized $24M in recovery costs through separate regulatory assets related to minor storms and $4M for the Baltimore City conduit (to be reviewed along with a cost-benefit analysis in BGE’s next rate case). (6) On March 31, 2026, Pepco MD received a Final Order from the MD PSC approving $13.4M of the Rate Year 3 reconciliation under Order No. 92264. (7) Reflects a cumulative multi-year plan from 2025 to 2026. The DC PSC approved $123.4M of incremental revenue requirement increase with $99.7M and $23.7M of that increase going into effect with rates on January 1, 2025 and January 1, 2026, respectively. On March 5, 2026, the DC Court of Appeals remanded the November 26, 2024 order back to the DCPSC to hold evidentiary hearings. On May 8, the DC PSC issued an order resetting the remand procedural schedule— extending timelines and setting evidentiary hearings for October 13–14—while denying OPC’s request to suspend rates and affirming that current distribution rates will remain in effect during the remand period. (8) Reflects 3-year cumulative multi-year plan. On October 7, 2022, DPL filed a partial settlement with the MD PSC, which included incremental revenue requirement increases of $16.9M, $6.0M and $6.0M with rates effective January 1, 2023, January 1, 2024, and January 1, 2025, respectively. The MD PSC approved the settlement without modification on December 14, 2022. Rates remain in effect subsequent to the multi-year plan period. (9) Revenue requirement excludes the transfer of $14.4M of revenues from the Distribution System Improvement Charge (DSIC) capital tracker into base distribution rates. Delmarva Power implemented fully proposed rates on July 15, 2023 and adjusted them to final approved rates on April 24, 2024. (10) Revenue requirement excludes the transfer of $11.1 million of Infrastructure Investment Program costs (IIP) and $3.6M of Sales and Use Tax into distribution rates.
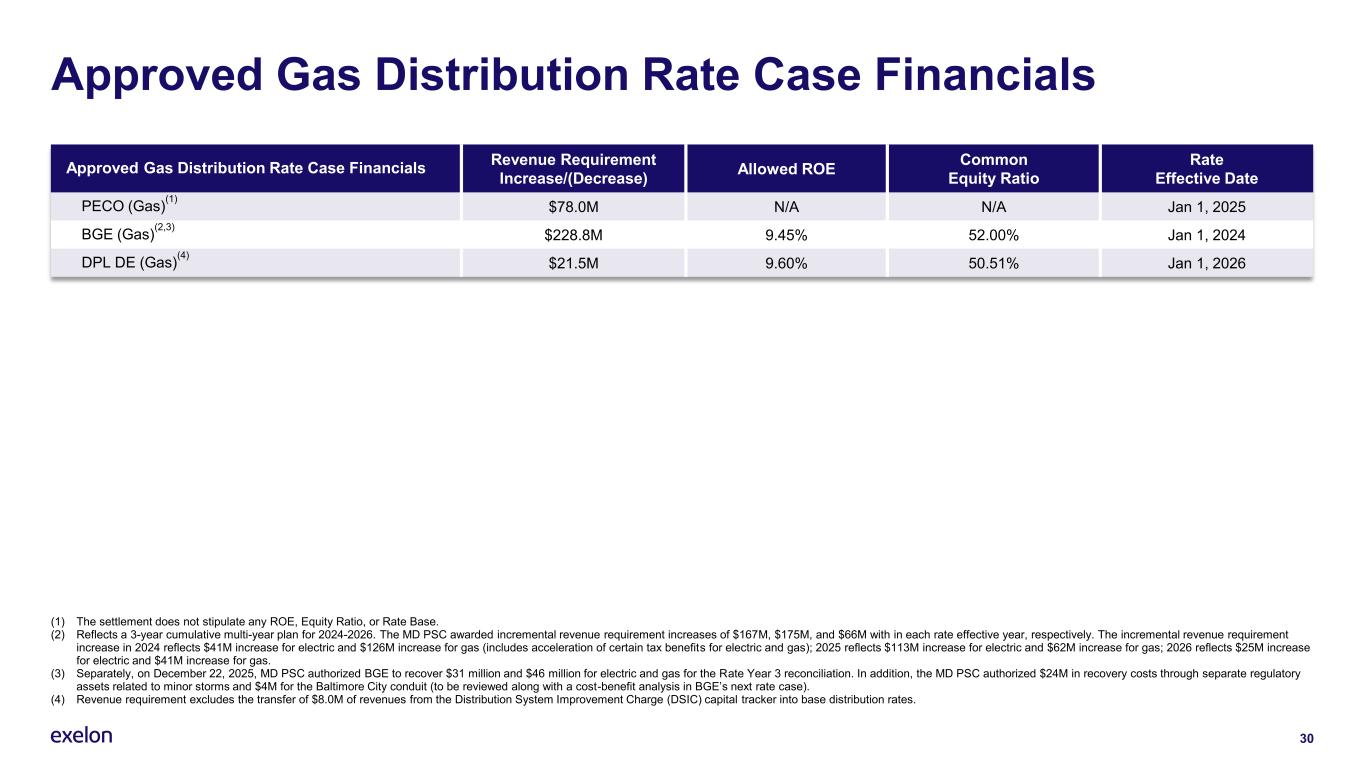
30 Approved Gas Distribution Rate Case Financials Approved Gas Distribution Rate Case Financials Revenue Requirement Increase/(Decrease) Allowed ROE Common Equity Ratio Rate Effective Date PECO (Gas) (1) $78.0M N/A N/A Jan 1, 2025 BGE (Gas) (2,3) $228.8M 9.45% 52.00% Jan 1, 2024 DPL DE (Gas) (4) $21.5M 9.60% 50.51% Jan 1, 2026 (1) The settlement does not stipulate any ROE, Equity Ratio, or Rate Base. (2) Reflects a 3-year cumulative multi-year plan for 2024-2026. The MD PSC awarded incremental revenue requirement increases of $167M, $175M, and $66M with in each rate effective year, respectively. The incremental revenue requirement increase in 2024 reflects $41M increase for electric and $126M increase for gas (includes acceleration of certain tax benefits for electric and gas); 2025 reflects $113M increase for electric and $62M increase for gas; 2026 reflects $25M increase for electric and $41M increase for gas. (3) Separately, on December 22, 2025, MD PSC authorized BGE to recover $31 million and $46 million for electric and gas for the Rate Year 3 reconciliation. In addition, the MD PSC authorized $24M in recovery costs through separate regulatory assets related to minor storms and $4M for the Baltimore City conduit (to be reviewed along with a cost-benefit analysis in BGE’s next rate case). (4) Revenue requirement excludes the transfer of $8.0M of revenues from the Distribution System Improvement Charge (DSIC) capital tracker into base distribution rates.
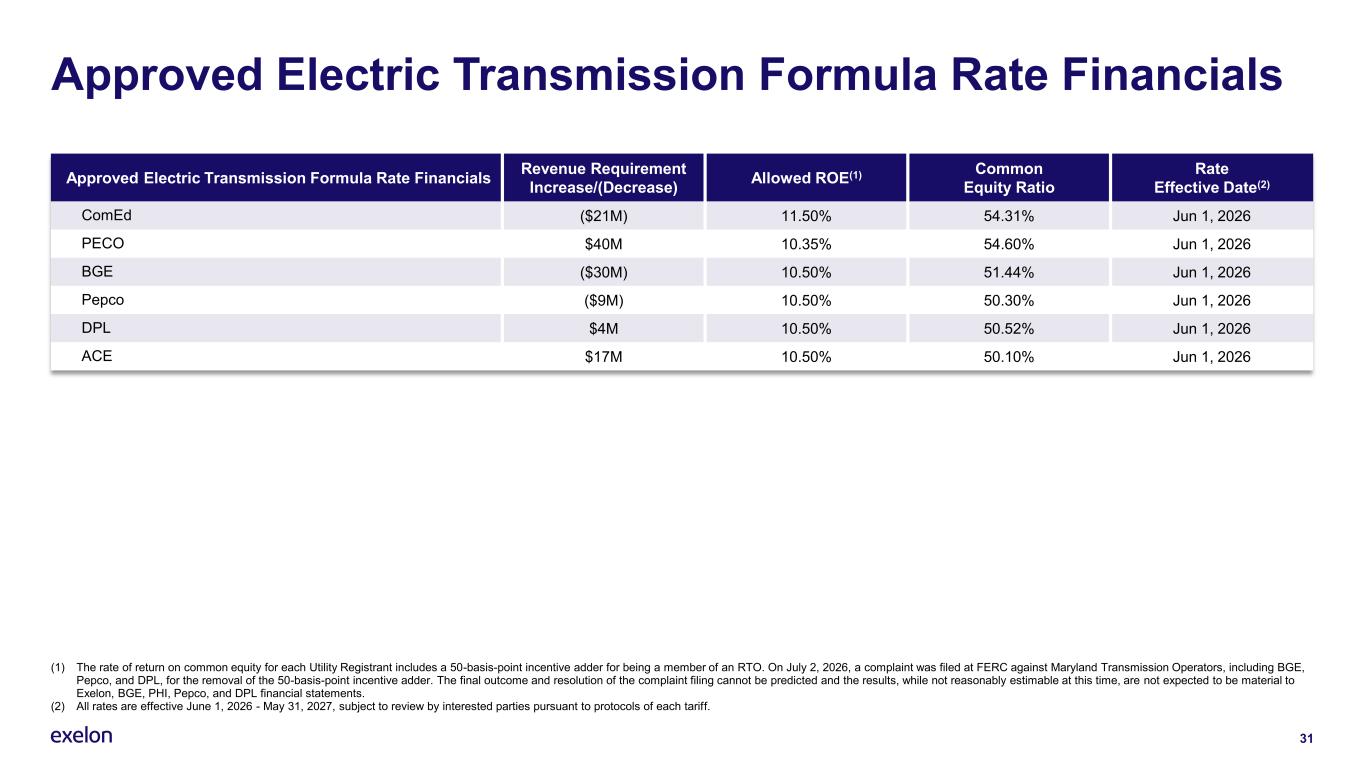
31 Approved Electric Transmission Formula Rate Financials Approved Electric Transmission Formula Rate Financials Revenue Requirement Increase/(Decrease) Allowed ROE(1) Common Equity Ratio Rate Effective Date(2) ComEd ($21M) 11.50% 54.31% Jun 1, 2026 PECO $40M 10.35% 54.60% Jun 1, 2026 BGE ($30M) 10.50% 51.44% Jun 1, 2026 Pepco ($9M) 10.50% 50.30% Jun 1, 2026 DPL $4M 10.50% 50.52% Jun 1, 2026 ACE $17M 10.50% 50.10% Jun 1, 2026 (1) The rate of return on common equity for each Utility Registrant includes a 50-basis-point incentive adder for being a member of an RTO. On July 2, 2026, a complaint was filed at FERC against Maryland Transmission Operators, including BGE, Pepco, and DPL, for the removal of the 50-basis-point incentive adder. The final outcome and resolution of the complaint filing cannot be predicted and the results, while not reasonably estimable at this time, are not expected to be material to Exelon, BGE, PHI, Pepco, and DPL financial statements. (2) All rates are effective June 1, 2026 - May 31, 2027, subject to review by interested parties pursuant to protocols of each tariff.
32 Reconciliation of Non-GAAP Measures
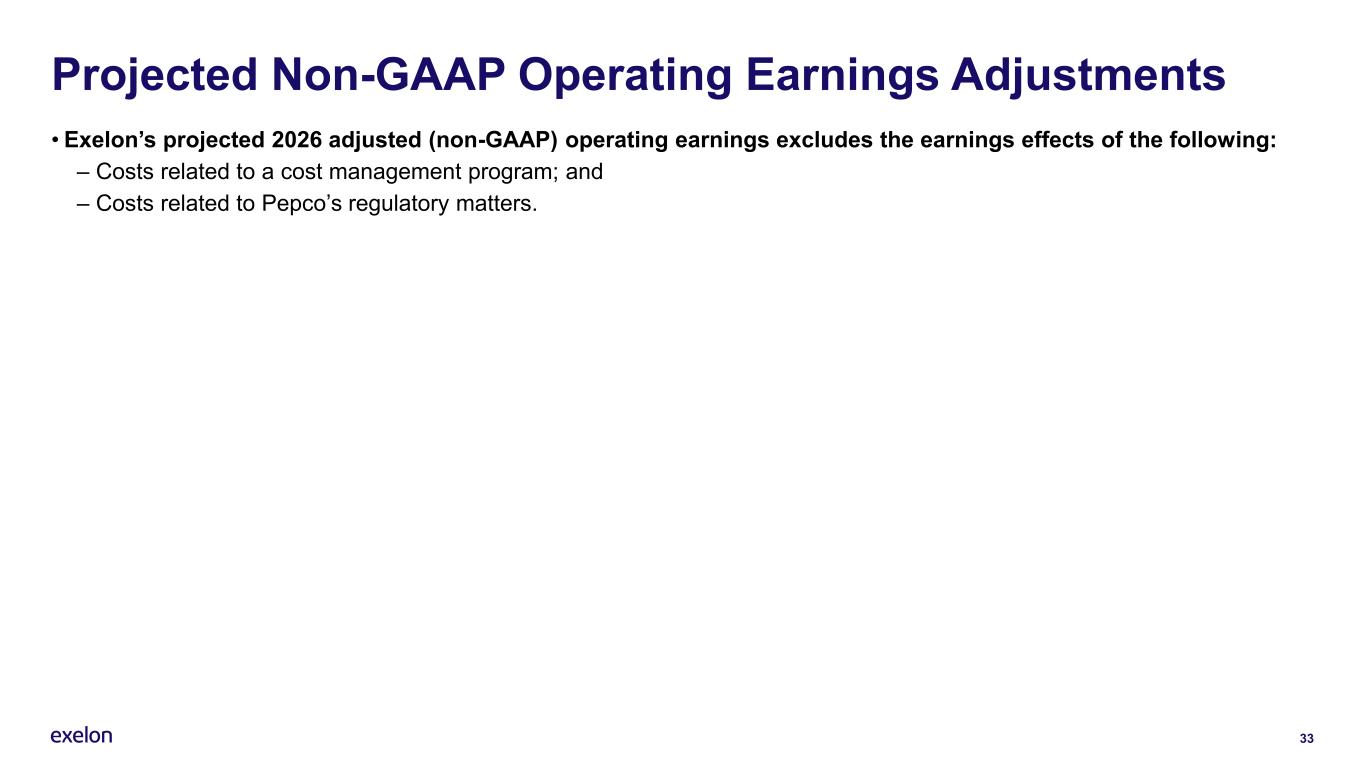
33 Projected Non-GAAP Operating Earnings Adjustments • Exelon’s projected 2026 adjusted (non-GAAP) operating earnings excludes the earnings effects of the following: – Costs related to a cost management program; and – Costs related to Pepco’s regulatory matters.
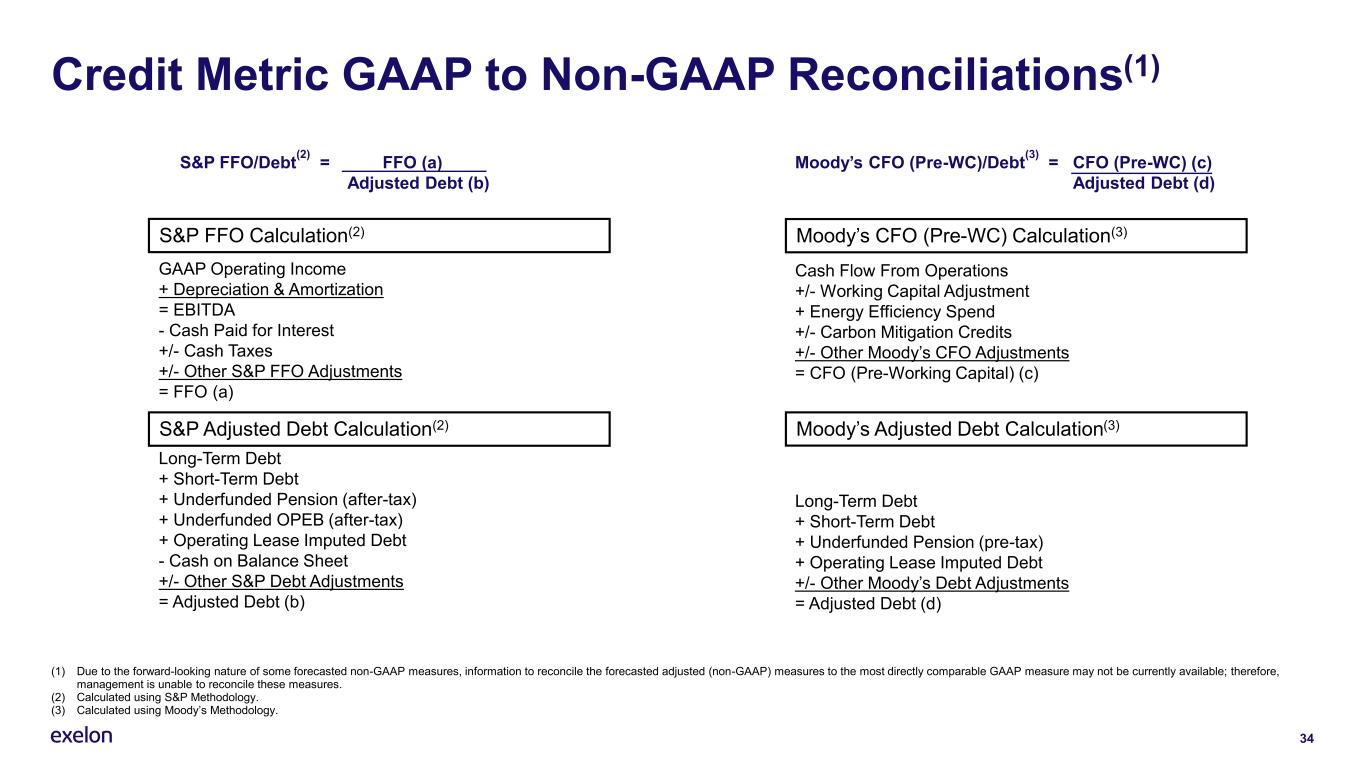
34 Credit Metric GAAP to Non-GAAP Reconciliations(1) GAAP Operating Income + Depreciation & Amortization = EBITDA - Cash Paid for Interest +/- Cash Taxes +/- Other S&P FFO Adjustments = FFO (a) Long-Term Debt + Short-Term Debt + Underfunded Pension (after-tax) + Underfunded OPEB (after-tax) + Operating Lease Imputed Debt - Cash on Balance Sheet +/- Other S&P Debt Adjustments = Adjusted Debt (b) S&P FFO Calculation(2) S&P Adjusted Debt Calculation(2) Moody’s CFO (Pre-WC)/Debt (3) = CFO (Pre-WC) (c) Adjusted Debt (d) Moody’s CFO (Pre-WC) Calculation(3) Cash Flow From Operations +/- Working Capital Adjustment + Energy Efficiency Spend +/- Carbon Mitigation Credits +/- Other Moody’s CFO Adjustments = CFO (Pre-Working Capital) (c) Long-Term Debt + Short-Term Debt + Underfunded Pension (pre-tax) + Operating Lease Imputed Debt +/- Other Moody’s Debt Adjustments = Adjusted Debt (d) S&P FFO/Debt (2) = FFO (a) Adjusted Debt (b) Moody’s Adjusted Debt Calculation(3) (1) Due to the forward-looking nature of some forecasted non-GAAP measures, information to reconcile the forecasted adjusted (non-GAAP) measures to the most directly comparable GAAP measure may not be currently available; therefore, management is unable to reconcile these measures. (2) Calculated using S&P Methodology. (3) Calculated using Moody’s Methodology.
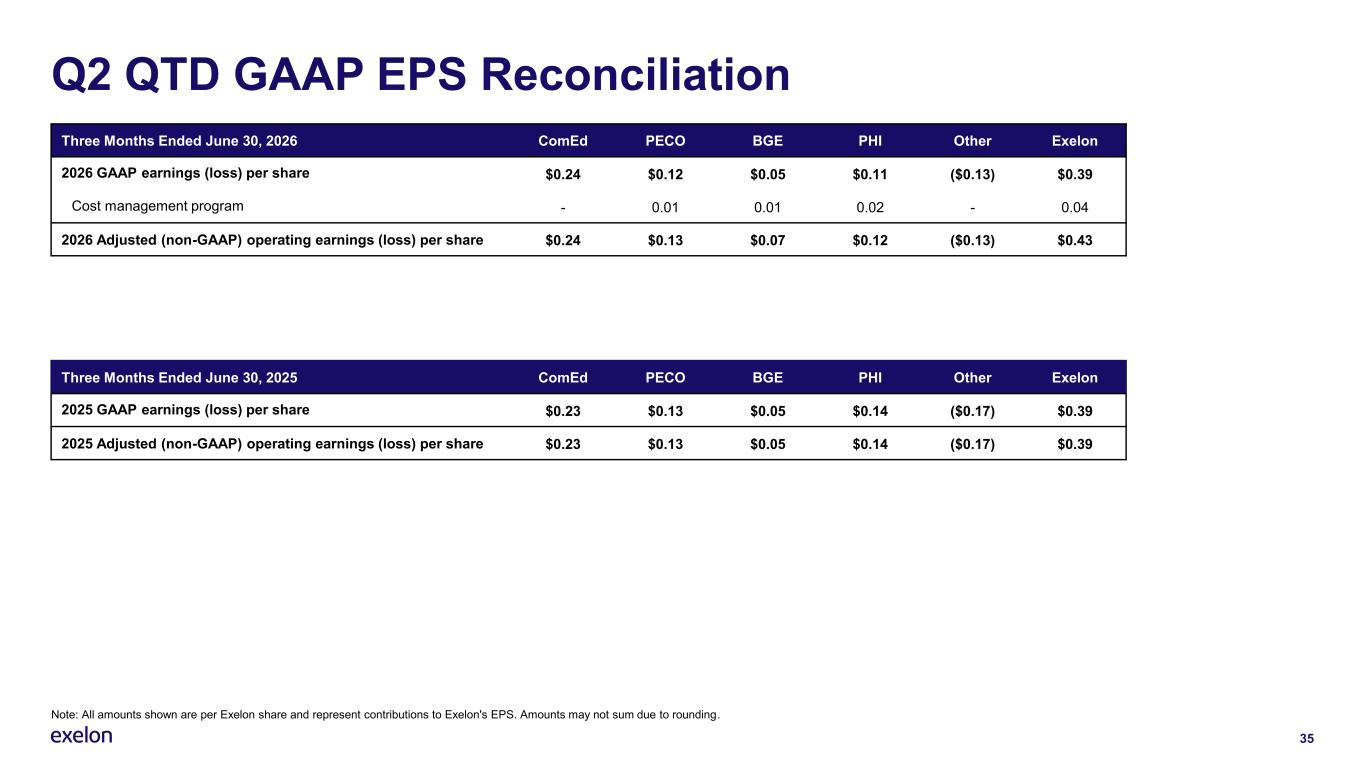
35 Q2 QTD GAAP EPS Reconciliation Three Months Ended June 30, 2026 ComEd PECO BGE PHI Other Exelon 2026 GAAP earnings (loss) per share $0.24 $0.12 $0.05 $0.11 ($0.13) $0.39 Cost management program - 0.01 0.01 0.02 - 0.04 2026 Adjusted (non-GAAP) operating earnings (loss) per share $0.24 $0.13 $0.07 $0.12 ($0.13) $0.43 Note: All amounts shown are per Exelon share and represent contributions to Exelon's EPS. Amounts may not sum due to rounding. Three Months Ended June 30, 2025 ComEd PECO BGE PHI Other Exelon 2025 GAAP earnings (loss) per share $0.23 $0.13 $0.05 $0.14 ($0.17) $0.39 2025 Adjusted (non-GAAP) operating earnings (loss) per share $0.23 $0.13 $0.05 $0.14 ($0.17) $0.39
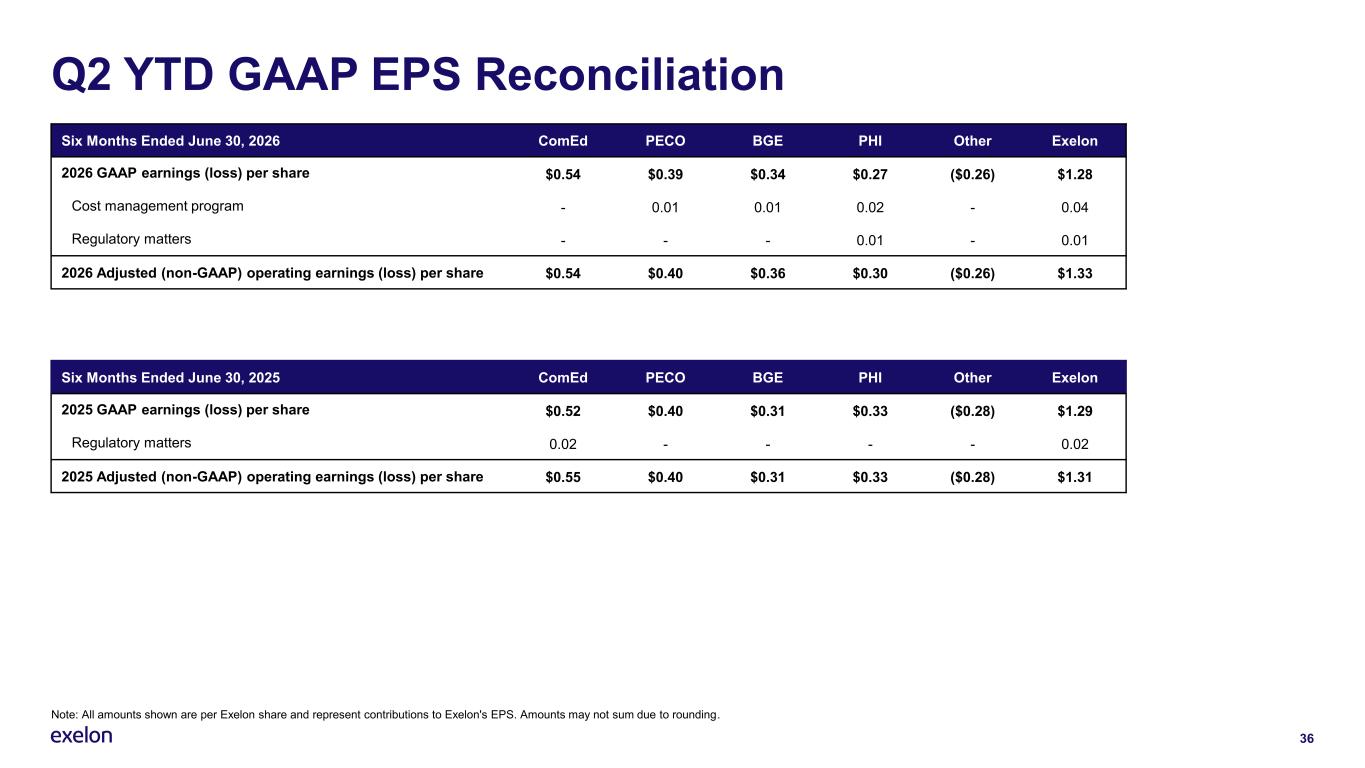
36 Q2 YTD GAAP EPS Reconciliation Six Months Ended June 30, 2026 ComEd PECO BGE PHI Other Exelon 2026 GAAP earnings (loss) per share $0.54 $0.39 $0.34 $0.27 ($0.26) $1.28 Cost management program - 0.01 0.01 0.02 - 0.04 Regulatory matters - - - 0.01 - 0.01 2026 Adjusted (non-GAAP) operating earnings (loss) per share $0.54 $0.40 $0.36 $0.30 ($0.26) $1.33 Note: All amounts shown are per Exelon share and represent contributions to Exelon's EPS. Amounts may not sum due to rounding. Six Months Ended June 30, 2025 ComEd PECO BGE PHI Other Exelon 2025 GAAP earnings (loss) per share $0.52 $0.40 $0.31 $0.33 ($0.28) $1.29 Regulatory matters 0.02 - - - - 0.02 2025 Adjusted (non-GAAP) operating earnings (loss) per share $0.55 $0.40 $0.31 $0.33 ($0.28) $1.31

Thank you Please direct all questions to the Exelon Investor Relations team: InvestorRelations@ExelonCorp.com 779-231-0017