Exhibit 99.1
| Stock Symbol: | AEM (NYSE and TSX) |
| For further information: | Investor Relations |
| (416) 947-1212 |
(All amounts expressed in U.S. dollars unless otherwise noted)
AGNICO EAGLE REPORTS SECOND QUARTER 2026 RESULTS – RECORD QUARTERLY FREE CASH FLOW REFLECTS SOLID OPERATIONAL PERFORMANCE; RECORD QUARTERLY SHAREHOLDER RETURNS
Toronto (July 29, 2026) – Agnico Eagle Mines Limited (NYSE and TSX: AEM) ("Agnico Eagle" or the "Company") today reported financial and operating results for the second quarter of 2026.
"Our high-quality portfolio delivered another strong quarter, with better-than-planned production and disciplined cost control driving strong margins and record quarterly free cash flow," said Ammar Al-Joundi, President and Chief Executive Officer. "The strength of our business and our balanced capital allocation approach enabled us to reinvest in future growth, enhance our portfolio through the completion of the regional consolidation in Finland, further strengthen our balance sheet and return a record $625 million to our shareholders through dividends and share repurchases during the quarter. Continued progress across our growth projects, supported by positive exploration results, reinforces our confidence in our long-term outlook, while our strong financial position supports our commitment to creating long-term value and delivering strong returns to our shareholders."
Second quarter 2026 highlights:
| · | Solid operating quarter driven by strong execution and cost control – Payable gold production1 was 855,816 ounces at production costs per ounce of $1,114, total cash costs per ounce2 of $1,054 and all-in sustaining costs ("AISC") per ounce2 of $1,459. The strong operating performance was led by Detour Lake, Kittila and Fosterville |
| · | Record quarterly free cash flow drives strong quarterly financial results – Solid production and disciplined cost control, combined with realized gold prices3 of $4,483 per ounce in the second quarter, resulted in record free cash flow. The Company reported quarterly net income of $1,600 million or $3.19 per share and adjusted net income4 of $1,541 million or $3.07 per share. The Company generated cash provided by operating activities of $2,144 million or $4.27 per share and free cash flow4 of $1,335 million or $2.66 per share |
1 Payable production of a mineral means the quantity of a mineral produced during a period contained in products that have been or will be sold by the Company whether such products are shipped during the period or held as inventory at the end of the period.
2 Total cash costs per ounce and all-in sustaining costs per ounce (or AISC per ounce) are non-GAAP measures that are not standardized financial measures under IFRS Accounting Standards and, in this news release, unless otherwise specified, are reported on (i) a per ounce of gold production basis, and (ii) a by-product basis. For reconciliations of each of these non-GAAP measures to production costs on both a by-product and a co-product basis and a description of their composition and usefulness, see Note Regarding Certain Measures of Performance below.
3 Realized gold price is calculated as gold revenues from mining operations divided by the number of ounces sold.
4 Adjusted net income, free cash flow and, where applicable, their related per share measures are non-GAAP measures that are not standardized financial measures under IFRS Accounting Standards. For a description of the composition and usefulness of these non-GAAP measures and a reconciliation to the most comparable measure prepared in accordance with IFRS Accounting Standards, see Note Regarding Certain Measures of Performance below.
| · | Financial strength and flexibility further enhanced – The Company increased its cash balance by $352 million to $3,464 million as at June 30, 2026, resulting in a net cash5 position of $3,267 million with total debt outstanding of $197 million as at June 30, 2026. Reflecting its strong financial profile, Fitch Ratings upgraded the Company's long-term issuer default rating from BBB+ to A- in April 2026 |
| · | Annual gold production remains at lower end of guidance range; total cash costs and AISC annual guidance reiterated – Expected payable gold production for the full year 2026 remains near the lower end of the guided range of 3.3 to 3.5 million ounces, reflecting the preliminary redesign of the Barnat open pit at Canadian Malartic that contemplates reduced production following the rock mass movement reported on July 2, 2026. Full year total cash costs per ounce and AISC per ounce guidance for 2026 remains unchanged at $1,020 to $1,120 and $1,400 to $1,550, respectively. Total capital expenditures for 2026 (excluding capitalized exploration) are now expected to be between $2.6 billion and $2.8 billion, compared with previous guidance of $2.2 billion to $2.4 billion, reflecting the approval of construction activities at Hope Bay announced on May 19, 2026. Capitalized exploration guidance for 2026 remains unchanged at $290 million to $330 million. Further details are set out in the 2026 Guidance Summary section below |
| · | Record quarterly shareholder returns – The Company returned a total of $625 million to shareholders during the second quarter of 2026, including the declaration of a quarterly dividend of $0.45 per share and the repurchase of 2,235,947 common shares under the Company's normal course issuer bid ("NCIB"). Share repurchases were completed at an average price of $178.86 per share for an aggregate cost of $400 million. In May 2026, the Company renewed the NCIB for another year on substantially the same terms, however it increased its internal limit on purchases of common shares to $2 billion |
| · | Reconciliation Action Plan Progress Report published – In June 2026, the Company published its first progress report on the Reconciliation Action Plan that was released in 2024, covering progress in 2024 and 2025 and reinforcing the Company's commitment to transparency, accountability and meaningful reconciliation with Indigenous Peoples across its operations |
| · | Update on key value drivers and pipeline projects in the second quarter of 2026 |
| ◦ | Canadian Malartic – The first phase of shaft sinking at Odyssey underground was completed in July 2026, reaching a depth of 1,586 metres. Activities will transition to the headframe change over and completion of the first loading station, which remains on schedule, to support first production through Shaft #1 in the second quarter of 2027. Ramp development advanced to a depth of 1,190 metres during the quarter and is expected to reach planned shaft bottom at 1,870 metres in 2030, enabling a second phase of sinking Shaft #1 from 2029 to 2031. Exploration drilling continued to yield positive results in multiple areas of the Odyssey mine, including 5.1 grams per tonne ("g/t") gold over 14.3 metres at 916 metres depth in the upper eastern portion of the East Gouldie deposit and 13.7 g/t gold over 14.6 metres (core length) at 1,078 metres depth in the newly defined Artemis zone in the internal zones of the Odyssey deposit |
| ◦ | Detour Lake – Development activities for the underground project continued, with the exploration ramp reaching a depth of 180 metres and the overburden removal for the conveyor-ramp portal advancing. High-intensity drilling from surface near the exploration ramp in the West Pit zone continued in the second quarter with a highlight intercept of 2.5 g/t gold over 62.3 metres at 275 metres depth, including 15.2 g/t gold over 5.9 metres at 264 metres depth. Drilling into the West Extension zone had highlights of 13.5 g/t gold over 2.5 metres at 564 metres depth, approximately 1.0 kilometre west of the resource-pit outline, and 20.8 g/t gold over 4.8 metres at 836 metres depth, approximately 2.3 kilometres west of the resource-pit outline |
5 Net cash is a non-GAAP measure that is not a standardized financial measure under IFRS Accounting Standards. For a description of the composition and usefulness of this non-GAAP measure and a reconciliation to the most comparable measure prepared in accordance with IFRS Accounting Standards, see Note Regarding Certain Measures of Performance below.
2
| ◦ | Upper Beaver – Development of the exploration ramp and shaft continued to advance, reaching depths of 165 metres and 478 metres, respectively. During the quarter, the Company continued a high-intensity drilling program targeting a portion of the Upper Beaver deposit between approximately 500 and 600 metres depth |
| ◦ | Hope Bay – On May 19, 2026, the Company announced a positive investment decision for the Hope Bay project, supported by a study envisioning annual gold production of 400,000 to 435,000 ounces over an initial 11-year mine life and demonstrating strong economics6. Construction activities to support project redevelopment continued through the quarter, including the upgrade of surface infrastructure and development of exploration ramps at Naartok East and at Patch 7. Planning and procurement activities also progressed as scheduled in preparation for the upcoming sealift season. Conversion and exploration drilling at Patch 7 at the Madrid deposit during the second quarter had highlights of 18.5 g/t gold over 11.3 metres at 328 metres depth, 13.7 g/t gold over 15.4 metres at 609 metres depth and 15.2 g/t gold over 15.6 metres at 710 metres depth. At the Boston deposit, the Company started its first exploration drilling program since acquiring Hope Bay in 2021, with approximately 6,500 metres expected to be drilled by year-end |
| ◦ | San Nicolás – Minas de San Nicolás received the land use change (ETJ) and the environmental impact assessment (MIA-R) permits in July 2026, marking a milestone for the responsible development of the San Nicolás Project, and will now advance the additional permits, authorization and licenses required |
6 The forecast parameters were based on an internal evaluation which is preliminary in nature and includes inferred mineral resource. For a description see Notes to Investors Regarding Certain Project Evaluations below.
3
Second Quarter 2026 Results Conference Call and Webcast Tomorrow
The Company's senior management will host a conference call on Thursday, July 30, 2026, at 11:00 AM (E.D.T.) to discuss the Company's financial and operating results.
Via Webcast:
To listen to the live webcast of the conference call, you may register on the Company's website at www.agnicoeagle.com, or directly via the link here.
Via Phone:
To join the conference call by phone, please dial 437-900-0527 or toll-free 1-888-510-2154 to be entered into the call by an operator. To ensure your participation, please call approximately five minutes prior to the scheduled start of the call.
To join the conference call by phone without operator assistance, you may register your phone number here 30 minutes prior to the scheduled start of the call to receive an automated call back.
Replay Archive:
Please dial 289-819-1450 or toll-free 1-888-660-6345, access code 02161#. The conference call replay will be available until August 30, 2026.
The webcast, along with presentation slides, will be archived for 180 days on the Company's website.
Second Quarter 2026 Production and Costs
Production and Cost Results Summary
| Three Months Ended June 30, | Six Months Ended June 30, | |||||||||||||||
| 2026 | 2025* | 2026 | 2025* | |||||||||||||
| Gold production** (ounces) | 855,816 | 866,029 | 1,680,925 | 1,739,823 | ||||||||||||
| Gold sales (ounces)*** | 835,505 | 846,835 | 1,665,156 | 1,689,800 | ||||||||||||
| Production costs per ounce | $ | 1,114 | $ | 911 | $ | 1,136 | $ | 895 | ||||||||
| Total cash costs per ounce | $ | 1,054 | $ | 925 | $ | 1,073 | $ | 910 | ||||||||
| AISC per ounce | $ | 1,459 | $ | 1,281 | $ | 1,471 | $ | 1,227 | ||||||||
| * | Total cash costs per ounce and AISC per ounce for the three and six months ended June 30, 2025 have been restated using the Company's revised composition for periods commencing on or after January 1, 2026, see Note Regarding Certain Measures of Performance below for further details. Using the Company's composition of this measure for periods ending on or prior to December 31, 2025, total cash costs per ounce were $933 and $918 for the consolidated Company and AISC per ounce was $1,289 and $1,235 for the consolidated Company for the three and six months ended June 30, 2025, respectively. |
| ** | Gold production for the three months ended June 30, 2026 excludes payable gold production at La India and Creston Mascota of 440 and 58 ounces, respectively, which were produced from residual leaching. Gold production for the three months ended June 30, 2025 excludes payable gold production at La India and Creston Mascota of 858 ounces and 39 ounces, respectively, which were producing from residual leaching. Gold production for the six months ended June 30, 2026 excludes payable gold production at La India and Creston Mascota of 858 and 134 ounces, respectively, which were produced from residual leaching. Gold production for the six months ended June 30, 2025 excludes payable gold production at La India and Creston Mascota of 2,669 ounces and 64 ounces, respectively, which were producing from residual leaching. |
| *** | Payable metals sold at Canadian Malartic, Detour Lake and Macassa exclude the in-kind royalties of 5.0%, 2.0% and 1.5%, respectively, paid in respect of gold production at such mines. For the six months ended June 30, 2025, payable metals sold excludes 2,500 payable gold ounces sold from La India. |
4
Gold Production
| · | Second Quarter of 2026 – Gold production decreased when compared to the prior-year period primarily due to lower production from Canadian Malartic (lower throughput and grade), partially offset by higher production from Detour Lake and Kittila (higher throughputs and grades) |
| · | First Six Months of 2026 – Gold production decreased when compared to the prior-year period primarily due to lower production from Macassa (lower grade partially offset by higher throughput), Canadian Malartic (lower throughput) and Meadowbank (lower grade partially offset by higher throughput), partially offset by higher production from Detour Lake (higher throughput and grade) |
Production Costs per Ounce
| · | Second Quarter of 2026 – Production costs per ounce increased when compared to the prior-year period primarily due to higher labour costs, higher royalty costs resulting from higher gold prices, higher energy costs related to diesel and lower production |
| · | First Six Months of 2026 – Production costs per ounce increased when compared to the prior-year period primarily due to higher labour costs, higher royalty costs resulting from higher gold prices, higher energy costs related to diesel, lower production and the impact of a stronger Canadian dollar relative to the U.S. dollar |
Total Cash Costs per Ounce
| · | Second Quarter and First Six Months of 2026 – Total cash costs per ounce increased when compared to the prior-year periods primarily due to the reasons described above for the increase in production costs per ounce in each respective period |
AISC per Ounce
| · | Second Quarter of 2026 – AISC per ounce increased when compared to the prior-year period due to the reasons described above for the increase in total cash costs per ounce, an increase in non-cash reclamation-related costs and higher sustaining capital expenditures (primarily at Detour Lake and Fosterville) |
| · | First Six Months of 2026 – AISC per ounce increased when compared to the prior-year period due to the reasons described above for the increase in total cash costs per ounce, an increase in non-cash reclamation-related costs, higher sustaining capital expenditures (primarily at Detour Lake and Fosterville) and higher general and administrative expenses |
Refer to the Company's Management Discussion and Analysis for the second quarter of 2026 (the "MD&A") under the caption "Financial and Operating Results" for additional variance analysis on gold production, production costs, minesite costs per tonne and total cash costs per ounce compared to the prior-year periods.
5
Second Quarter 2026 Financial Results
Financial Results Summary
| Three Months Ended June 30, | Six Months Ended June 30, | |||||||||||||||
| 2026 | 2025 | 2026 | 2025 | |||||||||||||
| Realized gold price (per ounce) | $ | 4,483 | $ | 3,288 | $ | 4,672 | $ | 3,090 | ||||||||
| Net income (millions) | $ | 1,600 | $ | 1,069 | $ | 3,296 | $ | 1,883 | ||||||||
| Adjusted net income (millions) | $ | 1,541 | $ | 976 | $ | 3,246 | $ | 1,746 | ||||||||
| EBITDA (millions)7 | $ | 2,762 | $ | 2,021 | $ | 5,758 | $ | 3,655 | ||||||||
| Adjusted EBITDA (millions)7 | $ | 2,738 | $ | 1,914 | $ | 5,748 | $ | 3,504 | ||||||||
| Cash provided by operating activities (millions) | $ | 2,144 | $ | 1,845 | $ | 3,490 | $ | 2,890 | ||||||||
| Cash provided by operating activities before changes in non-cash working capital balances (millions)7 | $ | 2,112 | $ | 1,332 | $ | 4,344 | $ | 2,541 | ||||||||
| Capital expenditures* (millions)7 | $ | 801 | $ | 538 | $ | 1,375 | $ | 957 | ||||||||
| Free cash flow (millions) | $ | 1,335 | $ | 1,305 | $ | 2,067 | $ | 1,899 | ||||||||
| Free cash flow before changes in non-cash working capital balances (millions)7 | $ | 1,303 | $ | 792 | $ | 2,921 | $ | 1,551 | ||||||||
| Net income per share (basic) | $ | 3.19 | $ | 2.13 | $ | 6.58 | $ | 3.75 | ||||||||
| Adjusted net income per share (basic) | $ | 3.07 | $ | 1.94 | $ | 6.48 | $ | 3.47 | ||||||||
| Cash provided by operating activities per share (basic) | $ | 4.27 | $ | 3.67 | $ | 6.97 | $ | 5.75 | ||||||||
| Cash provided by operating activities before changes in non-cash working capital balances per share (basic) | $ | 4.21 | $ | 2.65 | $ | 8.67 | $ | 5.06 | ||||||||
| Free cash flow per share (basic) | $ | 2.66 | $ | 2.60 | $ | 4.13 | $ | 3.78 | ||||||||
| Free cash flow before changes in non-cash working capital balances per share (basic) | $ | 2.60 | $ | 1.58 | $ | 5.83 | $ | 3.09 | ||||||||
| * | Includes capitalized exploration |
Net Income
| · | Second Quarter of 2026 |
| ◦ | Net income increased when compared to the prior-year period primarily due to strong operating margins from higher realized gold prices and a gain on sale of investments, partially offset by losses on derivative financial instruments (compared to gains in the prior-year period) and higher income and mining taxes |
| ◦ | Net income of $1,600 million ($3.19 per share) includes the following items (net of tax): Gain on sale of investments of $155 million ($0.31 per share), net losses on derivative financial instruments of $56 million ($0.11 per share), foreign exchange losses of $20 million ($0.04 per share), multi-year donations recognized in the quarter of $13 million ($0.03 per share) and other adjustments including reclamation and net asset disposals of $7 million ($0.01 per share). Excluding these items results in adjusted net income of $1,541 million or $3.07 per share |
| · | First Six Months of 2026 – Net income increased when compared to the prior-year period primarily due to the reasons described above for the second quarter of 2026 |
7 "EBITDA" means earnings before interest, taxes, depreciation, and amortization. EBITDA, adjusted EBITDA, capital expenditures, cash provided by operating activities before changes in non-cash components of working capital and free cash flow before changes in non-cash components of working capital and, where applicable, their related per share measures, are non-GAAP measures that are not standardized measures under IFRS Accounting Standards. For a description of the composition and usefulness of these non- GAAP measures and a reconciliation to the most comparable measure prepared in accordance with IFRS Accounting Standards, see Note Regarding Certain Measures of Performance below.
6
Adjusted EBITDA
| · | Second Quarter and First Six Months of 2026 – Adjusted EBITDA increased when compared to the prior-year periods primarily due to higher revenues from mining operations (higher realized gold prices, partially offset by lower gold sales), partially offset by higher production costs (higher labour costs, royalty costs and energy costs related to diesel) |
Cash Provided by Operating Activities
| · | Second Quarter of 2026 – Cash provided by operating activities and cash provided by operating activities before changes in non-cash components of working capital increased when compared to the prior-year period primarily due to the reasons described above related to the increase in adjusted EBITDA |
| · | First Six Months of 2026 – Cash provided by operating activities and cash provided by operating activities before changes in non-cash components of working capital increased when compared to the prior-year period primarily due to the reasons described above related to the increase in adjusted EBITDA. For the first six months of 2026, cash provided by operating activities was reduced by unfavourable changes in non-cash components of working capital primarily due to approximately $1.3 billion in cash taxes paid in the first quarter of 2026 relating to the 2025 taxation year |
Free Cash Flow
| · | Second Quarter and First Six Months of 2026 – Free cash flow and free cash flow before changes in non-cash components of working capital increased when compared to the prior-year periods due to the reasons described above related to cash provided by operating activities, partially offset by higher development capital expenditures related to the Hope Bay, Odyssey and Detour Lake underground projects in each respective period |
7
Capital Expenditures
In the second quarter of 2026, capital expenditures were $699 million and capitalized exploration expenditures were $102 million, for a total of $801 million. For the first six months of 2026, capital expenditures were $1,188 million and capitalized exploration expenditures were $186 million, for a total of $1,375 million.
The table below sets out a summary of capital expenditures, in each case broken down between sustaining capital expenditures and development capital expenditures by mine, and capitalized exploration in the second quarter of 2026 and the first six months of 2026.
Summary of Capital Expenditures
(thousands)
| Capital Expenditures* | Capitalized Exploration | |||||||||||||||
| Three Months Ended | Six Months Ended | Three Months Ended | Six Months Ended | |||||||||||||
| Jun 30, 2026 | Jun 30, 2026 | Jun 30, 2026 | Jun 30, 2026 | |||||||||||||
| Sustaining Capital Expenditures** | ||||||||||||||||
| LaRonde | $ | 19,512 | $ | 35,173 | $ | 1,038 | $ | 2,270 | ||||||||
| Canadian Malartic | 22,442 | 45,203 | 1,221 | 2,208 | ||||||||||||
| Goldex | 9,471 | 19,576 | 486 | 686 | ||||||||||||
| Quebec | 51,425 | 99,952 | 2,745 | 5,164 | ||||||||||||
| Detour Lake | 74,496 | 117,027 | — | — | ||||||||||||
| Macassa | 12,089 | 31,634 | 765 | 1,592 | ||||||||||||
| Ontario | 86,585 | 148,661 | 765 | 1,592 | ||||||||||||
| Meliadine | 18,218 | 34,528 | 2,213 | 3,638 | ||||||||||||
| Meadowbank | 23,738 | 46,893 | — | — | ||||||||||||
| Nunavut | 41,956 | 81,421 | 2,213 | 3,638 | ||||||||||||
| Fosterville | 24,982 | 47,522 | 422 | 918 | ||||||||||||
| Australia | 24,982 | 47,522 | 422 | 918 | ||||||||||||
| Kittila | 20,279 | 33,446 | 1,313 | 2,295 | ||||||||||||
| Finland | 20,279 | 33,446 | 1,313 | 2,295 | ||||||||||||
| Pinos Altos | 11,287 | 20,043 | 1,326 | 1,537 | ||||||||||||
| Mexico | 11,287 | 20,043 | 1,326 | 1,537 | ||||||||||||
| Other | 436 | 2,497 | 59 | (914 | ) | |||||||||||
| Total Sustaining Capital Expenditures | $ | 236,950 | $ | 433,542 | $ | 8,843 | $ | 14,230 | ||||||||
| Development Capital Expenditures** | ||||||||||||||||
| LaRonde | $ | 21,636 | $ | 42,033 | $ | — | $ | — | ||||||||
| Canadian Malartic | 116,544 | 201,636 | 6,548 | 14,067 | ||||||||||||
| Goldex | 8,616 | 14,696 | 1,635 | 3,632 | ||||||||||||
| Quebec | 146,796 | 258,365 | 8,183 | 17,699 | ||||||||||||
| Detour Lake | 76,634 | 150,078 | 8,561 | 15,182 | ||||||||||||
| Detour Lake underground | 14,109 | 18,375 | 26,686 | 38,960 | ||||||||||||
| Macassa | 39,500 | 64,010 | 9,501 | 18,320 | ||||||||||||
| Upper Beaver | 17,703 | 25,019 | 1,210 | 17,805 | ||||||||||||
| Ontario | 147,946 | 257,482 | 45,958 | 90,267 | ||||||||||||
| Meliadine | 20,271 | 38,645 | 4,148 | 8,329 | ||||||||||||
| Meadowbank | 10,337 | 19,511 | 29 | 51 | ||||||||||||
| Hope Bay | 116,843 | 148,607 | 26,084 | 39,918 | ||||||||||||
| Nunavut | 147,451 | 206,763 | 30,261 | 48,298 | ||||||||||||
| Fosterville | 6,909 | 11,223 | 4,545 | 8,022 | ||||||||||||
| Australia | 6,909 | 11,223 | 4,545 | 8,022 | ||||||||||||
| Kittila | 1,101 | 2,047 | 2,656 | 5,256 | ||||||||||||
| Finland | 1,101 | 2,047 | 2,656 | 5,256 | ||||||||||||
| Pinos Altos | 3,832 | 5,653 | 12 | 23 | ||||||||||||
| San Nicolás (50%) | 3,241 | 4,567 | 1,238 | 2,629 | ||||||||||||
| Mexico | 7,073 | 10,220 | 1,250 | 2,652 | ||||||||||||
| Other | 4,998 | 8,464 | — | — | ||||||||||||
| Total Development Capital Expenditures | $ | 462,274 | $ | 754,564 | $ | 92,853 | $ | 172,194 | ||||||||
| Total Capital Expenditures | $ | 699,224 | $ | 1,188,106 | $ | 101,696 | $ | 186,424 | ||||||||
| * | Excludes capitalized exploration | |
| ** | Sustaining capital expenditures and development capital expenditures are non-GAAP measures that are not standardized measures under IFRS Accounting Standards. For a description of the composition and usefulness of these non-GAAP measures and a reconciliation to the most comparable measure prepared in accordance with IFRS Accounting Standards, see Note Regarding Certain Measures of Performance below. |
8
2026 Guidance
As previously disclosed on July 2, 2026, the Company expects full year 2026 production to be near the lower end of its previously disclosed guidance range of 3.3 million to 3.5 million ounces of gold, reflecting the preliminary redesign of the Barnat open pit at Canadian Malartic. Estimated full year total cash costs per ounce and AISC per ounce guidance for 2026 remains unchanged at $1,020 to $1,120 and $1,400 to $1,550, respectively. Refer to the "Abitibi Region, Quebec" section below for further updates on the Barnat open pit.
Total capital expenditures for 2026 (excluding capitalized exploration) are now expected to be between $2.6 billion and $2.8 billion, compared with previous guidance of $2.2 billion to $2.4 billion, reflecting the approval of construction activities at Hope Bay announced on May 19, 2026. Capitalized exploration guidance for 2026 remains unchanged at $290 million to $330 million.
9
A summary of the Company's guidance is set out below.
2026 Guidance Summary
($ millions, unless otherwise stated)
| 2026 | 2026 | |||||||||||
| Guidance Range | Mid-Point | |||||||||||
| Gold production (thousands of ounces) | 3,300 | 3,500 | 3,400 | |||||||||
| Total cash costs per ounce8 | $ | 1,020 | $ | 1,120 | $ | 1,070 | ||||||
| AISC per ounce8 | $ | 1,400 | $ | 1,550 | $ | 1,475 | ||||||
| Capital expenditures8 (excluding capitalized exploration) | $ | 2,605 | $ | 2,825 | $ | 2,715 | ||||||
| Capitalized exploration | $ | 290 | $ | 330 | $ | 310 | ||||||
| Capital expenditures (including capitalized exploration) | $ | 2,895 | $ | 3,155 | $ | 3,025 | ||||||
| Exploration and corporate development* | $ | 275 | $ | 305 | $ | 290 | ||||||
| Depreciation and amortization expense | $ | 1,550 | $ | 1,750 | $ | 1,650 | ||||||
| General and administrative expense** | $ | 230 | $ | 260 | $ | 245 | ||||||
| Other costs*** | $ | 75 | $ | 95 | $ | 85 | ||||||
| NTI Payment9 | $ | 185 | $ | 195 | $ | 190 | ||||||
| Cash taxes | $ | 3,400 | $ | 3,600 | $ | 3,500 | ||||||
| Effective tax rate (%) | 34 | % | 36 | % | 35 | % | ||||||
| * | 2026 Guidance includes $185 million to $205 million related to exploration and $90 million to $100 million related to corporate development | |
| ** | 2026 Guidance includes share-based compensation, expected to be between $65 million and $75 million. General and administrative expense is expected to fluctuate based on changes in the Company's share price, which affects the costs related to stock-based compensation. | |
| *** | 2026 Guidance includes $35 million to $45 million related to site maintenance costs primarily at Hope Bay and Northern Territory in Australia and $40 million to $50 million related to remediation expenses and other miscellaneous costs |
Cash Taxes
The Company's expected effective tax rate continues to be approximately 34% to 36% for the full year 2026. Total cash taxes paid in the second quarter of 2026 were $623 million. For the first half of 2026, total cash taxes paid were $2.4 billion, which included a $1.3 billion payment in the first quarter of 2026 for the remaining cash tax liability for 2025. This represents approximately 70% of total cash taxes expected for 2026. The remaining cash taxes in 2026 are expected to be paid in quarterly installments ranging between $525 million and $575 million.
Cost Considerations Amid Continued Market Uncertainty
The Company does not currently anticipate any significant risk of disruption to fuel, consumables or parts supplies across its operations and anticipates that any volatility of fuel and commodity prices and currency exchange rates from ongoing geopolitical uncertainty will be captured within its 2026 cost guidance ranges.
8 The Company's guidance for total cash costs per ounce, AISC per ounce and capital expenditures is forward-looking non-GAAP information. For a description of the composition and usefulness of these non-GAAP measures and a discussion of revisions that have been made by the Company to the composition of certain of these measures, see Note Regarding Certain Measures of Performance below.
9 The "NTI Payment" is the payment to Nunavut Tunngavik Inc. ("NTI") under the Company's mineral production lease in respect of the Amaruq mine at Meadowbank, which is based on net profits, subject to a minimum profit margin. NTI Payments in this table are reflected on a cash basis with 2026 Guidance based on a gold price assumption of $4,500 per ounce.
10
The Company's full year 2026 cost guidance is based on an assumed diesel benchmark price of $0.78 per litre (excluding transportation and taxes). With the commencement of the 2026 sealift subsequent to the quarter, the Company has purchased approximately 70% of its diesel requirements for its Nunavut operations for the balance of 2026 and through to the 2027 sealift, representing approximately 130 million litres of diesel. These purchases were made at prices approximately 30% higher than budgeted for 2026, net of hedges. The Company expects to complete its purchase of its remaining Nunavut diesel requirements in the third quarter of 2026 and will continue to monitor market conditions and opportunistically add to its diesel hedges. These purchases are expected to reduce the Company's exposure to diesel price volatility for the remainder of 2026 and into 2027.
Diesel represents approximately 10% of the Company's operating costs, comprising approximately 7% related to direct consumption for mobile equipment and on-site power generation, and approximately 3% related to transportation and freight. Taking into account the diesel purchased to date as part of the 2026 sealift, the Company estimates that a 10% change in diesel prices would impact total cash costs per ounce by approximately $4 for the second half of 2026. For indirect diesel exposure related to transportation, a 10% change in diesel prices is estimated to impact total cash costs per ounce by approximately $2.
The Company's full year 2026 cost guidance is based on assumed exchange rates of 1.36 C$/US$, 1.18 US$/EUR, 1.40 A$/US$ and 17.50 MXN/US$.
Based on its C$/US$ exchange rate assumption for 2026 cost estimates, the Company has hedged approximately 60% of its estimated remaining Canadian dollar exposure for 2026 at an average floor price providing protection in respect of exchange rate movements below 1.38 C$/US$, while allowing for participation in respect of exchange rate movements up to an average of 1.42 C$/US$.
The stronger US dollar, combined with higher by-product metal prices, particularly for silver and copper, have helped mitigate the impact of diesel price inflationary pressures compared to the Company's full year 2026 cost guidance. The Company will continue to monitor market conditions and anticipates continuing to opportunistically add to its operating currency and diesel hedges to strategically support its key input costs for 2026.
Tariffs
The international trade disputes set in motion in February 2025 by US tariffs, retaliatory tariffs and other actions remain fluid. The Company continues to believe that its revenue structure will be largely unaffected by the tariffs as its gold production is mostly refined in Canada, Australia or Europe. Accordingly, the cost guidance provided in this news release does not include any potential further impact from such tariffs or trade disputes. The Company continues to monitor its exposure to the tariffs and trade disputes and its alternatives to inputs sourced from suppliers that are or may become subject to the tariffs or other trade disputes.
Strong Net Cash Position Supports Increase in Shareholder Returns
Cash and cash equivalents increased by $352 million from the prior quarter, primarily due to cash provided by operating activities resulting from strong operating margins (higher gold sales volume, partially offset by lower realized gold prices) and $261 million of proceeds received from the sale of equity securities. The increase was partially offset by $809 million of capital expenditures (including working capital adjustments), $625 million returned to shareholders during the quarter through dividends and share repurchases under the NCIB and $578 million related to the acquisition of properties in Finland.
As at June 30, 2026, the Company's total long-term debt was $197 million, consistent with the prior quarter. No amounts were outstanding under the Company's unsecured revolving bank credit facility as at June 30, 2026 and available liquidity under the facility remained at approximately $2 billion, not including the uncommitted $1 billion accordion feature.
Net cash increased to $3,267 million in the second quarter of 2026 compared to the prior quarter balance of $2,915 million due to the increase in cash and cash equivalents of $352 million.
11
In April 2026, Fitch Ratings upgraded the Company's investment grade credit rating to A- with a Stable Outlook, reflecting the Company's strong operating profile, favourable low-cost position and sustained commitment to a strengthening balance sheet. In July, Moody's Ratings completed a periodic review and maintained the Company's A3 Stable Outlook investment grade credit rating, highlighting the Company’s strong scale, low leverage, mine diversity in favourable mining jurisdictions and conservative financial policies. The Company strives to maintain a strong financial position and investment grade balance sheet.
Shareholder Returns
The Company remains committed to delivering strong returns to shareholders in 2026 through a combination of the dividend and share repurchases under the NCIB, with a target to return approximately 40% of annual free cash flow to shareholders, assuming current gold prices and subject to operational needs.
The Company continues to evaluate opportunities to reduce the dilution associated with the acquisition of Rupert Resources Ltd., including potentially using the proceeds from portfolio investment sales to fund share repurchases under the NCIB. In the second quarter of 2026, proceeds received from the sale of equity securities were $261 million, which supported increased share repurchase activity and record shareholder returns for the quarter.
Normal Course Issuer Bid
The Company renewed the NCIB for another year in May 2026 on substantially the same terms which is subject to a maximum of 5% of the issued and outstanding common shares. The Company also increased its internal limit on purchases of common shares to $2 billion. Purchases under the NCIB may continue for up to one year from its commencement on May 6, 2026.
In the second quarter of 2026, the Company repurchased 2,235,947 common shares under the NCIB at an average price of $178.86 per share for aggregate purchases of $400 million. In the first six months of 2026, the Company repurchased 2,957,158 common shares under the NCIB at an average price of $185.89 per share for aggregate purchases of $550 million.
The Company believes that the NCIB is a flexible and effective complementary tool that, together with the quarterly dividend, is part of the Company's overall capital allocation program and generates value for shareholders.
Dividend Record and Payment Dates for the Third Quarter of 2026
The Company's Board of Directors has declared a quarterly cash dividend of $0.45 per common share, payable on September 15, 2026 to shareholders of record as of September 1, 2026. Agnico Eagle has declared a cash dividend every year since 1983.
Expected Dividend Record and Payment Dates for the 2026 Fiscal Year
| Record Date | Payment Date |
| March 2, 2026 | March 16, 2026* |
| June 1, 2026 | June 15, 2026* |
| September 1, 2026 | September 15, 2026** |
| December 1, 2026 | December 15, 2026 |
| * | Paid |
| ** | Declared |
12
Dividend Reinvestment Plan
For information on the Company's dividend reinvestment plan, see Dividend Reinvestment Plan.
International Dividend Currency Exchange
For information on the Company's international dividend currency exchange program, please contact Computershare Trust Company of Canada by phone at 1.800.564.6253 or online at www.investorcentre.com or www.computershare.com/investor.
Commitment to Sustainability – Second Quarter 2026 Highlights
| · | Continued focus on health and safety performance |
| ◦ | The Company continued to reinforce its safety culture during the quarter, implementing a global safety reset across all operations following the fatal accidents at Canadian Malartic in April 2026 as previously disclosed in the news release dated April 30, 2026 and at Upper Beaver in May 2026. Through engagement with employees and contractors, the Company reaffirmed its core commitment that the safety of its workforce should take precedence over all other objectives. Ongoing initiatives include accelerating the identification and implementation of critical controls to mitigate major hazards and reinforcing organizational behaviours that promote a continued focus on creating and sustaining an injury and fatality-free workplace |
| ◦ | The Canadian Institute of Mining, Metallurgy and Petroleum awarded Detour Lake the John T. Ryan Safety Trophy, highlighting outstanding safety performance among mines in Eastern Canada |
| · | Supporting communities in Nunavut through investment and engagement |
| ◦ | In May 2026, the Company announced the extension of its partnership with the Nunavut Housing Corporation under the Nunavut 3000 initiative. This partnership commits more than C$10 million over five years to support the annual shipment of approximately 22 to 25 housing units across the Kitikmeot and Kivalliq regions. Building on the successful delivery of 20 housing units in 2025, the initiative continues to address one of Nunavut's most pressing challenges by improving access to affordable housing. The Company also renewed its five-year, C$5 million partnership with the Breakfast Club of Canada program in Nunavut, supporting daily access to nutritious breakfast programs for over 5,000 students in 22 schools across the Kitikmeot and Kivalliq regions, helping improve attendance, learning outcomes and overall well-being while investing in the next generation of the territory's workforce |
| ◦ | The Company launched season two of its award-winning podcast, The Arctic Edge, featuring stories and perspectives from Nunavut and Canada's Arctic. Season two explores themes including sovereignty, food security, housing, energy and community-driven growth, while continuing to amplify northern and Indigenous voices. The podcast reinforces the Company's commitment to advancing meaningful dialogue and promoting a deeper understanding of the North's rich cultural heritage and growing importance to Canada's future |
| · | Reconciliation Action Plan ("RAP") Progress Report published – In June 2026, the Company released its inaugural RAP Progress Report, covering progress through 2024 and 2025 and reinforcing its commitment to transparency, accountability and meaningful reconciliation with Indigenous Peoples across its operations |
| ◦ | Since the RAP was released in 2024, the Company's employees have completed over 8,300 hours of Indigenous cultural awareness training and the Company has signed six new agreements with Indigenous Rights-holders, increasing the total number of active agreements to 23 |
13
| ◦ | In 2024 and 2025, the Company led the Canadian mining sector with C$346 million in direct financial contributions to Indigenous Nations. Globally, the Company made C$378 million in direct financial contributions to Indigenous Nations and awarded over C$3 billion in contracts to Indigenous businesses |
| ◦ | In 2025, the Company established an Indigenous Advisory Committee, comprised of Indigenous leaders whose expertise supports the ongoing implementation of the RAP |
| ◦ | All of the Company's operations achieved AA or AAA ratings in 2024 and 2025 under the Towards Sustainable Mining Indigenous and Community Relationships protocol |
| ◦ | The Company's RAP Progress Report can be accessed here |
Key Value Drivers – Advancing the Next Phase of Growth
The Company is advancing a disciplined growth strategy aimed at enhancing the gold production profile in the short-term and supporting a pathway to increase annual gold production by 20% to 30% over the next decade, with a first step-up in production expected in 2030 and the potential to exceed 4.0 million ounces in the early 2030s. The growth is anchored in the expansions of Canadian Malartic and Detour Lake, as well as the construction of Upper Beaver, Hope Bay and San Nicolás, which are located in regions where the Company operates and has technical expertise, established community relationships, existing infrastructure and established supply chains, supporting compelling risk-adjusted returns.
The forecast parameters surrounding certain projects, including Detour Lake underground, Upper Beaver, Hope Bay and the "fill-the-mill" strategy at Canadian Malartic (Odyssey Shaft #1, Odyssey Shaft #2, Marban, Wasamac), were based on internal evaluations, which are preliminary in nature and include inferred mineral resources. For further information see Notes to Investors Regarding Certain Project Evaluations below.
Canadian Malartic – Potential for 400,000 to 500,000 ounces of incremental annual gold production
The Company continues to advance the transition to underground mining with the construction of the Odyssey mine, including the development of Odyssey Shaft #1. The Company is also advancing internal evaluations on three projects that, together, have the potential to increase annual gold production towards one million ounces starting as early as 2033. These projects include (i) a second shaft at Odyssey, (ii) the development of a satellite open pit at Marban, and (iii) the development of the Wasamac underground project. Marban and Wasamac are located approximately 12 kilometres and 100 kilometres from the Canadian Malartic mill, respectively. The Company believes that the rock mass movement that occurred at the Barnat open pit at Canadian Malartic on July 1, 2026, will not affect the development or production outlook for the Odyssey mine. Refer to the "Abitibi Region, Quebec" section below for further updates on the Barnat open pit.
Odyssey Development
In the second quarter of 2026, mine development remained focused on advancing the main ramp, which reached a depth of 1,190 metres as of June 30, 2026, the excavation of the ventilation raises, the development of the East Gouldie production levels and the excavation of the first loading station infrastructure. While development rates were affected by higher ground support requirements and increased material handling demands at depth, the Company continued to advance key productivity initiatives, including haul truck payload optimization, the ongoing truck conversion to enable autonomous hauling, expanded use of automated development equipment and testing of a fleet management system. With these initiatives, the Company expects to achieve its targeted development rate of approximately 2,000 metres per month in the fourth quarter of 2026. The excavation of the first ventilation raise from surface to level 58 was completed during the quarter, with the commissioning of the main exhaust fan station now expected in the third quarter of 2026.
14
Construction of the first loading station at Shaft #1 between levels 102 and 111 continued during the quarter, with completion of the crusher concrete pilasters and the start of structural installation. Upcoming activities include the installation of the crusher and apron feeders, as well as the development of the loading conveyor area. Development and construction activities remain on schedule to support the planned start of shaft-hoisted production from East Gouldie in the second quarter of 2027. The first phase of shaft sinking was nearly completed, with the last bench taken on July 9, 2026, reaching a depth of 1,586 metres. The headframe changeover is expected to start in the third quarter of 2026, following the excavation of level 158. A second phase of sinking is expected to commence in 2029 with completion in 2031, extending the shaft to its final expected depth of 1,870 metres. The third loading station, located between levels 172 and 181, is expected to be completed and commissioned in 2031.
Construction of key surface infrastructure progressed, with the operational complex completed during the quarter. Phase two of the paste plant (designed for 20,000 tonnes per day ("tpd") capacity) remains on schedule for completion in the first half of 2027 to support production start-up from the shaft. Assembly of the production hoist commenced in the second quarter of 2026, with the fixed and clutch drum assemblies completed and the 12,000-horsepower variable frequency drive and transformers installed. Commissioning of the production hoist is expected in the second quarter of 2027.
Odyssey Shaft #2
The Company is advancing an internal technical evaluation of a potential second shaft at the Odyssey mine. Drilling of the geotechnical pilot hole at the planned location has been completed to a depth of 1,800 metres. Current work is focused on mine design, planning and geotechnical analysis to support a higher mining rate, surface layout, headframe design and preparatory activities to support the permitting process. The evaluation is expected to be completed in the fourth quarter of 2026.
Exploration at Odyssey
During the second quarter of 2026, 10 surface rigs and seven underground rigs were in operation at the Odyssey mine, drilling a total of 42,743 metres. This was supplemented by an additional three surface rigs, completing 13,789 metres of drilling dedicated to regional exploration around Canadian Malartic, including the Marban project.
Exploration drilling targeted multiple areas of the Odyssey mine, continuing to return positive results in the upper eastern and deeper areas of the East Gouldie deposit and in the internal zones of the Odyssey deposit.
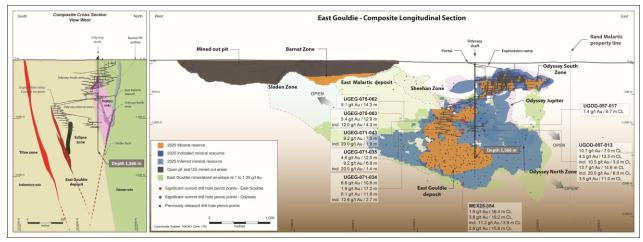
In the upper eastern extension of the East Gouldie deposit, underground drilling returned several high-grade results, including hole UGEG-075-062 intersecting 5.1 g/t gold over 14.3 metres at 916 metres depth; and hole UGEG-071-034 intersecting 6.6 g/t gold over 10.8 metres at 1,046 metres depth and 6.1 g/t gold over 11.6 metres at 1,133 metres depth. This portion of the deposit has the potential to offer a second mining area in the upper levels of the mine that would provide additional operational flexibility and potentially higher grade material than the current average mineral reserve grade of the East Gouldie deposit.
Hole MEX25-354 was drilled as a pilot hole for the proposed Shaft #2 and extended a further 300 metres during the second quarter to test the lower limit of the East Gouldie deposit where it intersected 1.9 g/t gold over 16.4 metres (core length, true width undetermined) at 1,917 metres depth, 3.8 g/t gold over 19.2 metres (core length) at 1,951 metres depth, including 11.2 g/t gold over 3.8 metres (core length) at 1,945 metres depth, and 2.6 g/t gold over 15.8 metres (core length) at 1,978 metres depth. The results further demonstrate the potential for additional mineralization at depth in the East Gouldie deposit in proximity to planned infrastructure.
15
Conversion drilling in the Odyssey deposit encountered significant mineralization in the lower portion of the porphyry in the newly identified Artemis zone within the Odyssey internal zones. Results from the Artemis zone were highlighted by hole UGOD-057-013 intersecting 10.7 g/t gold over 7.0 metres (core length) at 1,039 metres depth, 4.5 g/t gold over 13.5 metres (core length) at 1,057 metres depth and 13.7 g/t gold over 14.6 metres (core length) at 1,078 metres depth; and hole UGOD-057-017 intersecting 7.4 g/t gold over 6.7 metres (core length) at 1,003 metres depth. Ongoing drilling at Artemis is expected to further enhance the geological understanding of this new zone.
Selected recent drill intersections from the Odyssey mine are set out in the composite longitudinal section below and in a table in the Appendix.
[Odyssey – Composite Cross and Longitudinal Sections]
Marban
At the Marban deposit, located approximately 12 kilometres from the Canadian Malartic mill, the Company envisions the potential development of a satellite open pit operating at a planned mining rate between 14,000 to 16,000 tpd and producing approximately 120,000 to 150,000 ounces of gold annually over a mine life of approximately 12 years with the potential for initial production as early as 2033.
During the second quarter of 2026, the conversion and condemnation drilling program in the northern and eastern extensions of the Marban deposit was completed and a new drilling program commenced that is targeting deeper mineralization northwest of the main Marban deposit. Exploration, conversion, condemnation and geotechnical drilling at Marban during the first half of 2026 totalled 28,390 metres in 98 holes.
Wasamac
At Wasamac, the Company envisions an underground satellite operation with a planned mining rate of approximately 3,200 tpd. Ore is expected to be transported to the Canadian Malartic mill for processing, with average annual gold production expected to be approximately 90,000 ounces with the potential for initial production as early as 2033. In the second quarter of 2026, the Company continued to advance optimization and trade-off studies alongside permitting activities and engagement with stakeholders.
Detour Lake – Potential for 300,000 to 350,000 ounces of incremental annual gold production
In the second quarter of 2026, 316 metres of lateral development were completed, for a total of 1,263 metres completed to-date, including development of the exploration ramp which reached a depth of 180 metres as of June 30, 2026. The Company is ramping up its workforce and integrating additional equipment in preparation for the commencement of multi-face development expected to begin in the third quarter of 2026. Extension of the exploration ramp to the planned bulk-sampling location at level 200 is expected to be completed in the first half of 2027. The Company expects to provide a project update in 2027, including the potential to begin underground production from the West Extension zone as early as 2028.
16
Other activities supporting the underground project during the second quarter of 2026 include overburden excavation for the conveyor ramp portal near the mill, with underground ramp development planned to begin in the first half of 2027. Work also progressed on the camp expansion and detailed engineering for the paste plant, ore-handling system, underground infrastructure and electrical infrastructure, with a focus on the procurement of long lead items.
At Detour Lake during the second quarter of 2026, exploration drilling from surface using nine drill rigs totalled 52,763 metres (91,815 metres during the first half of 2026). The program continued to expand and infill the mineralization below and to the west of the mineral resource pit. The first underground drill rig was mobilized in the exploration ramp in March 2026, with underground exploration drilling totalling 2,130 metres during the second quarter (2,856 metres during the first half of 2026). A second underground drill rig is planned to be added in the fourth quarter of 2026.
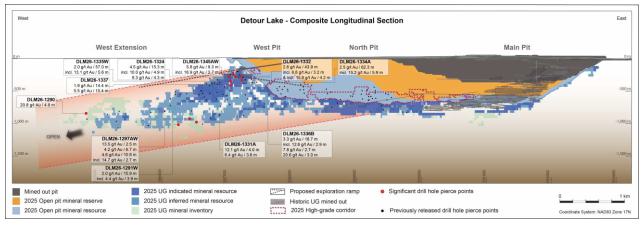
The Company continued the high-intensity drilling program targeting Domain 54 in the West Pit zone during the second quarter to validate the continuity of mineralization and improve the accuracy of the geological model to complement the planned bulk sample at level 200. Highlights from this drilling included hole DLM26-1334AW intersecting 2.5 g/t gold over 62.3 metres at 275 metres depth, including 15.2 g/t gold over 5.9 metres at 264 metres depth; and hole DLM26-1324 intersecting 4.5 g/t gold over 15.3 metres at 229 metres depth, including 10.0 g/t gold over 4.9 metres at 233 metres depth, and 8.3 g/t gold over 4.3 metres at 268 metres depth.
Drilling in the West Extension zone, approximately 1.0 kilometre west of the resource-pit outline, continued to extend the underground mineral potential to the west with highlights of hole DLM26-1297A intersecting 13.5 g/t gold over 2.5 metres at 564 metres depth, 4.2 g/t gold over 6.7 metres at 610 metres depth and 4.6 g/t gold over 10.8 metres at 902 metres depth, including 14.7 g/t gold over 2.7 metres at 899 metres depth.
Drilling that tested the West Extension zone, approximately 2.3 kilometres west of the resource-pit outline, was highlighted by hole DLM26-1290 intersecting 20.8 g/t gold over 4.8 metres at 836 metres depth.
Selected recent drill intersections from Detour Lake are set out in the composite longitudinal section below and in a table in the Appendix.
[Detour Lake – Composite Longitudinal Section]
17
Upper Beaver – Potential for 200,000 to 225,000 ounces of annual gold production and 3,600 tonnes of copper
Located approximately 20 kilometres from the Company's Macassa mine, the Upper Beaver project is envisioned as a standalone mine and mill, with the potential to produce 200,000 to 225,000 ounces of gold and 3,600 tonnes of copper per year, based on a planned mining and milling rate of 5,000 tpd.
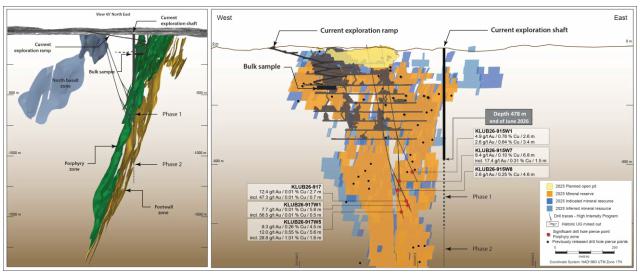
Development activities continued to progress well in the second quarter of 2026, with the exploration ramp and exploration shaft reaching depths of 165 metres and of 478 metres, respectively, as at June 30, 2026.
The high-intensity exploration drilling program at Upper Beaver was completed during the second quarter of 2026. The program was completed at a 20-metre spacing and focused on a portion of the Upper Beaver deposit between approximately 500 to 600 metres depth dominated by vein systems representative of the larger deposit. The primary objective of the high-intensity drilling is to validate the mineral resource model and assess grade-variability within the most representative geological zones. The high-intensity drilling program is expected to complement the planned bulk sample at the 760-metre level and has the potential to bring forward initial production to early 2030.
The high-intensity drilling program started with zone 201 in late 2025 and continued with zone 107 during the first half of 2026. Recent highlights from zone 107 include hole KLUB26-915W7 intersecting 8.4 g/t gold and 0.10% copper over 6.8 metres at 558 metres depth, including 17.4 g/t gold and 0.31% copper over 1.5 metres at 561 metres depth; and hole KLUB26-917W5 intersecting 8.3 g/t gold and 0.26% copper over 4.5 metres at 682 metres depth and 12.0 g/t gold and 0.55% copper over 5.6 metres at 691 metres depth, including 28.8 g/t gold and 1.01% copper over 1.6 metres at 692 metres depth.
With the high-intensity drilling program now completed, an internal review of the results is underway that will include analysis of any impact on the deposit model and on the mineral reserves and mineral resources estimate.
The Company is also evaluating an expanded exploration program, including extending the shaft to a depth of 1,220 metres, as contemplated in the 2024 internal evaluation, and establishing additional drill stations to support infill and potential mineral resource expansion in the lower portion of the deposit. The Company expects to provide a project update in 2027.
Selected recent drill intersections from Upper Beaver are set out in the composite longitudinal section below and in a table in the Appendix.
[Upper Beaver – Composite Cross and Longitudinal Sections]
18
Hope Bay – Potential for 400,000 to 435,000 ounces of annual gold production
On May 19, 2026, the Company announced a positive investment decision for the Hope Bay project, supported by a preliminary economic assessment (the "Study") envisioning an underground mining operation with a 6,000 tpd processing facility. The Study outlined estimated annual gold production of 400,000 to 435,000 ounces over an initial 11-year mine life and demonstrated strong economics, including an after-tax IRR of greater than 20% at a gold price of $4,000 per ounce. With only 55% of the total measured mineral resources and indicated mineral resources and 48% of the total inferred mineral resources included in the mine plan, the project offers significant long-term growth potential supported by ongoing exploration across the highly prospective 80-kilometre greenstone belt extending from the Doris mine to the Boston deposit. Refer to the Company news release dated May 19, 2026, for further details.
During the quarter, detailed engineering continued to advance, reaching approximately 67% completion as of June 30, 2026, with a focus on reducing execution risk and refining capital cost estimates. Planning and procurement activities also progressed as scheduled in preparation for the upcoming sealift season, with 73% of 2026 procurement completed and on track to support the first sealift, expected in August 2026.
Construction activities at Hope Bay continued to advance during the quarter. At Doris, work progressed on upgrades to the camp and office facilities, as well as construction of the power plant foundations. At Madrid, mine development advanced by 707 metres during the quarter, with the Naartok East ramp reaching a depth of 125 metres and the Naartok West ramp reaching a depth of 105 metres. Development of the dewatering infrastructure at Naartok East remains on schedule and is progressing ahead of the planned start of the Suluk ramp. Infrastructure and ramp development will continue through 2026, with a total of 3.3 kilometres planned. At Patch 7, excavation of the portal boxcut for the dedicated ramp was completed and ramp development began in July. A total of 393 metres of development is planned at Patch 7 for 2026.
Exploration and conversion drilling at Hope Bay totalled 36,740 metres during the second quarter (69,400 metres during the first half of 2026), utilizing up to six surface drill rigs at the Madrid and Boston deposits. Activities were primarily focused on the Patch 7 and Suluk zones of the Madrid deposit, including 30,557 metres of conversion drilling and 2,913 metres of mineral-resource expansion drilling.
At Patch 7, recent highlights from the conversion drilling included HBM26-466 intersecting 13.7 g/t gold over 15.4 metres at 609 metres depth, HBM26-478A intersecting 15.2 g/t gold over 15.6 metres at 710 metres depth and HBM26-481 intersecting 18.5 g/t gold over 11.3 metres at 328 metres depth. Exploration drilling returned highlight hole HBM26-469 intersecting 31.6 g/t gold over 3.8 metres at 852 metres depth in one of the deepest intersections of the Patch 7 zone to date.
Drilling into the Suluk zone was highlighted by hole HBM26-464 intersecting 6.7 g/t gold over 8.9 metres at 129 metres depth, further demonstrating the potential for mineral resource expansion at shallow depths near planned infrastructure.
These results are expected to contribute positively to the mineral resource estimate and updated prefeasibility study planned to be completed at year-end 2026.
Selected recent drill intersections from the Madrid deposit are set out in the composite longitudinal section below and in a table in the Appendix.
19
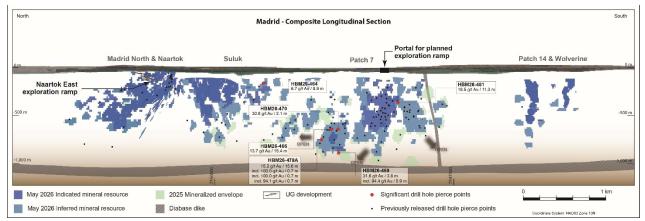
[Madrid Deposit at Hope Bay – Composite Longitudinal Section]
In the second quarter of 2026, the Company started its first exploration drill program at the Boston deposit since acquiring Hope Bay in 2021. The Boston deposit is located approximately 50 kilometres south of Madrid and was not included in the Study. The program is progressing well, with 3,270 metres completed to date. Total drilling in 2026 is now expected to be approximately 6,500 metres in eight holes due to strong drilling productivity.
San Nicolás Copper Project (50/50 joint venture with Teck Resources Limited)
Minas de San Nicolás ("MDSN") received the land use change (ETJ) and the environmental impact assessment (MIA-R) permits in July 2026, marking an important milestone for the responsible development of the San Nicolás Project. MDSN acknowledges the detailed and exhaustive work of the Mexican authorities throughout the permitting process and remains committed to regulatory compliance, environmental stewardship and creating shared value for local communities. MDSN is now expected to advance the additional permits, authorizations and licenses required under Mexican law before construction or operations can commence.
Concurrently, MDSN continues to advance detailed engineering and critical infrastructure work designed to reduce execution risk and refine capital costs estimates, while accelerating construction and operational readiness activities to position the project for a potential sanction decision, subject to the receipt of the required permits and authorizations.
Drilling activities are continuing with a focus on condemnation drilling and geological evaluation in proximity to the projected mine area.
Second Quarter 2026 Operating Results
Regional operating statistics and highlights for the second quarter of 2026 are set out below. See the MD&A under the caption "Financial and Operating Results" for a variance analysis on gold production, production costs, minesite costs per tonne and total cash costs per ounce compared to the prior-year period.
20
ABITIBI REGION, QUEBEC
Gold Production for the First Half of 2026 in Line with Plan; Update on Barnat Operations; Record Quarterly Gold Production at Odyssey
Abitibi Quebec – Operating Statistics
| Three Months Ended June 30, 2026 | LaRonde | Canadian Malartic | Goldex | Consolidated Abitibi Quebec | ||||||||||||
| Tonnes of ore milled (thousands) | 713 | 4,387 | 817 | 5,917 | ||||||||||||
| Tonnes of ore milled per day | 7,835 | 48,209 | 8,978 | 65,022 | ||||||||||||
| Gold grade (g/t) | 3.80 | 1.06 | 1.35 | 1.43 | ||||||||||||
| Gold production (ounces) | 81,261 | 135,243 | 29,277 | 245,781 | ||||||||||||
| Production costs per tonne (C$) | C$ | 219 | C$ | 40 | C$ | 69 | C$ | 65 | ||||||||
| Minesite costs per tonne (C$)10 | C$ | 183 | C$ | 52 | C$ | 71 | C$ | 70 | ||||||||
| Production costs per ounce | $ | 1,390 | $ | 933 | $ | 1,394 | $ | 1,139 | ||||||||
| Total cash costs per ounce | $ | 953 | $ | 1,185 | $ | 1,081 | $ | 1,096 | ||||||||
| Six Months Ended June 30, 2026 | LaRonde | Canadian Malartic | Goldex | Consolidated Abitibi Quebec | ||||||||||||
| Tonnes of ore milled (thousands) | 1,489 | 9,094 | 1,630 | 12,213 | ||||||||||||
| Tonnes of ore milled per day | 8,227 | 50,243 | 9,006 | 67,476 | ||||||||||||
| Gold grade (g/t) | 3.67 | 1.13 | 1.35 | 1.47 | ||||||||||||
| Gold production (ounces) | 162,857 | 301,459 | 58,649 | 522,965 | ||||||||||||
| Production costs per tonne (C$) | C$ | 186 | C$ | 39 | C$ | 69 | C$ | 61 | ||||||||
| Minesite costs per tonne (C$) | C$ | 179 | C$ | 51 | C$ | 68 | C$ | 69 | ||||||||
| Production costs per ounce | $ | 1,234 | $ | 850 | $ | 1,378 | $ | 1,029 | ||||||||
| Total cash costs per ounce | $ | 990 | $ | 1,082 | $ | 998 | $ | 1,044 | ||||||||
Regional Highlights
| · | Gold production in the second quarter of 2026 was in line with plan at LaRonde and Goldex while gold production at Canadian Malartic was affected by an unscheduled 6-day mill shutdown related to the fatal accident in April. Despite the lower than expected gold production at Canadian Malartic in the second quarter of 2026, gold production for the first half of 2026 was in line with plan |
| · | At LaRonde, strong underground performance resulted in ore tonnes mined exceeding plan, primarily driven by positive reconciliation in the East Mine. The additional volumes are expected to support mill throughput during the planned underground maintenance shutdown in the third quarter of 2026 |
| · | At LaRonde, the Company continued to advance its automation initiatives, with approximately 25% of ore mucking completed using automated loaders during the first half of 2026. At LZ5, automated trucking performance continued to improve, achieving an average of approximately 2,030 tonnes per fully automated shift during June 2026. In addition, optimization initiatives enabled approximately 10% of total production to be completed between shifts, enhancing productivity and equipment utilization |
| · | At Odyssey, gold production was a record and in line with plan at 28,800 ounces, with production from East Gouldie ramping up during the quarter |
| · | At LaRonde, quarterly shutdowns are scheduled in the third and fourth quarters of 2026 for regular maintenance at the mill, each planned for four to five days. Canadian Malartic has four-day quarterly shutdowns planned in 2026 for regular maintenance at the mill. Goldex has two to three-day quarterly shutdowns planned for regular maintenance at the mill |
| · | An update on Odyssey and the "fill-the-mill" strategy is set out in the Key Value Drivers – Advancing the Next Phase of Growth section above |
10 Minesite costs per tonne is a non-GAAP measure that is not standardized under IFRS Accounting Standards. For a description of the composition and usefulness of this non-GAAP measure and a reconciliation to production costs see Note Regarding Certain Measures of Performance below.
21
Update on Barnat Open Pit at Canadian Malartic
| · | On July 1, 2026, a rock mass movement occurred along the north wall of the Barnat open pit as previously disclosed in the news release dated July 2, 2026. The area affected was, at the time, subject to enhanced geotechnical monitoring and no injuries, equipment damage or environmental impacts resulted from the event. As a precautionary measure and prior to the rock mass movement, the Company temporarily suspended mining operations in the Barnat open pit, while completing geotechnical assessments and implementing remediation measures to support the safe and orderly resumption of mining activities |
| · | The rock mass movement occurred in a localized area of the final north wall of the open pit and involved approximately one million tonnes of material. While the geotechnical investigation is still ongoing, the event is believed to have been caused by weaker altered rock and structures associated with the Cadillac Fault, with ground conditions further influenced by freshet and recent heavy rainfall |
| · | Under the current remediation plan, the moved rock mass material will remain in place and a safety rock catchment area and berm will be constructed along portions of the north wall. A new temporary access ramp alongside the southwest wall, completed in July 2026, will provide access to a redesigned open pit, with final pit and remediation designs currently being refined. Remediation work is expected to be completed in the third quarter of 2026, with mining activities anticipated to resume in the fourth quarter of 2026. Enhanced safety protocols, monitoring and action response plans will remain in place throughout the remediation period and following the resumption of mining activities |
| · | As reported on July 2, 2026, the event is expected to reduce gold production at Canadian Malartic by 60,000 to 80,000 ounces in the second half of 2026, and by up to 150,000 ounces in each of 2027 and 2028. Feed to the Canadian Malartic processing plant is being supplemented with low-grade ore from existing stockpiles, partially mitigating the production impact. Reflecting the lower production levels and remediation costs, total cash costs per ounce at Canadian Malartic are now expected to be approximately $1,260 for full year 2026, compared with prior guidance of $1,187. The Company continues to assess opportunities to further mitigate the impact on production and costs |
22
ABITIBI REGION, ONTARIO
Strong Mill Performance and Higher Grades Support Gold Production at Detour Lake; Record Quarterly Mill Throughput at Macassa for Second Consecutive Quarter
Abitibi Ontario – Operating Statistics
| Three Months Ended June 30, 2026 | Detour Lake | Macassa | Consolidated Abitibi Ontario | |||||||||
| Tonnes of ore milled (thousands) | 7,305 | 236 | 7,541 | |||||||||
| Tonnes of ore milled per day | 80,275 | 2,593 | 82,868 | |||||||||
| Gold grade (g/t) | 0.97 | 10.96 | 1.28 | |||||||||
| Gold production (ounces) | 207,279 | 80,143 | 287,422 | |||||||||
| Production costs per tonne (C$) | C$ | 29 | C$ | 413 | C$ | 41 | ||||||
| Minesite costs per tonne (C$) | C$ | 33 | C$ | 492 | C$ | 47 | ||||||
| Production costs per ounce | $ | 741 | $ | 877 | $ | 779 | ||||||
| Total cash costs per ounce | $ | 825 | $ | 1,041 | $ | 885 | ||||||
| Six Months Ended June 30, 2026 | Detour Lake | Macassa | Consolidated Abitibi Ontario | |||||||||
| Tonnes of ore milled (thousands) | 14,053 | 385 | 14,438 | |||||||||
| Tonnes of ore milled per day | 77,641 | 2,127 | 79,768 | |||||||||
| Gold grade (g/t) | 0.93 | 11.33 | 1.21 | |||||||||
| Gold production (ounces) | 384,298 | 135,736 | 520,034 | |||||||||
| Production costs per tonne (C$) | C$ | 32 | C$ | 512 | C$ | 44 | ||||||
| Minesite costs per tonne (C$) | C$ | 34 | C$ | 557 | C$ | 48 | ||||||
| Production costs per ounce | $ | 838 | $ | 1,052 | $ | 894 | ||||||
| Total cash costs per ounce | $ | 894 | $ | 1,129 | $ | 955 | ||||||
Regional Highlights
| · | Regional gold production for the quarter was led by Detour Lake. Strong production at Detour Lake was driven by a higher grade sequence and a strong mine and mill performance. At Macassa, the mill achieved record quarterly throughput for the second consecutive quarter |
| · | At Detour Lake, a record of 30.6 million tonnes of ore and waste were extracted from the open pit, driven by higher rope shovel utilization and availability. Mill performance remained strong, with record tonnes of ore milled per day of 80,275 and mill runtime at approximately 96%, higher than anticipated, with the seven-day planned shutdown completed in July |
| · | At Macassa, commissioning of the new 3,600 tpd paste plant progressed during the quarter, including underground distribution system testing, operator training, and process calibration. The plant is operational and undergoing final optimization activities, with full transition of paste production from the existing plant expected during the third quarter of 2026 |
| · | Trucking of ore from the AK deposit to the LZ5 processing facility at LaRonde for milling commenced in the second quarter of 2026 following the permit amendment approval. The LZ5 mill processed 71,000 tonnes of ore from the AK deposit and produced 7,800 ounces of gold |
| · | Detour Lake has scheduled shutdowns for regular mill maintenance in the third and fourth quarters of 2026, each lasting seven days. Macassa has scheduled a five-day shutdown in the third quarter of 2026 for the replacement of the primary grinding mill liner, the annual overhaul of the crusher and other regular mill maintenance |
| · | Updates on the Detour Lake underground and Upper Beaver projects are set out in the Key Value Drivers – Advancing the Next Phase of Growth section above |
23
NUNAVUT
Record Quarterly Mill Throughput at Meliadine Supported by Strong Hauling Performance; Quarterly Production at Meadowbank Affected by Freshet, Full-Year Guidance Remains on Track
Nunavut – Operating Statistics
| Three Months Ended June 30, 2026 | Meliadine | Meadowbank | Consolidated Nunavut | |||||||||
| Tonnes of ore milled (thousands) | 648 | 1,013 | 1,661 | |||||||||
| Tonnes of ore milled per day | 7,121 | 11,132 | 18,253 | |||||||||
| Gold grade (g/t) | 4.77 | 3.41 | 3.94 | |||||||||
| Gold production (ounces) | 97,516 | 100,165 | 197,681 | |||||||||
| Production costs per tonne (C$) | C$ | 260 | C$ | 204 | C$ | 226 | ||||||
| Minesite costs per tonne (C$) | C$ | 215 | C$ | 167 | C$ | 186 | ||||||
| Production costs per ounce | $ | 1,255 | $ | 1,494 | $ | 1,376 | ||||||
| Total cash costs per ounce | $ | 1,033 | $ | 1,206 | $ | 1,121 | ||||||
| Six Months Ended June 30, 2026 | Meliadine | Meadowbank | Consolidated Nunavut | |||||||||
| Tonnes of ore milled (thousands) | 1,206 | 2,112 | 3,318 | |||||||||
| Tonnes of ore milled per day | 6,669 | 11,669 | 18,338 | |||||||||
| Gold grade (g/t) | 5.10 | 3.49 | 4.08 | |||||||||
| Gold production (ounces) | 191,347 | 214,027 | 405,374 | |||||||||
| Production costs per tonne (C$) | C$ | 247 | C$ | 218 | C$ | 228 | ||||||
| Minesite costs per tonne (C$) | C$ | 241 | C$ | 162 | C$ | 191 | ||||||
| Production costs per ounce | $ | 1,128 | $ | 1,557 | $ | 1,355 | ||||||
| Total cash costs per ounce | $ | 1,096 | $ | 1,139 | $ | 1,119 | ||||||
Regional Highlights
| · | Gold production in the quarter was lower than planned, primarily as a result of lower than anticipated grades at Meadowbank as well as challenging freshet conditions and greater than expected rainfall in June which affected the open pit ore mined |
| · | At Meliadine, strong open pit hauling performance drove higher ore tonnes mined and the mill achieved record quarterly throughput of 648,000 tonnes. Gold production was in line with plan as higher ore tonnes processed were offset by lower than anticipated grades |
| · | At Meadowbank, gold grades were lower than planned as a result of mine sequencing. Gold production for the full year 2026 remains in line with plan |
| · | Meliadine has scheduled a four-day shutdown for regular mill maintenance in the third quarter of 2026. Meadowbank has scheduled a five-day shutdown in the fourth quarter of 2026 to replace the SAG and ball mill liners and complete other regular mill maintenance |
| · | Exploration drilling at Meliadine was highlighted by hole ML425-8846-D15 intersecting 10.9 g/t gold over 6.6 metres at 694 metres depth in the western deep extension of the Tiriganiaq deposit and hole ML425-10071-D9 intersecting 9.0 g/t gold over 4.9 metres at 663 metres depth approximately 150 metres north of mineral resources in the eastern portion of the deposit. Step-out drilling at the Wesmeg North deposit returned 11.3 g/t gold over 7.7 metres at 744 metres depth in hole ML425-9408-D20 and 10.1 g/t gold over 3.0 metres at 855 metres depth in hole ML425-9408-D1C, approximately 200 metres below current mineral resources, further demonstrating the depth potential of mineralization at Wesmeg North |
| · | An update on Hope Bay is set out in the Key Value Drivers – Advancing the Next Phase of Growth section above |
24
AUSTRALIA
Strong Production at Fosterville Supported by Higher Grades; Primary Ventilation System Upgrade Completed
Fosterville – Operating Statistics
| Three Months Ended June 30, 2026 | Six Months Ended June 30, 2026 | |||||||
| Tonnes of ore milled (thousands) | 204 | 420 | ||||||
| Tonnes of ore milled per day | 2,242 | 2,320 | ||||||
| Gold grade (g/t) | 6.68 | 6.49 | ||||||
| Gold production (ounces) | 42,012 | 83,455 | ||||||
| Production costs per tonne (A$) | A$ | 365 | A$ | 336 | ||||
| Minesite costs per tonne (A$) | A$ | 341 | A$ | 328 | ||||
| Production costs per ounce | $ | 1,230 | $ | 1,165 | ||||
| Total cash costs per ounce | $ | 1,114 | $ | 1,118 | ||||
Highlights
| · | Gold production in the quarter was higher than planned driven by higher gold grades primarily as a result of positive grade reconciliation and higher mill recovery. The increase in production was partially offset by lower throughput as a result of lower volumes mined from the Phoenix and Harrier zones as the Company completed and commissioned an upgrade to the underground primary ventilation system to sustain the mining rate in the Lower Phoenix zones in future years |
| · | At the processing plant, ongoing work to upgrade the grinding circuit and related ancillary equipment continued during the quarter, including the installation of a new BIOX tank. The mill upgrades are expected to achieve the targeted 3,300 tpd throughput starting in 2028 |
| · | Fosterville has scheduled quarterly five-day shutdowns for regular mill maintenance in 2026 |
| · | Deep exploration drilling at Fosterville in the Lower Phoenix structure was highlighted by hole UDH5161 intersecting 9.6 g/t gold over 10.2 metres at 1,785 metres depth in the Cardinal zone, approximately 40 metres down-plunge from mineral reserves; hole UDH5162A intersecting 16.8 g/t gold over 4.5 metres at 1,789 metres depth in the Cardinal zone, approximately 40 metres above a previously interpreted plunging visible-gold trend; and hole UDH5178 intersecting 5.1 g/t gold over 21.4 metres at 1,845 metres depth in the Swan zone, approximately 55 metres south of current mineral reserves. At Robbins Hill, drilling was highlighted by hole UDH5188 intersecting 9.9 g/t gold over 6.0 metres at 810 metres depth in the SW Linker 1 zone and laterally from the nearby Hoffman mineral reserves; and hole UDH5214 intersecting 9.1 g/t gold over 4.8 metres at 477 metres depth in the Curie zone immediately above current mineral reserves |
25
FINLAND
Record Quarterly Mill Throughput Drives Strong Production; Optimization Initiatives Continue to Deliver Excellent Cost Performance
Kittila – Operating Statistics
| Three Months Ended June 30, 2026 | Six Months Ended June 30, 2026 | |||||||
| Tonnes of ore milled (thousands) | 583 | 1,031 | ||||||
| Tonnes of ore milled per day | 6,407 | 5,696 | ||||||
| Gold grade (g/t) | 4.07 | 4.12 | ||||||
| Gold production (ounces) | 61,969 | 110,496 | ||||||
| Production costs per tonne (€) | € | 100 | € | 113 | ||||
| Minesite costs per tonne (€) | € | 104 | € | 112 | ||||
| Production costs per ounce | $ | 1,091 | $ | 1,227 | ||||
| Total cash costs per ounce | $ | 1,133 | $ | 1,212 | ||||
Highlights – Kittila
| · | Gold production in the quarter was above plan, driven primarily by record mill throughput and higher grades, partially offset by lower recovery. Higher gold grades reflect positive grade reconciliation |
| · | Mill recovery remained lower than planned at 81%. The Company continues to advance several recovery improvement initiatives, including the optimization of reagent usage based on feed blend, the addition of new instrumentation at the autoclave for process optimization and pilot testing of a heated leach plant |
| · | Underground operations delivered solid performance during the quarter, with development in line with plan. The mine continues to achieve productivity gains, reflecting sustained improvement initiatives implemented over the past year and partially offsetting increases in royalty costs and energy costs during the quarter |
| · | Kittila has scheduled a 17-day shutdown for regular maintenance on the mill and autoclave relining in the fourth quarter of 2026 |
| · | Exploration drilling at Kittila extended Main Zone mineralization northwards by up to 60 metres beyond current mineral resources in the Seuru area at moderate depths. Highlights included hole SEU-602 intersecting 5.9 g/t gold over 6.7 metres at 961 metres depth and hole SEU25-700L intersecting 5.4 g/t gold over 6.2 metres at 1,401 metres depth |
Highlights – Ikkari Project and Contingent Value Rights
| · | On April 20, 2026, the Company announced a comprehensive consolidation of properties in the Central Lapland Greenstone Belt of Northern Finland through the acquisitions of Rupert Resources Ltd. ("Rupert") and Aurion Resources Ltd. ("Aurion") and the acquisition of the 70% interest in Fingold Ventures Ltd. held by B2Gold Corp. (the other 30% held by Aurion). These transactions consolidate a highly prospective 2,492 km2 land package encompassing the Kittila mine, the advanced Ikkari exploration project and substantial exploration upside across multiple targets, including several recent discoveries. The transactions were completed in the second quarter of 2026 as set out below: |
| ◦ | On April 22, 2026, the Company acquired B2Gold's 70% interest of FinGold JV for cash consideration of $325 million |
| ◦ | On June 15, 2026, the Company acquired all of the outstanding common shares of Aurion (the "Aurion Shares"), other than the Aurion Shares then-held by Agnico Eagle. Each Aurion Share was acquired for C$2.60 in cash, for aggregate consideration of $339 million (C$474.5 million) |
26
| ◦ | On June 16, 2026, the Company acquired all of the outstanding common shares of Rupert (the "Rupert Shares"), other than the Rupert Shares then-held by Agnico Eagle for: (i) 0.0401 of a common share of Agnico Eagle (aggregate consideration of $1,687 million); and (ii) contingent consideration with a value of up to C$3.00 per share, in the form of a contingent value right ("CVR"). Each CVR has a term of 10 years from the June 16, 2026 issue date and entitles the holder thereof to receive up to $3.00 in cash upon certain milestones being reached in respect of the properties acquired from Rupert (the "Acquired Properties"). The milestones and related payments under the CVRs are: |
| a) | $1.00 upon the public announcement of at least 5 million ounces of gold in mineral reserves on the Acquired Properties; |
| b) | $1.00 upon the public announcement of both: (i) the Acquired Properties achieving commercial production; and (ii) the Acquired Properties reaching 7.5 million ounces of gold in aggregate mineral reserves and production; and |
| c) | $1.00 upon the public announcement of both: (i) the Acquired Properties achieving commercial production; and (ii) the Acquired Properties reaching 10 million ounces of gold in aggregate mineral reserves and production. There can be no assurance that any of the above milestones will be satisfied prior to the expiry of the CVRs or that any holder of CVRs will receive any payment thereunder. |
| · | Following the completion of these transactions, the Company advanced integration activities, including the transfer of employees, alignment of business systems and processes and ongoing stakeholder engagement. Exploration drilling by the Company has commenced at Ikkari, including condemnation drilling to support infrastructure placement and project development planning, with additional step-out drilling expected along the Ikkari trend as the Company increases drilling capacity on the property. Concurrently, technical review and validation work is progressing to support future mine planning and the completion of an internal evaluation for the optimized mine design targeted by the end of 2027 |
| · | As at July 29, 2026, the Company had 207,654,166 CVRs outstanding. The Company's obligation to make payments under the CVRs is conditional on the satisfaction of certain payment conditions prior to the expiry of the CVRs, as described in the contingent value rights agreement dated June 16, 2026 between the Company and Computershare Trust Company of Canada, a copy of which is available under the Company's profile on SEDAR+ at www.sedarplus.ca |
MEXICO
Strong Performance at Pinos Altos and Cubiro Drives Higher Mill Throughput
Pinos Altos – Operating Statistics
| Three Months Ended June 30, 2026 | Six Months Ended June 30, 2026 | |||||||
| Tonnes of ore milled (thousands) | 442 | 869 | ||||||
| Tonnes of ore milled per day | 4,857 | 4,801 | ||||||
| Gold grade (g/t) | 1.54 | 1.45 | ||||||
| Gold production (ounces) | 20,951 | 38,601 | ||||||
| Production costs per tonne | $ | 133 | $ | 143 | ||||
| Minesite costs per tonne | $ | 132 | $ | 134 | ||||
| Production costs per ounce | $ | 2,796 | $ | 3,231 | ||||
| Total cash costs per ounce | $ | 1,873 | $ | 2,073 | ||||
27
About Agnico Eagle
Canadian-based and led, Agnico Eagle is Canada's largest mining company and the second largest gold producer in the world, operating mines in Canada, Australia, Finland and Mexico. The Company is advancing a pipeline of high-quality development projects in these regions to support sustainable growth over the next decade. Agnico Eagle is a partner of choice within the mining industry, recognized globally for its leading sustainability practices. Agnico Eagle was founded in 1957 and has consistently created value for its shareholders, declaring a cash dividend every year since 1983.
About this News Release
Unless otherwise stated, references to "Canadian Malartic", "Goldex", "LaRonde" and "Meadowbank" are to the Company's operations at the Canadian Malartic complex, the Goldex complex, the LaRonde complex and the Meadowbank complex, respectively. The Canadian Malartic complex consists of the mining, milling and processing operations at the Canadian Malartic mine and the mining operations at the Odyssey mine. The Goldex complex consists of the mining, milling and processing operations at the Goldex mine and the mining operations at the Akasaba West open pit mine. The LaRonde complex consists of the mining, milling and processing operations at the LaRonde mine and the mining and processing operations at LZ5. The Meadowbank complex consists of the milling and processing operations at the Meadowbank mine and the mining operations at the Amaruq open pit and underground mines. References to other operations are to the relevant mines, projects or properties, as applicable.
When used in this news release, the terms "including" and "such as" mean including and such as, without limitation.
The information contained on any website linked to or referred to herein (including the Company's website) is not part of this news release.
Further Information
For further information regarding Agnico Eagle, contact Investor Relations at investor.relations@agnicoeagle.com or call (416) 947-1212.
Note Regarding Certain Measures of Performance
This news release discloses certain financial performance measures, including "total cash costs per ounce", "minesite costs per tonne", "all-in sustaining costs per ounce" (or "AISC per ounce"), "adjusted net income", "cash provided by operating activities before changes in non-cash components of working capital", "EBITDA", which means earnings before interest, taxes, depreciation and amortization, "adjusted EBITDA", "free cash flow", "free cash flow before changes in non-cash components of working capital", "operating margin", "capital expenditures", "sustaining capital expenditures", "development capital expenditures", "sustaining capitalized exploration", "development capitalized exploration" and "net cash (debt)", as well as, for certain of these measures their related per share measures that are not standardized measures under IFRS Accounting Standards. These measures may not be comparable to similar measures reported by other gold producers and should be considered together with other data prepared in accordance with IFRS Accounting Standards. See below for a reconciliation of these measures to the most directly comparable financial information reported in the condensed interim consolidated financial statements for the three months ended March 31, 2026 (the "First Quarter Financial Statements") prepared in accordance with IFRS Accounting Standards. Adjustments that are not applicable in respect of the periods for which reconciliations are provided are not shown in the quantitative reconciliation.
28
Total Cash Costs per Ounce of Gold Produced and Minesite Costs per Tonne
Total Cash Costs per Ounce
Total cash costs per ounce is calculated on a per ounce of gold produced basis and is reported either on a by-product basis (deducting the impact of by-product metals from production costs to isolate the cost of producing an ounce of gold) and, where indicated, on a co-product basis (without deducting the impact of by-product metals). Total cash costs per ounce on a by-product basis are calculated by adjusting production costs as recorded in the Second Quarter Financial Statements for (i) the impact of by-products, (ii) inventory production costs, (iii) the impact of purchase price allocation in connection with mergers and acquisitions on inventory accounting, (iv) realized gains and losses on hedges of production costs, (v) in-kind royalty costs, and (vi) smelting, refining and marketing charges and then dividing by the number of ounces of gold produced. For periods commencing on or after January 1, 2026, the Company also adjusts production costs for the NTI Payment (as discussed further below), which adjustment only affects this non-GAAP measure only insofar as the measure includes costs from Meadowbank (that is, for Meadowbank, the Nunavut region and the consolidated Company). The Company's calculation of total cash costs per ounce for other mines and regions that do not include Meadowbank are not affected by this change.
The NTI Payment is the payment to Nunavut Tunngavik Inc. ("NTI") under the Company's mineral production lease in respect of the Amaruq mine at Meadowbank, which is a royalty based on net profits, subject to a minimum profit margin ("NTI Payment"). NTI is the body that represents the Inuit of Nunavut under the Nunavut Land Claims Agreement and holds the subsurface mineral rights on certain parcels of Inuit owned land, including at the Amaruq mine. The royalty payments under the mining leases with NTI are based on net profits at the mine, subject to a cap on allowable costs as a percentage of gross revenue. At mines located on lands in Nunavut where the subsurface mineral rights are not held by NTI (whether or not on Inuit owned lands), the Crown holds the subsurface mineral rights and imposes a net profits royalty (the "Crown royalty") under the Nunavut Mining Regulations (the "NMR"). The Company does not include the Crown royalty in its calculations of total cash costs per ounce and certain other of its non-GAAP measures as the Company classifies these costs as an income tax for financial statement purposes in accordance with IFRS Accounting Standards and income taxes are generally excluded from the calculation of such non-GAAP measures. The Crown royalty is not applicable where NTI is the holder of the subsurface mineral rights. Where NTI is holder of the subsurface mineral rights, the Company instead is required to make the payment under the mining leases with NTI, which the Company views as having similar characteristics to the payments under the Crown royalty. Accordingly, to ensure comparability across the Company's mines in Nunavut, the Company revised its calculation of such non-GAAP measures to also adjust for the NTI Payment where applicable. In this news release, total cash costs per ounce for periods that commenced prior to January 1, 2026 have been calculated using this revised methodology.
Investors should note that total cash costs per ounce are not reflective of all cash expenditures, as they do not include income tax payments, interest costs or dividend payments. Total cash costs per ounce on a co-product basis is calculated in the same manner as the total cash costs per ounce on a by-product basis, except that the impact of by-product metals is not deducted. Accordingly, the calculation of total cash costs per ounce on a co-product basis does not reflect a reduction in production costs or smelting, refining and marketing charges associated with the production of by-product metals.
Total cash costs per ounce is intended to provide investors information about the cash-generating capabilities of the Company's mining operations. Management also uses these measures to, and believes they are helpful to investors so investors can, understand and monitor the performance of the Company's mining operations. The Company believes that total cash costs per ounce is useful to help investors understand the costs associated with producing gold and the economics of gold mining. As market prices for gold are quoted on a per ounce basis, using the total cash costs per ounce on a by-product basis measure allows management and investors to assess a mine's cash-generating capabilities at various gold prices. Management is aware, and investors should note, that these per ounce measures of performance can be affected by fluctuations in exchange rates and, in the case of total cash costs per ounce of gold produced on a by-product basis, by-product metal prices. Management compensates for these inherent limitations by using, and investors should also consider using, these measures in conjunction with data prepared in accordance with IFRS Accounting Standards and minesite costs per tonne as these measures are not necessarily indicative of operating costs or cash flow measures prepared in accordance with IFRS Accounting Standards. Management also performs sensitivity analyses in order to quantify the effects of fluctuating metal prices and exchange rates.
29
Agnico Eagle's primary business is gold production and the focus of its current operations and future development is on maximizing returns from gold production, with other metal production being incidental to the gold production process. Accordingly, all metals other than gold are considered by-products.
In this news release, unless otherwise indicated, total cash costs per ounce is reported on a by-product basis. Total cash costs per ounce is reported on a by-product basis because (i) gold is the Company's primary product and source of substantially all its revenues, (ii) the Company mines ore, which may contain gold, silver, zinc, copper and other metals, and the Company believes that isolating the cost of producing gold is a more meaningful measure of operating performance, (iii) it is a method used by management and the Board to monitor operations, and (iv) many other gold producers disclose similar measures on a by-product rather than a co-product basis.
Minesite Costs per Tonne
Minesite costs per tonne are calculated by adjusting production costs as recorded in the Second Quarter Financial Statements for (i) inventory production costs, (ii) in-kind royalty costs, and (iii) smelting, refining and marketing charges, and then dividing by tonnage of ore processed. For periods commencing on or after January 1, 2026, the Company also adjusts production costs for the NTI Payment (as discussed above in "Total Cash Costs per Ounce"), which adjustment only affects minesite costs per tonne at Meadowbank and for the Nunavut region. The Company's calculation of minesite costs per tonne for other mines and regions other than the Nunavut region are not affected by this change. In this news release, minesite costs for periods that commenced prior to January 1, 2026 have been calculated using this revised methodology.
As the total cash costs per ounce can be affected by fluctuations in by-product metal prices and foreign exchange rates, management believes that minesite costs per tonne is useful to investors in providing additional information regarding the performance of mining operations, eliminating the impact of varying production levels. Management also uses this measure to determine the economic viability of mining blocks. As each mining block is evaluated based on the net realizable value of each tonne mined, in order to be economically viable the estimated revenue on a per tonne basis must be in excess of the minesite costs per tonne. For the reasons noted above in respect of revisions to the composition of total cash costs per ounce, for the purposes of calculating this non-GAAP measure, the Company now adjusts production costs for the amount of the NTI Payment. The Company believes that this revision is helpful to both management and investors as it better reflects the cost performance at the Amaruq mine at Meadowbank and makes the reported measure more comparable across all of the Company's mines. Management is aware, and investors should note, that this per tonne measure of performance can be affected by fluctuations in processing levels. This inherent limitation may be partially mitigated by using this measure in conjunction with production costs and other data prepared in accordance with IFRS Accounting Standards.
30
The following table sets out the production costs per minesite for the three and six months ended June 30, 2026 and June 30, 2025, as presented in the Second Quarter Financial Statements in accordance with IFRS Accounting Standards.
| Total Production Costs by Mine | ||||||||||||||||
| Three Months Ended June 30, | Six Months Ended June 30, | |||||||||||||||
| (thousands of United States dollars) | 2026 | 2025 | 2026 | 2025 | ||||||||||||
| LaRonde | 112,940 | 83,734 | 200,948 | 170,378 | ||||||||||||
| Canadian Malartic | 126,188 | 115,383 | 256,134 | 234,672 | ||||||||||||
| Goldex | 40,826 | 37,690 | 80,825 | 72,346 | ||||||||||||
| Quebec | 279,954 | 236,807 | 537,907 | 477,396 | ||||||||||||
| Detour Lake | 153,621 | 141,330 | 322,000 | 276,276 | ||||||||||||
| Macassa | 70,266 | 48,266 | 142,731 | 98,092 | ||||||||||||
| Ontario | 223,887 | 189,596 | 464,731 | 374,368 | ||||||||||||
| Meliadine | 122,373 | 113,093 | 215,932 | 196,915 | ||||||||||||
| Meadowbank | 149,641 | 106,039 | 333,256 | 233,006 | ||||||||||||
| Nunavut | 272,014 | 219,132 | 549,188 | 429,921 | ||||||||||||
| Fosterville | 51,693 | 38,018 | 97,186 | 71,058 | ||||||||||||
| Australia | 51,693 | 38,018 | 97,186 | 71,058 | ||||||||||||
| Kittila | 67,623 | 55,064 | 135,632 | 110,897 | ||||||||||||
| Finland | 67,623 | 55,064 | 135,632 | 110,897 | ||||||||||||
| Pinos Altos | 58,587 | 50,570 | 124,701 | 93,280 | ||||||||||||
| Mexico | 58,587 | 50,570 | 124,701 | 93,280 | ||||||||||||
| Production costs per the Second Quarter Financial Statements | $ | 953,758 | $ | 789,187 | $ | 1,909,345 | $ | 1,556,920 | ||||||||
31
The following tables set out a reconciliation of total cash costs per ounce (on both a by-product basis and co-product basis) and minesite costs per tonne to production costs for the three and six months ended June 30, 2026 and June 30, 2025, exclusive of amortization, as presented in the Second Quarter Financial Statements in accordance with IFRS Accounting Standards.
Reconciliation of Production Costs to Total Cash Costs per Ounce by Mine
Three Months Ended June 30, 2026
(United States dollars in thousands, except per ounce measures or as otherwise noted)
| Mine | Payable gold production (ounces)(i) |
Production costs ($) |
Production costs per ounce ($) |
Inventory adjustments ($)(ii) |
Realized (gains) and losses on hedges ($) |
In-kind royalty costs and NTI Payment ($)(iii) |
Smelting, refining and marketing charges ($) |
Total
cash costs per ounce (co-product basis) ($) |
Impact
of by-product metals ($) |
Total
cash costs per ounce (by-product basis) ($) |
||||||||||||||||||||||||||||||
| LaRonde | 81,261 | 112,940 | 1,390 | (12,495 | ) | (29 | ) | — | 1,026 | 1,248 | (23,990 | ) | 953 | |||||||||||||||||||||||||||
| Canadian Malartic | 135,243 | 126,188 | 933 | 7,881 | (459 | ) | 30,977 | 418 | 1,220 | (4,770 | ) | 1,185 | ||||||||||||||||||||||||||||
| Goldex | 29,277 | 40,826 | 1,394 | 1,154 | (10 | ) | — | 1,362 | 1,480 | (11,671 | ) | 1,081 | ||||||||||||||||||||||||||||
| Quebec | 245,781 | 279,954 | 1,139 | (3,460 | ) | (498 | ) | 30,977 | 2,806 | 1,260 | (40,431 | ) | 1,096 | |||||||||||||||||||||||||||
| Detour Lake | 207,279 | 153,621 | 741 | 2,004 | (1,098 | ) | 17,949 | 1,226 | 838 | (2,685 | ) | 825 | ||||||||||||||||||||||||||||
| Macassa | 80,143 | 70,266 | 877 | 10,262 | (26 | ) | 2,909 | 50 | 1,041 | (7 | ) | 1,041 | ||||||||||||||||||||||||||||
| Ontario | 287,422 | 223,887 | 779 | 12,266 | (1,124 | ) | 20,858 | 1,276 | 895 | (2,692 | ) | 885 | ||||||||||||||||||||||||||||
| Meliadine | 97,516 | 122,373 | 1,255 | (21,670 | ) | (32 | ) | — | 83 | 1,033 | — | 1,033 | ||||||||||||||||||||||||||||
| Meadowbank | 100,165 | 149,641 | 1,494 | 3,670 | (40 | ) | (31,406 | ) | 107 | 1,218 | (1,167 | ) | 1,206 | |||||||||||||||||||||||||||
| Nunavut | 197,681 | 272,014 | 1,376 | (18,000 | ) | (72 | ) | (31,406 | ) | 190 | 1,127 | (1,167 | ) | 1,121 | ||||||||||||||||||||||||||
| Fosterville | 42,012 | 51,693 | 1,230 | (3,251 | ) | (1,208 | ) | — | 44 | 1,125 | (466 | ) | 1,114 | |||||||||||||||||||||||||||
| Australia | 42,012 | 51,693 | 1,230 | (3,251 | ) | (1,208 | ) | — | 44 | 1,125 | (466 | ) | 1,114 | |||||||||||||||||||||||||||
| Kittila | 61,969 | 67,623 | 1,091 | 2,794 | (1 | ) | — | (41 | ) | 1,136 | (157 | ) | 1,133 | |||||||||||||||||||||||||||
| Finland | 61,969 | 67,623 | 1,091 | 2,794 | (1 | ) | — | (41 | ) | 1,136 | (157 | ) | 1,133 | |||||||||||||||||||||||||||
| Pinos Altos | 20,951 | 58,587 | 2,796 | 406 | (869 | ) | — | 497 | 2,798 | (19,384 | ) | 1,873 | ||||||||||||||||||||||||||||
| Mexico | 20,951 | 58,587 | 2,796 | 406 | (869 | ) | — | 497 | 2,798 | (19,384 | ) | 1,873 | ||||||||||||||||||||||||||||
| Consolidated | 855,816 | 953,758 | 1,114 | (9,245 | ) | (3,772 | ) | 20,429 | 4,772 | 1,129 | (64,297 | ) | 1,054 | |||||||||||||||||||||||||||
Notes:
| (i) | Gold production for the three months ended June 30, 2026 excludes 440 ounces of payable production of gold at La India and 58 ounces of payable production of gold at Creston Mascota, which were produced from residual leaching. |
| (ii) | Under the Company's revenue recognition policy, revenue from contracts with customers is recognized upon the transfer of control over metals sold to the customer. As the total cash costs per ounce are calculated on a production basis, an inventory adjustment is made to reflect the portion of production not yet recognized as revenue. Included in inventory adjustments for Canadian Malartic for the three months ended June 30, 2026 is $5.8 million associated with the fair value allocated to inventory on Canadian Malartic as part of the purchase price allocation from the acquisition, on March 31, 2023, of the 50% of Canadian Malartic that Agnico Eagle did not then hold. |
| (iii) | In-kind royalty adjustments in respect of Canadian Malartic, Detour Lake and Macassa related to in-kind royalties of 5.0%, 2.0% and 1.5%, respectively, paid in respect of gold production at such mines, which are excluded from production costs under IFRS Accounting Standards and added back in the calculation of total cash costs per ounce. NTI Payments are incurred solely at Meadowbank and are included in production costs under IFRS Accounting Standards and subtracted from production costs in the calculation of total cash costs per ounce as described more fully above. For a discussion of NTI Payments, see "Total Cash Costs per Ounce". |
32
Three Months Ended June 30, 2025
(United States dollars in thousands, except per ounce measures or as otherwise noted)
| Mine | Payable gold production (ounces)(i) | Production costs ($) | Production costs per ounce ($) | Inventory adjustments ($)(ii) | Realized (gains) and losses on hedges ($) | In-kind royalty costs and NTI Payment ($)(iii) | Smelting, refining and marketing charges ($) | Total
cash costs per ounce (co-product basis) ($) | Impact
of by-product metals ($) | Total
cash costs per ounce (by-product basis) ($) | ||||||||||||||||||||||||||||||
| LaRonde | 91,252 | 83,734 | 918 | 2,459 | 76 | — | 3,751 | 986 | (16,359 | ) | 807 | |||||||||||||||||||||||||||||
| Canadian Malartic | 172,531 | 115,383 | 669 | 10,841 | 158 | 27,132 | 567 | 893 | (2,940 | ) | 876 | |||||||||||||||||||||||||||||
| Goldex | 33,118 | 37,690 | 1,138 | (422 | ) | 31 | — | 1,154 | 1,161 | (6,593 | ) | 962 | ||||||||||||||||||||||||||||
| Quebec | 296,901 | 236,807 | 798 | 12,878 | 265 | 27,132 | 5,472 | 952 | (25,892 | ) | 864 | |||||||||||||||||||||||||||||
| Detour Lake | 168,272 | 141,330 | 840 | 2,429 | 199 | 9,383 | 1,697 | 921 | (1,231 | ) | 914 | |||||||||||||||||||||||||||||
| Macassa | 87,364 | 48,266 | 552 | 2,911 | 75 | 4,076 | 74 | 634 | (674 | ) | 626 | |||||||||||||||||||||||||||||
| Ontario | 255,636 | 189,596 | 742 | 5,340 | 274 | 13,459 | 1,771 | 823 | (1,905 | ) | 816 | |||||||||||||||||||||||||||||
| Meliadine | 90,263 | 113,093 | 1,253 | (12,255 | ) | 106 | — | 144 | 1,120 | (697 | ) | 1,112 | ||||||||||||||||||||||||||||
| Meadowbank | 101,935 | 106,039 | 1,040 | (1,348 | ) | 146 | (6,377 | ) | 264 | 968 | (1,382 | ) | 955 | |||||||||||||||||||||||||||
| Nunavut | 192,198 | 219,132 | 1,140 | (13,603 | ) | 252 | (6,377 | ) | 408 | 1,040 | (2,079 | ) | 1,029 | |||||||||||||||||||||||||||
| Fosterville | 49,574 | 38,018 | 767 | 901 | — | — | 37 | 786 | (156 | ) | 783 | |||||||||||||||||||||||||||||
| Australia | 49,574 | 38,018 | 767 | 901 | — | — | 37 | 786 | (156 | ) | 783 | |||||||||||||||||||||||||||||
| Kittila | 50,357 | 55,064 | 1,093 | 2,909 | (605 | ) | — | (63 | ) | 1,138 | (181 | ) | 1,134 | |||||||||||||||||||||||||||
| Finland | 50,357 | 55,064 | 1,093 | 2,909 | (605 | ) | — | (63 | ) | 1,138 | (181 | ) | 1,134 | |||||||||||||||||||||||||||
| Pinos Altos | 21,363 | 50,570 | 2,367 | 1,323 | (85 | ) | — | 309 | 2,440 | (9,361 | ) | 2,002 | ||||||||||||||||||||||||||||
| Mexico | 21,363 | 50,570 | 2,367 | 1,323 | (85 | ) | — | 309 | 2,440 | (9,361 | ) | 2,002 | ||||||||||||||||||||||||||||
| Consolidated | 866,029 | 789,187 | 911 | 9,748 | 101 | 34,214 | 7,934 | 971 | (39,574 | ) | 925 | |||||||||||||||||||||||||||||
Notes:
| (i) | Gold production for the three months ended June 30, 2025 excludes 858 ounces of payable production of gold at La India and 39 ounces of payable production of gold at Creston Mascota, which were produced from residual leaching. |
| (ii) | Under the Company's revenue recognition policy, revenue from contracts with customers is recognized upon the transfer of control over metals sold to the customer. As the total cash costs per ounce are calculated on a production basis, an inventory adjustment is made to reflect the portion of production not yet recognized as revenue. Included in inventory adjustments for Canadian Malartic for the three months ended March 31, 2025 is $1.4 million associated with the fair value allocated to inventory on Canadian Malartic as part of the purchase price allocation from the acquisition, on March 31, 2023, of the 50% of Canadian Malartic that Agnico Eagle did not then hold. |
| (iii) | In-kind royalty adjustments in respect of Canadian Malartic, Detour Lake and Macassa related to in-kind royalties of 5.0%, 2.0% and 1.5%, respectively, paid in respect of gold production at such mines, which are excluded from production costs under IFRS Accounting Standards and added back in the calculation of total cash costs per ounce. NTI Payments are incurred solely at Meadowbank and are included in production costs under IFRS Accounting Standards and subtracted from production costs in the calculation of total cash costs per ounce as described more fully above. For a discussion of NTI Payments, see "Total Cash Costs per Ounce". |
33
Six Months Ended June 30, 2026
(thousands of United States dollars, except as noted)
| Mine | Payable gold production (ounces)(i) | Production costs ($) | Production costs per ounce ($) | Inventory adjustments ($)(ii) | Realized (gains) and losses on hedges ($) | In-kind royalty and NTI Payment ($)(iii) | Smelting, refining and marketing charges ($) | Total
cash costs per ounce (co-product basis) ($) | Impact
of by-product metals ($) | Total
cash costs per ounce (by-product basis) ($) | ||||||||||||||||||||||||||||||
| LaRonde | 162,857 | 200,948 | 1,234 | 4,669 | (350 | ) | — | 4,314 | 1,287 | (48,291 | ) | 990 | ||||||||||||||||||||||||||||
| Canadian Malartic | 301,459 | 256,134 | 850 | 12,659 | (1,164 | ) | 68,286 | 1,373 | 1,119 | (11,232 | ) | 1,082 | ||||||||||||||||||||||||||||
| Goldex | 58,649 | 80,825 | 1,378 | (699 | ) | (129 | ) | — | 2,423 | 1,405 | (23,888 | ) | 998 | |||||||||||||||||||||||||||
| Quebec | 522,965 | 537,907 | 1,029 | 16,629 | (1,643 | ) | 68,286 | 8,110 | 1,203 | (83,411 | ) | 1,044 | ||||||||||||||||||||||||||||
| Detour Lake | 384,298 | 322,000 | 838 | (7,659 | ) | (2,130 | ) | 35,318 | 2,148 | 910 | (6,218 | ) | 894 | |||||||||||||||||||||||||||
| Macassa | 135,736 | 142,731 | 1,052 | 3,192 | (329 | ) | 8,836 | 107 | 1,139 | (1,270 | ) | 1,129 | ||||||||||||||||||||||||||||
| Ontario | 520,034 | 464,731 | 894 | (4,467 | ) | (2,459 | ) | 44,154 | 2,255 | 970 | (7,488 | ) | 955 | |||||||||||||||||||||||||||
| Meliadine | 191,347 | 215,932 | 1,128 | (5,337 | ) | (402 | ) | — | 222 | 1,100 | (631 | ) | 1,096 | |||||||||||||||||||||||||||
| Meadowbank | 214,027 | 333,256 | 1,557 | (2,401 | ) | (500 | ) | (82,689 | ) | 272 | 1,158 | (4,189 | ) | 1,139 | ||||||||||||||||||||||||||
| Nunavut | 405,374 | 549,188 | 1,355 | (7,738 | ) | (902 | ) | (82,689 | ) | 494 | 1,131 | (4,820 | ) | 1,119 | ||||||||||||||||||||||||||
| Fosterville | 83,455 | 97,186 | 1,165 | (1,469 | ) | (2,022 | ) | — | 113 | 1,124 | (466 | ) | 1,118 | |||||||||||||||||||||||||||
| Australia | 83,455 | 97,186 | 1,165 | (1,469 | ) | (2,022 | ) | — | 113 | 1,124 | (466 | ) | 1,118 | |||||||||||||||||||||||||||
| Kittila | 110,496 | 135,632 | 1,227 | (1,260 | ) | (10 | ) | — | (69 | ) | 1,215 | (343 | ) | 1,212 | ||||||||||||||||||||||||||
| Finland | 110,496 | 135,632 | 1,227 | (1,260 | ) | (10 | ) | — | (69 | ) | 1,215 | (343 | ) | 1,212 | ||||||||||||||||||||||||||
| Pinos Altos | 38,601 | 124,701 | 3,231 | (6,838 | ) | (1,745 | ) | — | 1,598 | 3,050 | (37,697 | ) | 2,073 | |||||||||||||||||||||||||||
| Mexico | 38,601 | 124,701 | 3,231 | (6,838 | ) | (1,745 | ) | — | 1,598 | 3,050 | (37,697 | ) | 2,073 | |||||||||||||||||||||||||||
| Consolidated | 1,680,925 | 1,909,345 | 1,136 | (5,143 | ) | (8,781 | ) | 29,751 | 12,501 | 1,153 | (134,225 | ) | 1,073 | |||||||||||||||||||||||||||
Notes:
| (i) | Gold production for the six months ended June 30, 2026 excludes 858 ounces of payable production of gold at La India and 134 ounces of payable production of gold at Creston Mascota, which were produced from residual leaching. |
| (ii) | Under the Company's revenue recognition policy, revenue from contracts with customers is recognized upon the transfer of control over metals sold to the customer. As the total cash costs per ounce are calculated on a production basis, an inventory adjustment is made to reflect the portion of production not yet recognized as revenue. Included in inventory adjustments for Canadian Malartic for the six months ended June 30, 2026 is $9.4 million associated with the fair value allocated to inventory on Canadian Malartic as part of the purchase price allocation from the acquisition, on March 31, 2023, of the 50% of Canadian Malartic that Agnico Eagle did not then hold. |
| (iii) | In-kind royalty adjustments in respect of Canadian Malartic, Detour Lake and Macassa related to in-kind royalties of 5.0%, 2.0% and 1.5%, respectively, paid in respect of gold production at such mines, which are excluded from production costs under IFRS Accounting Standards and added back in the calculation of total cash costs per ounce. NTI Payments are incurred solely at Meadowbank and are included in production costs under IFRS Accounting Standards and subtracted from production costs in the calculation of total cash costs per ounce as described more fully above. For a discussion of NTI Payments, see "Total Cash Costs per Ounce". |
34
Six Months Ended June 30, 2025
(thousands of United States dollars, except as noted)
| Mine | Payable gold production (ounces)(i) | Production costs ($) | Production costs per ounce ($) | Inventory adjustments ($)(ii) | Realized (gains) and losses on hedges ($) | In-kind royalty and NTI Payment ($)(iii) | Smelting, refining and marketing charges ($) | Total cash costs per ounce (co-product basis) ($) | Impact of by-product metals | Total cash costs per ounce (by-product basis) ($) | ||||||||||||||||||||||||||||||
| LaRonde | 182,743 | 170,378 | 932 | (2,289 | ) | 789 | — | 6,530 | 960 | (33,581 | ) | 776 | ||||||||||||||||||||||||||||
| Canadian Malartic | 332,304 | 234,672 | 706 | 16,236 | 1,294 | 51,720 | 837 | 917 | (5,529 | ) | 900 | |||||||||||||||||||||||||||||
| Goldex | 63,134 | 72,346 | 1,146 | (314 | ) | 332 | — | 2,121 | 1,180 | (13,842 | ) | 961 | ||||||||||||||||||||||||||||
| Quebec | 578,181 | 477,396 | 826 | 13,633 | 2,415 | 51,720 | 9,488 | 959 | (52,952 | ) | 868 | |||||||||||||||||||||||||||||
| Detour Lake | 321,110 | 276,276 | 860 | 2,065 | 1,077 | 18,083 | 3,000 | 936 | (2,119 | ) | 929 | |||||||||||||||||||||||||||||
| Macassa | 173,392 | 98,092 | 566 | 4,775 | 794 | 7,610 | 161 | 643 | (1,175 | ) | 636 | |||||||||||||||||||||||||||||
| Ontario | 494,502 | 374,368 | 757 | 6,840 | 1,871 | 25,693 | 3,161 | 833 | (3,294 | ) | 826 | |||||||||||||||||||||||||||||
| Meliadine | 188,775 | 196,915 | 1,043 | (6,396 | ) | 998 | — | 228 | 1,016 | (697 | ) | 1,012 | ||||||||||||||||||||||||||||
| Meadowbank | 242,061 | 233,006 | 963 | (3,011 | ) | 1,304 | (13,795 | ) | 299 | 900 | (2,132 | ) | 891 | |||||||||||||||||||||||||||
| Nunavut | 430,836 | 429,921 | 998 | (9,407 | ) | 2,302 | (13,795 | ) | 527 | 951 | (2,829 | ) | 944 | |||||||||||||||||||||||||||
| Fosterville | 93,189 | 71,058 | 763 | 3,421 | — | — | 53 | 800 | (270 | ) | 797 | |||||||||||||||||||||||||||||
| Australia | 93,189 | 71,058 | 763 | 3,421 | — | — | 53 | 800 | (270 | ) | 797 | |||||||||||||||||||||||||||||
| Kittila | 104,461 | 110,897 | 1,062 | 1,803 | (431 | ) | — | (119 | ) | 1,074 | (294 | ) | 1,071 | |||||||||||||||||||||||||||
| Finland | 104,461 | 110,897 | 1,062 | 1,803 | (431 | ) | — | (119 | ) | 1,074 | (294 | ) | 1,071 | |||||||||||||||||||||||||||
| Pinos Altos | 38,654 | 93,280 | 2,413 | 3,523 | 29 | — | 568 | 2,520 | (17,123 | ) | 2,077 | |||||||||||||||||||||||||||||
| Mexico | 38,654 | 93,280 | 2,413 | 3,523 | 29 | — | 568 | 2,520 | (17,123 | ) | 2,077 | |||||||||||||||||||||||||||||
| Consolidated | 1,739,823 | 1,556,920 | 895 | 19,813 | 6,186 | 63,618 | 13,678 | 954 | (76,762 | ) | 910 | |||||||||||||||||||||||||||||
Notes:
| (i) | Gold production for the six months ended June 30, 2025 excludes 2,669 ounces of payable production of gold at La India and 64 ounces of payable of gold at Creston Mascota, which were produced from residual leaching. |
| (ii) | Under the Company's revenue recognition policy, revenue from contracts with customers is recognized upon the transfer of control over metals sold to the customer. As the total cash costs per ounce are calculated on a production basis, an inventory adjustment is made to reflect the portion of production not yet recognized as revenue. Included in inventory adjustments for Canadian Malartic for the six months ended June 30, 2025 is $2.5 million associated with the fair value allocated to inventory on Canadian Malartic as part of the purchase price allocation from the acquisition, on March 31, 2023, of the 50% of Canadian Malartic that Agnico Eagle did not then hold. |
| (iii) | In-kind royalty adjustments in respect of Canadian Malartic, Detour Lake and Macassa related to in-kind royalties of 5.0%, 2.0% and 1.5%, respectively, paid in respect of gold production at such mines, which are excluded from production costs under IFRS Accounting Standards and added back in the calculation of total cash costs per ounce. NTI Payments are incurred solely at Meadowbank and are included in production costs under IFRS Accounting Standards and subtracted from production costs in the calculation of total cash costs per ounce as described more fully above. For a discussion of NTI Payments, see "Total Cash Costs per Ounce". |
35
Reconciliation of Production Costs to Minesite Costs per Tonne by Mine
Three Months Ended June 30, 2026
(thousands, except per tonne measures or as otherwise noted)
| Mine | Tonnes
of ore milled (thousands) | Production costs ($) | Production costs in local currency | Local
currency production costs per tonne | Inventory adjustments in local currency(i) | In-kind royalty and NTI Payment in local currency(ii) | Smelting, refining and marketing charges in local currency | Local currency minesite costs per tonne | ||||||||||||||||||||||||
| LaRonde | 713 | $ | 112,940 | C$ | 156,211 | C$ | 219 | C$ | (16,492 | ) | C$ | — | C$ | (9,237 | ) | C$ | 183 | |||||||||||||||
| Canadian Malartic | 4,387 | $ | 126,188 | C$ | 173,987 | C$ | 40 | C$ | 53,982 | C$ | (1 | ) | C$ | — | C$ | 52 | ||||||||||||||||
| Goldex | 817 | $ | 40,826 | C$ | 56,582 | C$ | 69 | C$ | 1,711 | C$ | — | C$ | — | C$ | 71 | |||||||||||||||||
| Quebec | 5,917 | $ | 279,954 | C$ | 386,780 | C$ | 65 | C$ | 39,201 | C$ | (1 | ) | C$ | (9,237 | ) | C$ | 70 | |||||||||||||||
| Detour Lake | 7,305 | $ | 153,621 | C$ | 212,621 | C$ | 29 | C$ | 2,968 | C$ | 24,995 | C$ | — | C$ | 33 | |||||||||||||||||
| Macassa | 236 | $ | 70,266 | C$ | 97,364 | C$ | 413 | C$ | 14,563 | C$ | 4,192 | C$ | — | C$ | 492 | |||||||||||||||||
| Ontario | 7,541 | $ | 223,887 | C$ | 309,985 | C$ | 41 | C$ | 17,531 | C$ | 29,187 | C$ | — | C$ | 47 | |||||||||||||||||
| Meliadine | 648 | $ | 122,373 | C$ | 168,774 | C$ | 260 | C$ | (29,326 | ) | C$ | — | C$ | — | C$ | 215 | ||||||||||||||||
| Meadowbank | 1,013 | $ | 149,641 | C$ | 206,735 | C$ | 204 | C$ | 5,440 | C$ | (42,776 | ) | C$ | — | C$ | 167 | ||||||||||||||||
| Nunavut | 1,661 | $ | 272,014 | C$ | 375,509 | C$ | 226 | C$ | (23,886 | ) | C$ | (42,776 | ) | C$ | — | C$ | 186 | |||||||||||||||
| Fosterville | 204 | $ | 51,693 | A$ | 74,457 | A$ | 365 | A$ | (4,976 | ) | A$ | — | A$ | — | A$ | 341 | ||||||||||||||||
| Australia | 204 | $ | 51,693 | A$ | 74,457 | A$ | 365 | A$ | (4,976 | ) | A$ | — | A$ | — | A$ | 333 | ||||||||||||||||
| Kittila | 583 | $ | 67,623 | € | 58,195 | € | 100 | € | 2,474 | € | — | € | — | € | 104 | |||||||||||||||||
| Finland | 583 | $ | 67,623 | € | 58,195 | € | 100 | € | 2,474 | € | — | € | — | € | 104 | |||||||||||||||||
| Pinos Altos | 442 | $ | 58,587 | $ | 58,587 | $ | 133 | $ | (462 | ) | $ | — | $ | — | $ | 132 | ||||||||||||||||
| Mexico | 442 | $ | 58,587 | $ | 58,587 | $ | 133 | $ | (462 | ) | $ | — | $ | — | $ | 132 | ||||||||||||||||
Notes:
| (i) | This inventory adjustment reflects production costs associated with the portion of production still in inventory. Included in inventory adjustments for Canadian Malartic for the three months ended June 30, 2026 is C$8.0 million associated with the fair value allocated to inventory on Canadian Malartic as part of the purchase price allocation from the acquisition, on March 31, 2023, of the 50% of Canadian Malartic that Agnico Eagle did not then hold. |
| (ii) | In-kind royalty adjustments in respect of Canadian Malartic, Detour Lake and Macassa related to in-kind royalties of 5.0%, 2.0% and 1.5%, respectively, paid in respect of gold production at such mines, which are excluded from production costs under IFRS Accounting Standards and added back in the calculation of minesite costs per tonne. NTI Payments are incurred solely at Meadowbank and are included in production costs under IFRS Accounting Standards and subtracted from production costs in the calculation of total cash costs per ounce as described more fully above. For a discussion of NTI Payments, see "Total Cash Costs per Ounce". |
36
Three Months Ended June 30, 2025
(thousands, except per tonne measures or as otherwise noted)
| Mine | Tonnes
of ore milled (thousands) |
Production costs ($) |
Production costs (local currency) |
Production costs per tonne (local currency) |
Inventory adjustments (local currency)(i) |
In-kind royalty costs (local currency)(ii) |
Smelting, refining and marketing charges (local currency) |
Minesite costs per tonne (local currency) |
||||||||||||||||||||||||
| LaRonde | 674 | $ | 83,734 | C$ | 116,035 | C$ | 172 | C$ | 2,966 | C$ | — | C$ | (7,056 | ) | C$ | 166 | ||||||||||||||||
| Canadian Malartic | 4,963 | $ | 115,383 | C$ | 159,348 | C$ | 32 | C$ | 14,254 | C$ | 37,270 | C$ | — | C$ | 42 | |||||||||||||||||
| Goldex | 819 | $ | 37,690 | C$ | 52,257 | C$ | 64 | C$ | (895 | ) | C$ | — | C$ | — | C$ | 63 | ||||||||||||||||
| Quebec | 6,456 | $ | 236,807 | C$ | 327,640 | C$ | 51 | C$ | 16,325 | C$ | 37,270 | C$ | (7,056 | ) | C$ | 58 | ||||||||||||||||
| Detour Lake | 6,836 | $ | 141,330 | C$ | 196,403 | C$ | 29 | C$ | 2,328 | C$ | 12,887 | C$ | — | C$ | 31 | |||||||||||||||||
| Macassa | 143 | $ | 48,266 | C$ | 66,005 | C$ | 462 | C$ | 3,954 | C$ | 5,584 | C$ | — | C$ | 529 | |||||||||||||||||
| Ontario | 6,979 | $ | 189,596 | C$ | 262,408 | C$ | 38 | C$ | 6,282 | C$ | 18,471 | C$ | — | C$ | 41 | |||||||||||||||||
| Meliadine | 545 | $ | 113,093 | C$ | 158,074 | C$ | 290 | C$ | (19,587 | ) | C$ | — | C$ | — | C$ | 254 | ||||||||||||||||
| Meadowbank | 692 | $ | 106,039 | C$ | 145,678 | C$ | 211 | C$ | (2,682 | ) | C$ | (8,533 | ) | C$ | — | C$ | 194 | |||||||||||||||
| Nunavut | 1,237 | $ | 219,132 | C$ | 303,752 | C$ | 246 | C$ | (22,269 | ) | C$ | (8,533 | ) | C$ | — | C$ | 221 | |||||||||||||||
| Fosterville | 188 | $ | 38,018 | A$ | 58,194 | A$ | 309 | A$ | 1,135 | A$ | — | A$ | — | A$ | 315 | |||||||||||||||||
| Australia | 188 | $ | 38,018 | A$ | 58,194 | A$ | 310 | A$ | 1,135 | A$ | — | A$ | — | A$ | 315 | |||||||||||||||||
| Kittila | 482 | $ | 55,064 | € | 48,363 | € | 100 | € | 1,996 | € | — | € | — | € | 104 | |||||||||||||||||
| Finland | 482 | $ | 55,064 | € | 48,363 | € | 102 | € | 1,996 | € | — | € | — | € | 104 | |||||||||||||||||
| Pinos Altos | 441 | $ | 50,570 | $ | 50,570 | $ | 115 | $ | 1,238 | $ | — | $ | — | $ | 118 | |||||||||||||||||
| Mexico | 441 | $ | 50,570 | $ | 50,570 | $ | 115 | $ | 1,238 | $ | — | $ | — | $ | 118 | |||||||||||||||||
Notes:
| (i) | This inventory adjustment reflects production costs associated with the portion of production still in inventory. Included in inventory adjustments for Canadian Malartic for the three months ended June 30, 2025 is C$2.0 million associated with the fair value allocated to inventory on Canadian Malartic as part of the purchase price allocation from the acquisition, on March 31, 2023, of the 50% of Canadian Malartic that Agnico Eagle did not then hold. |
| (ii) | In-kind royalty adjustments in respect of Canadian Malartic, Detour Lake and Macassa related to in-kind royalties of 5.0%, 2.0% and 1.5%, respectively, paid in respect of gold production at such mines, which are excluded from production costs under IFRS Accounting Standards and added back in the calculation of minesite costs per tonne. NTI Payments are incurred solely at Meadowbank and are included in production costs under IFRS Accounting Standards and subtracted from production costs in the calculation of total cash costs per ounce as described more fully above. For a discussion of NTI Payments, see "Total Cash Costs per Ounce". |
37
Six Months Ended June 30, 2026
(thousands of United States dollars, except as noted)
| Mine | Tonnes
of ore milled (thousands) | Production costs ($) | Production costs in local currency | Local
currency production costs per tonne | Inventory adjustments in local currency(i) | In-kind royalty and NTI Payment in local currency(ii) | Smelting, refining and marketing charges in local currency | Local currency minesite costs per tonne | ||||||||||||||||||||||||
| LaRonde | 1,489 | 200,948 | C$ | 277,238 | C$ | 186 | C$ | 7,141 | C$ | — | C$ | (18,461 | ) | C$ | 179 | |||||||||||||||||
| Canadian Malartic | 9,094 | 256,134 | C$ | 352,809 | C$ | 39 | C$ | 111,635 | C$ | — | C$ | — | C$ | 51 | ||||||||||||||||||
| Goldex | 1,630 | 80,825 | C$ | 111,634 | C$ | 69 | C$ | (943 | ) | C$ | — | C$ | — | C$ | 68 | |||||||||||||||||
| Quebec | 12,213 | 537,907 | C$ | 741,681 | C$ | 61 | C$ | 117,833 | C$ | — | C$ | (18,461 | ) | C$ | 69 | |||||||||||||||||
| Detour Lake | 14,053 | 322,000 | C$ | 443,686 | C$ | 32 | C$ | (10,358 | ) | C$ | 48,829 | C$ | — | C$ | 34 | |||||||||||||||||
| Macassa | 385 | 142,731 | C$ | 197,137 | C$ | 512 | C$ | 4,879 | C$ | 12,400 | C$ | — | C$ | 557 | ||||||||||||||||||
| Ontario | 14,438 | 464,731 | C$ | 640,823 | C$ | 44 | C$ | (5,479 | ) | C$ | 61,229 | C$ | — | C$ | 48 | |||||||||||||||||
| Meliadine | 1,206 | 215,932 | C$ | 297,484 | C$ | 247 | C$ | (7,152 | ) | C$ | — | C$ | — | C$ | 241 | |||||||||||||||||
| Meadowbank | 2,112 | 333,256 | C$ | 459,496 | C$ | 218 | C$ | (2,927 | ) | C$ | (113,592 | ) | C$ | — | C$ | 162 | ||||||||||||||||
| Nunavut | 3,318 | 549,188 | C$ | 756,980 | C$ | 228 | C$ | (10,079 | ) | C$ | (113,592 | ) | C$ | — | C$ | 191 | ||||||||||||||||
| Fosterville | 420 | 97,186 | A$ | 140,927 | A$ | 336 | A$ | (3,106 | ) | A$ | — | A$ | — | A$ | 328 | |||||||||||||||||
| Australia | 420 | 97,186 | A$ | 140,927 | A$ | 336 | A$ | (3,106 | ) | A$ | — | A$ | — | A$ | 328 | |||||||||||||||||
| Kittila | 1,031 | 135,632 | € | 116,176 | € | 113 | € | (888 | ) | € | — | € | — | € | 112 | |||||||||||||||||
| Finland | 1,031 | 135,632 | € | 116,176 | € | 113 | € | (888 | ) | € | — | € | — | € | 112 | |||||||||||||||||
| Pinos Altos | 869 | 124,701 | $ | 124,701 | $ | 143 | $ | (8,583 | ) | $ | — | $ | — | $ | 134 | |||||||||||||||||
| Mexico | 869 | 124,701 | $ | 124,701 | $ | 143 | $ | (8,583 | ) | $ | — | $ | — | $ | 134 | |||||||||||||||||
Notes:
| (i) | This inventory adjustment reflects production costs associated with the portion of production still in inventory. Included in inventory adjustments for Canadian Malartic for the six months ended June 30, 2026 is C$13.0 million associated with the fair value allocated to inventory on Canadian Malartic as part of the purchase price allocation from the acquisition, on March 31, 2023, of the 50% of Canadian Malartic that Agnico Eagle did not then hold. |
| (ii) | In-kind royalty adjustments in respect of Canadian Malartic, Detour Lake and Macassa related to in-kind royalties of 5.0%, 2.0% and 1.5%, respectively, paid in respect of gold production at such mines, which are excluded from production costs under IFRS Accounting Standards and added back in the calculation of minesite costs per tonne. NTI Payments are incurred solely at Meadowbank and are included in production costs under IFRS Accounting Standards and subtracted from production costs in the calculation of total cash costs per ounce as described more fully above. For a discussion of NTI Payments, see "Total Cash Costs per Ounce". |
38
Six Months Ended June 30, 2025
(thousands of United States dollars, except as noted)
| Mine | Tonnes of ore milled (thousands) | Production costs ($) | Production costs in local currency | Local currency production costs per tonne | Inventory adjustments in local currency(i) | In-kind royalty and NTI Payment in local currency(ii) | Smelting, refining and marketing charges in local currency | Local currency minesite costs per tonne | ||||||||||||||||||||||||
| LaRonde mine | 709 | 125,186 | C$ | 176,243 | C$ | 249 | C$ | (1,519 | ) | C$ | — | C$ | (13,203 | ) | C$ | 228 | ||||||||||||||||
| LZ5 | 640 | 45,192 | C$ | 63,551 | C$ | 99 | C$ | (1,666 | ) | C$ | — | C$ | — | C$ | 97 | |||||||||||||||||
| LaRonde | 1,349 | 170,378 | C$ | 239,794 | C$ | 178 | C$ | (3,185 | ) | C$ | — | C$ | (13,203 | ) | C$ | 166 | ||||||||||||||||
| Canadian Malartic | 9,828 | 234,672 | C$ | 328,611 | C$ | 33 | C$ | 22,204 | C$ | 72,670 | C$ | — | C$ | 43 | ||||||||||||||||||
| Goldex | 1,611 | 72,346 | C$ | 101,756 | C$ | 63 | C$ | (565 | ) | C$ | — | C$ | — | C$ | 63 | |||||||||||||||||
| Quebec | 12,788 | 477,396 | C$ | 670,161 | C$ | 52 | C$ | 18,454 | C$ | 72,670 | C$ | (13,203 | ) | C$ | 59 | |||||||||||||||||
| Detour Lake | 13,466 | 276,276 | C$ | 388,036 | C$ | 29 | C$ | 2,341 | C$ | 25,442 | C$ | — | C$ | 31 | ||||||||||||||||||
| Macassa | 291 | 98,092 | C$ | 137,464 | C$ | 472 | C$ | 6,646 | C$ | 10,692 | C$ | — | C$ | 531 | ||||||||||||||||||
| Ontario | 13,757 | 374,368 | C$ | 525,500 | C$ | 38 | C$ | 8,987 | C$ | 36,134 | C$ | — | C$ | 41 | ||||||||||||||||||
| Meliadine | 1,103 | 196,915 | C$ | 276,854 | C$ | 251 | C$ | (10,860 | ) | C$ | — | C$ | — | C$ | 241 | |||||||||||||||||
| Meadowbank | 1,729 | 233,006 | C$ | 325,614 | C$ | 188 | C$ | (5,107 | ) | C$ | (19,230 | ) | C$ | — | C$ | 174 | ||||||||||||||||
| Nunavut | 2,832 | 429,921 | C$ | 602,468 | C$ | 213 | C$ | (15,967 | ) | C$ | (19,230 | ) | C$ | — | C$ | 200 | ||||||||||||||||
| Fosterville | 351 | 71,058 | A$ | 110,167 | A$ | 314 | A$ | 5,316 | A$ | — | A$ | — | A$ | 329 | ||||||||||||||||||
| Australia | 351 | 71,058 | A$ | 110,167 | A$ | 314 | A$ | 5,316 | A$ | — | A$ | — | A$ | 329 | ||||||||||||||||||
| Kittila | 1,004 | 110,897 | € | 101,506 | € | 101 | € | 634 | € | — | € | — | € | 102 | ||||||||||||||||||
| Finland | 1,004 | 110,897 | € | 101,506 | € | 101 | € | 634 | € | — | € | — | € | 102 | ||||||||||||||||||
| Pinos Altos | 822 | 93,280 | $ | 93,280 | $ | 113 | $ | 3,552 | $ | — | $ | — | $ | 118 | ||||||||||||||||||
| Mexico | 822 | 93,280 | $ | 93,280 | $ | 113 | $ | 3,552 | $ | — | $ | — | $ | 118 | ||||||||||||||||||
Notes:
| (i) | This inventory adjustment reflects production costs associated with the portion of production still in inventory. Included in inventory adjustments for Canadian Malartic for the six months ended June 30, 2025 is C$3.6 million associated with the fair value allocated to inventory on Canadian Malartic as part of the purchase price allocation from the acquisition, on March 31, 2023, of the 50% of Canadian Malartic that Agnico Eagle did not then hold. |
| (ii) | In-kind royalty adjustments in respect of Canadian Malartic, Detour Lake and Macassa related to in-kind royalties of 5.0%, 2.0% and 1.5%, respectively, paid in respect of gold production at such mines, which are excluded from production costs under IFRS Accounting Standards and added back in the calculation of minesite costs per tonne. NTI Payments are incurred solely at Meadowbank and are included in production costs under IFRS Accounting Standards and subtracted from production costs in the calculation of total cash costs per ounce as described more fully above. For a discussion of NTI Payments, see "Total Cash Costs per Ounce". |
39
All-in sustaining costs per ounce
All-in sustaining costs per ounce (also referred to as "AISC per ounce") on a by-product basis is calculated as the aggregate of (i) total cash costs on a by-product basis, (ii) sustaining capital expenditures (including capitalized exploration), (iii) general and administrative expenses (including stock option expense), (iv) lease payments related to sustaining assets and (v) reclamation expenses, each as measured on a per ounce of production basis. These additional costs reflect the additional expenditures that are required to be made to maintain current production levels. AISC per ounce on a co-product basis is calculated in the same manner as AISC per ounce on a by-product basis, except that the total cash costs on a co-product basis are used, meaning the impact of by-product metals is not deducted. Investors should note that AISC per ounce is not reflective of all cash expenditures as it does not include income tax payments, interest costs or dividend payments, nor does it include non-cash expenditures, such as depreciation and amortization. In this news release, unless otherwise indicated, all-in sustaining costs per ounce is reported on a by-product basis (see "Total Cash Costs per Ounce" for a discussion of regarding the Company's use of by-product basis reporting). For periods commencing on or after January 1, 2026, the Company revised the composition of certain of its non-GAAP performance measures, including "all-in sustaining costs per ounce", to adjust for the NTI Payments, that is, payments made to NTI under the Company's mineral production leases in respect of the Amaruq mine at Meadowbank. This revised composition aligns with changes made to the calculation of "total cash costs per ounce", discussed above in "Total Cash Costs per Ounce". For the reasons outlined above in respect of the change to the composition of "total cash costs per ounce", the Company believes that this revision to the composition of AISC per ounce is helpful to both management and investors as it better reflects the cost performance at the Amaruq mine at Meadowbank and conforms the calculations of costs used across all of the Company's mines.
Management believes that AISC per ounce is useful to investors as it reflects total sustaining expenditures of producing and selling an ounce of gold while maintaining current operations and, as such, provides useful information about operating performance. Management is aware, and investors should note, that these per ounce measures of performance can be affected by fluctuations in foreign exchange rates and, in the case of AISC per ounce on a by-product basis, by-product metal prices. Management compensates for these inherent limitations by using, and investors should also consider using, these measures in conjunction with data prepared in accordance with IFRS Accounting Standards and minesite costs per tonne, as this measure is not necessarily indicative of operating costs or cash flow measures prepared in accordance with IFRS Accounting Standards.
The Company follows the guidance on calculation of AISC per ounce released by the World Gold Council ("WGC") in 2018, except in aspect of its treatment of the NTI Payment at Meadowbank. As discussed above, the Company views the NTI Payments as having similar characteristics to the Crown royalty, which is treated as income tax under IFRS Accounting Standards and therefore excluded from the Company's AISC calculations. The WGC is a non-regulatory market development organization for the gold industry that has worked closely with its member companies to develop guidance in respect of relevant non-GAAP measures. Notwithstanding the Company's adoption of the WGC's guidance, AISC per ounce reported by the Company may not be comparable to data reported by other gold mining companies.
40
The following table sets out a reconciliation of production costs to all-in sustaining costs per ounce for the three and six months ended June 30, 2026 and June 30, 2025 on both a by-product basis (deducting the impact of by-product metals from production costs) and a co-product basis (without deducting the impact of by-product metals from production costs).
| (United States dollars per ounce, except where noted) | Three Months Ended June 30, |
Six Months
Ended June 30, |
||||||||||||||
| 2026 | 2025 | 2026 | 2025 | |||||||||||||
| Production costs per the Second Quarter Financial Statements (thousands of United States dollars) | $ | 953,758 | $ | 789,187 | $ | 1,909,345 | $ | 1,556,920 | ||||||||
| Gold production (ounces)(i) | 855,816 | 866,029 | 1,680,925 | 1,739,823 | ||||||||||||
| Production costs per ounce | $ | 1,114 | $ | 911 | $ | 1,136 | $ | 895 | ||||||||
| Adjustments: | ||||||||||||||||
| Inventory adjustments(ii) | (11 | ) | 12 | (3 | ) | 11 | ||||||||||
| In-kind royalty and NTI Payments(iii) | 24 | 39 | 18 | 36 | ||||||||||||
| Realized gains and losses on hedges of production costs | (4 | ) | — | (5 | ) | 4 | ||||||||||
| Smelting, refining, and marketing charges | 6 | 9 | 7 | 8 | ||||||||||||
| Total cash costs per ounce (co-product basis) | $ | 1,129 | $ | 971 | $ | 1,153 | $ | 954 | ||||||||
| Impact of by-product metals | (75 | ) | (46 | ) | (80 | ) | (44 | ) | ||||||||
| Total cash costs per ounce (by-product basis) | $ | 1,054 | $ | 925 | $ | 1,073 | $ | 910 | ||||||||
| Adjustments: | ||||||||||||||||
| Sustaining capital expenditures (including capitalized exploration) | 286 | 273 | 265 | 234 | ||||||||||||
| General and administrative expenses (including stock option expense) | 68 | 67 | 81 | 68 | ||||||||||||
| Non-cash reclamation provision and sustaining leases(iv) | 51 | 16 | 52 | 15 | ||||||||||||
| All-in sustaining costs per ounce (by-product basis) | $ | 1,459 | $ | 1,281 | $ | 1,471 | $ | 1,227 | ||||||||
| Impact of by-product metals | 75 | 46 | 80 | 44 | ||||||||||||
| All-in sustaining costs per ounce (co-product basis) | $ | 1,534 | $ | 1,327 | $ | 1,551 | $ | 1,271 | ||||||||
Notes:
(i) Gold production for the three and six months ended June 30, 2026 excludes 440 and 858 ounces of payable production of gold at La India and 58 and 134 ounces of payable production of gold at Creston Mascota, respectively, which were produced from residual leaching. Gold production for the three and six months ended June 30, 2025 excludes 858 and 2,669 ounces of payable production of gold at La India and 39 and 64 ounces of payable production of gold at Creston Mascota, respectively, which were produced from residual leaching.
(ii) Under the Company's revenue recognition policy, revenue from contracts with customers is recognized upon the transfer of control over metals sold to the customer. As the total cash costs per ounce of gold produced are calculated on a production basis, an inventory adjustment is made to reflect the portion of production not yet recognized as revenue. Included in inventory adjustments for Canadian Malartic for the three and six months ended June 30, 2026 is C$5.8 and C$9.4 million, respectively, associated with the fair value allocated to inventory on Canadian Malartic as part of the purchase price allocation from the acquisition, on March 31, 2023, of the 50% of Canadian Malartic that Agnico Eagle did not then hold. Included in inventory adjustments for Canadian Malartic for the three and six months ended June 30, 2025 is C$1.4 and C$2.5 million, respectively, associated with the fair value allocated to inventory on Canadian Malartic as part of the purchase price allocation from the acquisition, on March 31, 2023, of the 50% of Canadian Malartic that Agnico Eagle did not then hold.
(iii) In-kind royalty adjustments in respect of Canadian Malartic, Detour Lake and Macassa related to in-kind royalties of 5.0%, 2.0% and 1.5%, respectively, paid in respect of gold production at such mines, which are excluded from production costs under IFRS Accounting Standards and added back in the calculation of all-in sustaining costs per ounce. NTI Payments are incurred solely at Meadowbank and are included in production costs under IFRS Accounting Standards and subtracted from production costs in the calculation of total cash costs per ounce as described more fully above. For a discussion of NTI Payments, see "Total Cash Costs per Ounce".
(iv) Sustaining leases are lease payments related to sustaining assets.
41
Adjusted net income
Adjusted net income is calculated by adjusting the net income as recorded in the Second Quarter Financial Statements for the effects of certain items that the Company believes are not reflective of the Company's underlying performance for the reporting period. Adjusted net income is calculated by adjusting net income for certain non-recurring, unusual and other items such as foreign exchange translation, realized and unrealized gains or losses on derivative financial instruments, severance, transaction costs related to acquisitions, revaluation gains and losses, environmental remediation charges, gains or losses on the disposal of assets, purchase price allocations to inventory, debt extinguishment costs, impairment loss charges and reversals, gains and losses on the sale of equity securities, retroactive payments, self insurance losses, gains and losses on the sale of non-strategic properties, multi-year donations, disposal of supplies inventory at non-operating sites, and income and mining taxes adjustments. Adjusted net income per share is calculated by dividing adjusted net income by the weighted average number of shares outstanding on a basic and diluted basis.
The Company believes that these generally accepted industry measures are useful to investors in that they allow for the evaluation of the results of continuing operations and in making comparisons between periods. Adjusted net income and adjusted net income per share are intended to provide investors with information about the Company's continuing income generating capabilities from its core mining business, excluding the above adjustments, which the Company believes are not reflective of operational performance. Management uses this measure to, and believes it is useful to investors so they can, understand and monitor for the operating performance of the Company in conjunction with other data prepared in accordance with IFRS Accounting Standards.
42
The following table sets out the calculation of adjusted net income and adjusted net income per share for the three and six months ended June 30, 2026, and June 30, 2025.
Reconciliation of Net Income to Adjusted Net Income
| Three Months Ended June 30, |
Six Months Ended June 30, |
|||||||||||||||
| (thousands) | 2026 | 2025 | 2026 | 2025 | ||||||||||||
| Net income for the period - basic | $ | 1,600,453 | $ | 1,068,711 | $ | 3,295,914 | $ | 1,883,442 | ||||||||
| Dilutive impact of cash settling LTIP | (4,539 | ) | 2,939 | 671 | — | |||||||||||
| Net income for the period - diluted | $ | 1,595,914 | $ | 1,071,650 | $ | 3,296,585 | $ | 1,883,442 | ||||||||
| Foreign exchange translation | 20,128 | (11,571 | ) | 19,395 | (11,631 | ) | ||||||||||
| Loss (gain) on derivative financial instruments | 81,404 | (125,264 | ) | 76,704 | (194,123 | ) | ||||||||||
| Environmental remediation | 9,104 | 14,234 | 23,074 | 21,965 | ||||||||||||
| Net loss on disposal of property, plant and equipment | 6,597 | 6,459 | 16,836 | 12,105 | ||||||||||||
| Purchase price allocation to inventory(i) | (5,785 | ) | 1,466 | (9,426 | ) | 2,534 | ||||||||||
| Debt extinguishment costs | — | 5,407 | — | 5,407 | ||||||||||||
| Impairment loss(ii) | — | — | — | 10,554 | ||||||||||||
| Gain on sale of investments | (155,319 | ) | — | (155,319 | ) | — | ||||||||||
| Multi-year donations | 19,369 | — | 19,369 | — | ||||||||||||
| Other(iii) | — | 2,077 | — | 2,077 | ||||||||||||
| Income and mining taxes adjustments(iv) | (35,289 | ) | 14,261 | (40,129 | ) | 13,558 | ||||||||||
| Adjusted net income for the period - basic | $ | 1,540,662 | $ | 975,780 | $ | 3,246,418 | $ | 1,745,888 | ||||||||
| Adjusted net income for the period - diluted | $ | 1,536,123 | $ | 978,719 | $ | 3,247,089 | $ | 1,745,888 | ||||||||
Notes:
(i) As part of the purchase price allocation in a business combination, the Company is required to determine the fair value of net assets acquired. The fair value of inventory acquired is estimated based on the selling cost less costs to be incurred plus a profit margin on those costs resulting in a fair value adjustment to the carrying value of inventories acquired. These non-cash fair value adjustments which affected the cost of inventory sold during the period and are not representative of ongoing operations, were removed from net income in the calculation of adjusted net income.
(ii) Relates to the Company's ownership percentage of an impairment loss recorded by an associate.
(iii) Other adjustments relate to retroactive payments that management considers not reflective of the Company's underlying performance in the comparative period.
(iv) Income and mining taxes adjustments reflect items such as foreign currency translation recorded to the income and mining taxes expense, the impact of income and mining taxes on adjusted items, recognition of previously unrecognized capital losses, the result of income and mining taxes audits, impact of tax law changes and adjustments to prior period tax filings.
43
EBITDA and adjusted EBITDA
EBITDA is calculated by adjusting net income for finance costs, amortization of property, plant and mine development and income and mining tax expense line items as reported in the Second Quarter Financial Statements.
Adjusted EBITDA removes the effects of certain items that the Company believes are not reflective of the Company's underlying performance for the reporting period. Adjusted EBITDA is calculated by adjusting the EBITDA calculation for certain non-recurring, unusual and other items such as foreign exchange translation, realized and unrealized gains or losses on derivative financial instruments, severance, non-recurring, unusual and other transaction costs related to acquisitions, revaluation gains and losses, environmental remediation, gains or losses on the disposal of assets, purchase price allocations to inventory, debt extinguishment costs, impairment loss charges and reversals, gains and losses on the sale of equity securities, retroactive payments, self insurance losses, gains and losses on the sale of non-strategic properties, multi-year donations, and disposal of supplies inventory at non-operating sites.
The Company believes that these generally accepted industry measures are useful in that they allow for the evaluation of the cash-generating capability of the Company to fund its working capital, capital expenditure and debt repayments. EBITDA and Adjusted EBITDA are intended to provide investors with information about the Company's continuing cash-generating capability from its core mining business, excluding the above adjustments, which management believes are not reflective of operational performance. Management uses these measures to, and believes it is useful to investors so they can, understand and monitor the cash-generating capability of the Company in conjunction with other data prepared in accordance with IFRS Accounting Standards.
44
The following table sets out the calculation of EBITDA and Adjusted EBITDA for the three and six months ended June 30, 2026 and June 30, 2025.
| Three Months Ended June 30, | Six Months Ended June 30, | |||||||||||||||
| (thousands) | 2026 | 2025 | 2026 | 2025 | ||||||||||||
| Net income for the period | $ | 1,600,453 | $ | 1,068,711 | $ | 3,295,914 | $ | 1,883,442 | ||||||||
| Finance costs | 16,039 | 27,429 | 31,795 | 49,873 | ||||||||||||
| Amortization of property, plant and mine development | 423,256 | 376,956 | 843,522 | 793,756 | ||||||||||||
| Income and mining tax expense | 722,402 | 547,908 | 1,586,565 | 927,748 | ||||||||||||
| EBITDA | 2,762,150 | 2,021,004 | 5,757,796 | 3,654,819 | ||||||||||||
| Foreign exchange translation | 20,128 | (11,571 | ) | 19,395 | (11,631 | ) | ||||||||||
| Loss (gain) on derivative financial instruments | 81,404 | (125,264 | ) | 76,704 | (194,123 | ) | ||||||||||
| Environmental remediation | 9,104 | 14,234 | 23,074 | 21,965 | ||||||||||||
| Net loss on disposal of property, plant and equipment | 6,597 | 6,459 | 16,836 | 12,105 | ||||||||||||
| Purchase price allocation to inventory(i) | (5,785 | ) | 1,466 | (9,426 | ) | 2,534 | ||||||||||
| Debt extinguishment costs | — | 5,407 | — | 5,407 | ||||||||||||
| Impairment loss(ii) | — | — | — | 10,554 | ||||||||||||
| Gain on sale of investments | (155,319 | ) | — | (155,319 | ) | — | ||||||||||
| Multi-year donations | 19,369 | — | 19,369 | — | ||||||||||||
| Other(iii) | — | 2,077 | — | 2,077 | ||||||||||||
| Adjusted EBITDA | $ | 2,737,648 | $ | 1,913,812 | $ | 5,748,429 | $ | 3,503,707 | ||||||||
Notes:
(i) As part of the purchase price allocation in a business combination, the Company is required to determine the fair value of net assets acquired. The fair value of inventory acquired is estimated based on the selling cost less costs to be incurred plus a profit margin on those costs resulting in a fair value adjustment to the carrying value of inventories acquired. These non-cash fair value adjustments which affected the cost of inventory sold during the period and are not representative of ongoing operations, were removed from net income in the calculation of adjusted net income.
(ii) Relates to the Company's ownership percentage of an impairment loss recorded by an associate.
(iii) Other adjustments relate to retroactive payments that management considers not reflective of the Company's underlying performance in the comparative period.
Cash provided by operating activities before changes in non-cash components of working capital and its per share ratio
Cash provided by operating activities before changes in non-cash components of working capital is calculated by adjusting the cash provided by operating activities as shown in the Second Quarter Financial Statements for the effects of changes in non-cash components of working capital such as income taxes, inventories, other current assets, accounts payable and accrued liabilities and interest payable. The per share ratio is calculated by dividing cash provided by operating activities before changes in non-cash components of working capital by the weighted average number of shares outstanding on a basic basis. The Company believes that changes in working capital can be volatile due to numerous factors, including the timing of payments. Management uses these measures to, and believes they are useful to investors so they can, assess the underlying operating cash flow performance and future operating cash flow generating capabilities of the Company in conjunction with other data prepared in accordance with IFRS Accounting Standards. A reconciliation of these measures to the nearest IFRS Accounting Standards measure is provided below.
Free cash flow and free cash flow before changes in non-cash components of working capital
Free cash flow is calculated by deducting additions to property, plant and mine development from the cash provided by operating activities line item as recorded in the Second Quarter Financial Statements.
45
Free cash flow before changes in non-cash components of working capital is calculated by excluding items such as the effect of changes in non-cash components of working capital from free cash flow, which includes income taxes, inventory, other current assets and accounts payable and accrued liabilities.
The Company believes that these generally accepted industry measures are useful in that they allow for the evaluation of the Company's ability to repay creditors and return cash to shareholders without relying on external sources of funding. Free cash flow and free cash flow before changes in non-cash components of working capital also provide investors with information about the Company's financial position and its ability to generate cash to fund operational and capital requirements as well as return cash to shareholders. Management uses these measures in conjunction with other data prepared in accordance with IFRS Accounting Standards to, and believes it is useful to investors so they can, understand and monitor the cash-generating ability of the Company.
The following table sets out the calculation of free cash flow and free cash flow before changes in non-cash components of working capital for the three and six months ended June 30, 2026 and June 30, 2025.
| Three Months Ended June 30, | Six Months Ended June 30, | |||||||||||||||
| (thousands, except where noted) | 2026 | 2025 | 2026 | 2025 | ||||||||||||
| Cash provided by operating activities | $ | 2,144,120 | $ | 1,845,488 | $ | 3,489,988 | $ | 2,889,734 | ||||||||
| Additions to property, plant and mine development | (809,255 | ) | (540,476 | ) | (1,423,004 | ) | (990,600 | ) | ||||||||
| Free cash flow | 1,334,865 | 1,305,012 | 2,066,984 | 1,899,134 | ||||||||||||
| Changes in income taxes | 13,390 | (478,106 | ) | 1,002,470 | (301,367 | ) | ||||||||||
| Changes in inventory | 42,494 | 53,061 | 5,694 | 22,144 | ||||||||||||
| Changes in other current assets | 18,741 | 38,152 | 29,755 | 6,762 | ||||||||||||
| Changes in accounts payable and accrued liabilities | (106,541 | ) | (126,509 | ) | (184,341 | ) | (75,797 | ) | ||||||||
| Free cash flow before changes in non-cash components of working capital | $ | 1,302,949 | $ | 791,610 | $ | 2,920,562 | $ | 1,550,876 | ||||||||
| Additions to property, plant and mine development | 809,255 | 540,476 | 1,423,004 | 990,600 | ||||||||||||
| Cash provided by operating activities before changes in non-cash components of working capital | $ | 2,112,204 | $ | 1,332,086 | $ | 4,343,566 | $ | 2,541,476 | ||||||||
| Cash provided by operating activities per share - basic | $ | 4.27 | $ | 3.67 | $ | 6.97 | $ | 5.75 | ||||||||
| Cash provided by operating activities before changes in non-cash components of working capital per share - basic | $ | 4.21 | $ | 2.65 | $ | 8.67 | $ | 5.06 | ||||||||
| Free cash flow per share - basic | $ | 2.66 | $ | 2.60 | $ | 4.13 | $ | 3.78 | ||||||||
| Free cash flow before changes in non-cash components of working capital per share - basic | $ | 2.60 | $ | 1.58 | $ | 5.83 | $ | 3.09 | ||||||||
Operating margin
Operating margin is calculated by deducting production costs from revenue from mining operations. In order to reconcile operating margin to net income as recorded in the Second Quarter Financial Statements, the Company adds the following items to the operating margin: amortization of property, plant and mine development; exploration and corporate development expenses; general and administrative expenses; finance costs; gain (loss) on derivative financial instruments; foreign currency translation (gain) loss; care and maintenance expenses; other income and expenses; income and mining taxes expense; revaluation gain and impairment losses (reversals). The Company believes that operating margin is a helpful measure to investors as it reflects the operating performance of its individual mines associated with the ongoing production and sale of gold and by-product metals without allocating Company-wide overhead, such as amortization of property, plant and mine development, exploration and corporate development expenses, general and administrative expenses, finance costs, gains and losses on derivative financial instruments, foreign currency translation gains and losses, care and maintenance expenses, other income and expenses and income and mining taxes expense. Management uses this measure internally to plan and forecast future operating results. Management believes this measure is helpful to investors as it provides them with additional information about the Company's underlying operating results, though it should be evaluated in conjunction with other data prepared in accordance with IFRS Accounting Standards.
46
The following table sets out the calculation of operating margin for the three and six months ended June 30, 2026 and June 30, 2025.
| Three Months Ended June 30, | Six Months Ended June 30, | |||||||||||||||
| (thousands) | 2026 | 2025 | 2026 | 2025 | ||||||||||||
| Net income for the period | $ | 1,600,453 | $ | 1,068,711 | $ | 3,295,914 | $ | 1,883,442 | ||||||||
| Amortization of property, plant and mine development | 423,256 | 376,956 | 843,522 | 793,756 | ||||||||||||
| Exploration and corporate development | 61,531 | 52,100 | 114,087 | 93,905 | ||||||||||||
| General and administrative | 57,948 | 57,890 | 135,798 | 118,599 | ||||||||||||
| Finance costs | 16,039 | 27,429 | 31,795 | 49,873 | ||||||||||||
| Loss (gain) on derivative financial instruments | 81,404 | (125,264 | ) | 76,704 | (194,123 | ) | ||||||||||
| Environmental remediation | 9,104 | 14,234 | 23,074 | 21,965 | ||||||||||||
| Foreign exchange translation | 20,128 | (11,571 | ) | 19,395 | (11,631 | ) | ||||||||||
| Care and maintenance | 15,275 | 15,682 | 37,871 | 29,583 | ||||||||||||
| Gain on sale of investments | (155,319 | ) | — | (155,319 | ) | — | ||||||||||
| Other income and expenses | (3,161 | ) | 2,839 | (16,344 | ) | 14,312 | ||||||||||
| Income and mining taxes expense | 722,402 | 547,908 | 1,586,565 | 927,748 | ||||||||||||
| Operating margin | $ | 2,849,060 | $ | 2,026,914 | $ | 5,993,062 | $ | 3,727,429 | ||||||||
Capital expenditures
Capital expenditures are calculated by deducting working capital adjustments from additions to property, plant and mine development per the Second Quarter Financial Statements.
Capital expenditures are classified into sustaining capital expenditures, sustaining capitalized exploration, development capital expenditures and development capitalized exploration. Sustaining capital expenditures and sustaining capitalized exploration are expenditures incurred during the production phase to sustain and maintain existing assets so they can achieve constant expected levels of production from which the Company will derive economic benefits. Sustaining capital expenditures and sustaining capitalized exploration include expenditure for assets to retain their existing productive capacity as well as to enhance performance and reliability of the operations. Development capital expenditures and development capitalized exploration represent the spending at new projects and/or expenditures at existing operations that are undertaken with the intention to increase production levels or mine life above the current plans. Management uses these measures in the capital allocation process and to assess the effectiveness of its investments. Management believes these measures are useful so investors can assess the purpose and effectiveness of the capital expenditures split between sustaining and development in each reporting period. The classification between sustaining and development capital expenditures does not have a standardized definition in accordance with IFRS Accounting Standards and other companies may classify expenditures in a different manner.
47
The following table sets out a reconciliation of sustaining capital expenditures, sustaining capitalized exploration, development capital expenditures and development capitalized exploration to the additions to property, plant and mine development per the Second Quarter Financial Statements for the three and six months ended June 30, 2026 and June 30, 2025.
| Three Months Ended June 30, |
Six Months Ended June 30, |
|||||||||||||||
| (thousands) | 2026 | 2025 | 2026 | 2024 | ||||||||||||
| Sustaining capital expenditures | $ | 236,950 | $ | 233,600 | $ | 433,542 | $ | 401,676 | ||||||||
| Sustaining capitalized exploration | 8,843 | 5,514 | 14,230 | 9,962 | ||||||||||||
| Development capital expenditures | 462,274 | 226,646 | 754,564 | 412,870 | ||||||||||||
| Development capitalized exploration | 92,853 | 72,175 | 172,194 | 132,679 | ||||||||||||
| Total Capital Expenditures | $ | 800,920 | $ | 537,935 | $ | 1,374,530 | $ | 957,187 | ||||||||
| Working capital adjustments | 8,335 | 2,541 | 48,474 | 33,413 | ||||||||||||
| Additions to property, plant and mine development per the Second Quarter Financial Statements | $ | 809,255 | $ | 540,476 | $ | 1,423,004 | $ | 990,600 | ||||||||
Net cash
Net cash is calculated by adjusting the total of the current portion of long-term debt and non-current portion of long-term debt as recorded on the Second Quarter Financial Statements for deferred financing costs and cash and cash equivalents. Management believes the measure of net cash is useful to help investors assess the Company's overall cash position and to evaluate the future debt capacity of the Company.
The following table sets out a reconciliation of long-term debt per the Second Quarter Financial Statements to net cash as at June 30, 2026, and December 31, 2025.
| As at | As at | |||||||
| (thousands) | June 30, 2026 | Dec 31, 2025 | ||||||
| Long-term debt | $ | (196,825 | ) | $ | (196,271 | ) | ||
| Cash and cash equivalents | 3,463,957 | 2,866,053 | ||||||
| Net cash | $ | 3,267,132 | $ | 2,669,782 | ||||
Forward-Looking Non-GAAP Measures
This news release contains information regarding estimated future total cash costs per ounce, minesite costs per tonne and AISC per ounce. The estimates are based upon the total cash costs per ounce, minesite costs per tonne and AISC per ounce that the Company expects to incur to mine gold at its mining operations and do not include certain costs that will vary over time as each project is developed and mined. It is therefore not practicable to reconcile these forward-looking non-GAAP financial measures to the most comparable IFRS Accounting Standards measure.
48
Forward-Looking Statements
The information in this news release has been prepared as at July 29, 2026. Certain statements contained in this news release constitute "forward-looking statements" within the meaning of the United States Private Securities Litigation Reform Act of 1995 and "forward-looking information" under the provisions of Canadian provincial securities laws and are referred to herein as "forward-looking statements". All statements, other than statements of historical fact, that address circumstances, events, activities or developments that could, or may or will occur are forward-looking statements. When used in this news release, the words "achieve", "aim", "anticipate", "commit", "could", "envisions", "estimate", "expect", "forecast", "future", "guide", "objective", "plan", "potential", "schedule", "target", "track", "will", and similar expressions are intended to identify forward-looking statements. Such statements include the Company's forward-looking guidance, including metal production, estimated ore grades, recovery rates, project timelines, drilling targets or results, life of mine estimates, total cash costs per ounce, AISC per ounce, other expenses and cash flows; the potential for additional gold production at the Company's sites, including the potential to increase annual gold production by 20% to 30% over the next decade, exceeding four million ounces by the 2030s; the estimated timing and conclusions of the Company's studies and evaluations; the methods by which ore will be extracted or processed; the Company's plans at Detour Lake underground, Upper Beaver, Odyssey, Hope Bay and San Nicolás, including the approval, timing, funding, completion and commissioning thereof and the commencement of production therefrom; statements concerning the Company's "fill-the-mill" strategy at Canadian Malartic; statements regarding the rock mass movement at the Barnat open pit's effect on production; statements regarding the remediation plan and redesign at the Barnat open pit; statements regarding the effect of the rock mass movement on the development or production outlook at the Odyssey mine or change to the Company's pathway to increase annual production at Canadian Malartic; the Company's plans to reduce dilution associated with the acquisition of Rupert; statements concerning other expansion projects, recovery rates, mill throughput, optimization efforts and projected exploration, including costs and other estimates upon which such projections are based; timing and amounts of capital expenditures, other expenditures and other cash needs, and expectations as to the funding thereof; estimates of future mineral reserves, mineral resources, mineral production and sales; the projected development of certain ore deposits, including estimates of exploration, development, production, closure and other capital expenditures and estimates of the timing of such exploration, development, production and closure or decisions with respect to such exploration, development, production and closure; estimates of mineral reserves and mineral resources and the effect of drill results and studies on future mineral reserves and mineral resources; the Company's ability to obtain the necessary permits and authorizations in connection with its proposed or current exploration, development and mining operations, and the anticipated timing or submission or receipt thereof; future exploration; the anticipated timing of events with respect to the Company's mine sites; the Company's plans and strategies with respect to sustainability initiatives; the sufficiency of the Company's cash resources; the Company's plans with respect to hedging and the effectiveness of its hedging strategies and the economic impact thereof; future activity with respect to the Company's unsecured revolving bank credit facility and other indebtedness; future dividend amounts, record dates and payment dates; statements regarding potential payments under the CVRs; the effect of tariffs, trade restrictions and the effect of geopolitical events on the Company, whether through availability of inputs or inflation; plans with respect to activity under the NCIB and the renewal thereof, including the anticipated increase in the purchase limit; and anticipated trends with respect to the Company's operations, exploration and the funding thereof. Such statements reflect the Company's views as at the date of this news release and are subject to certain risks, uncertainties and assumptions, and undue reliance should not be placed on such statements. Forward-looking statements are necessarily based upon a number of factors and assumptions that, while considered reasonable by Agnico Eagle as of the date of such statements, are inherently subject to significant business, economic and competitive uncertainties and contingencies. The material factors and assumptions used in the preparation of the forward-looking statements contained herein, which may prove to be incorrect, include, but are not limited to, the assumptions set forth herein and in management's discussion and analysis for the year ended December 31, 2025 (the "2025 MD&A") and the Company's Annual Information Form (the "AIF") for the year ended December 31, 2025 filed with Canadian securities regulators and that are included in its Annual Report on Form 40-F for the year ended December 31, 2025 (the "Form 40-F") filed with the U.S. Securities and Exchange Commission (the "SEC") as well as: that there are no significant disruptions affecting operations; that production, permitting, development, expansion and the ramp-up of operations at each of Agnico Eagle's properties proceeds on a basis consistent with current expectations and plans; that the Company's plans for its mining operations are not changed or amended in a material way; that the relevant metal prices, foreign exchange rates and prices for key mining and construction inputs (including labour and electricity) will be consistent with Agnico Eagle's expectations; that the effect of tariffs or trade disputes will not materially affect the price or availability of the inputs the Company uses at its operations; that Agnico Eagle's current estimates of mineral reserves, mineral resources, mineral grades and metal recovery are accurate; that there are no material delays in the timing for completion of ongoing growth projects; that seismic activity at the Company's operations at LaRonde, Goldex, Fosterville and other properties is as expected by the Company and that the Company's efforts to mitigate its effect on mining operations, including with respect to community relations, are successful; that the Company's current plans to address climate change and reduce greenhouse gas emissions are successful; that the Company's current plans to optimize production are successful; that there are no material variations in the current tax and regulatory environment; that governments, the Company or others do not take measures in response to pandemics or other health emergencies or otherwise that, individually or in the aggregate, materially affect the Company's ability to operate its business or its productivity; and that measures taken relating to, or other effects of, pandemics or other health emergencies do not affect the Company's ability to obtain necessary supplies and deliver them to its mine sites. Many factors, known and unknown, could cause the actual results to be materially different from those expressed or implied by such forward-looking statements. Such risks include, but are not limited to: the volatility of prices of gold and other metals; uncertainty of mineral reserves, mineral resources, mineral grades and mineral recovery estimates; uncertainty of future production, project development, capital expenditures and other costs; foreign exchange rate fluctuations; inflationary pressures; financing of additional capital requirements; cost of exploration and development programs; seismic activity at the Company's operations, including at LaRonde, Goldex and Fosterville; mining risks; community protests, including by Indigenous groups; risks associated with foreign operations; risks associated with joint ventures; governmental and environmental regulation; the volatility of the Company's stock price; risks associated with the Company's currency, fuel and by-product metal derivative strategies; the current interest rate environment; the potential for major economies to encounter a slowdown in economic activity or a recession; the potential for increased conflict or hostilities in various regions, including Europe, South America and the Middle East; and the extent and manner of communicable diseases or outbreaks, and measures taken by governments, the Company or others to attempt to mitigate the spread thereof may directly or indirectly affect the Company. For a more detailed discussion of such risks and other factors that may affect the Company's ability to achieve the expectations set forth in the forward-looking statements contained in this news release, see the AIF and 2025 MD&A filed on SEDAR+ at www.sedarplus.ca and included in the Form 40-F filed on EDGAR at www.sec.gov, as well as the Company's other filings with the Canadian securities regulators and the SEC. Other than as required by law, the Company does not intend, and does not assume any obligation, to update these forward-looking statements.
49
Notes to Investors Regarding Certain Project Evaluations
The forecast parameters surrounding certain projects, including Detour Lake underground, Upper Beaver, Hope Bay and the "fill-the-mill" strategy at Canadian Malartic (Odyssey Shaft #1, Odyssey Shaft #2, Marban, Wasamac), were based on internal evaluations, which are preliminary in nature and include inferred mineral resources that are too speculative geologically to have economic considerations applied to them that would enable them to be categorized as mineral reserves and there is no certainty that the forecast production amounts, set out in the table below, will be realized.
| Key Project | 2026
Gold Production Guidance (000s oz) |
Anticipated Production Ramp-up Year |
Anticipated Incremental Annual Gold Production (000s oz) |
Anticipated Incremental Annual Copper Production (tonnes) |
||||||||||||
| Canadian Malartic | 505 — 535 | 2033 | 400 — 500 | — | ||||||||||||
| Detour Lake | 700 — 730 | 2030 | 300 — 350 | — | ||||||||||||
| Upper Beaver | — | 2030 | 200 — 225 | 3,600 | ||||||||||||
| Hope Bay | — | 2030 | 400 — 425 | — | ||||||||||||
| San Nicolás (50%)* | — | 2030 | — | 50,000 — 60,000 | ||||||||||||
*San Nicolás incremental annual production also includes approximately 150,000 to 160,000 tonnes of zinc in first eight years of production and 20,000 to 30,000 tonnes of zinc in subsequent years
50
The basis for the internal evaluations and the qualifications and assumptions made by the qualified persons who undertook the internal evaluations are set out in this news release and the news releases dated June 29, 2024 for Detour Lake underground, dated July 31, 2024 for Upper Beaver and dated May 19, 2026 for Hope Bay. The results of the internal evaluations had no impact on the results of any pre-feasibility or feasibility study. An updated internal evaluation is expected for the "fill-the-mill" strategy at Canadian Malartic, for Detour Lake and Upper Beaver in 2027.
Scientific and Technical Information
The scientific and technical information contained in this news release relating to Nunavut, Quebec and Finland operations has been approved by Dominique Girard, Eng., Executive Vice-President & Chief Operating Officer – Nunavut, Quebec & Europe; relating to Ontario, Australia and Mexico operations has been approved by Natasha Vaz, P.Eng., Executive Vice-President & Chief Operating Officer – Ontario, Australia & Mexico; and relating to exploration has been approved by Guy Gosselin, Eng. and P.Geo., Executive Vice-President, Exploration, each of whom is a "Qualified Person" for the purposes of the Canadian Securities Administrators' National Instrument 43-101 – Standards of Disclosure for Mineral Projects ("NI 43-101").
Additional Information
Additional information about each of the Company's material mineral projects as at December 31, 2025, including information regarding data verification, key assumptions, parameters and methods used to estimate mineral reserves and mineral resources and the risks that could materially affect the development of the mineral reserves and mineral resources required by sections 3.2 and 3.3 and paragraphs 3.4(a), (c) and (d) of NI 43-101 can be found in the Company's AIF and 2025 MD&A filed on SEDAR+ and with the SEC on EDGAR and in the following technical reports filed on SEDAR+ in respect of the Company's material mineral properties: Detour Lake Operation, Ontario, Canada, NI 43-101 Technical Report (September 20, 2024); NI 43-101 Technical Report of the LaRonde complex in Quebec, Canada (March 24, 2023); NI 43-101 Technical Report Canadian Malartic Mine, Quebec, Canada (March 25, 2021); Technical Report on the Mineral Resources and Mineral Reserves at Meadowbank Gold complex including the Amaruq Satellite Mine Development, Nunavut, Canada as at December 31, 2017 (February 14, 2018); and the Updated Technical Report on the Meliadine Gold Project, Nunavut, Canada (February 11, 2015).
51
APPENDIX A – EXPLORATION DETAILS
East Gouldie and Odyssey deposits at Odyssey mine
| Drill hole | Deposit / zone | From (metres) |
To (metres) |
Depth of below surface |
Estimated true width (metres) |
Gold grade (g/t) (uncapped) |
Gold grade (capped)* |
| MEX25-354 | East Gouldie | 1,911.1 | 1,927.5 | 1,917 | 16.4** | 1.9 | 1.9 |
| and | East Gouldie | 1,944.0 | 1,963.2 | 1,951 | 19.2** | 4.7 | 3.8 |
| including | 1,945.5 | 1,949.4 | 1,945 | 3.8** | 15.8 | 11.2 | |
| and | East Gouldie | 1,972.6 | 1,988.4 | 1,978 | 15.8** | 2.6 | 2.6 |
| UGEG-071-034 | East Gouldie | 508.0 | 519.6 | 1,046 | 10.8 | 6.6 | 6.6 |
| and | East Gouldie | 562.0 | 581.0 | 1,088 | 17.2 | 1.9 | 1.9 |
| and | East Gouldie | 630.5 | 642.5 | 1,133 | 11.6 | 6.1 | 6.1 |
| including | 632.2 | 634.9 | 1,130 | 2.7 | 12.6 | 12.6 | |
| UGEG-071-035 | East Gouldie | 480.6 | 493.5 | 984 | 12.5 | 4.6 | 4.6 |
| and | East Gouldie | 637.6 | 644.7 | 1,078 | 6.9 | 11.1 | 9.2 |
| including | 640.8 | 642.3 | 1,078 | 1.4 | 29.3 | 20.0 | |
| UGEG-071-043 | East Gouldie | 469.2 | 476.5 | 945 | 7.0 | 12.8 | 9.2 |
| including | 473.0 | 475.0 | 946 | 1.9 | 33.2 | 20.0 | |
| UGEG-075-062 | East Gouldie | 554.0 | 568.5 | 916 | 14.3 | 5.1 | 5.1 |
| UGEG-075-063 | East Gouldie | 552.0 | 565.0 | 925 | 12.8 | 5.4 | 5.4 |
| including | 554.7 | 559.0 | 924 | 4.3 | 12.0 | 12.0 | |
| UGOD-057-013 | Ody N / Artemis | 573.5 | 580.5 | 1,039 | 7.0** | 10.7 | 10.7 |
| and | Ody N / Artemis | 592.5 | 606.0 | 1,057 | 13.5** | 4.5 | 4.5 |
| including | 601.5 | 604.5 | 1,060 | 3.0** | 10.5 | 10.5 | |
| and | Ody N / Artemis | 617.5 | 632.0 | 1,078 | 14.6** | 21.9 | 13.7 |
| including | 618.5 | 624.5 | 1,075 | 6.0** | 37.3 | 20.0 | |
| and | Ody N / Artemis | 638.0 | 649.0 | 1,093 | 11.0** | 3.5 | 3.5 |
| UGOD-057-017 | Ody N / Artemis | 547.5 | 554.2 | 1,003 | 6.7** | 7.4 | 7.4 |
*Results from the East Gouldie and Odyssey deposits use a capping factor of 20 g/t gold.
**Core length. True width undetermined.
52
West Pit and West Extension zones at Detour Lake
| Drill hole | Zone | From (metres) |
To (metres) |
Depth of midpoint below surface (metres) |
Estimated true width (metres) |
Gold grade (g/t) (uncapped)* |
| DLM26-1290 | West Extension | 977.6 | 983.0 | 836 | 4.8 | 20.8 |
| DLM26-1291W | West Extension | 1,141.9 | 1,160.0 | 1,011 | 15.9 | 2.0 |
| including | 1,146.1 | 1,150.5 | 1,009 | 3.9 | 4.4 | |
| DLM26-1297AW | West Extension | 629.0 | 632.0 | 564 | 2.5 | 13.5 |
| and | West Extension | 680.0 | 688.0 | 610 | 6.7 | 4.2 |
| and | West Extension | 1,042.0 | 1,054.0 | 902 | 10.8 | 4.6 |
| including | 1,042.0 | 1,045.0 | 899 | 2.7 | 14.7 | |
| DLM26-1324 | West Pit | 260.0 | 278.0 | 229 | 15.3 | 4.5 |
| including | 271.0 | 276.8 | 233 | 4.9 | 10.0 | |
| and | West Pit | 313.0 | 318.0 | 268 | 4.3 | 8.3 |
| DLM26-1331A | West Extension | 825.0 | 829.4 | 704 | 4.0 | 12.1 |
| and | West Extension | 1,196.0 | 1,200.0 | 973 | 3.8 | 6.4 |
| DLM26-1332 | West Pit | 234.0 | 286.0 | 223 | 43.9 | 2.6 |
| including | 245.0 | 248.8 | 212 | 3.2 | 6.8 | |
| and including | 272.0 | 277.0 | 235 | 4.2 | 15.9 | |
| DLM26-1334A | West Pit | 280.0 | 354.5 | 275 | 62.3 | 2.5 |
| including | 301.0 | 308.1 | 264 | 5.9 | 15.2 | |
| DLM26-1335W | West Pit | 295.1 | 362.1 | 282 | 57.0 | 2.0 |
| including | 304.4 | 311.0 | 265 | 5.6 | 13.1 | |
| DLM26-1336B | West Pit | 307.0 | 328.7 | 271 | 18.7 | 3.3 |
| including | 316.0 | 319.4 | 271 | 2.9 | 12.6 | |
| and | West Pit | 352.9 | 356.0 | 301 | 2.7 | 7.8 |
| and | West Pit | 375.0 | 378.5 | 320 | 3.0 | 20.6 |
| DLM26-1337 | West Pit | 394.1 | 410.8 | 340 | 14.4 | 1.9 |
| and | West Pit | 443.3 | 461.0 | 380 | 15.4 | 5.5 |
| DLM26-1345AW | West Pit | 264.5 | 274.8 | 216 | 9.3 | 5.8 |
| including | 264.5 | 267.5 | 194 | 2.7 | 16.9 |
*Results from Detour Lake are uncapped.
53
Upper Beaver deposit
| Drill hole | Zone | From (metres) |
To (metres) |
Depth of mid-point below surface (metres) |
Estimated true width (metres) |
Gold grade (g/t) |
Gold (g/t) |
Copper (%) |
Copper (%) |
| KLUB26-915W1 | Zone 107 | 593.2 | 596.8 | 517 | 2.6 | 4.9 | 4.9 | 0.76 | 0.76 |
| and | Zone 107 | 600.3 | 605.0 | 523 | 3.4 | 2.6 | 2.6 | 0.64 | 0.64 |
| KLUB26-915W7 | Zone 107 | 621.7 | 629.1 | 558 | 6.8 | 8.4 | 8.4 | 0.10 | 0.10 |
| including | Zone 107 | 627.5 | 629.1 | 561 | 1.5 | 17.4 | 17.4 | 0.31 | 0.31 |
| KLUB26-915W8 | Zone 107 | 657.5 | 662.5 | 599 | 4.6 | 2.6 | 2.6 | 0.25 | 0.25 |
| KLUB26-917 | Zone 107 | 703.0 | 705.8 | 646 | 2.7 | 12.4 | 12.4 | 0.01 | 0.01 |
| including | Zone 107 | 703.0 | 703.7 | 645 | 0.7 | 47.3 | 47.3 | 0.01 | 0.01 |
| KLUB26-917W1 | Zone 107 | 713.0 | 719.5 | 661 | 5.8 | 7.7 | 7.7 | 0.01 | 0.01 |
| including | Zone 107 | 719.0 | 719.5 | 663 | 0.5 | 56.5 | 56.5 | 0.01 | 0.01 |
| KLUB26-917W5 | Zone 107 | 727.0 | 731.5 | 682 | 4.5 | 8.3 | 8.3 | 0.26 | 0.26 |
| and | Zone 107 | 736.3 | 742.0 | 691 | 5.6 | 12.0 | 12.0 | 0.55 | 0.55 |
| including | Zone 107 | 738.8 | 740.4 | 692 | 1.6 | 28.8 | 28.8 | 1.01 | 1.01 |
*At Upper Beaver, results use a capping factor of 135 g/t gold and 4.0% copper for Zone 107.
Madrid deposit at Hope Bay
| Drill hole | Zone | From (metres) |
To (metres) |
Depth of midpoint below surface (metres) |
Estimated true width (metres) |
Gold grade (g/t) |
Gold grade (g/t) (capped)* |
| HBM26-464 | Suluk | 155.0 | 167.0 | 129 | 8.9 | 6.7 | 6.7 |
| HBM26-466 | Patch 7 | 708.0 | 726.9 | 609 | 15.4 | 13.7 | 13.7 |
| HBM26-469 | Patch 7 | 1,172.0 | 1,176.0 | 852 | 3.8 | 31.6 | 31.6 |
| including | 1,175.0 | 1,176.0 | 853 | 0.9 | 94.4 | 94.4 | |
| HBM26-470 | Patch 7 | 707.0 | 710.0 | 605 | 2.1 | 30.6 | 30.6 |
| HBM26-478A | Patch 7 | 977.0 | 998.4 | 710 | 15.6 | 28.8 | 15.2 |
| including | 979.0 | 980.0 | 706 | 0.7 | 142.5 | 100.0 | |
| including | 987.0 | 988.0 | 710 | 0.7 | 348.0 | 100.0 | |
| including | 996.4 | 997.4 | 714 | 0.7 | 94.1 | 94.1 | |
| HBM26-481 | Patch 7 | 362.0 | 375.0 | 328 | 11.3 | 18.5 | 18.5 |
*Results from the Madrid deposit at Hope Bay use a capping factor of 100 g/t gold.
54
Tiriganiaq and Wesmeg North deposits at Meliadine
| Drill hole | Deposit | Lode / zone |
From (metres) |
To (metres) |
Depth of midpoint below surface (metres) |
Estimated true width (metres) |
Gold grade (g/t) |
Gold grade (g/t) (capped)* |
| ML425-8846-D15 | Tiriganiaq | 1374 | 171.6 | 178.5 | 694 | 6.6 | 10.9 | 10.9 |
| ML425-10071-D9 | Tiriganiaq | 1370 | 251.1 | 256.0 | 663 | 4.9 | 9.0 | 9.0 |
| ML425-9408-D1C | Wesmeg N | 987 | 401.7 | 405.0 | 855 | 3.0 | 10.1 | 10.1 |
| ML425-9408-D20 | Wesmeg N | 930 | 401.0 | 408.7 | 744 | 7.7 | 22.2 | 11.3 |
*Results from Meliadine use a capping factor ranging from 20 g/t to 100 g/t gold depending on the zone.
Fosterville
| Drill hole | Zone | From (metres) |
To (metres) |
Depth of midpoint below surface (metres) |
Estimated true width |
Gold grade (g/t) (uncapped)* |
| UDH5161 | Cardinal | 381.0 | 391.8 | 1,785 | 10.2 | 9.6 |
| UDH5162A | Cardinal | 380.1 | 385.3 | 1,789 | 4.5 | 16.8 |
| UDH5178 | Swan | 444.3 | 467.9 | 1,845 | 21.4 | 5.1 |
| UDH5188 | SW Linker 1 | 272.3 | 278.7 | 810 | 6.0 | 9.9 |
| UDH5214 | Curie | 182.2 | 189.6 | 477 | 4.8 | 9.1 |
*Results from the Fosterville mine are uncapped.
Main zone at Kittila
| Drill hole | Zone / Area |
From (metres) |
To metres) |
Depth of midpoint below surface (metres) |
Estimated true width (metres) |
Gold grade (g/t) |
| SEU25-602 | Main / Seuru | 70.0 | 78.0 | 961 | 6.7 | 5.9 |
| SEU25-700L | Main / Seuru | 572.0 | 584.6 | 1,401 | 6.2 | 5.4 |
* Results from Kittila are uncapped.
55
Exploration Drill Collar Coordinates
| Drill hole | UTM East* | UTM North* | Elevation (metres above sea level) |
Azimuth (degrees) |
Dip (degrees) |
Length (metres) |
| Odyssey mine | ||||||
| MEX25-354 | 717791 | 5334354 | 310 | 105 | -89 | 2,151 |
| UGEG-071-034 | 717759 | 5333976 | -346 | 172 | -55 | 720 |
| UGEG-071-035 | 717759 | 5333976 | -346 | 176 | -47 | 700 |
| UGEG-071-043 | 717760 | 5333976 | -346 | 170 | -42 | 672 |
| UGEG-075-062 | 717713 | 5334082 | -340 | 173 | -33 | 756 |
| UGEG-075-063 | 717713 | 5334081 | -340 | 176 | -33 | 655 |
| UGOD-057-013 | 718007 | 5334110 | -261 | 18 | -55 | 767 |
| UGOD-057-017 | 718008 | 5334110 | -261 | 15 | -54 | 729 |
| Detour Lake | ||||||
| DLM26-1290 | 584833 | 5542350 | 296 | 185 | -60 | 1,152 |
| DLM26-1291W | 586232 | 5542299 | 297 | 183 | -68 | 1,239 |
| DLM26-1297AW | 586435 | 5542230 | 296 | 181 | -67 | 1,257 |
| DLM26-1324 | 587028 | 5541651 | 292 | 178 | -59 | 375 |
| DLM26-1331A | 586515 | 5542354 | 298 | 189 | -64 | 1,302 |
| DLM26-1334A | 587127 | 5541642 | 292 | 177 | -63 | 426 |
| DLM26-1335W | 587046 | 5541680 | 294 | 178 | -62 | 450 |
| DLM26-1336B | 587229 | 5541630 | 292 | 179 | -60 | 450 |
| DLM26-1337 | 587064 | 5541723 | 297 | 176 | -61 | 576 |
| DLM26-1345AW | 587086 | 5541659 | 293 | 178 | -55 | 350 |
| Upper Beaver | ||||||
| KLUB26-915W1 | 591844 | 5336055 | 302 | 150 | -69 | 656 |
| KLUB26-915W7 | 591844 | 5336055 | 302 | 150 | -69 | 680 |
| KLUB26915W8 | 591844 | 5336055 | 302 | 150 | -69 | 695 |
| KLUB26-917 | 591783 | 5336010 | 304 | 130 | -75 | 743 |
| KLUB26-917W1 | 591783 | 5336010 | 304 | 130 | -75 | 749 |
| KLUB26-917W5 | 591783 | 5336010 | 304 | 130 | -75 | 768 |
| Hope Bay | ||||||
| HBM26-464 | 434720 | 7549517 | 26 | 104 | -51 | 413 |
| HBM26-466 | 434650 | 7548666 | 26 | 70 | -70 | 831 |
| HBM26-469 | 434279 | 7548409 | 38 | 57 | -57 | 1,246 |
| HBM26-470 | 434630 | 7548587 | 26 | 69 | -69 | 859 |
| HBM26-478A | 434334 | 7548811 | 51 | 77 | -63 | 1,125 |
| HBM26-481 | 435107 | 7548039 | 38 | 68 | -71 | 635 |
| Meliadine | ||||||
| ML425-8846-D15 | 538846 | 6988969 | -493 | 163 | -57 | 334 |
| ML425-10071-D9 | 540071 | 6989004 | -432 | 176 | -47 | 422 |
| ML425-9408-D1C | 539408 | 6988922 | -425 | 202 | -73 | 742 |
| ML425-9408-D20 | 539408 | 6988922 | -424 | 169 | -50 | 621 |
| Fosterville | ||||||
| UDH5161 | 1486 | 4973 | 3695 | 82 | -58 | 404 |
| UDH5162A | 1485 | 4973 | 3695 | 92 | -61 | 407 |
| UDH5178 | 1487 | 4945 | 3690 | 33 | -56 | 484 |
| UDH5188 | 2978 | 12054 | 4556 | 104 | -54 | 341 |
| UDH5214 | 3297 | 11802 | 4650 | 38 | 8 | 209 |
| Kittila | ||||||
| SEU25-602 | 2558636 | 7539798 | -738 | 64 | -2 | 211 |
| SEU25-700L | 2558633 | 7539697 | -726 | 90 | -66 | 642 |
*Coordinate Systems: NAD 83 UTM Zone 17N for Odyssey; NAD 1983 UTM Zone 17N for Detour Lake and Upper Beaver; NAD 1983 UTM Zone 13N for Hope Bay; NAD 1983 UTM Zone 14N for Meliadine; NAD 1983 UTM Zone 13N for Hope Bay; Mine grid including elevation for Fosterville; and Finnish Coordinate System KKJ Zone 2 for Kittila.
56
APPENDIX B – FINANCIAL INFORMATION
AGNICO EAGLE MINES LIMITED
SUMMARY OF OPERATIONS KEY PERFORMANCE INDICATORS
(thousands of United States dollars, except where noted)
Three Months Ended June 30, | Six Months Ended June 30, | |||||||||||||||
| 2026 | 2025 | 2026 | 2025 | |||||||||||||
| Net income - key line items: | ||||||||||||||||
| Revenue from mine operations: | ||||||||||||||||
| LaRonde | 373,589 | 311,077 | 775,516 | 590,160 | ||||||||||||
| Canadian Malartic | 597,767 | 497,217 | 1,352,620 | 919,264 | ||||||||||||
| Goldex | 138,937 | 115,280 | 305,473 | 211,249 | ||||||||||||
| Quebec | 1,110,293 | 923,574 | 2,433,609 | 1,720,673 | ||||||||||||
| Detour Lake | 872,436 | 545,174 | 1,816,666 | 989,060 | ||||||||||||
| Macassa | 294,473 | 260,231 | 600,917 | 495,893 | ||||||||||||
| Ontario | 1,166,909 | 805,405 | 2,417,583 | 1,484,953 | ||||||||||||
| Meliadine | 517,888 | 354,517 | 894,482 | 612,806 | ||||||||||||
| Meadowbank | 427,534 | 334,715 | 1,021,960 | 739,800 | ||||||||||||
| Nunavut | 945,422 | 689,232 | 1,916,442 | 1,352,606 | ||||||||||||
| Fosterville | 207,651 | 153,845 | 388,327 | 263,674 | ||||||||||||
| Australia | 207,651 | 153,845 | 388,327 | 263,674 | ||||||||||||
| Kittila | 263,792 | 167,942 | 515,690 | 329,030 | ||||||||||||
| Finland | 263,792 | 167,942 | 515,690 | 329,030 | ||||||||||||
| Pinos Altos | 108,760 | 76,103 | 231,032 | 133,413 | ||||||||||||
| Mexico | 108,760 | 76,103 | 231,032 | 133,413 | ||||||||||||
| Corporate and Other | (9 | ) | — | (276 | ) | — | ||||||||||
| Revenues from mining operations | $ | 3,802,818 | $ | 2,816,101 | $ | 7,902,407 | $ | 5,284,349 | ||||||||
| Production costs | 953,758 | 789,187 | 1,909,345 | 1,556,920 | ||||||||||||
| Amortization of property, plant and mine development | 423,256 | 376,956 | 843,522 | 793,756 | ||||||||||||
| Gross profit | 2,425,804 | 1,649,958 | 5,149,540 | 2,933,673 | ||||||||||||
| Exploration, corporate and other | 102,949 | 33,339 | 267,061 | 122,483 | ||||||||||||
| Income before income and mining taxes | 2,322,855 | 1,616,619 | 4,882,479 | 2,811,190 | ||||||||||||
| Income and mining taxes expense | 722,402 | 547,908 | 1,586,565 | 927,748 | ||||||||||||
| Net income for the period | $ | 1,600,453 | $ | 1,068,711 | $ | 3,295,914 | $ | 1,883,442 | ||||||||
| Net income per share — basic | $ | 3.19 | $ | 2.13 | $ | 6.58 | $ | 3.75 | ||||||||
| Net income per share — diluted | $ | 3.17 | $ | 2.12 | $ | 6.56 | $ | 3.74 | ||||||||
| Cash flows: | ||||||||||||||||
| Cash provided by operating activities | $ | 2,144,120 | $ | 1,845,488 | $ | 3,489,988 | $ | 2,889,734 | ||||||||
| Cash used in investing activities | $ | (1,189,583 | ) | $ | (610,936 | ) | $ | (1,954,442 | ) | $ | (1,260,876 | ) | ||||
| Cash used in financing activities | $ | (600,715 | ) | $ | (819,155 | ) | $ | (935,367 | ) | $ | (1,002,121 | ) | ||||
| Realized prices: | ||||||||||||||||
| Gold (per ounce) | $ | 4,483 | $ | 3,288 | $ | 4,672 | $ | 3,090 | ||||||||
| Silver (per ounce) | $ | 64.98 | $ | 35.72 | $ | 74.82 | $ | 34.45 | ||||||||
57
AGNICO EAGLE MINES LIMITED
SUMMARY OF OPERATIONS KEY PERFORMANCE INDICATORS
(thousands of United States dollars, except where noted)
Three Months Ended June 30, | Six Months Ended June 30, | |||||||||||||||
| 2026 | 2025 | 2026 | 2025 | |||||||||||||
| Payable production(i): | ||||||||||||||||
| Gold (ounces): | ||||||||||||||||
| LaRonde | 81,261 | 91,252 | 162,857 | 182,743 | ||||||||||||
| Canadian Malartic | 135,243 | 172,531 | 301,459 | 332,304 | ||||||||||||
| Goldex | 29,277 | 33,118 | 58,649 | 63,134 | ||||||||||||
| Quebec | 245,781 | 296,901 | 522,965 | 578,181 | ||||||||||||
| Detour Lake | 207,279 | 168,272 | 384,298 | 321,110 | ||||||||||||
| Macassa | 80,143 | 87,364 | 135,736 | 173,392 | ||||||||||||
| Ontario | 287,422 | 255,636 | 520,034 | 494,502 | ||||||||||||
| Meliadine | 97,516 | 90,263 | 191,347 | 188,775 | ||||||||||||
| Meadowbank | 100,165 | 101,935 | 214,027 | 242,061 | ||||||||||||
| Nunavut | 197,681 | 192,198 | 405,374 | 430,836 | ||||||||||||
| Fosterville | 42,012 | 49,574 | 83,455 | 93,189 | ||||||||||||
| Australia | 42,012 | 49,574 | 83,455 | 93,189 | ||||||||||||
| Kittila | 61,969 | 50,357 | 110,496 | 104,461 | ||||||||||||
| Finland | 61,969 | 50,357 | 110,496 | 104,461 | ||||||||||||
| Pinos Altos | 20,951 | 21,363 | 38,601 | 38,654 | ||||||||||||
| Mexico | 20,951 | 21,363 | 38,601 | 38,654 | ||||||||||||
| Total gold (ounces): | 855,816 | 866,029 | 1,680,925 | 1,739,823 | ||||||||||||
| Silver (thousands of ounces) | 653 | 602 | 1,252 | 1,213 | ||||||||||||
| Zinc (tonnes) | 1,101 | 2,384 | 2,120 | 4,126 | ||||||||||||
| Copper (tonnes) | 1,581 | 1,161 | 3,060 | 2,545 | ||||||||||||
58
AGNICO EAGLE MINES LIMITED
SUMMARY OF OPERATIONS KEY PERFORMANCE INDICATORS
(thousands of United States dollars, except where noted)
Three Months Ended June 30, | Six Months Ended June 30, | |||||||||||||||
| 2026 | 2025 | 2026 | 2025 | |||||||||||||
| Payable metal sold(ii): | ||||||||||||||||
| Gold (ounces): | ||||||||||||||||
| LaRonde | 81,092 | 88,908 | 159,539 | 179,417 | ||||||||||||
| Canadian Malartic | 130,634 | 150,830 | 285,931 | 295,493 | ||||||||||||
| Goldex | 29,087 | 33,167 | 60,843 | 63,860 | ||||||||||||
| Quebec | 240,813 | 272,905 | 506,313 | 538,770 | ||||||||||||
| Detour Lake | 195,070 | 166,034 | 386,419 | 321,514 | ||||||||||||
| Macassa | 65,482 | 79,145 | 127,516 | 160,145 | ||||||||||||
| Ontario | 260,552 | 245,179 | 513,935 | 481,659 | ||||||||||||
| Meliadine | 114,094 | 108,188 | 191,344 | 197,458 | ||||||||||||
| Meadowbank | 95,700 | 102,224 | 217,461 | 242,574 | ||||||||||||
| Nunavut | 209,794 | 210,412 | 408,805 | 440,032 | ||||||||||||
| Fosterville | 46,000 | 46,500 | 84,000 | 84,500 | ||||||||||||
| Australia | 46,000 | 46,500 | 84,000 | 84,500 | ||||||||||||
| Kittila | 58,300 | 51,000 | 110,900 | 107,000 | ||||||||||||
| Finland | 58,300 | 51,000 | 110,900 | 107,000 | ||||||||||||
| Pinos Altos | 20,429 | 20,839 | 41,586 | 37,839 | ||||||||||||
| Mexico | 20,429 | 20,839 | 41,586 | 37,839 | ||||||||||||
| Total gold (ounces): | 835,505 | 846,835 | 1,665,156 | 1,689,800 | ||||||||||||
| Silver (thousands of ounces) | 570 | 574 | 1,187 | 1,101 | ||||||||||||
| Zinc (tonnes) | 1,153 | 2,391 | 2,337 | 4,203 | ||||||||||||
| Copper (tonnes) | 1,589 | 1,162 | 3,098 | 2,560 | ||||||||||||
Notes:
(i) Payable production (a non-GAAP non-financial performance measure) is the quantity of mineral produced during a period contained in products that are or will be sold by the Company, whether such products are sold during the period or held as inventories at the end of the period. For the three months ended June 30, 2026 and 2025, it excludes 440 payable gold ounces and 858 payable gold ounces produced at La India and 58 payable gold ounces and 39 payable gold ounces produced at Creston Mascota. For the six months ended June 30, 2026 and 2025, it excludes 858 payable gold ounces and 2,669 payable gold ounces produced at La India and 134 payable gold ounces and 64 payable gold ounces produced at Creston Mascota.
(ii) Payable metals sold at Canadian Malartic, Detour Lake and Macassa exclude the in-kind royalties of 5.0%, 2.0% and 1.5%, respectively, paid in respect of gold production at such mines. For the six months ended June 30, 2025, payable metals sold excludes 2,500 ounces from La India.
59
AGNICO EAGLE MINES LIMITED
CONDENSED INTERIM CONSOLIDATED BALANCE SHEETS
(thousands of United States dollars, except share amounts)
(Unaudited)
| As at | As at | |||||||
| June 30, 2026 | December 31, 2025 | |||||||
| ASSETS | ||||||||
| Current assets: | ||||||||
| Cash and cash equivalents | $ | 3,463,957 | $ | 2,866,053 | ||||
| Inventories | 1,623,497 | 1,698,830 | ||||||
| Fair value of derivative financial instruments | 3,525 | 34,428 | ||||||
| Other current assets | 432,603 | 394,631 | ||||||
| Total current assets | 5,523,582 | 4,993,942 | ||||||
| Non-current assets: | ||||||||
| Goodwill | 4,157,672 | 4,157,672 | ||||||
| Property, plant and mine development | 25,735,534 | 22,850,540 | ||||||
| Investments | 1,161,559 | 1,508,252 | ||||||
| Other assets | 1,216,696 | 960,885 | ||||||
| Total assets | $ | 37,795,043 | $ | 34,471,291 | ||||
| LIABILITIES | ||||||||
| Current liabilities: | ||||||||
| Accounts payable and accrued liabilities | $ | 1,278,680 | $ | 1,033,444 | ||||
| Share based liabilities | 30,365 | 31,722 | ||||||
| Income taxes payable | 278,144 | 1,226,347 | ||||||
| Reclamation provision | 222,016 | 144,537 | ||||||
| Lease obligations | 34,306 | 30,480 | ||||||
| Fair value of derivative financial instruments | 89,101 | 5,676 | ||||||
| Total current liabilities | 1,932,612 | 2,472,206 | ||||||
| Non-current liabilities: | ||||||||
| Long-term debt | 196,825 | 196,271 | ||||||
| Reclamation provision | 1,286,556 | 1,318,476 | ||||||
| Lease obligations | 89,219 | 94,719 | ||||||
| Share based liabilities | 12,785 | 23,921 | ||||||
| Deferred income and mining tax liabilities | 5,489,781 | 5,373,013 | ||||||
| Other liabilities | 183,535 | 250,221 | ||||||
| Total liabilities | 9,191,313 | 9,728,827 | ||||||
| EQUITY | ||||||||
| Common shares: | ||||||||
| Outstanding — 506,899,374 common shares issued, less 534,510 shares held in trust | 20,147,781 | 18,699,862 | ||||||
| Stock options | 166,303 | 166,775 | ||||||
| Retained earnings | 8,130,478 | 5,463,906 | ||||||
| Other reserves | 159,168 | 411,921 | ||||||
| Total equity | 28,603,730 | 24,742,464 | ||||||
| Total liabilities and equity | $ | 37,795,043 | $ | 34,471,291 | ||||
60
AGNICO EAGLE MINES LIMITED
CONDENSED INTERIM CONSOLIDATED STATEMENTS OF INCOME
(thousands of United States dollars, except per share amounts)
(Unaudited)
Three Months Ended June 30, | Six Months Ended June 30, | |||||||||||||||
| 2026 | 2025 | 2026 | 2025 | |||||||||||||
| REVENUES | ||||||||||||||||
| Revenues from mining operations | $ | 3,802,818 | $ | 2,816,101 | $ | 7,902,407 | $ | 5,284,349 | ||||||||
| COST OF SALES | ||||||||||||||||
| Production costs | 953,758 | 789,187 | 1,909,345 | 1,556,920 | ||||||||||||
| Amortization of property, plant and mine development | 423,256 | 376,956 | 843,522 | 793,756 | ||||||||||||
| Gross profit | 2,425,804 | 1,649,958 | 5,149,540 | 2,933,673 | ||||||||||||
| EXPENSES (INCOME) | ||||||||||||||||
| Exploration and corporate development | 61,531 | 52,100 | 114,087 | 93,905 | ||||||||||||
| General and administrative | 57,948 | 57,890 | 135,798 | 118,599 | ||||||||||||
| Finance costs | 16,039 | 27,429 | 31,795 | 49,873 | ||||||||||||
| Loss (gain) on derivative financial instruments | 81,404 | (125,264 | ) | 76,704 | (194,123 | ) | ||||||||||
| Foreign exchange translation | 20,128 | (11,571 | ) | 19,395 | (11,631 | ) | ||||||||||
| Care and maintenance | 15,275 | 15,682 | 37,871 | 29,583 | ||||||||||||
| Gain on sale of investments | (155,319 | ) | — | (155,319 | ) | — | ||||||||||
| Other income and expenses | 5,943 | 17,073 | 6,730 | 36,277 | ||||||||||||
| Income before income and mining taxes | 2,322,855 | 1,616,619 | 4,882,479 | 2,811,190 | ||||||||||||
| Income and mining taxes expense | 722,402 | 547,908 | 1,586,565 | 927,748 | ||||||||||||
| Net income for the period | $ | 1,600,453 | $ | 1,068,711 | $ | 3,295,914 | $ | 1,883,442 | ||||||||
| Net income per share - basic | $ | 3.19 | $ | 2.13 | $ | 6.58 | $ | 3.75 | ||||||||
| Net income per share - diluted | $ | 3.17 | $ | 2.12 | $ | 6.56 | $ | 3.74 | ||||||||
| Adjusted net income per share - basic(i) | $ | 3.07 | $ | 1.94 | $ | 6.48 | $ | 3.47 | ||||||||
| Adjusted net income per share - diluted(i) | $ | 3.05 | $ | 1.94 | $ | 6.46 | $ | 3.46 | ||||||||
| Weighted average number of common shares outstanding (in thousands): | ||||||||||||||||
| Basic | 501,659 | 502,579 | 500,950 | 502,489 | ||||||||||||
| Diluted | 502,906 | 504,360 | 502,361 | 503,885 | ||||||||||||
Note:
(i) Adjusted net income per share is not a recognized measure under IFRS Accounting Standards and this data may not be comparable to data reported by other companies. See Note Regarding Certain Measures of Performance – Adjusted Net Income and Adjusted Net Income per Share for a discussion of the composition and usefulness of this measure and a reconciliation to the nearest IFRS Accounting Standards measure.
61
AGNICO EAGLE MINES LIMITED
CONDENSED INTERIM CONSOLIDATED STATEMENTS OF CASH FLOWS
(thousands of United States dollars)
(Unaudited)
Three Months Ended June 30, | Six Months Ended June 30, | |||||||||||||||
| 2026 | 2025 | 2026 | 2025 | |||||||||||||
| OPERATING ACTIVITIES | ||||||||||||||||
| Net income for the period | $ | 1,600,453 | $ | 1,068,711 | $ | 3,295,914 | $ | 1,883,442 | ||||||||
| Add (deduct) adjusting items: | ||||||||||||||||
| Amortization of property, plant and mine development | 423,256 | 376,956 | 843,522 | 793,756 | ||||||||||||
| Gain on sale of investments | (155,319 | ) | — | (155,319 | ) | — | ||||||||||
| Deferred income and mining taxes | 99,283 | (8,766 | ) | 158,820 | 9,725 | |||||||||||
| Unrealized loss (gain) on currency and commodity derivatives | 92,988 | (118,678 | ) | 117,042 | (149,798 | ) | ||||||||||
| Unrealized loss (gain) on warrants | 12,296 | (7,263 | ) | (6,693 | ) | (61,431 | ) | |||||||||
| Stock-based compensation | 11,695 | 21,389 | 46,626 | 48,782 | ||||||||||||
| Foreign exchange translation | 20,128 | (11,571 | ) | 19,395 | (11,631 | ) | ||||||||||
| Other | 7,424 | 11,308 | 24,259 | 28,631 | ||||||||||||
| Changes in non-cash working capital balances: | ||||||||||||||||
| Income taxes | (13,390 | ) | 478,106 | (1,002,470 | ) | 301,367 | ||||||||||
| Inventories | (42,494 | ) | (53,061 | ) | (5,694 | ) | (22,144 | ) | ||||||||
| Other current assets | (18,741 | ) | (38,152 | ) | (29,755 | ) | (6,762 | ) | ||||||||
| Accounts payable and accrued liabilities | 106,541 | 126,509 | 184,341 | 75,797 | ||||||||||||
| Cash provided by operating activities | 2,144,120 | 1,845,488 | 3,489,988 | 2,889,734 | ||||||||||||
| INVESTING ACTIVITIES | ||||||||||||||||
| Additions to property, plant and mine development | (809,255 | ) | (540,476 | ) | (1,423,004 | ) | (990,600 | ) | ||||||||
| Purchase of O3 Mining, net of cash and cash equivalents acquired | — | — | — | (121,960 | ) | |||||||||||
| Purchase of Central Lapland properties, net of cash and cash equivalents | (578,408 | ) | — | (578,408 | ) | — | ||||||||||
| Contributions for acquisition of mineral assets | (6,354 | ) | (4,575 | ) | (11,634 | ) | (8,400 | ) | ||||||||
| Purchase of equity securities and other investments | (73,389 | ) | (70,304 | ) | (218,091 | ) | (138,361 | ) | ||||||||
| Proceeds on sale of equity securities and other investments | 260,646 | — | 260,646 | — | ||||||||||||
| Other investing activities | 17,177 | 4,419 | 16,049 | (1,555 | ) | |||||||||||
| Cash used in investing activities | (1,189,583 | ) | (610,936 | ) | (1,954,442 | ) | (1,260,876 | ) | ||||||||
| FINANCING ACTIVITIES | ||||||||||||||||
| Repayment of Senior Notes | — | (550,000 | ) | — | (550,000 | ) | ||||||||||
| Repayment of lease obligations | (8,531 | ) | (9,172 | ) | (15,769 | ) | (18,350 | ) | ||||||||
| Dividends paid | (206,854 | ) | (180,778 | ) | (410,019 | ) | (356,345 | ) | ||||||||
| Repurchase of common shares | (399,942 | ) | (99,938 | ) | (567,775 | ) | (159,988 | ) | ||||||||
| Proceeds on exercise of stock options | 1,548 | 9,820 | 32,982 | 61,846 | ||||||||||||
| Common shares issued | 13,064 | 10,913 | 25,214 | 20,716 | ||||||||||||
| Cash used in financing activities | (600,715 | ) | (819,155 | ) | (935,367 | ) | (1,002,121 | ) | ||||||||
| Effect of exchange rate changes on cash and cash equivalents | (1,734 | ) | 3,856 | (2,275 | ) | 4,397 | ||||||||||
| Net increase in cash and cash equivalents during the period | 352,088 | 419,253 | 597,904 | 631,134 | ||||||||||||
| Cash and cash equivalents, beginning of period | 3,111,869 | 1,138,312 | 2,866,053 | 926,431 | ||||||||||||
| Cash and cash equivalents, end of period | $ | 3,463,957 | $ | 1,557,565 | $ | 3,463,957 | $ | 1,557,565 | ||||||||
| SUPPLEMENTAL CASH FLOW INFORMATION | ||||||||||||||||
| Interest paid | $ | 2,776 | $ | 37,233 | $ | 3,339 | $ | 38,418 | ||||||||
| Income and mining taxes paid | $ | 623,176 | $ | 79,703 | $ | 2,411,498 | $ | 616,305 | ||||||||
62