2026-06-30false000130352312-31iso4217:GBPiso4217:GBPxbrli:sharesxbrli:purebti:Bondiso4217:EURxbrli:sharesiso4217:CADiso4217:USDbti:extensionOptionbti:Casebti:Plaintiffbti:CorporateGroupbti:payment00013035232026-01-012026-06-3000013035232025-01-012025-06-300001303523ifrs-full:IssuedCapitalMember2025-12-310001303523bti:SharePremiumCapitalRedemptionAndMergerReservesMember2025-12-310001303523ifrs-full:OtherReservesMember2025-12-310001303523ifrs-full:RetainedEarningsMember2025-12-310001303523ifrs-full:EquityAttributableToOwnersOfParentMember2025-12-310001303523bti:PerpetualHybridBondsMember2025-12-310001303523ifrs-full:NoncontrollingInterestsMember2025-12-3100013035232025-12-310001303523ifrs-full:OtherReservesMember2026-01-012026-06-300001303523ifrs-full:RetainedEarningsMember2026-01-012026-06-300001303523ifrs-full:EquityAttributableToOwnersOfParentMember2026-01-012026-06-300001303523ifrs-full:NoncontrollingInterestsMember2026-01-012026-06-300001303523bti:SharePremiumCapitalRedemptionAndMergerReservesMember2026-01-012026-06-300001303523ifrs-full:IssuedCapitalMember2026-01-012026-06-300001303523ifrs-full:IssuedCapitalMember2026-06-300001303523bti:SharePremiumCapitalRedemptionAndMergerReservesMember2026-06-300001303523ifrs-full:OtherReservesMember2026-06-300001303523ifrs-full:RetainedEarningsMember2026-06-300001303523ifrs-full:EquityAttributableToOwnersOfParentMember2026-06-300001303523bti:PerpetualHybridBondsMember2026-06-300001303523ifrs-full:NoncontrollingInterestsMember2026-06-3000013035232026-06-300001303523ifrs-full:IssuedCapitalMember2024-12-310001303523bti:SharePremiumCapitalRedemptionAndMergerReservesMember2024-12-310001303523ifrs-full:OtherReservesMember2024-12-310001303523ifrs-full:RetainedEarningsMember2024-12-310001303523ifrs-full:EquityAttributableToOwnersOfParentMember2024-12-310001303523bti:PerpetualHybridBondsMember2024-12-310001303523ifrs-full:NoncontrollingInterestsMember2024-12-3100013035232024-12-310001303523ifrs-full:OtherReservesMember2025-01-012025-06-300001303523ifrs-full:RetainedEarningsMember2025-01-012025-06-300001303523ifrs-full:EquityAttributableToOwnersOfParentMember2025-01-012025-06-300001303523ifrs-full:NoncontrollingInterestsMember2025-01-012025-06-300001303523bti:SharePremiumCapitalRedemptionAndMergerReservesMember2025-01-012025-06-300001303523ifrs-full:IssuedCapitalMember2025-01-012025-06-300001303523ifrs-full:IssuedCapitalMember2025-06-300001303523bti:SharePremiumCapitalRedemptionAndMergerReservesMember2025-06-300001303523ifrs-full:OtherReservesMember2025-06-300001303523ifrs-full:RetainedEarningsMember2025-06-300001303523ifrs-full:EquityAttributableToOwnersOfParentMember2025-06-300001303523bti:PerpetualHybridBondsMember2025-06-300001303523ifrs-full:NoncontrollingInterestsMember2025-06-3000013035232025-06-300001303523bti:UnitedStatesSegmentMemberbti:ReportedMember2026-01-012026-06-300001303523bti:UnitedStatesSegmentMemberbti:ExchangeMember2026-01-012026-06-300001303523bti:UnitedStatesSegmentMemberbti:AdjustedAtConstantCurrencyMember2026-01-012026-06-300001303523bti:UnitedStatesSegmentMemberbti:ReportedMember2025-01-012025-06-300001303523bti:AmericasAndEuropeSegmentMemberbti:ReportedMember2026-01-012026-06-300001303523bti:AmericasAndEuropeSegmentMemberbti:ExchangeMember2026-01-012026-06-300001303523bti:AmericasAndEuropeSegmentMemberbti:AdjustedAtConstantCurrencyMember2026-01-012026-06-300001303523bti:AmericasAndEuropeSegmentMemberbti:ReportedMember2025-01-012025-06-300001303523bti:AsiaPacificMiddleEastAndAfricaSegmentMemberbti:ReportedMember2026-01-012026-06-300001303523bti:AsiaPacificMiddleEastAndAfricaSegmentMemberbti:ExchangeMember2026-01-012026-06-300001303523bti:AsiaPacificMiddleEastAndAfricaSegmentMemberbti:AdjustedAtConstantCurrencyMember2026-01-012026-06-300001303523bti:AsiaPacificMiddleEastAndAfricaSegmentMemberbti:ReportedMember2025-01-012025-06-300001303523bti:ReportedMember2026-01-012026-06-300001303523bti:ExchangeMember2026-01-012026-06-300001303523bti:AdjustedAtConstantCurrencyMember2026-01-012026-06-300001303523bti:ReportedMember2025-01-012025-06-300001303523bti:UnitedStatesSegmentMemberbti:AdjustingItemsMember2026-01-012026-06-300001303523bti:UnitedStatesSegmentMemberbti:AdjustedAtCurrentRatesMember2026-01-012026-06-300001303523bti:UnitedStatesSegmentMemberbti:CanadaApprovedPlansAtConstantCurrencyMember2026-01-012026-06-300001303523bti:UnitedStatesSegmentMemberbti:AdjustedAfterCanadaApprovedPlansAtConstantCurrencyMember2026-01-012026-06-300001303523bti:AmericasAndEuropeSegmentMemberbti:AdjustingItemsMember2026-01-012026-06-300001303523bti:AmericasAndEuropeSegmentMemberbti:AdjustedAtCurrentRatesMember2026-01-012026-06-300001303523bti:AmericasAndEuropeSegmentMemberbti:CanadaApprovedPlansAtConstantCurrencyMember2026-01-012026-06-300001303523bti:AmericasAndEuropeSegmentMemberbti:AdjustedAfterCanadaApprovedPlansAtConstantCurrencyMember2026-01-012026-06-300001303523bti:AsiaPacificMiddleEastAndAfricaSegmentMemberbti:AdjustingItemsMember2026-01-012026-06-300001303523bti:AsiaPacificMiddleEastAndAfricaSegmentMemberbti:AdjustedAtCurrentRatesMember2026-01-012026-06-300001303523bti:AsiaPacificMiddleEastAndAfricaSegmentMemberbti:CanadaApprovedPlansAtConstantCurrencyMember2026-01-012026-06-300001303523bti:AsiaPacificMiddleEastAndAfricaSegmentMemberbti:AdjustedAfterCanadaApprovedPlansAtConstantCurrencyMember2026-01-012026-06-300001303523bti:AdjustingItemsMember2026-01-012026-06-300001303523bti:AdjustedAtCurrentRatesMember2026-01-012026-06-300001303523bti:CanadaApprovedPlansAtConstantCurrencyMember2026-01-012026-06-300001303523bti:AdjustedAfterCanadaApprovedPlansAtConstantCurrencyMember2026-01-012026-06-300001303523bti:UnitedStatesSegmentMemberbti:AdjustingItemsMember2025-01-012025-06-300001303523bti:UnitedStatesSegmentMemberbti:AdjustedAtCurrentRatesMember2025-01-012025-06-300001303523bti:UnitedStatesSegmentMemberbti:CanadaApprovedPlansAtCurrentCurrencyMember2025-01-012025-06-300001303523bti:UnitedStatesSegmentMemberbti:AdjustedAfterCanadaApprovedPlansAtCurrentCurrencyMember2025-01-012025-06-300001303523bti:AmericasAndEuropeSegmentMemberbti:AdjustingItemsMember2025-01-012025-06-300001303523bti:AmericasAndEuropeSegmentMemberbti:AdjustedAtCurrentRatesMember2025-01-012025-06-300001303523bti:AmericasAndEuropeSegmentMemberbti:CanadaApprovedPlansAtCurrentCurrencyMember2025-01-012025-06-300001303523bti:AmericasAndEuropeSegmentMemberbti:AdjustedAfterCanadaApprovedPlansAtCurrentCurrencyMember2025-01-012025-06-300001303523bti:AsiaPacificMiddleEastAndAfricaSegmentMemberbti:AdjustingItemsMember2025-01-012025-06-300001303523bti:AsiaPacificMiddleEastAndAfricaSegmentMemberbti:AdjustedAtCurrentRatesMember2025-01-012025-06-300001303523bti:AsiaPacificMiddleEastAndAfricaSegmentMemberbti:CanadaApprovedPlansAtCurrentCurrencyMember2025-01-012025-06-300001303523bti:AsiaPacificMiddleEastAndAfricaSegmentMemberbti:AdjustedAfterCanadaApprovedPlansAtCurrentCurrencyMember2025-01-012025-06-300001303523bti:AdjustingItemsMember2025-01-012025-06-300001303523bti:AdjustedAtCurrentRatesMember2025-01-012025-06-300001303523bti:CanadaApprovedPlansAtCurrentCurrencyMember2025-01-012025-06-300001303523bti:AdjustedAfterCanadaApprovedPlansAtCurrentCurrencyMember2025-01-012025-06-300001303523country:CA2026-01-012026-06-300001303523country:CA2025-01-012025-12-310001303523ifrs-full:BrandNamesMember2026-01-012026-06-300001303523ifrs-full:BrandNamesMember2025-01-012025-06-300001303523country:RO2026-01-012026-06-300001303523country:RO2025-01-012025-06-300001303523bti:ITGBrandsMember2026-01-012026-06-300001303523bti:ITGBrandsMember2025-01-012025-06-300001303523ifrs-full:SubsidiariesMember2026-01-012026-06-300001303523ifrs-full:SubsidiariesMember2025-01-012025-06-300001303523ifrs-full:AssociatesMember2026-01-012026-06-300001303523ifrs-full:AssociatesMember2025-01-012025-06-300001303523srt:ScenarioForecastMember2028-12-012028-12-310001303523srt:ScenarioForecastMember2025-07-012027-12-310001303523srt:ScenarioForecastMemberbti:AdjustingItemsMember2025-07-012027-12-3100013035232025-07-012026-06-300001303523bti:AdjustingItemsMember2025-07-012027-12-310001303523ifrs-full:BrandNamesMemberifrs-full:TopOfRangeMember2026-01-012026-06-300001303523country:PE2026-01-012026-06-300001303523country:PE2025-01-012025-06-300001303523country:CA2026-06-300001303523country:CA2025-12-310001303523country:CAbti:SixMonthsMember2026-06-300001303523currency:GBP2026-01-012026-06-300001303523bti:FrankedInvestmentIncomeGroupLitigationOrderMember2026-01-012026-06-300001303523bti:FrankedInvestmentIncomeGroupLitigationOrderMember2025-01-012025-06-300001303523country:CA2025-01-012025-06-300001303523country:VE2026-01-012026-06-300001303523country:BR2026-01-012026-06-300001303523country:BR2025-01-012025-06-300001303523country:ID2026-01-012026-06-300001303523country:ID2025-01-012025-06-300001303523country:NL2026-01-012026-06-300001303523country:NL2025-01-012025-06-300001303523bti:AdjustedAtConstantCurrencyMember2025-01-012025-06-300001303523bti:BATPLCMember2021-01-012021-12-310001303523bti:BATPLCMember2025-01-012025-12-310001303523bti:ITCLtdMember2025-01-012025-06-300001303523bti:ITCLtdMember2025-05-282025-05-280001303523bti:ITCHotelsLimitedMemberbti:ITCLtdMember2026-01-012026-06-300001303523bti:ITCHotelsLimitedMember2026-01-012026-06-300001303523bti:ITCLtdMember2026-01-012026-06-300001303523bti:ITCLtdMember2025-01-012025-12-310001303523bti:OrganigramIncMember2026-02-012026-02-280001303523bti:SanityGroupGmbHSanityMember2026-02-012026-02-280001303523bti:OrganigramIncMember2026-02-280001303523bti:OrganigramIncMember2026-06-302026-06-300001303523bti:CharlottesWebHoldingsMember2026-05-012026-05-310001303523bti:ITCHotelsLimitedMember2025-01-012025-06-300001303523ifrs-full:OrdinarySharesMemberbti:ShareBuyBackProgrammeMember2026-01-012026-06-300001303523bti:FrankedInvestmentIncomeGroupLitigationOrderMember2026-01-012026-06-300001303523bti:FrankedInvestmentIncomeGroupLitigationOrderMember2025-01-012025-06-300001303523country:US2025-01-012025-06-300001303523bti:A2024To2025Membercountry:US2025-01-012025-06-300001303523bti:A2025Q1To2025Q2Membercountry:US2025-01-012025-06-300001303523bti:EngleProgenyCasesMember2026-01-012026-06-300001303523bti:EngleProgenyCasesMember2025-01-012025-06-300001303523ifrs-full:FactoringOfReceivablesMember2026-06-300001303523ifrs-full:FactoringOfReceivablesMember2025-06-300001303523srt:ScenarioForecastMember2026-01-012026-12-310001303523bti:AvailableForFinancingReportedWithinTradePayablesMember2026-06-300001303523bti:AvailableForFinancingReportedWithinTradePayablesMember2025-06-300001303523bti:AvailableForFinancingReportedWithinTradePayablesMember2025-12-310001303523ifrs-full:FinancialLiabilitiesThatArePartOfSupplierFinanceArrangementsMember2026-06-300001303523ifrs-full:FinancialLiabilitiesThatArePartOfSupplierFinanceArrangementsMember2025-06-300001303523ifrs-full:FinancialLiabilitiesThatArePartOfSupplierFinanceArrangementsMember2025-12-310001303523ifrs-full:FinancialLiabilitiesThatArePartOfSupplierFinanceArrangementsForWhichSuppliersHaveReceivedPaymentMember2026-06-300001303523ifrs-full:FinancialLiabilitiesThatArePartOfSupplierFinanceArrangementsForWhichSuppliersHaveReceivedPaymentMember2025-06-300001303523ifrs-full:FinancialLiabilitiesThatArePartOfSupplierFinanceArrangementsForWhichSuppliersHaveReceivedPaymentMember2025-12-310001303523bti:AvailableForFinancingReportedWithinTradePayablesMemberbti:LeafPayablesMember2026-06-300001303523bti:AvailableForFinancingReportedWithinTradePayablesMemberbti:LeafPayablesMember2025-06-300001303523bti:AvailableForFinancingReportedWithinTradePayablesMemberbti:LeafPayablesMember2025-12-310001303523ifrs-full:FinancialLiabilitiesThatArePartOfSupplierFinanceArrangementsMemberbti:LeafPayablesMember2026-06-300001303523ifrs-full:FinancialLiabilitiesThatArePartOfSupplierFinanceArrangementsMemberbti:LeafPayablesMember2025-06-300001303523ifrs-full:FinancialLiabilitiesThatArePartOfSupplierFinanceArrangementsMemberbti:LeafPayablesMember2025-12-310001303523ifrs-full:FinancialLiabilitiesThatArePartOfSupplierFinanceArrangementsForWhichSuppliersHaveReceivedPaymentMemberbti:LeafPayablesMember2026-06-300001303523ifrs-full:FinancialLiabilitiesThatArePartOfSupplierFinanceArrangementsForWhichSuppliersHaveReceivedPaymentMemberbti:LeafPayablesMember2025-06-300001303523ifrs-full:FinancialLiabilitiesThatArePartOfSupplierFinanceArrangementsForWhichSuppliersHaveReceivedPaymentMemberbti:LeafPayablesMember2025-12-310001303523bti:AvailableForFinancingReportedWithinTradePayablesMemberbti:OtherPayablesMember2026-06-300001303523bti:AvailableForFinancingReportedWithinTradePayablesMemberbti:OtherPayablesMember2025-06-300001303523bti:AvailableForFinancingReportedWithinTradePayablesMemberbti:OtherPayablesMember2025-12-310001303523ifrs-full:FinancialLiabilitiesThatArePartOfSupplierFinanceArrangementsMemberbti:OtherPayablesMember2026-06-300001303523ifrs-full:FinancialLiabilitiesThatArePartOfSupplierFinanceArrangementsMemberbti:OtherPayablesMember2025-06-300001303523ifrs-full:FinancialLiabilitiesThatArePartOfSupplierFinanceArrangementsMemberbti:OtherPayablesMember2025-12-310001303523ifrs-full:FinancialLiabilitiesThatArePartOfSupplierFinanceArrangementsForWhichSuppliersHaveReceivedPaymentMemberbti:OtherPayablesMember2026-06-300001303523ifrs-full:FinancialLiabilitiesThatArePartOfSupplierFinanceArrangementsForWhichSuppliersHaveReceivedPaymentMemberbti:OtherPayablesMember2025-06-300001303523ifrs-full:FinancialLiabilitiesThatArePartOfSupplierFinanceArrangementsForWhichSuppliersHaveReceivedPaymentMemberbti:OtherPayablesMember2025-12-310001303523ifrs-full:LiquidityRiskMember2026-01-012026-06-300001303523ifrs-full:LiquidityRiskMemberifrs-full:TopOfRangeMember2026-01-012026-06-300001303523ifrs-full:LiquidityRiskMember2025-01-012025-06-300001303523ifrs-full:LiquidityRiskMember2025-01-012025-12-310001303523ifrs-full:LiquidityRiskMember2026-06-300001303523ifrs-full:LiquidityRiskMember2025-06-300001303523ifrs-full:LiquidityRiskMember2025-12-310001303523ifrs-full:FixedInterestRateMemberifrs-full:LiquidityRiskMember2026-06-300001303523ifrs-full:LiquidityRiskMember2024-12-310001303523ifrs-full:LiquidityRiskMember2025-11-300001303523bti:ThreeSixtyFourDayTranchesMemberifrs-full:LiquidityRiskMemberifrs-full:NotLaterThanOneYearMember2025-11-300001303523ifrs-full:LiquidityRiskMemberbti:ThreeSixtyFourDayTranchesMember2025-11-012025-11-300001303523bti:FiveYearTranchesMemberifrs-full:LiquidityRiskMemberifrs-full:NotLaterThanOneYearMember2025-11-300001303523ifrs-full:LiquidityRiskMemberbti:FiveYearTranchesMember2025-11-012025-11-300001303523ifrs-full:LiquidityRiskMemberbti:BilateralFacilitiesMember2026-06-300001303523ifrs-full:LiquidityRiskMemberbti:TermLoanFacilityMember2025-01-310001303523ifrs-full:LiquidityRiskMember2026-03-012026-03-310001303523ifrs-full:LiquidityRiskMember2026-05-012026-05-310001303523ifrs-full:Level1OfFairValueHierarchyMember2026-06-300001303523ifrs-full:Level3OfFairValueHierarchyMember2026-06-300001303523ifrs-full:Level1OfFairValueHierarchyMember2025-06-300001303523ifrs-full:Level3OfFairValueHierarchyMember2025-06-300001303523ifrs-full:Level1OfFairValueHierarchyMember2025-12-310001303523ifrs-full:Level3OfFairValueHierarchyMember2025-12-310001303523ifrs-full:Level2OfFairValueHierarchyMemberifrs-full:InterestRateSwapContractMember2026-06-300001303523ifrs-full:Level2OfFairValueHierarchyMemberifrs-full:InterestRateSwapContractMember2025-06-300001303523ifrs-full:Level2OfFairValueHierarchyMemberifrs-full:InterestRateSwapContractMember2025-12-310001303523ifrs-full:Level2OfFairValueHierarchyMemberifrs-full:CurrencySwapContractMember2026-06-300001303523ifrs-full:Level2OfFairValueHierarchyMemberifrs-full:CurrencySwapContractMember2025-06-300001303523ifrs-full:Level2OfFairValueHierarchyMemberifrs-full:CurrencySwapContractMember2025-12-310001303523ifrs-full:Level2OfFairValueHierarchyMemberifrs-full:ForwardContractMember2026-06-300001303523ifrs-full:Level2OfFairValueHierarchyMemberifrs-full:ForwardContractMember2025-06-300001303523ifrs-full:Level2OfFairValueHierarchyMemberifrs-full:ForwardContractMember2025-12-310001303523ifrs-full:Level2OfFairValueHierarchyMember2026-06-300001303523ifrs-full:Level2OfFairValueHierarchyMember2025-06-300001303523ifrs-full:Level2OfFairValueHierarchyMember2025-12-310001303523ifrs-full:AtFairValueMember2026-06-300001303523ifrs-full:AtFairValueMember2025-06-300001303523ifrs-full:AtFairValueMember2025-12-3100013035232026-04-232026-04-230001303523ifrs-full:EnteringIntoSignificantCommitmentsOrContingentLiabilitiesMembercountry:NLifrs-full:TaxContingentLiabilityMember2026-07-010001303523ifrs-full:EnteringIntoSignificantCommitmentsOrContingentLiabilitiesMembercountry:NLifrs-full:TaxContingentLiabilityMember2026-07-012026-12-310001303523ifrs-full:EnteringIntoSignificantCommitmentsOrContingentLiabilitiesMembercountry:NLifrs-full:TaxContingentLiabilityMemberifrs-full:TopOfRangeMember2026-07-010001303523bti:SettlementOfTobaccoLitigationInCanadaMember2025-01-012025-12-310001303523bti:SettlementOfTobaccoLitigationInCanadaMember2024-10-170001303523bti:EngleProgenyCasesMemberbti:USEngleMember2026-06-300001303523bti:EngleProgenyCasesMemberbti:USEngleMember2026-01-012026-06-300001303523bti:RJRTOrLorillardTobaccoCompanyMemberbti:USEngleMember2026-01-012026-06-300001303523bti:CompensatoryDamagesAwardedMemberbti:EngleProgenyCasesMember2024-01-012026-06-300001303523bti:PunitiveDamagesAwardedMemberbti:EngleProgenyCasesMember2024-01-012026-06-300001303523bti:EngleProgenyCasesMemberstpr:FL2024-01-012026-06-300001303523bti:KalamazooRiverMember2019-12-112019-12-110001303523bti:NCRMemberbti:KalamazooRiverMemberbti:GeorgiaPacificMember2019-12-112019-12-110001303523bti:KalamazooRiverMemberbti:NCRMember2023-02-102023-02-100001303523bti:KalamazooRiverMemberbti:NCRMember2024-09-1400013035232026-05-112026-05-110001303523bti:FrankedInvestmentIncomeGroupLitigationOrderMember2015-01-012015-12-310001303523bti:FrankedInvestmentIncomeGroupLitigationOrderMember2025-01-012025-12-310001303523bti:FrankedInvestmentIncomeGroupLitigationOrderMember2023-01-012023-12-310001303523bti:FrankedInvestmentIncomeGroupLitigationOrderMember2024-01-012024-12-310001303523bti:FrankedInvestmentIncomeGroupLitigationOrderMember2022-01-012022-12-310001303523bti:FrankedInvestmentIncomeGroupLitigationOrderMembersrt:ScenarioForecastMember2026-01-012026-12-310001303523bti:FrankedInvestmentIncomeGroupLitigationOrderMembersrt:ScenarioForecastMember2027-01-012027-12-31
1
Screenshot-2022-09-15-at-17.21.45-(1).jpg
EXHIBIT 1
30 July 2026 – Press Release/Interim Results
Image_0.jpg
British American Tobacco p.l.c.
Half-Year Report for the six months to 30 June 2026
Half-Year Summary
Smokeless products now 19.8% of Group revenue, up 1.6 ppts vs FY25
Revenue up 1.4%, up 2.9% at constant FX, driven by the U.S. (up 8.5% led by strong multi-category delivery), and
resilience in AME (up 0.9%), partly offset by a slower than expected recovery in APMEA (down 6.3%)
New Categories revenue up 18.0%2
Improved combustibles revenue, up 2.1%2, driven by price/mix (including excise duty drawback in the U.S.)
Reported profit from operations down 15.8% (with reported operating margin down 7.1 ppts to 34.9%), partly
due to a credit in the prior year related to the Canadian settlement provision
Reported diluted EPS down 28.6% to 145.3p,
Share buy-back programme on track for £1.3 billion in 2026
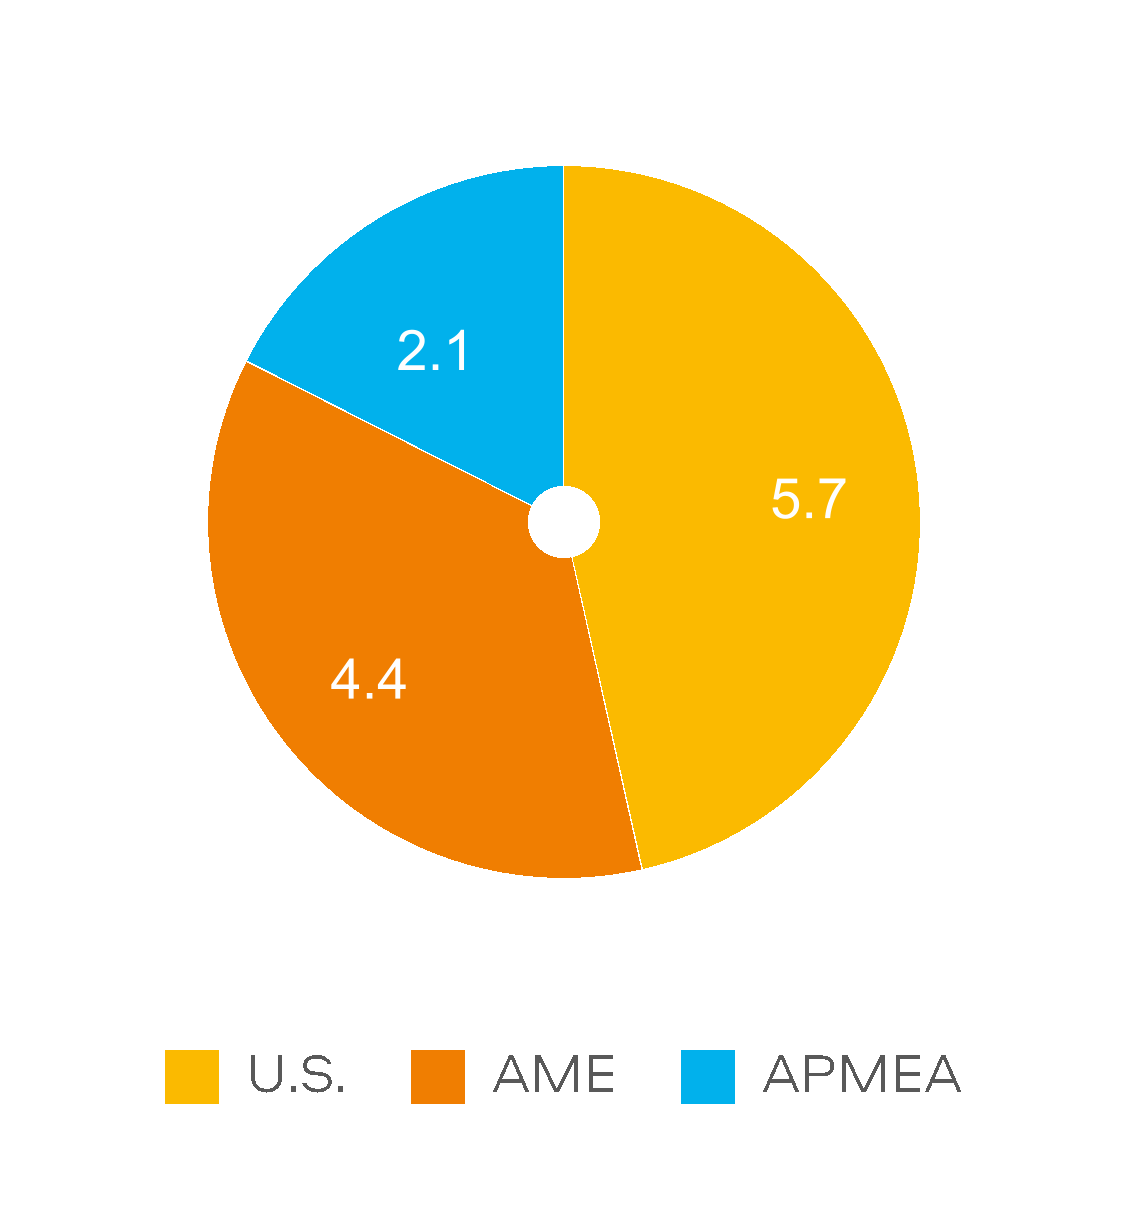
Revenue by Region (£bn)
YoY movements at constant rates
-6.3%
+8.5%
+0.9%
40
Change in Group Revenue:
Reported
+1.4%
At CC2
+2.9%
1.Adjusting items represent certain items which the Group considers distinctive based upon their size, nature or incidence -
see pages 25 to 26. 
2.Presented on a constant currency (CC) basis.
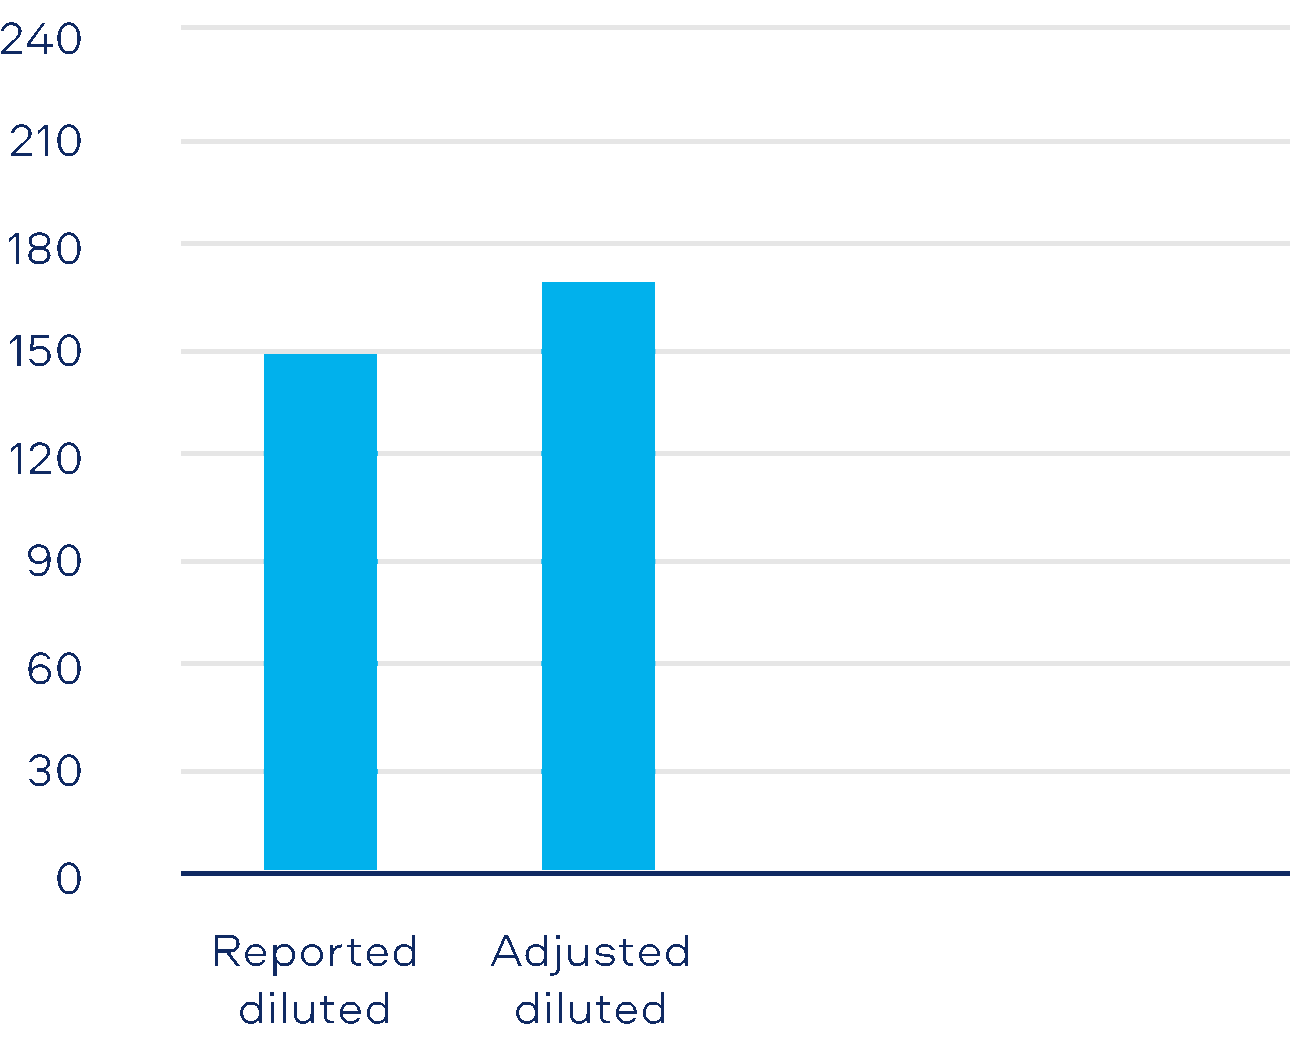
Earnings per Share (pence)
167.7
145.3
Change in Group diluted EPS:
Reported
-28.6%
Adj1 at CC2
+5.9%
3395
2
Screenshot-2022-09-15-at-17.21.45-(1).jpg
Summary Information
Performance highlights
IFRS
Non-GAAP
Reported
Adjusted3
For six months to 30 June 2026
Current
vs 2025
Current
vs 2025
rates
(current)
rates
(constant)
Cigarette volume share1
-30 bps
Cigarette value share1
-40 bps
Consumers of Smokeless products2
35.0m
+0.9m
Revenue (£m)
£12,235m
+1.4%
£12,235m
+2.9%
Revenue from New Categories (£m)
£1,928m
+16.8%
£1,928m
+18.0%
Smokeless revenue as % of total revenue (%)4
19.8%
+1.6 ppts
Profit from operations (£m)
£4,266m
-15.8%
£5,426m
+2.5%
Operating margin (%)
34.9%
-7.1 ppts
44.4%
-20 bps
Diluted EPS (pence)
145.3p
-28.6%
167.7p
+5.9%
Net cash generated from operating activities (£m)
£3,402m
+47.3%
Borrowings including lease liabilities (£m)
£35,063m
-0.4%
The use of non-GAAP measures, including adjusting items and constant currencies, are further discussed from page 47, with reconciliation from the most comparable IFRS measure provided.
Notes:
1. To better reflect the evolving performance of each category, from 1 January 2026, the Group has decoupled the value share and volume share metrics from a combined Cigarettes and HP
view to disclose the performance of Cigarettes as a distinct category. 2. Internal estimate. 3. See page 25 for discussion on adjusting items. 4. Movement in Smokeless revenue as a
percentage of total revenue compared to full year 2025.
Full-Year 2026 Guidance
Global cigarette industry volume expected to be down c.3%.
Gross capital expenditure in 2026 of approximately £750 million.
Enquiries
For more information, please contact
Investor Relations:
Victoria Buxton +44 (0)20 7845 2012
Amy Chamberlain +44 (0)20 7845 1124
John Harney+44 (0)20 7845 1263
BAT IR TeamIR_Team@bat.com
Press Office:
+44 (0)20 7845 2888 | @BATplc
media_centre@bat.com
3
Screenshot-2022-09-15-at-17.21.45-(1).jpg
Group Operating Review
Analysis of profit from operations and diluted earnings per share by segment
Prior year data is provided in the table on page 57.
For six months to 30 June 2026
Reported
vs
2025
Adj
Items1
Adjusted
vs
2025
Exch.
Adjusted
at CC2
vs
2025
£m
%
£m
£m
%
£m
£m
%
Revenue
U.S.
5,687
+4.7%
5,687
+4.7%
206
5,893
+8.5%
AME
4,402
+2.8%
4,402
+2.8%
(83)
4,319
+0.9%
APMEA
2,146
-8.9%
2,146
-8.9%
61
2,207
-6.3%
Total Group
12,235
+1.4%
12,235
+1.4%
184
12,419
+2.9%
Profit from Operations
U.S.
2,595
+15.0%
652
3,247
+6.0%
124
3,371
+10.1%
AME
1,212
-38.4%
259
1,471
-0.2%
(28)
1,443
-2.1%
APMEA
459
-45.7%
249
708
-17.4%
8
716
-16.5%
Total Group
4,266
-15.8%
1,160
5,426
+0.6%
104
5,530
+2.5%
Net finance costs
(403)
-58.4%
(391)
(794)
-8.9%
(12)
(806)
-7.5%
Associates and joint ventures
189
-87.2%
189
-18.6%
22
211
-8.9%
Profit before tax
4,052
-27.3%
769
4,821
+1.4%
114
4,935
+3.8%
Taxation
(824)
-18.3%
(279)
(1,103)
%
(28)
(1,131)
+2.5%
Non-controlling interests
(38)
-29.1%
(2)
(40)
-28.7%
(2)
(42)
-25.7%
Coupons relating to hybrid bonds net of tax
(28)
+32.1%
(28)
+32.1%
(28)
+32.1%
Profit attributable to shareholders
3,162
-29.6%
488
3,650
+2.2%
84
3,734
+4.5%
Diluted number of shares (m)
2,176
-1.3%
2,176
-1.3%
2,176
-1.3%
Diluted earnings per share (pence)
145.3
-28.6%
167.7
+3.5%
171.6
+5.9%
1.Adjusting items represent certain items which the Group considers distinctive based upon their size, nature or incidence - see pages 25 to 26.
2.CC: constant currency – measures are calculated based upon a re-translation, at the prior year’s exchange rates, of the current year’s results of the Group and, where applicable, its
segments.
Total Group revenue
Reported revenue increased 1.4% to £12,235 million, despite a translational foreign exchange headwind of 1.5%.
On a constant currency basis, revenue grew by 2.9%, as:
The U.S. grew revenue (up 8.5%) with combustibles up 5.0% (driven by price/mix, including excise duty drawback, of +10.2%
and short-term inventory movements) which were partly offset by lower volume (down 5.2%). New Categories grew 58.1%,
driven by the success of Velo Plus (with revenue of Modern Oral up 220%) and Vapour up 19.8%;
AME increased by 0.9% led by combustibles (up 2.5% as price/mix of +8.7% offset a 6.2% decline in volume) and the growth of
Modern Oral (up 21.8%), which drove New Categories revenue up 1.9%. However, Vapour was down 13.9% (largely due to
regulatory changes in Poland) with HP down 10.8%, as growth in Romania was more than offset by higher investment due to
competitive activity in Italy and Poland.
APMEA revenue was down 6.3%, mainly driven by the challenging regulatory environment and the impact of illicit combustibles
volume in Bangladesh and Australia, the timing of inventory movements in Vietnam (driven by regulatory changes that were
implemented in 2025) and lower volume in Malaysia, which more than offset higher revenue in Pakistan (led by pricing and a return
to volume growth). HP was down 12.5%, largely due to inventory movements and heightened competition in Japan.
In total, New Categories growth accelerated, with revenue up 18.0% on a constant rates basis driven by Modern Oral (up
65.9%). Vapour revenue returned to growth with an increase of 5.3%, while HP revenue was down 11.7%.
Group cigarette volume share declined 30 bps and value share was down 40 bps with U.S. volume share declining 80 bps and
value share down 40 bps.
Refer to pages 5 to 7 for discussion on regional performance and pages 8 to 9 for a further discussion on the performance by category.
4
Screenshot-2022-09-15-at-17.21.45-(1).jpg
Group Operating Review
Continued
Profit from operations, operating margin
Profit from operations on a reported basis was down 15.8%, with reported operating margin down 7.1 ppts to 34.9%. These were
driven by higher adjusting items of £1,160 million (compared to £325 million in the six months ended 30 June 2025), due to:
a lower net credit of £38 million (30 June 2025: £575 million) in respect of the provision related to the Canadian litigation
settlement described on page 26; and
costs of £370 million in respect of the Group's operational and process review programme (referred to as Fit2Win, as discussed
on page 13); partly offset by
a credit of £149 million as the Group settled historical litigation with ITG Brands, which was treated as an adjusting item in the
six months ended 30 June 2026; and
impairment charges in respect of Peru of £72 million recognised in the prior year that did not repeat (as discussed on page 26).
The Group's performance in the six months ended 30 June 2026 was also negatively impacted by a translational foreign exchange
headwind of 1.9% or £104 million.
On an adjusted, constant currency basis, profit from operations increased 2.5% to £5,530 million (30 June 2025: £5,394 million).
Included within the above was £109 million (30 June 2025: £154 million) related to the percentage (2026: 85%; 2025: 100%) of the
Canadian business' net income after taxes (excluding New Categories) that forms the payment amounts to claimants as part of
the settlement agreement.
Despite inflation on our product costs, estimated to be 3.7% (or £101 million at constant rates), this improvement in performance
was largely due to:
the U.S., which grew by 10.1%; and
AME; partly offset by
APMEA (down 16.5%), with the regional performance largely driven by the respective revenue performance discussed above.
In aggregate, Group New Categories contribution was up driven by Modern Oral (notably in the U.S. and with growth in AME) and
Vapour, partially offset by higher investment in HP in APMEA (in Japan) and AME (in Italy, Poland and Romania).
Adjusted operating margin was down 20 bps at 44.5% at constant rates of exchange.
For a full discussion on the performance by region, please see pages 5 to 7.
Earnings per share
Basic earnings per share were down 28.6% to 146.1p (30 June 2025: 204.6p) due to lower profit from operations and items that
benefitted the prior year and did not repeat, notably a gain of £333 million in respect of the demerger of the hotels division of the
Group's Indian associate ITC and a provisional gain that arose on the partial sale of the Group's investment in ITC in 2025 of £904 million.
However, in 2026, the Group recognised an adjusting credit to net finance costs of £315 million and an adjusting credit to taxation of
£95 million related to the FII GLO litigation following further judgments by the Supreme Court in the UK, as discussed on page 36.
Basic earnings per share were positively impacted by the reduction in the number of shares due to the cumulative effect of the
2025 and 2026 share buy-back programmes, with 14,609,571 ordinary shares repurchased and cancelled in the period.
Before adjusting items, the impact of translational foreign exchange and including the dilutive effect of employee share schemes,
adjusted diluted earnings per share, at constant rates, were up 5.9% to 171.6p (30 June 2025: 162.0p).
For a full reconciliation of diluted earnings per share to adjusted diluted earnings per share at constant rates, see page 54. Please also refer to page 57 for further reconciliations of profit
from operations and diluted EPS to adjusted profit from operations and adjusted diluted EPS at both current and constant rates of exchange.
5
Screenshot-2022-09-15-at-17.21.45-(1).jpg
Regional Review
The performances of the regions are discussed below. The following discussion is based upon the Group’s internal reporting structure.
All references to volume share or value share movement in the following discussion are compared to FY 2025. See page 40 for a discussion on the use of these measures.
Products sold in the U.S., including Vuse, Velo, Grizzly, Kodiak, and Camel Snus, are subject to FDA regulation and no reduced-risk claims will be made as to these products without agency clearance.
United States (U.S.):
Reported revenue up 4.7%, an increase of 8.5% at constant rates.
Our Modern Oral category volume share increased 11.6 ppts to 29.8%, with Velo Plus driving strong revenue growth in Modern
Oral, up 209% (or 220% at constant rates).
We increased our Vapour value share leadership in tracked channels (up 4.1 ppts to 55.9%), with Vapour revenue back to
growth (up 15.6%), an increase of 19.8% at constant rates of exchange, driven by higher volume (up 14.9%).
Combustibles revenue up 1.3% (up 5.0% at constant rates) as short-term inventory movements and price/mix (including excise
duty drawback) more than offset a 5.2% decline in volume. Volume share declined 80 bps with value share down 40 bps.
Smokeless now represents 22.7% of total revenue.
Volume/Revenue
Please see page 49 for a full reconciliation to constant currency metrics, including prior year data.
For six months to 30 June 2026
Volume
Revenue
Reported
Reported
Current
Exchange
Constant
Unit
vs 2025
£m
vs 2025
£m
£m
vs 2025
New Categories
816
+52.5%
30
846
+58.1%
Modern Oral (pouches bn)
3.2
+188%
315
+209%
12
327
+220%
Vapour (units mn)
141
+14.9%
501
+15.6%
18
519
+19.8%
HP (sticks bn)
%
%
%
Traditional Oral (stick eq bn)
2.2
-12.4%
477
-8.5%
17
494
-5.2%
Total Smokeless
1,293
+22.4%
47
1,340
+26.9%
Total Combustibles (bn sticks)
20
-5.2%
4,383
+1.3%
159
4,542
+5.0%
Other
11
-78.4%
11
-77.6%
Total
5,687
+4.7%
206
5,893
+8.5%
Constant currency measures are calculated based upon a re-translation, at the prior year's exchange rates, of the current year's results of the Group and, where applicable, its segments.
The preparation of the U.S. financial information is initially based on U.S. GAAP as the primary financial record and converted to IFRS for the purpose of consolidation within the results of
the Group.
Reported revenue increased 4.7%, despite a translational foreign exchange headwind negatively impacting revenue by 3.8%.
On a constant currency basis, revenue increased 8.5%. This was driven by the performance in:
Combustibles, where revenue increased 5.0%, as price/mix (including excise duty drawback) of +10.2% and short-term
inventory movements more than offset a 5.2% reduction in volume. This was higher than the industry volume decline of 4.0%,
as our volume was negatively impacted by the growth in the low value segment where we are under-represented. Our value
share was down 40 bps with volume share down 80 bps driven by Newport and Lucky Strike. However, our volume share has
started to stabilise during H1 2026;
Modern Oral, where revenue increased by 220%, driven by higher volume (up 188%) following the continued growth of Velo
Plus and Grizzly Modern Oral, with our volume share of Modern Oral up 11.6 ppts to 29.8%. We expect our performance to be
further enhanced by the planned roll-out of Velo Max which is expected to commence in the second half of 2026.
Vapour, where the U.S. is the world's largest Vapour market. The Group extended its value share leadership (of Vapour closed
systems consumables in tracked channels) with Vuse increasing value share by 4.1 ppts to 55.9%. Revenue grew 19.8% driven
by higher volume (up 14.9%, partly due to changes in the competitor landscape in H2 2025 and the positive impact from
progress in State level enforcement against illicit single-use vapour products) and price/mix (+4.9%). We expect our
performance to be further enhanced as we roll out a select range of adult-focused Vuse flavours in the second half of 2026; and
Traditional Oral, where revenue declined 5.2%, as price/mix (+7.2%) was more than offset by lower volume (down 12.4%), due to
the continued cross-category use of Modern Oral.
Profit from operations and operating margin
Please see page 57 for a full reconciliation to constant currency metrics, including prior year data.
For six months to 30 June 2026
Reported
Adj.
Exchange
Adjusted
Current
Constant
£m
vs 2025
£m
£m
£m
vs 2025
Profit from Operations
2,595
+15.0%
652
124
3,371
+10.1%
Operating Margin
45.6%
+4.1 ppts
57.2%
+80 bps
Constant currency measures are calculated based upon a re-translation, at the prior year's exchange rates, of the current year's results of the Group and, where applicable, its segments.
Reported profit from operations increased by 15.0%, partly due to a credit of £149 million as the Group settled historical litigation
with ITG Brands. Accordingly, reported operating margin was up 4.1 ppts to 45.6%.
Excluding adjusting items (largely in respect of the credit above and amortisation charges in both periods) and a translational
foreign exchange headwind of £124 million, our performance was positively impacted by the growth in revenue (described above).
Adjusted profit from operations, at constant rates of exchange was up 10.1% to £3,371 million.
6
Screenshot-2022-09-15-at-17.21.45-(1).jpg
Regional Review
Continued
Americas and Europe (AME):
Reported revenue up 2.8%, up 0.9% at constant rates.
New Category revenue increased 5.0%, up 1.9% at constant rates.
Resilient combustibles revenue performance - up 4.0%, up 2.5% at constant rates as price/mix (+8.7%) more than offset a 6.2%
reduction in volume.
Combustibles volume share flat and value share down 20 bps.
Multi-category region with Smokeless now representing 20.2% of revenue.
Volume/Revenue
Please see page 49 for a full reconciliation to constant currency metrics, including prior year data.
For six months to 30 June 2026
Volume
Revenue
Reported
Reported
Current
Exchange
Constant
Unit
vs 2025
£m
vs 2025
£m
£m
vs 2025
New Categories
874
+5.0%
(27)
847
+1.9%
Modern Oral (pouches bn)
3.9
+18.9%
440
+26.5%
(17)
423
+21.8%
Vapour (units mn)
108
-3.6%
235
-11.9%
(5)
230
-13.9%
HP (sticks bn)
3.8
-2.8%
199
-8.8%
(5)
194
-10.8%
Traditional Oral (stick eq bn)
0.3
+12.2%
17
-18.0%
(1)
16
-22.5%
Total Smokeless
891
+4.4%
(28)
863
+1.3%
Total Combustibles (bn sticks)
108
-6.2%
3,345
+4.0%
(48)
3,297
+2.5%
Other
166
-21.3%
(7)
159
-25.6%
Total
4,402
+2.8%
(83)
4,319
+0.9%
Constant currency measures are calculated based upon a re-translation, at the prior year's exchange rates, of the current year's results of the Group and, where applicable, its segments.
Reported revenue increased 2.8% partly due to a translational foreign exchange tailwind of 1.9%.
On a constant currency basis, which we believe reflects the operational performance, revenue was up 0.9% to £4,319 million, driven by:
Higher revenue from combustibles (up 2.5%), largely driven by Türkiye (led by pricing and further growth in volume) and pricing
across a number of markets, including Brazil and Mexico, partially offset by lower volume in Brazil and Mexico. These factors
combined to more than offset a reduction in revenue in Germany (resulting from higher investment due to competitive
intensity and the growth in trade labels in which the Group is not present), the exit from Cuba and lower volume in Romania and
Ukraine; and
Modern Oral, as volume was up 18.9% driving revenue up 21.8%. While volume share of the Modern Oral category was down 10
bps, we retained category leadership in our Top markets (as defined on page 46).
The volume and revenue growth reflects the strength of our portfolio in both established oral markets across Scandinavia and
markets with less of an established oral tradition, such as the UK and Poland.
These were partly offset by:
Lower revenue from Vapour (down 13.9%), largely driven by regulatory changes in Poland, more than offsetting early signs of
progress with Vuse Ultra in the premium segment. Our value share leadership was down 1.7 ppts with value share losses driven by
heightened competition in the growing rechargeable closed systems category in Europe and Canada, with the latter also
impacted by an increase in illicit volume; and
HP (down 10.8%), as higher revenue in Romania was more than offset by lower revenue in Poland (driven by increased
competition) and in Italy as the Group invested in retail activation as part of the roll-out of glo Hilo and glo Hyper Pro+
Profit from operations and operating margin
Please see page 57 for a full reconciliation to constant currency, including prior year data.
For six months to 30 June 2026
Reported
Adj.
Exchange
Adjusted
Current
Constant
£m
vs 2025
£m
£m
£m
vs 2025
Profit from Operations
1,212
-38.4%
259
(28)
1,443
-2.1%
Operating Margin
27.5%
-18.5 ppts
33.4%
-100 bps
Constant currency measures are calculated based upon a re-translation, at the prior year's exchange rates, of the current year's results of the Group and, where applicable, its segments.
Reported profit from operations declined 38.4% as the Group recognised a lower net credit of £38 million (30 June 2025: £575
million) in respect of the provision related to the Canadian litigation settlement described on page 26 and a net loss of £12 million
in respect of the Group's exit from Cuba. This was partly offset by a translational foreign exchange tailwind.
Excluding the impact of foreign exchange and adjusting items, adjusted profit from operations was down 2.1% to £1,443 million
as growth in Brazil (driven by combustibles pricing), Türkiye (driven by combustibles volume and pricing) and Scandinavia (driven
by Modern Oral) was more than offset by Germany (discussed above), the investment in Italy (related to HP) and Romania (due to
lower combustibles volume and investments in HP).
Included within the above was £109 million (30 June 2025: £154 million) related to the Canadian business' net income after taxes 
(excluding New Categories) that forms the payment amounts to claimants as part of the settlement agreement.
7
Screenshot-2022-09-15-at-17.21.45-(1).jpg
Regional Review
Continued
Asia-Pacific, Middle East and Africa (APMEA):
Reported revenue declined 8.9%, a decrease of 6.3% at constant rates.
New Category revenue declined 16.0% (down 10.3% at constant rates), with HP down 19.4% (down 12.5% at constant rates)
largely due to inventory movements and heightened competition in Japan.
Headwinds to combustibles volume and financial performance due to the challenging regulatory environment and the impact of
illicit combustibles volume in Bangladesh and Australia, the timing of inventory movements in Vietnam (driven by regulatory
changes that were implemented in 2025) and lower volume in Malaysia, which more than offset higher revenue in Pakistan (led by
pricing and a return to volume growth).
Combustibles value share down 30 bps with volume share down 20 bps, mainly driven by Japan.
Smokeless now represents 11.1% of total revenue.
Volume/Revenue
Please see page 49 for a full reconciliation to constant currency metrics, including prior year data.
For six months to 30 June 2026
Volume
Revenue
Reported
Reported
Current
Exchange
Constant
Unit
vs 2025
£m
vs 2025
£m
£m
vs 2025
New Categories
238
-16.0%
16
254
-10.3%
Modern Oral (pouches bn)
0.7
+27.5%
29
+37.4%
1
30
+43.2%
Vapour (units mn)
14
-20.2%
27
-25.6%
(1)
26
-28.2%
HP (sticks bn)
5.1
-18.0%
182
-19.4%
16
198
-12.5%
Traditional Oral (stick eq bn)
%
%
%
Total Smokeless
238
-16.0%
16
254
-10.3%
Total Combustibles (bn sticks)
95
-2.8%
1,833
-7.0%
44
1,877
-4.8%
Other
75
-26.9%
1
76
-24.9%
Total
2,146
-8.9%
61
2,207
-6.3%
Constant currency measures are calculated based upon a re-translation, at the prior year's exchange rates, of the current year's results of the Group and, where applicable, its segments.
Reported revenue declined 8.9%, negatively impacted by a translational foreign exchange headwind of 2.6%.
On a constant currency basis, which we believe reflects the operational performance, revenue was down 6.3% to £2,207 million.
Modern Oral was up 43.2%, fuelled by growth in Japan, Pakistan, South Africa, Kenya, the United Arab Emirates and in Global
Travel Retail, demonstrating Modern Oral's potential in the region.
However, this was more than offset by lower revenue in:
Combustibles (down 4.8%), mainly due to the challenging regulatory environment and the impact of illicit volume in Bangladesh
and Australia, the timing of inventory movements in Vietnam (driven by regulatory changes that were implemented in 2025) and
lower volume in Malaysia, which more than offset higher revenue in Pakistan (led by pricing and a return to volume growth).
Specifically in Australia, we estimate the illicit combustibles segment now accounts for around 80% of the combustibles
industry volume, with the duty paid combustibles industry volume down more than 50% in the first half of 2026 (versus the same
period in 2025);
Vapour, as volume declined 20.2%, leading to a 28.2% reduction in revenue, largely due to the Group's exit from the category in
low revenue markets (Indonesia and South Korea) as the Group prioritises investment to drive Quality Growth; and
HP (down 12.5%), largely due to inventory movements and heightened competition in Japan.
Profit from operations and operating margin
Please see page 57 for a full reconciliation to constant currency metrics, including prior year data.
For six months to 30 June 2026
Reported
Adj.
Exchange
Adjusted
Current
Constant
£m
vs 2025
£m
£m
£m
vs 2025
Profit from Operations
459
-45.7%
249
8
716
-16.5%
Operating Margin
21.4%
-14.5 ppts
32.4%
-4.0 ppts
Constant currency measures are calculated based upon a re-translation, at the prior year's exchange rates, of the current year's results of the Group and, where applicable, its segments.
Profit from operations was 45.7% lower, including a translational foreign exchange headwind of 0.9%.
Excluding adjusting items and translational foreign exchange, adjusted profit from operations at constant rates was down 16.5%
to £716 million driven by:
Japan, impacted by lower revenue and higher investment in HP;
Australia due to the lower revenue discussed above; and
Vietnam due to inventory movements discussed above.
However, these were partly offset by an increase in Pakistan, which was positively impacted by combustibles pricing and
growing combustibles volume.
8
Screenshot-2022-09-15-at-17.21.45-(1).jpg
Category Performance Review
Modern Oral
Revenue up 66.6%, or 65.9% at constant rates, with volume growth of 57.5%.
Extended global category leadership with volume share* up 8.4 ppts.
AME volume share* leadership maintained, led by strong performances in Sweden and Denmark.
In the U.S., volume was up 188%, with revenue up 209% (up 220% at constant rates), driven by the growth of Velo Plus and
Grizzly Modern Oral.
In AME, volume was up 18.9%, driving revenue up 26.5% (or 21.8% at constant rates). While volume share of the Modern Oral
category was down 10 bps, we retained category leadership in our Top markets (as defined on page 46).
The volume and revenue growth reflects the strength of our portfolio in both established oral markets across Scandinavia and
markets with less of an established oral tradition, such as the UK and Poland.
In the U.S., revenue increased by 209% (or 220% at constant rates), driven by higher volume (up 188%) following the continued
growth of Velo Plus and Grizzly Modern Oral, with our volume share of Modern Oral up 11.6 ppts to 29.8%. We expect our
performance to be further enhanced by the planned roll-out of Velo Max which is expected to commence in the second half of 2026.
In APMEA, our volume grew 27.5% and our revenue grew 37.4% (or 43.2% at constant rates), fuelled by growth in Japan, Pakistan,
South Africa, Kenya, the United Arab Emirates and in Global Travel Retail, demonstrating Modern Oral's potential in the region.
*Volume share is based upon the Top Modern Oral markets which are defined as the Group's priority Top Modern Oral markets by industry revenue. Top Modern Oral markets are the U.S.,
Sweden, Denmark, Norway, Switzerland, the UK and Poland, accounting for c.90% of total addressable industry Modern Oral revenue in 2025.
Vapour
Continued value share* leadership (in tracked channels) up 1.2 ppts, driven by Vuse in the U.S. (up 4.1 ppts to 55.9%).
Vapour revenue up 3.6%, up 5.3% (at constant rates), with volume up 4.2%, driven by the U.S. but partially offset by
regulatory changes in Poland.
In AME, Vapour value share down 1.7 ppts*, with industry rechargeable closed systems continuing to grow.
Vuse Ultra, our new premium product, continued to be rolled out in H1 2026, with further roll-outs planned for H2 2026.
Group Vapour performance was driven by:
The U.S., the world's largest Vapour market, with Vuse volume up 14.9% partly due to changes in the competitor landscape in
H2 2025 and the positive impact from progress in State level enforcement against illicit single-use vapour products and price/
mix (+4.9%).
Accordingly in the U.S., revenue was up 15.6% (or 19.8% on a constant currency basis). The Group extended its value share
leadership (of Vapour closed systems consumables in tracked channels) with Vuse increasing value share by 4.1ppts to 55.9%.
We expect our performance to be further enhanced as we roll out a select range of adult-focused Vuse flavours in the second
half of 2026.
This was partially offset by;
AME, where revenue declined 11.9% (or 13.9% on a constant currency basis), largely driven by regulatory changes in Poland, more
than offsetting early signs of progress with Vuse Ultra in the premium segment. Our value share leadership was down 1.7 ppts
with value share losses driven by heightened competition in the growing rechargeable closed systems category in Europe and
Canada, with the latter also impacted by an increase in illicit volume; and
APMEA, where volume declined 20.2%, leading to a 25.6% reduction in revenue (down 28.2% at constant rates), largely due to
the Group's exit from the category in low revenue markets (Indonesia and South Korea) as the Group prioritises investment to
drive Quality Growth.
Our new premium innovation, Vuse Ultra, offers consumers a highly differentiated, connected and customisable experience. We are
encouraged by the early performance in our launch markets and expect to continue the roll-out in a targeted way through H2 2026.
*Based on Vuse estimated value share in measured retail for Vapour (i.e., value share of rechargeable closed systems consumables and disposables sales in retail) in the Top global markets.
Top Vapour markets are defined as the Group's priority Top Vapour markets by industry revenue. Top Vapour markets are the U.S., Canada, the UK, France, Germany and Spain. These
Top Vapour markets account for c.70% of total addressable industry vapour revenue (rechargeable closed systems consumables and disposables in tracked channels) in 2025.
Heated Products (HP)
Revenue down 14.2%, down 11.7% at constant rates, driven by Japan due to inventory movements and heightened
competition in the value segment.
Volume share*, down 1.2 ppts, reflecting heightened competition in the value segment.
AME volume share* down 70 bps with growth in Poland, Spain and Portugal, more than offset by Italy, Greece, Germany and
the Czech Republic.
glo Hilo driving share growth (in premium/aspirational premium) in Japan, Poland and Italy and encouraging results in new
launch markets (Romania and Greece).
In APMEA, volume was down 18.0%, with revenue down 19.4%, a decrease of 12.5% at constant rates, largely due to inventory
movements and heightened competition in Japan.
In AME, volume was down 2.8%, with revenue down 8.8% (a decline of 10.8% at constant rates), as higher revenue in Romania
was more than offset by lower revenue in Poland (driven by increased competition) and in Italy as the Group invested in retail
activation as part of the roll-out of glo Hilo and glo Hyper Pro+.
We expect to further enhance our portfolio in H2 2026 with Hilo amplification in the premium segment and with Hyper
strengthening performance in the value segment through a phased roll-out of the Hyper Pro+ upgrade.
*Volume share is based upon the Top HP markets which are defined as the Group's priority Top HP markets by industry revenue. Top HP markets are Japan, South Korea, Italy, Germany,
Greece, Poland, Romania, the Czech Republic, Spain and Portugal. These Top HP markets account for c.80% of total addressable industry HP revenue in 2025.

9
Screenshot-2022-09-15-at-17.21.45-(1).jpg
Category Performance Review
Continued
Combustibles
Value share down 40 bps* and volume share down 30 bps*, as resilient volume share in AME (flat) was more than offset by
the U.S. (down 80 bps) and APMEA (down 20 bps).
Revenue grew 0.5% (up 2.1% at constant rates) with higher category contribution driven by the U.S. and AME.
Return to growth in the U.S., with revenue up 1.3% (or 5.0% at constant rates) as price/mix (including excise duty
drawback) more than offset volume decline (down 5.2%).
Resilient AME performance with revenue up 4.0%, or up 2.5% at constant rates, driven by Brazil and Türkiye, partly offset by
Germany and Romania and the exit from Cuba.
APMEA revenue declined 7.0%, or 4.8% at constant rates, with volume down 2.8%, driven by lower volume in Bangladesh and
Australia, the timing of inventory movements in Vietnam (driven by regulatory changes that were implemented in 2025) and lower
volume in Malaysia, which more than offset higher revenue in Pakistan (led by pricing and a return to volume growth).
Revenue from combustibles increased 0.5% to £9,561 million. Our performance was negatively impacted by a translational
foreign exchange headwind, with revenue up 2.1% at constant rates as continued robust price/mix of +6.8% was partly offset by
lower volume (down 4.7%).
Group cigarette volume was down 4.6% to 218 billion sticks as volume growth in Pakistan and Türkiye was more than offset by
lower volume in a number of markets, mainly driven by the U.S., Bangladesh, Malaysia, Romania and Ukraine, inventory
movements in Vietnam (due to regulatory changes implemented in 2025) and market exits (including Cuba and Mozambique).
Excluding the impact of translational foreign exchange:
In the U.S., revenue increased 5.0%, as price/mix (including excise duty drawback) of +10.2% and short-term inventory
movements more than offset a 5.2% reduction in volume. This was higher than the industry volume decline of 4.0%, as our
volume was negatively impacted by the growth in the low value segment where we are under-represented. Our value share
was down 40 bps with volume share down 80 bps driven by Newport and Lucky Strike. However, our volume share has started
to stabilise during H1 2026;
In AME, higher revenue (up 2.5%) was largely driven by Türkiye (led by pricing and further growth in volume) and pricing across a
number of markets, including Brazil and Mexico, partially offset by lower volume in Brazil and Mexico. These factors combined
to more than offset a reduction in revenue in Germany (resulting from higher investment due to competitive intensity and the
growth in trade labels in which the Group is not present), the exit from Cuba and lower volume in Romania and Ukraine; and
In APMEA, revenue declined 4.8% due to the challenging regulatory environment and the impact of illicit volume in Bangladesh
and Australia, the timing of inventory movements in Vietnam (driven by regulatory changes that were implemented in 2025) and
lower volume in Malaysia, which more than offset higher revenue in Pakistan (led by pricing and a return to volume growth).
*Volume and value share are based upon the Top cigarette markets which are defined as the Group's priority Top cigarette markets by industry revenue. Top cigarette markets are the U.S.,
Japan, Brazil, Germany, Pakistan, Mexico and Romania, accounting for c.50% of total addressable industry cigarette revenue in 2025.
Traditional Oral
Group volume declined 9.6% to 2.5 billion stick equivalents. Total revenue was £494 million (30 June 2025: £542 million), down
8.8% (or 5.8% at constant rates).
In the U.S., which accounts for 97% of the Group's revenue from the category, revenue declined 8.5% or 5.2% at constant rates,
as price/mix (+7.2%) was more than offset by lower volume (down 12.4%), due to the continued cross-category use of Modern
Oral.
Value share in the U.S. decreased 40 bps, with volume share down 60 bps, negatively impacted by continued consumer
migration predominantly in the aspirational premium segment, where Grizzly is positioned.
Outside the U.S., revenue declined 18.0%, or 22.5% at constant rates of exchange, largely due to the performance of Granit in
Sweden.
Beyond Nicotine
Btomorrow Ventures has completed over 30 investments since its launch in 2020 and through the Group’s £350 million
commitment towards the corporate venture capital fund. It invests to support the Group’s transformational journey to A Better
Tomorrow™ focusing predominantly on Smokeless nicotine products, technology and capability enablers, sustainability and
Wellbeing and Stimulation.
The Group has also continued its exploration in the Wellbeing and Stimulation category with Ryde: functional shots now selling in
the U.S. (through national online sales and retail primarily in Texas), in addition to Australia and Canada.
10
Screenshot-2022-09-15-at-17.21.45-(1).jpg
Other Financial Information
Cash flow
We continue to make good progress on de-leveraging our balance sheet, driven by continued strong cash generation.
Cash flow is typically weighted to the second half of the year.
Our active capital allocation framework considers the continued investment in our transformation, the macro-environment, and
potential future litigation and regulatory outcomes.
We understand the importance of cash returns to shareholders, and remain committed to our progressive dividend based upon
65% of long-term sustainable earnings.
For six months to 30 June
2026
2025
Change
£m
£m
%
Net cash generated from operating activities
3,402
2,309
47.3%
As at 30 June
2026
2025
Change
£m
£m
%
Borrowings (including lease liabilities)
(35,063)
(35,208)
-0.4%
In the Group’s cash flow statement, prepared in accordance with IFRS and presented on page 22, net cash generated from
operating activities increased by 47.3% to £3,402 million. This was largely due to:
lower payments in respect of the Franked Investment Income Group Litigation Order (FII GLO) of £111 million (of which
£44 million was in respect of the principal, impacting net cash generated from operating activities, and £67 million was in
respect of interest paid) compared to £368 million in the first six months of 2025, discussed on page 36
lower tax paid as the first six months of 2025 included the net impact of the tax deferrals in the U.S. of £491 million
(US$624 million) which did not repeat. Tax payments in the U.S. of £700 million (US$895 million) were deferred from 2024 to
2025, partly offset by deferral of £209 million (US$271 million) from the first half of 2025 to the second half of 2025; and
the receipt, in the first six months of 2026, of £149 million (US$200 million) from ITG Brands, LLC (ITG) in settlement of a
dispute with respect to the liability arising under the Florida State Settlement Agreement, specifically regarding the four brands
(Winston, Salem, Kool and Maverick) that were sold to ITG in 2015.
11
Screenshot-2022-09-15-at-17.21.45-(1).jpg
Other Financial Information
Continued
Borrowings and net debt
Borrowings (which includes lease liabilities) were £35,063 million at 30 June 2026, a decrease of 0.4% compared to £35,208
million at 30 June 2025 (31 December 2025: £35,070 million).
The Group remains confident of its ability to access the debt capital markets successfully and reviews its options on a continuing
basis.
The Group’s average centrally managed debt maturity of bonds was 9.3 years at 30 June 2026 (30 June 2025: 10.0 years; 31
December 2025: 9.5 years), and the highest proportion of centrally managed debt maturing in a single rolling 12-month period
was 15.1% (30 June 2025: 15.3%; 31 December 2025: 15.1%).
The Group defines net debt as borrowings (including related derivatives and lease liabilities), less cash and cash equivalents
(including restricted cash) and current investments held at fair value. Closing net debt was £32,555 million at 30 June 2026 (30
June 2025: £30,342 million; 31 December 2025: £31,215 million).
A reconciliation of borrowings to net debt is provided below.
As at 30 June
As at 31 December
2026
2025
Change
2025
£m
£m
%
£m
Borrowings (including lease liabilities)
(35,063)
(35,208)
-0.4%
(35,070)
Derivatives in respect of net debt
(25)
(27)
-7.4%
12
Cash and cash equivalents
2,518
4,404
-42.8%
3,827
Current investments held at fair value
15
489
-96.9%
16
Net debt
(32,555)
(30,342)
+7.3%
(31,215)
Maturity profile of net debt:
Net debt due within one year
(1,360)
1,573
n/m
492
Net debt due beyond one year
(31,195)
(31,915)
-2.3%
(31,707)
Net debt
(32,555)
(30,342)
+7.3%
(31,215)
Impacting the carrying value of net debt are:
Cash payments largely related to share schemes and investing activities of £268 million (30 June 2025: £47 million);
The purchase of £649 million (30 June 2025: £450 million) of own shares under the Group’s 2026 and 2025 share buy-back
programmes;
Other non-cash movements of £267 million (30 June 2025: £120 million); and
Foreign exchange impacts related to the revaluation of foreign currency denominated net debt balances which was a net
headwind of £341 million (30 June 2025: £1,611 million tailwind).
Included within both cash payments and other non-cash movements (above) is the classification of Cuba which was held-for-
sale at 31 December 2025 (£208 million) and subsequently sold in 2026.
In the six months ended 30 June 2025, net debt was also impacted by net proceeds of £1,052 million from the partial
monetisation of our investment in ITC in that period.
Investments held at fair value through profit and loss above include restricted amounts of £nil (30 June 2025: £427 million; 31
December 2025: £nil) in respect of investments held by subsidiaries in CCAA protection as well as £nil (30 June 2025: £17 million;
31 December 2025: £nil) subject to potential exchange control restrictions.
Cash and cash equivalents include restricted amounts of £386 million (30 June 2025 £2,047 million; 31 December 2025: £268 million)
in Canada which, due to ongoing restrictions associated with the Approved Plans in Canada, continue to be considered restricted
and £73 million (30 June 2025: £255 million; 31 December 2025: £67 million) principally due to exchange control restrictions.
12
Screenshot-2022-09-15-at-17.21.45-(1).jpg
Other Financial Information
Continued
Foreign currencies
The principal exchange rates used to convert the results of the Group’s foreign operations to pounds sterling for the purposes of
inclusion and consolidation within the Group’s financial statements are indicated in the table below. Where the Group has
provided results “at constant rates of exchange” this refers to the translation of the results from the foreign operations at rates
of exchange prevailing in the prior period – thereby eliminating the potentially distorting impact of the movement in foreign
exchange on the reported results.
The principal exchange rates used were as follows:
Average for the period ended
As at
30 June
31 December
30 June
31 December
2026
2025
2025
2026
2025
2025
Australian dollar
1.915
2.045
2.045
1.916
2.091
2.017
Bangladeshi taka
165.056
158.273
160.886
163.517
168.176
164.432
Brazilian real
6.930
7.468
7.363
6.870
7.479
7.371
Canadian dollar
1.854
1.828
1.842
1.883
1.870
1.844
Chilean peso
1,201.588
1,238.902
1,253.837
1,223.851
1,279.119
1,212.663
Euro
1.153
1.187
1.167
1.161
1.167
1.145
Indian rupee
125.277
111.763
114.989
125.636
117.521
120.892
Japanese yen
212.718
192.489
197.243
215.711
197.940
210.830
Romanian leu
5.931
5.939
5.885
6.082
5.929
5.834
South African rand
22.076
23.859
23.562
21.754
24.353
22.287
Swiss franc
1.058
1.118
1.094
1.071
1.091
1.066
US dollar
1.345
1.298
1.319
1.327
1.370
1.345
Other Information
Risks and uncertainties
The Board carried out a robust assessment of the Principal Risks and uncertainties facing the Group for the period, including
those that would threaten its business model, future performance, solvency, liquidity and viability. The Board also maintained
close oversight of the Group’s response to critical external uncertainties, recognising current macro-economic and geopolitical
challenges.
All Group risks are reviewed biannually by the Audit Committee and annually by the Board.
Leading in Sustainability is a core component and key building block of our corporate strategy and sustainability risk factors are
embedded across the Group's risks in accordance with the management of these risks within the Group.
The Principal Risks facing the Group are summarised under the headings of:
Competition from illicit trade;
Geopolitical tensions;
Tobacco, New Categories and other regulation interrupts the growth strategy;
Supply chain disruption;
Litigation and external investigations;
Significant increases or structural changes in tobacco, nicotine and New Categories related taxes;
Inability to develop, commercialise and deliver the New Categories strategy;
Disputed taxes, interest and penalties;
Injury, illness or death in the workplace;
Solvency and liquidity;
Foreign exchange rate exposures;
Climate change;
Circularity; and
Digital & Cyber.
A summary of the Principal Risks which are monitored by the Board through the Group’s risk register is set out on pages 166 to
175 of the Group’s Annual Report and Accounts for the year ended 31 December 2025 and a summary of the risk factors is set out
in Item 3.D - Risk Factors of the Group's annual report for the year ended 31 December 2025 on Form 20-F (the "2025 Form 20-F").
All the Group’s risks should be read in the context of the forward-looking statements on page 44 of this Half-Year Report.
13
Screenshot-2022-09-15-at-17.21.45-(1).jpg
Other Information
Continued
Conflict in the Middle East
We are closely monitoring developments in the Middle East. There is no significant impact on the Group at this time, and we have
comprehensive business continuity plans in place to manage cost and supply-chain pressures. However, the broader
macroeconomic and geopolitical backdrop is dynamic, increasing the risk of volatility in consumer sentiment should uncertainty
persist.
Update on investigations into misconduct allegations
On 25 April 2023, the Group announced that it had reached agreement with the U.S. Department of Justice (DOJ) and Office of
Foreign Assets Control (OFAC) to resolve previously disclosed investigations into suspicions of breaches of sanctions relating to
the Democratic People’s Republic of Korea between 2007 and 2017. On 11 May 2026, the DOJ filed a motion to dismiss the legal
proceedings against the Company, noting that the Company fully complied with the terms of the three-year deferred
prosecution agreement, and the court entered an order dismissing the proceedings with prejudice the same day. The three-year
probationary period imposed by the court on a BAT subsidiary in Singapore, British-American Tobacco Marketing (Singapore)
Private Limited (BATMS), in connection with the subsidiary’s entry of a guilty plea in the same proceedings has also now expired.
The Company’s compliance commitments under the civil settlement with OFAC remain in place until 2028.
The Group investigates, and becomes aware of governmental authorities’ investigations into, allegations of misconduct, including
alleged breaches of sanctions and allegations of corruption, at Group companies. Some of these allegations are currently being
investigated, including by OFAC, which is investigating suspicions of breaches of sanctions. The Group cooperates with the
authorities, where appropriate.
In addition, the Group is, and may in the future be, subject to investigations or legal proceedings in relation to, among other
things, its marketing, promotion or distribution activities in respect of its products. This includes, but is not limited to, allegations
that such activities, whether undertaken through traditional channels, digital platforms, third parties, or distribution applications,
do not comply with applicable laws or regulations. As such, the Group or Group companies, could be subject to liability and costs
associated with any damages, fines, or penalties brought in connection with these allegations.
There are instances where the Group investigates or where Group companies are cooperating with relevant national competition
authorities in relation to competition law investigations and/or engaged in legal proceedings at the appellate level.
Operational and process review
To further support our transformation and underpin investment initiatives to drive long-term sustainable profit and cash flow
growth, we are undertaking a structured time-bound programme (referred to as Fit2Win) to review processes and ways of
working which will generate efficiencies and facilitate faster, more agile and effective decision making.
Having commenced in 2025, the programme is expected to complete in 2027 and includes a comprehensive review of our
overhead optimisation opportunities, route to market and digitalisation in order to deliver more effective, data-driven digital ways
of working. The programme has also undertaken a global bottom-up review of our manufacturing assets and machinery, which
will facilitate an upgrade to more efficient, next generation technologies to support our ongoing transformation. Accordingly, we
have recognised an additional one-off, non-cash expense/charge of £228 million in 2026. During H1 2026, the programme has
also identified additional potential optimisation opportunities, with a further £100 million of costs expected to be incurred over
the life of the programme.
Including the above, we now expect associated one-off costs of approximately £950 million (being non-cash items of £330 million
and cash items of £620 million), with c.£840 million expected to be treated as adjusting items within adjusted profit from
operations.
By 30 June 2026, total costs of £482 million have been incurred since the programme commenced in 2025, with £459 million
treated as adjusting items within profit from operations, of which £370 million was recognised in the six months ended 30 June
2026.
The programme is expected to generate annualised cost efficiencies and cash flow which will be re-invested to support further
sustainable growth initiatives. By 30 June 2026, savings of c.£105 million have been realised.
Changes in the Group
Cuba
As disclosed on page 328 of the Group’s Annual Report and Accounts for the year ended 31 December 2025 and page 170 of the
2025 Form 20-F, the Group entered into an agreement to sell its 50% shareholding in Brascuba Cigarrillos S.A. (Brascuba), its
operating entity in the Republic of Cuba (Cuba), to Tabagest S.A. (Tabagest), a company incorporated in Cuba and an existing
investor in Brascuba. Completion occurred in February 2026, at which point, the business was deconsolidated from the Group’s
balance sheet. However, as the Cuban business was not significant to the users' understanding of that year or subsequent years
financial performance, Management did not treat the sale of Cuban business as an organic adjustment.
The net charge to the income statement in relation to the disposal of Brascuba was £12 million and includes the reclassification
of foreign exchange losses previously recognised in the statement of comprehensive income of £4 million.
ITC Ltd (ITC)
As previously disclosed, in the six months ended 30 June 2025, the Group recognised:
a gain of £333 million (net of tax) related to the demerger of ITC's hotel business; and
a provisional gain of £904 million related to the disposal of 313.0 million shares in ITC (being 2.5% of ITC's ordinary shares). The
Group received net proceeds of £1,052 million in 2025.
Both were treated as adjusting items in 2025, with no comparable transactions in 2026.
14
Screenshot-2022-09-15-at-17.21.45-(1).jpg
Other Information
Continued
Changes in the Group (continued)
Organigram Global Inc. (Organigram)
In February 2026, Organigram announced the acquisition of Sanity Group GmbH (Sanity). As previously disclosed, prior to the
acquisition;
the Group's ownership of Organigram was 36.77%, with voting rights restricted to 30%; and
the Group ownership of Sanity was 16.32%.
Under the terms of the acquisition, the Group sold its holding in Sanity in exchange for shares in  Organigram; in addition, the
Group subscribed to c.12% of the issued and outstanding share capital in Organigram for £35 million (CAD$65 million).
Post acquisition, the Group retains no continuing involvement in Sanity other than through its investment in Organigram.
Further, at 30 June 2026, the Group's shareholding in Organigram was 48.7% and may change, subject to certain earnout
provisions in relation to Organigram's acquisition of Sanity. However, there was no change to the Group's voting rights which
remain restricted to 30%.
Other associates
In May 2026, the Group completed the conversion of a loan to Charlotte’s Web Holdings into ordinary shares, concurrently
making an additional equity investment of £7 million (US$10 million).
Changes to the Board and Management Board
As previously disclosed, the following Board changes have taken place:
Dragos Constantinescu has been appointed to the role of Chief Financial Officer and Executive Director and will join the Board and
Management Board with effect from 1 September 2026;
Holly Keller Koeppel stepped down from the Board at the conclusion of the 2026 Annual General Meeting (AGM); and
Karen Guerra was appointed as Senior Independent Director with effect from the conclusion of the 2026 AGM, when Holly
Keller Koeppel stepped down from the Board.
Going concern
A description of the Group’s business activities, its financial position, cash flows, liquidity position, facilities and borrowings
position, together with the factors likely to affect its future development, performance and position, as well as risks associated
with the business, are set out in the Strategic Report and in the Notes on the Accounts, all of which are included in the Group's
Annual Report and Accounts for the year ended 31 December 2025 and Item 5 - Operating and financial review and prospects of
the 2025 Form 20-F, and available on the Group's website, www.bat.com.
This Half-Year Report provides updated information regarding the business activities, including cash flow, for the six months to
30 June 2026 and of the financial position and liquidity position at 30 June 2026.
The Group has, at the date of this announcement, sufficient existing financing available for its estimated requirements for at least
12 months from the date of approval of this condensed consolidated financial information. This, together with the ability to
generate cash from trading activities, the performance of the Group’s Strategic Portfolio, its leading market positions in a
number of countries and its broad geographical spread, as well as numerous contracts with established customers and suppliers
across different geographical areas and industries, provides the Directors with the confidence that the Group is well placed to
manage its business risks successfully through the ongoing uncertainty, the current macro-economic financial conditions and
the general outlook in the global economy.
After reviewing the Group’s forecast financial performance and financing arrangements, the Directors consider that the Group
has adequate resources to continue operating for at least 12 months from the date of approval of this condensed consolidated
financial information and that it is therefore appropriate to continue to adopt the going concern basis in preparing this Half-Year
Report.
15
Screenshot-2022-09-15-at-17.21.45-(1).jpg
This page is intentionally left blank.
16
Screenshot-2022-09-15-at-17.21.45-(1).jpg
Contents
Page
Financial Statements:
Group Income Statement
Group Statement of Comprehensive Income
Group Statement of Changes in Equity
Group Balance Sheet
Group Cash Flow Statement
Notes to the Unaudited Interim Financial Statements
Other Information
Data Lake and Reconciliations
17
Screenshot-2022-09-15-at-17.21.45-(1).jpg
Interim Financial Statements (unaudited)
Group Income Statement
Six months ended
30 June
2026
2025
£m 
£m
Revenue1
12,235
12,069
Raw materials and consumables used
(2,112)
(2,166)
Changes in inventories of finished goods and work in progress
119
185
Employee benefit costs
(1,651)
(1,463)
Depreciation, amortisation and impairment costs
(1,364)
(1,192)
Other operating income
92
54
Loss on reclassification from amortised cost to fair value
(5)
(5)
Other operating expenses
(3,048)
(2,413)
Profit from operations
4,266
5,069
Net finance costs
(403)
(969)
Share of post-tax results of associates and joint ventures
189
1,474
Profit before taxation
4,052
5,574
Taxation on ordinary activities
(824)
(1,009)
Profit for the period
3,228
4,565
Attributable to:
Owners of the parent
3,190
4,512
Non-controlling interests
38
53
3,228
4,565
Earnings per share
Basic
146.1p
204.6p
Diluted
145.3p
203.6p
All of the activities during both years are in respect of continuing operations.
The accompanying notes on pages 23 to 36 form an integral part of this condensed consolidated financial information.
1.Revenue is net of duty, excise and other taxes of £15,320 million and £15,515 million for the six months ended 30 June 2026 and 30 June 2025, respectively.
18
Screenshot-2022-09-15-at-17.21.45-(1).jpg
Interim Financial Statements (unaudited)
Continued
Group Statement of Comprehensive Income
Six months ended
30 June
2026
2025
£m 
£m 
Profit for the period (page 17)
3,228
4,565
Other comprehensive income (OCI)
Items that may be reclassified subsequently to profit or loss:
596
(4,255)
Foreign currency translation and hedges of net investments in foreign operations
– differences on exchange from translation of foreign operations
493
(4,360)
– reclassified and reported in profit for the period
134
– net investment hedges - net fair value gains on derivatives
17
221
– net investment hedges - differences on exchange on borrowings
5
(13)
Cash flow hedges
– net fair value gains/(losses)
23
(45)
– reclassified and reported in profit for the period
(14)
23
– tax on net fair value (losses)/gains in respect of cash flow hedges
(8)
7
Associates
– share of OCI, net of tax
(54)
(135)
– differences on exchange reclassified to profit or loss
47
Items that will not be reclassified subsequently to profit or loss:
(26)
(6)
Retirement benefit schemes
– net actuarial gains/(losses)
43
(37)
– movements in surplus restrictions
(7)
(39)
– tax on actuarial gains/(losses) and movements in surplus restrictions
(21)
5
Investments held at fair value
– net fair value (losses)/gains
(26)
70
Associates – share of OCI, net of tax
(15)
(5)
Total other comprehensive income/(expense) for the period, net of tax
570
(4,261)
Total comprehensive income for the period, net of tax
3,798
304
Attributable to:
Owners of the parent
3,758
279
Non-controlling interests
40
25
3,798
304
The accompanying notes on pages 23 to 36 form an integral part of this condensed consolidated financial information.
19
Screenshot-2022-09-15-at-17.21.45-(1).jpg
Interim Financial Statements (unaudited)
Continued
Group Statement of Changes in Equity
At 30 June 2026
Attributable to owners of the parent
Share
capital
Share premium,
capital
redemption and
merger reserves
Other
reserves
Retained
earnings
Total
attributable
to owners
of parent
Perpetual
hybrid
bonds
Non-
controlling
interests
Total
equity
£m
£m
£m
£m
£m
£m
£m
£m
Balance at 1 January 2026
577
26,675
(4,148)
22,929
46,033
1,893
219
48,145
Total comprehensive income for the period
comprising: (page 18)
553
3,205
3,758
40
3,798
Profit for the period (page 17)
3,190
3,190
38
3,228
Other comprehensive income for the
period (page 18)
553
15
568
2
570
Other changes in equity
Cash flow hedges reclassified and reported
in total assets
17
17
17
Employee share options
value of employee services
41
41
41
proceeds from new shares issued
3
3
3
treasury shares used for share option
schemes
Dividends and other appropriations
ordinary shares
(2,634)
(2,634)
(2,634)
to non-controlling interests
(76)
(76)
Purchase of own shares
held in employee share ownership trusts
(102)
(102)
(102)
share buy-back programme and cancelled
shares
(4)
4
(649)
(649)
(649)
Perpetual hybrid bonds
coupons paid
(6)
(6)
(6)
tax on coupons paid
1
1
1
Non-controlling interests - disposals
33
33
Other movements non-controlling
interests
Reclassification of equity relating to assets
held-for-sale
Other movements
24
24
24
Balance at 30 June 2026
573
26,682
(3,578)
22,809
46,486
1,893
216
48,595
The accompanying notes on pages 23 to 36 form an integral part of this condensed consolidated financial information.
20
Screenshot-2022-09-15-at-17.21.45-(1).jpg
Interim Financial Statements (unaudited)
Continued
Group Statement of Changes in Equity (continued)
At 30 June 2025
Attributable to owners of the parent
Share
capital
Share premium,
capital redemption
and merger
reserves
Other
reserves
Retained
earnings
Total
attributable
to owners
of parent
Perpetual
hybrid
bonds
Non-
controlling
interests
Total
equity
£m
£m
£m
£m
£m
£m
£m
£m
Balance at 1 January 2025
585
26,665
(902)
21,610
47,958
1,685
352
49,995
Total comprehensive (expense)/income for
the period comprising: (page 18)
(4,160)
4,439
279
25
304
Profit for the period (page 17)
4,512
4,512
53
4,565
Other comprehensive expense  for the
period (page 18)
(4,160)
(73)
(4,233)
(28)
(4,261)
Other changes in equity
Cash flow hedges reclassified and reported
in total assets
5
5
5
Employee share options
value of employee services
35
35
35
proceeds from new shares issued
1
1
1
treasury shares used for share option
schemes
1
(1)
Dividends and other appropriations
ordinary shares
(2,609)
(2,609)
(2,609)
to non-controlling interests
(74)
(74)
Purchase of own shares
held in employee share ownership trusts
(61)
(61)
(61)
share buy-back programme and cancelled
shares
(4)
4
(450)
(450)
(450)
Other movements
31
31
31
Balance at 30 June 2025
581
26,671
(5,057)
22,994
45,189
1,685
303
47,177
The accompanying notes on pages 23 to 36 form an integral part of this condensed consolidated financial information.
21
Screenshot-2022-09-15-at-17.21.45-(1).jpg
Interim Financial Statements (unaudited)
Continued
Group Balance Sheet
As at 30 June
As at 31 December
2026
2025
2025
£m 
£m 
£m 
Assets
Intangible assets
87,087
86,223
86,934
Property, plant and equipment
4,222
4,159
4,483
Investments in associates and joint ventures
1,589
1,533
1,521
Retirement benefit assets
919
841
880
Deferred tax assets
2,058
2,434
2,032
Trade and other receivables
323
283
288
Investments held at fair value
263
737
333
Derivative financial instruments
4
141
135
Total non-current assets
96,465
96,351
96,606
Inventories
4,845
5,088
4,382
Income tax receivable
465
108
470
Trade and other receivables
3,845
3,475
3,802
Investments held at fair value
15
489
16
Derivative financial instruments
235
302
162
Cash and cash equivalents
2,518
4,404
3,827
11,923
13,866
12,659
Assets classified as held-for-sale
9
25
Total current assets
11,923
13,875
12,684
Total assets
108,388
110,226
109,290
Equity – capital and reserves
Share capital
573
581
577
Share premium, capital redemption and merger reserves
26,682
26,671
26,675
Other reserves
(3,578)
(5,057)
(4,148)
Retained earnings
22,809
22,994
22,929
Owners of the parent
46,486
45,189
46,033
Perpetual hybrid bonds
1,893
1,685
1,893
Non-controlling interests
216
303
219
Total equity
48,595
47,177
48,145
Liabilities
Borrowings
31,045
31,904
31,708
Retirement benefit liabilities
787
769
801
Deferred tax liabilities
10,351
10,432
10,343
Other provisions for liabilities
3,141
3,212
3,161
Trade and other payables
35
586
484
Derivative financial instruments
156
150
124
Total non-current liabilities
45,515
47,053
46,621
Borrowings
4,018
3,304
3,362
Income tax payable
1,004
1,172
1,129
Other provisions for liabilities
599
3,089
608
Trade and other payables
8,576
8,243
9,328
Derivative financial instruments
81
188
91
14,278
15,996
14,518
Liabilities associated with assets classified as held-for-sale
6
Total current liabilities
14,278
15,996
14,524
Total equity and liabilities
108,388
110,226
109,290
The accompanying notes on pages 23 to 36 form an integral part of this condensed consolidated financial information.
22
Screenshot-2022-09-15-at-17.21.45-(1).jpg
Interim Financial Statements (unaudited)
Continued
Group Cash Flow Statement
Six months ended
30 June
2026
2025
£m 
£m 
Cash flows from operating activities
Cash generated from operating activities (page 30)
4,487
3,717
Dividends received from associates
139
168
Tax paid
(1,224)
(1,576)
Net cash generated from operating activities
3,402
2,309
Cash flows from investing activities
Interest received
83
85
Dividends received
2
Purchases of property, plant and equipment
(134)
(103)
Proceeds on disposal of property, plant and equipment
8
21
Purchases of intangibles
(34)
(42)
Proceeds on disposal of intangibles
2
8
Purchases of investments
(27)
(59)
Proceeds on disposals of investments
37
73
Investment in associates and acquisitions of other subsidiaries net of cash acquired
(45)
(23)
Net proceeds from disposal of shares in associate, net of tax
1,052
Disposal of subsidiary, net of cash disposed of
(192)
Net cash (used in)/generated from investing activities
(300)
1,012
Cash flows from financing activities
Interest paid on borrowings and financing related activities
(905)
(879)
Interest element of lease liabilities
(19)
(21)
Capital element on lease liabilities
(91)
(95)
Proceeds from increases in and new borrowings
1,055
3,552
Reductions in and repayments of borrowings
(1,206)
(3,047)
Outflows relating to derivative financial instruments
(39)
(445)
Purchases of own shares - share buy-back programme
(649)
(450)
Purchases of own shares held in employee share ownership trusts
(102)
(61)
Coupon paid on perpetual hybrid bonds
(6)
Dividends paid to owners of the parent
(2,634)
(2,609)
Dividends paid to non-controlling interests
(70)
(63)
Other
3
1
Net cash used in financing activities
(4,663)
(4,117)
Net cash flows used in operating, investing and financing activities
(1,561)
(796)
Transferred from held-for-sale
208
Differences on exchange
34
(144)
Decrease in net cash and cash equivalents in the period
(1,319)
(940)
Net cash and cash equivalents at 1 January
3,787
5,104
Net cash and cash equivalents at period end
2,468
4,164
Cash and cash equivalents per balance sheet
2,518
4,404
Overdrafts and accrued interest
(50)
(240)
Net cash and cash equivalents at period end
2,468
4,164
The accompanying notes on pages 23 to 36 form an integral part of this condensed consolidated financial information.
The net cash flows relating to the adjusting items within profit from operations on pages 25 to 26, included in the above, are an inflow of
£10 million (30 June 2025: £430 million outflow).
23
Screenshot-2022-09-15-at-17.21.45-(1).jpg
Notes to the Unaudited Interim Financial Statements
1. Accounting policies and basis of preparation
The condensed consolidated financial information comprises the unaudited interim financial information for the six months to 30
June 2026. The condensed consolidated financial information has been prepared in accordance with IAS 34 Interim Financial
Reporting as adopted for use in the UK and as issued by the International Accounting Standards Board (IASB), and the Disclosure
Guidance and Transparency Rules issued by the Financial Conduct Authority. The interim condensed consolidated financial
information is unaudited.
This condensed consolidated financial information does not constitute statutory accounts within the meaning of Section 434 of
the Companies Act 2006 and should be read in conjunction with the Group’s Annual Report and Accounts for the year ended 31
December 2025 and the 2025 Form 20-F, including the audited financial statements for the year ended 31 December 2025, which
were prepared in accordance with International Financial Reporting Standards (IFRS) as issued by the International Accounting
Standards Board (IASB) and UK-adopted international accounting standards. UK-adopted international accounting standards
differ in certain respects from IFRS as issued by the IASB. The differences have no impact on the Group’s consolidated financial
statements for the periods presented.
The Group’s Annual Report and Accounts for the year ended 31 December 2025 represent the statutory accounts for that year
and have been filed with the Registrar of Companies.
These condensed consolidated financial statements have been prepared under the historical cost convention, except in respect
of certain financial instruments. They are prepared on a basis consistent with the IFRS accounting policies as set out in the
Group’s Annual Report for the year ended 31 December 2025 and the 2025 Form 20-F.
The preparation of these condensed consolidated financial statements requires management to make estimates and
assumptions that affect the reported amounts of revenues, expenses, assets and liabilities and the disclosure of contingent
liabilities at the date of these condensed consolidated financial statements. Such estimates and assumptions are based on
historical experience and various other factors that are believed to be reasonable in the circumstances and constitute
management’s best judgement at the date of the condensed consolidated financial statements. Other than in respect of certain
assumptions related to the assessment of the carrying value of goodwill and intangible assets, the key estimates and
assumptions were the same as those that applied to the consolidated financial information for the year ended 31 December
2025, apart from updating the assumptions used to determine the carrying value of liabilities for retirement benefit schemes. As
described on page 26, the Group has assessed whether there are any impairment triggers related to the carrying value of the
significant investments of goodwill and intangibles. Other than as reported in prior periods, no further impairment is required. In
the future, actual experience may deviate from these estimates and assumptions, which could affect these condensed
consolidated financial statements as the original estimates and assumptions are modified, as appropriate, in the period in which
the circumstances change.
After reviewing the Group’s forecast financial performance and financing arrangements, the Directors consider that the Group
has adequate resources to continue operating for at least 12 months from the date of approval of this condensed consolidated
financial information and that it is therefore appropriate to continue to adopt the going concern basis in preparing this Half-Year
Report.
2. Segmental analyses
Revenue by segment
The following table shows 2026 revenue at 2026 rates of exchange, and 2026 revenue translated using 2025 rates of exchange.
The 2025 figures are stated at the 2025 rates of exchange.
Six months ended 30 June
2026
2025
Reported
Exchange
Reported at
CC1
Reported
Revenue
£m
£m
£m
£m
U.S.
5,687
206
5,893
5,432
AME
4,402
(83)
4,319
4,281
APMEA
2,146
61
2,207
2,356
Total Region
12,235
184
12,419
12,069
Notes to the analysis of revenue above:
1.CC: constant currency – measures are calculated based upon a re-translation, at the prior year’s exchange rates, of the current year’s results of the Group and, where applicable, its segments.
24
Screenshot-2022-09-15-at-17.21.45-(1).jpg
Notes to the Unaudited Interim Financial Statements (continued)
2. Segmental analyses (continued)
Profit from operations by segment
The following table shows 2026 profit from operations and adjusted profit from operations at 2026 rates of exchange, and 2026
adjusted profit from operations as adjusted for Canada3 translated using 2025 rates of exchange.
The 2025 figures are stated at the 2025 rates of exchange.
Six months ended 30 June
2026
Reported
Adj Items1
Adjusted
Exchange
Adjusted at
CC2
Adj for
Canada3 at
CC2
As adj. for
Canada3 at
CC2
£m
£m
£m
£m
£m
£m
£m
Profit from Operations
U.S.
2,595
652
3,247
124
3,371
3,371
AME
1,212
259
1,471
(28)
1,443
(109)
1,334
APMEA
459
249
708
8
716
716
Total Region
4,266
1,160
5,426
104
5,530
(109)
5,421
Net finance costs
(403)
Associates and joint ventures
189
Profit before tax
4,052
Taxation
(824)
Profit for the period
3,228
Six months ended 30 June
2025
Reported
Adj Items1
Adjusted
Adj for
Canada3
As adjusted
for Canada3
£m
£m
£m
£m
£m
Profit from Operations
U.S.
2,255
808
3,063
3,063
AME
1,969
(495)
1,474
(154)
1,320
APMEA
845
12
857
857
Total Region
5,069
325
5,394
(154)
5,240
Net finance costs
(969)
Associates and joint ventures
1,474
Profit before tax
5,574
Taxation
(1,009)
Profit for the period
4,565
Notes to the analysis of profit from operations above:
1.Adjusting items represent certain items which the Group considers distinctive based upon their size, nature or incidence.
2.CC: constant currency – measures are calculated based upon a re-translation, at the prior year’s exchange rates, of the current year’s results of the Group and, where applicable, its segments.
3.The adjustment in respect of Canada is discussed on pages 47 and 48, with the adjustment based upon a percentage (2026: 85%; 2025: 100%) of the net income after taxes earned from
all sources, excluding New Categories, in Canada.
25
Screenshot-2022-09-15-at-17.21.45-(1).jpg
Notes to the Unaudited Interim Financial Statements (continued)
3. Adjusting Items
Adjusting items are significant items of income or expense in profit from operations, net finance costs, taxation, the Group’s
share of the post-tax results of associates and joint ventures, diluted earnings per share, which individually or, if of a similar type,
in aggregate, are relevant to an understanding of the Group’s underlying financial performance because of their size, nature or
incidence. In identifying and quantifying adjusting items, the Group consistently applies a policy that defines criteria that are
required to be met for an item to be classified as adjusting. These items are separately disclosed in the segmental analyses or in
the notes to the accounts as appropriate.
The Group believes that these items are useful to users of the Group financial statements in helping them to understand the
underlying business performance and are used to derive the Group’s non-GAAP measures of adjusted profit from operations,
adjusted operating margin, adjusted net finance costs, adjusted taxation and adjusted diluted earnings per share, all of which are
before the impact of adjusting items and which are reconciled from profit from operations, diluted earnings per share, net
finance costs and taxation.
In addition, the non-GAAP measure of adjusted profit from operations is presented with the additional adjustment to reflect the
settlement of the Canadian litigation, and is referred to as "as adjusted for Canada"1. This measure is also reconciled from profit
from operations.
1.The adjustment in respect of Canada is discussed on pages 47 and 48, with the adjustment based upon a percentage (2026: 85%; 2025: 100%) of the net income after taxes earned from
all sources, excluding New Categories, in Canada.
Adjusting items included in profit from operations
Adjusting items are significant items in the profit from operations that individually or, if of a similar type, in aggregate, are
relevant to an understanding of the Group’s underlying financial performance.
In summary, in the six months ended 30 June 2026, the Group incurred £1,160 million (30 June 2025: £325 million) of adjusting
items within profit from operations:
Six months ended
30 June
2026
2025
£m
£m
(a)
Restructuring
370
13
(b)
Amortisation and impairment of trademarks and similar intangibles
796
804
(b)
Impairment of goodwill
72
(c)
Credit in respect of Romania's other taxes
(2)
(22)
(c)
Credit in respect of settlement of historical litigations with ITG brands
(149)
(c)
Other adjusting items (including Engle)
171
30
(c)
Charges in connection with disposal of subsidiaries
12
(d)
Credit in respect of the Canada Approved Plans
(38)
(575)
Charges in connection with disposal of associate
3
Total adjusting items included in profit from operations
1,160
325
(a) Restructuring and integration costs
To further support our transformation and underpin investment initiatives to drive long-term sustainable profit and cash flow
growth, we are undertaking a structured time-bound programme (referred to as Fit2Win) to review processes and ways of
working which will generate efficiencies and facilitate faster, more agile and effective decision making.
Having commenced in 2025, the programme is expected to complete in 2027 and includes a comprehensive review of our
overhead optimisation opportunities, route to market and digitalisation in order to deliver more effective, data-driven digital ways
of working. The programme has also undertaken a global bottom-up review of our manufacturing assets and machinery, which
will facilitate an upgrade to more efficient, next generation technologies to support our ongoing transformation. Accordingly, we
have recognised an additional one-off, non-cash expense/charge of £228 million in 2026. During H1 2026, the programme has
also identified additional potential optimisation opportunities, with a further £100 million of costs expected to be incurred over
the life of the programme.
Including the above, we now expect associated one-off costs of approximately £950 million (being non-cash items of £330 million
and cash items of £620 million), with c.£840 million expected to be treated as adjusting items within adjusted profit from
operations.
By 30 June 2026, total costs of £482 million have been incurred since the programme commenced in 2025, with £459 million
treated as adjusting items within profit from operations, of which £370 million was recognised in the six months ended 30 June
2026.
26
Screenshot-2022-09-15-at-17.21.45-(1).jpg
Notes to the Unaudited Interim Financial Statements (continued)
3. Adjusting Items (continued)
Adjusting items included in profit from operations (continued)
(b) Amortisation and impairment of trademarks and similar intangibles
(b)(i) Amortisation
Acquisitions in previous years have resulted in the capitalisation of trademarks and similar intangibles, including those which are
amortised over their expected useful lives, which do not exceed 30 years. The element of the total amortisation and impairment
charge treated as an adjusting item was £796 million (30 June 2025: £804 million) and is included within depreciation,
amortisation and impairment costs in the income statement.
(b)(ii) Ongoing impairment review of trademarks and similar assets
The Group reviews and monitors the performance of its non-financial assets (including goodwill) in line with the requirements of
IAS 36 Impairment of Assets. In preparing the Half-Year Report for the six months ended 30 June 2026, the Group has assessed if
any impairment indicators exist requiring a further detailed impairment assessment to be undertaken.
In the U.S., no changes have occurred in the legislative environment, nor in the macro-economic environment, during the six
months ended 30 June 2026 that present an indicator of a potential impairment for either Reynolds American goodwill or for the
definite- or indefinite-lived brands.
As part of the standard year-end impairment process, a detailed impairment review will be undertaken for all trademarks in line with
IAS 36 Impairment of Assets. This will include the entire Reynolds American portfolio to ensure the book values remain supportable.
(b)(iii) Impairment of goodwill
In the six months ended 30 June 2026, no impairment trigger has been identified in respect of goodwill (including in respect of
the U.S. and Canada), having recognised a goodwill impairment charge of £72 million in the six months ended 30 June 2025 in
respect of the Peru cash-generating unit.
(c) Other
In the six months ended 30 June 2026, the Group incurred a net charge of £32 million (30 June 2025: £8 million) of other adjusting
items. These included:
A credit of £149 million as the Group settled historical litigation with ITG Brands;
A net loss associated with the disposal of the business in Cuba of £12 million;
A credit of £2 million (30 June 2025: £22 million) in respect of the partial release of a provision recognised in December 2024 in
relation to an excise assessment of activities undertaken in the Ploiesti factory in Romania; and
Other costs of £171 million (30 June 2025: £30 million), mainly related to foreign exchange reclassified from reserves to the
income statement as a consequence of the cessation of a physical presence in certain countries. In the six months ended 30
June 2025, other costs mainly related to litigation costs including Engle progeny cases.
(d) Changes in provision in relation to Canada Approved Plans
The Group's estimated share of the undiscounted future liability in relation to the court-sanctioned plan of compromise and
arrangement to resolve all Canadian tobacco litigation in relation to the Group and other parties (the Approved Plans) in Canada
has not materially changed.
The Group recognised a net credit of £38 million in the six months ended 30 June 2026 due to minor revisions to the
assumptions, including the pre-tax discount rate decreasing from 3.86% at 31 December 2025 to 3.79% at 30 June 2026. This
compares to a net credit of £575 million (in the six months ended 30 June 2025) mainly in respect of pricing and volume decline
assumptions.
Based on our current estimate, it is expected that payments in respect of our estimated share of the future liability will continue
for at least 40 years.
At 30 June 2026, net of translational FX movements, unwinding of discount and the above factors, the non-current provision for
the future payments is £2,752 million (31 December 2025: £2,794 million).
Within current trade and other payables, an amount of £83 million is due to be paid in the second half of 2026.
Management uses judgement to determine the key assumptions used to calculate the present value of the provision. Changes to
key assumptions can significantly impact the amount expected to be paid and the years over which payments are expected to be
made.
A combination of changes in several assumptions, including the future financial performance (excluding New Categories) of
Imperial Tobacco Canada Limited's and Imperial Tobacco Company Limited's (together, ITCAN) and each of the other companies
(JTI-MacDonald Corp (a subsidiary of Japan Tobacco International) and Rothmans, Benson & Hedges Inc. (a subsidiary of Philip
Morris International Inc.)) and the performance of the combustibles industry as a whole, may materially impact the provision.
Refer to note 4 for the unwinding of the discount in the six months ended 30 June 2026. Please refer to pages 319 to 320 of the
Group's Annual Report and Accounts for the year ended 31 December 2025 and pages 162 to 163 of the 2025 Form 20-F for
further information on the Approved Plans including the impact of possible changes to key assumptions.
27
Screenshot-2022-09-15-at-17.21.45-(1).jpg
Notes to the Unaudited Interim Financial Statements (continued)
4. Net finance costs
Net finance costs were a charge of £403 million, compared to a charge of £969 million in the same period in 2025.
2026 was impacted by a translational foreign exchange tailwind due to the relative movement of sterling of 1.4%.
The Group considers that, following the judgment by the Supreme Court in the UK, the legal proceedings concerning the Franked
Investment Income Group Litigation Order (FII GLO) has now reached its conclusion. Accordingly, an adjusting net credit to net
finance costs of £315 million has been recognised in the six months ended 30 June 2026. This compares to a finance cost of
£19 million in the six months to 30 June 2025. For further detail please refer to note 15.
The performance in 2026 included a charge of £54 million (30 June 2025: £59 million) related to the unwinding of the discount in relation
to the provision associated with the Approved Plans in Canada. The first six months of 2025 also included a charge of £10 million related
to interest on unaffected claims settled post sanctioning of the Approved Plans. These charges were all treated as adjusting items.
Also included in the first six months of 2026 is a net gain on monetary items in Venezuela of £139 million resulting from the
application of hyperinflation accounting under IAS 29 Financial Reporting in Hyperinflationary Economies. This gain was treated
as an adjusting item.
The first six months of 2026 included a fair value loss of £nil (30 June 2025: £4 million) on embedded derivatives related to
associates, a charge of £6 million (30 June 2025: £3 million) in relation to a tax case in Brazil, a credit of £2 million (30 June 2025:
£nil) in respect of a tax provision in Indonesia and interest charges of £5 million (30 June 2025: £3 million) in respect of a tax
provision in the Netherlands. These are treated as adjusting items.
On an adjusted, constant currency basis, net finance costs were £806 million, a decrease of 7.5% (30 June 2025: £871 million).
This was driven by:
Lower transactional foreign exchange losses arising from revaluation of locally held cash balances and dividend receivables, as
well as fair value movements in respect of derivatives and investments;
Lower interest expense, principally driven by lower borrowings; and
Partially offset by lower interest income, driven by lower interest income in Canada due to reduced cash held, partially offset by
increased interest income in Türkiye due to higher local deposits.
The Group's average cost of debt, including foreign exchange losses and fair value movements, was 4.9% (compared to 5.1% at
30 June 2025).
Also in 2026, in line with IAS 33 Earnings Per Share, £28 million (30 June 2025: £22 million), net of tax, has been recognised as a
deduction to EPS related to the perpetual hybrid bonds. In 2021, the Company issued two 1 billion aggregate principal amount
perpetual hybrid bonds. During 2025, the Group repurchased 1 billion aggregate principal amount of perpetual hybrid bonds and
issued a further 1.2 billion aggregate principal amount of perpetual hybrid bonds. The coupons paid on such instruments are
recognised in equity rather than as a charge to the income statement in net finance costs.
For a full reconciliation of net finance costs to adjusted net finance costs at constant rates, see page 52. All of the adjustments
noted above have been included in the adjusted earnings per share calculation on page 29.
5. Results of associates and joint ventures
In the six months to 30 June, the Group’s share of post-tax results of associates and joint ventures decreased from £1,474 million
in 2025 to £189 million in 2026.
The decrease was largely due to the following adjusting gains, recognised in the six months ended 30 June 2025 and which did
not repeat:
a provisional gain of £904 million (net of tax) following the disposal of 313,000,000 ordinary shares in the Group's interest in its
associate ITC Ltd (ITC) in India; and
£333 million (net of tax) related to the demerger of ITC's hotel business (ITC Hotels). Following a partial sale of the Group's
holding in ITC Hotels in the second half of 2025, the Group now holds a direct stake of 6.3% in ITC Hotels, presented as a non-
current investment on the balance sheet and held at fair value.
During the period, a deemed gain of £1 million (30 June 2025: £3 million) was recognised as a result of ITC issuing ordinary shares
under the company’s Employees Share Option Scheme. As a result, the Group's shareholding in ITC has decreased from 22.91%
(31 December 2025) to 22.90%.
In February 2026, Organigram announced the acquisition of Sanity Group GmbH (Sanity). As previously disclosed, prior to the
acquisition;
the Group's ownership of Organigram was 36.77%, with voting rights restricted to 30%; and
the Group ownership of Sanity was 16.32%.
Under the terms of the acquisition, the Group sold its holding in Sanity in exchange for shares in  Organigram; in addition, the
Group subscribed to 12% of the issued and outstanding share capital in Organigram for £35 million (CAD$65 million).
Post acquisition, the Group retains no continuing involvement in Sanity other than through its investment in Organigram.
Further, at 30 June 2026, the Group's shareholding in Organigram was 48.7% and may change, subject to certain earnout
provisions in relation to Organigram's acquisition of Sanity. However, there was no change to the Group's voting rights which
remain restricted to 30%.
In May 2026, the Group completed the conversion of a loan to Charlotte’s Web Holdings into ordinary shares, concurrently
making an additional equity investment of £7 million (US$10 million).
Excluding the impact of translational foreign exchange and the adjusting items in the six months ended 30 June 2025, on an
adjusted constant currency basis, the Group’s share of post-tax results from associates and joint ventures was lower than in the
first half of 2025, down 8.9% to £211 million, partly as a result of the reduction in the Group's shareholding in ITC.
For a full reconciliation of the Group's share of post-tax results of associates and joint ventures to adjusted share of post-tax
results of associates and joint ventures, at constant rates of exchange, see page 52. For the impact on the calculation of adjusted
earnings per share, see page 29.
28
Screenshot-2022-09-15-at-17.21.45-(1).jpg
Notes to the Unaudited Interim Financial Statements (continued)
6. Taxation
The tax rate in the income statement was a charge of 20.3% for the six months to 30 June 2026 (30 June 2025: 18.1%). The
Group’s tax rate is affected by the impact of the adjusting items referred to on pages 25 to 27 and by the inclusion of the share of
associates and joint ventures post-tax profit in the Group’s pre-tax results.
Adjusting items in the six months ended 30 June 2026 included £100 million (30 June 2025: £66 million) mainly reflecting the
recognition of a tax credit in respect of the FII GLO litigation (described further on page 36 below) which, following the judgment
by the Supreme Court in the UK, the Group considers to have reached a conclusion. The adjusting items in 2025 mainly reflect
the revaluation of deferred tax liabilities arising on trademarks recognised in the Reynolds American acquisition in 2017 due to
changes in applicable U.S. state tax rates and apportionment factors.
The adjusting tax item also includes £179 million (30 June 2025: £29 million) in respect of the taxation on other adjusting items,
which are described on pages 25 to 26.
As the above items are not reflective of the ongoing business, they have been recognised as adjusting items within taxation. All of
the adjustments noted above have been included in the adjusted earnings per share calculation on page 29.
Excluding these, the Group’s underlying tax rate for subsidiaries reflected in the adjusted earnings per share on page 29 was
23.8% for the six months to 30 June 2026 (30 June 2025: 24.4%). The reduction in the Group's underlying tax rate for subsidiaries
is primarily driven by changes in the mix of profits and movements associated with prior periods (including tax audit outcomes
and the net impact of Pillar 2 filings for FY 2024).
A full reconciliation from taxation on ordinary activities to the underlying tax rate is provided on page 53.
The Group has applied the mandatory exemption to recognising and disclosing information about deferred tax assets and
liabilities related to Pillar Two income taxes in accordance with IAS 12 Income Taxes.
7. Earnings per share
Basic earnings per share were down 28.6% to 146.1p (30 June 2025: 204.6p) due to lower profit from operations and items that
benefitted the prior year and did not repeat, notably a gain of £333 million in respect of the demerger of the hotels division of the
Group's Indian associate ITC and a provisional gain that arose on the partial sale of the Group's investment in ITC in 2025 of
£904 million. However, in 2026, the Group recognised an adjusting credit to net finance costs of £315 million and an adjusting credit to
taxation of £95 million related to the FII GLO litigation following further judgments by the Supreme Court in the UK, as discussed on
page 36.
Basic earnings per share were positively impacted by the reduction in the number of shares due to the cumulative effect of the
2025 and 2026 share buy-back programmes, with 14,609,571 ordinary shares repurchased and cancelled in the period ended 30
June 2026.
Before adjusting items, the impact of translational foreign exchange and including the dilutive effect of employee share schemes,
adjusted diluted earnings per share, at constant rates, were up 5.9% to 171.6p (30 June 2025: 162.0p).
For a full reconciliation of diluted earnings per share to adjusted diluted earnings per share at constant rates, see page 54.
Earnings used in the basic, diluted and headline earnings per share calculation represent the profit attributable to the ordinary
equity shareholders after deducting amounts representing the coupon on perpetual hybrid bonds on a pro-rata basis regardless
of whether or not coupons have been declared and paid in the period. In 2026, this was £28 million (30 June 2025: £22 million), net
of tax.
Six months ended
30 June
2026
2025
£m
£m
Earnings attributable to owners of the parent
3,190
4,512
Coupon on perpetual hybrid bonds
(38)
(29)
Tax on coupon on perpetual hybrid bonds
10
7
Earnings
3,162
4,490
Basic earnings per share are based on the profit for the period attributable to ordinary shareholders and the weighted average
number of ordinary shares in issue during the period (excluding treasury shares). For the calculation of the diluted earnings per
share, the weighted average number of shares reflects the potential dilutive effect of employee share schemes.
Earnings per share calculations are based upon the following :
Reported
Adjusted
Headline
Basic
Diluted
Basic
Diluted
Basic
Diluted
Six months to 30 June 2026
– Earnings
£m
3,162
3,162
3,650
3,650
3,436
3,436
– Shares
m
2,165
2,176
2,165
2,176
2,165
2,176
– Per share
p
146.1
145.3
168.6
167.7
158.7
157.9
Six months to 30 June 2025
– Earnings
£m
4,490
4,490
3,573
3,573
3,698
3,698
– Shares
m
2,194
2,205
2,194
2,205
2,194
2,205
– Per share
p
204.6
203.6
162.9
162.0
168.5
167.7
29
Screenshot-2022-09-15-at-17.21.45-(1).jpg
Notes to the Unaudited Interim Financial Statements (continued)
7. Earnings per share (continued)
Adjusted diluted earnings per share are calculated by taking the following adjustments into account (see pages 25 to 26):
Items presented below are net of tax and non-controlling interests, when applicable.
Six months ended
30 June
2026
2025
pence
pence
Diluted earnings per share
145.3
203.6
Effect of adjusting items in depreciation, amortisation and impairment
28.4
31.4
Effect of adjusting items in operating expenses
1.1
(18.8)
Effect of restructuring costs
12.7
0.2
Effect of adjusting net finance costs
(15.2)
3.4
Effect of associates' adjusting items net of tax
(56.3)
Capital gains tax and deferred tax associated with the partial divestment of shares held in ITC and hotels
business demerger
1.6
Effect of adjusting items in taxation
(4.6)
(3.1)
Adjusted diluted earnings per share
167.7
162.0
Impact of translational foreign exchange
3.9
Adjusted diluted earnings per share translated at 2025 exchange rates
171.6
162.0
The presentation of headline earnings per share, as an alternative measure of earnings per share, is mandated under the JSE
Listing Requirements. It is calculated in accordance with Circular 1/2023 ‘Headline Earnings’ as issued by the South African
Institute of Chartered Accountants.
Diluted headline earnings per share are calculated by taking the following adjustments into account:
Six months ended
30 June
2026
2025
pence
pence
Diluted earnings per share
145.3
203.6
Effect of impairment of intangibles, property, plant and equipment, associates and held-for-sale assets (net of
tax)
8.0
3.0
Effect of gains on disposal of property, plant and equipment, trademarks, held-for-sale assets, partial/full
termination of IFRS 16 leases, and sale and leaseback (net of tax)
(1.9)
(0.8)
Effect of losses on disposal of businesses, non-current investments and brands (net of tax)
0.6
Effect of foreign exchange reclassification from reserves to the income statement
5.9
Issue of shares and change in shareholding of an associate
(0.1)
Gain on partial disposal of an associate and associated capital gains tax, including foreign exchange reclassified
(38.0)
Diluted headline earnings per share
157.9
167.7
The following is a reconciliation of earnings to headline earnings, in accordance with the JSE Listing Requirements:
Six months ended
30 June
2026
2025
£m
£m
Earnings
3,162
4,490
Effect of impairment of intangibles, property, plant and equipment, associates and held-for-sale assets (net of
tax)
173
68
Effect of gains on disposal of property, plant and equipment, trademarks, held-for-sale assets, partial/full
termination of IFRS 16 leases, and sale and leaseback (net of tax)
(40)
(17)
Effect of losses on disposal of businesses, non-current investments and brands (net of tax)
12
Effect of foreign exchange reclassification from reserves to the income statement
130
Issue of shares and change in shareholding of an associate
(1)
(2)
Gain on partial disposal of an associate and associated capital gains tax, including foreign exchange reclassified
(841)
Headline earnings
3,436
3,698
30
Screenshot-2022-09-15-at-17.21.45-(1).jpg
Notes to the Unaudited Interim Financial Statements (continued)
8. Cash Flow
Net cash generated from operating activities
Net cash generated from operating activities in the IFRS cash flows on page 22 includes the following items:
Six months ended
30 June
2026
2025
£m
£m
Profit for the period
3,228
4,565
Taxation on ordinary activities
824
1,009
Share of post-tax results of associates and joint ventures
(189)
(1,474)
Net finance costs
403
969
Profit from operations
4,266
5,069
Adjustments for:
– depreciation, amortisation and impairment costs
1,364
1,192
increase in inventories
(448)
(696)
increase in trade and other receivables
(102)
(1)
decrease in Master Settlement Agreement payable
(571)
(633)
decrease in trade and other payables
(160)
(565)
decrease in retirement benefit liabilities
(15)
(27)
decrease in other provisions for liabilities
(70)
(634)
– other non-cash items
223
12
Cash generated from operating activities
4,487
3,717
Dividends received from associates
139
168
Tax paid
(1,224)
(1,576)
Net cash generated from operating activities
3,402
2,309
Net cash generated from operating activities increased by £1,093 million. This was largely due to:
lower payments in respect of the Franked Investment Income Group Litigation Order (FII GLO) of £111 million (of which
£44 million was in respect of the principal, impacting net cash generated from operating activities, and £67 million was in
respect of interest paid) compared to £368 million in the first six months of 2025, discussed on page 36
lower tax paid as the first six months of 2025 included the net impact of the tax deferrals in the U.S. of £491 million
(US$624 million) which did not repeat. Tax payments in the U.S. of £700 million (US$895 million) were deferred from 2024 to
2025, partly offset by deferral of £209 million (US$271 million) from the first half of 2025 to the second half of 2025; and
the receipt, in the first six months of 2026, of £149 million (US$200 million) from ITG Brands, LLC (ITG) in settlement of a
dispute with respect to the liability arising under the Florida State Settlement Agreement, specifically regarding the four brands
(Winston, Salem, Kool and Maverick) that were sold to ITG in 2015. Please refer to page 354 of the Group's Annual Report and
Accounts for the year ended 31 December 2025 and pages 191 and 192 of the 2025 Form 20-F.
Also included within net cash generated from operating activities were litigation receipt of £2 million (30 June 2025: payment of
£42 million) which included, in both 2026 and 2025, payments in respect of Engle progeny cases (see page 35 for further details).
Expenditure on research and development was approximately £188 million for the six months to 30 June 2026 (30 June 2025:
£174 million) with a focus on products that could potentially reduce the risk associated with smoking conventional cigarettes.
The Group’s customer factoring arrangements and supplier financing arrangements were disclosed on pages 302 and 320 to
321, respectively, in the 2025 Annual Report and Accounts and pages 148 and 164 in the 2025 Form 20-F for the year ended 31
December 2025. There have been no material changes in these underlying arrangements.
At 30 June 2026, the total amount factored under customer factoring arrangements was £667 million (30 June 2025: £674
million). In addition, where the Group acts as a collection agent for the banks and other financial institutions, the cash collected
that has not yet been remitted amounted to £132 million (30 June 2025: £122 million).
Net cash from investing activities
Net cash from investing activities was an outflow of £300 million, a decline of £1,312 million from the same period last year when
it was an inflow of £1,012 million. The decline was largely due to:
the partial monetisation of our investment in ITC in 2025 (30 June 2026: £nil; 30 June 2025: £1,052 million); and
a lower net inflow of £10 million (compared to a net inflow of £14 million in the six months ended 30 June 2025) from short-term
investment products, including treasury bills.
Purchases of property, plant and equipment were higher than in 2025, at £134 million (30 June 2025: £103 million).
Included within investing activities is gross capital expenditure. This includes the investment in the Group’s global operational
infrastructure (including, but not limited to, the manufacturing network, trade marketing and IT systems). In 2026, the Group
invested £163 million, an increase of 16.4% on the prior year (30 June 2025: £140 million). The Group expects its gross capital
expenditure in 2026 to be approximately £750 million mainly related to the ongoing investment in the Group’s operational
infrastructure, including the expansion of our New Categories portfolio and enhancements to our Modern Oral capacity.
31
Screenshot-2022-09-15-at-17.21.45-(1).jpg
Notes to the Unaudited Interim Financial Statements (continued)
8. Cash Flow (continued)
Net cash used in financing activities
Net cash used in financing activities was an outflow of £4,663 million in 2026 (30 June 2025: £4,117 million outflow). The total
outflow includes:
The payment of the dividend of £2,634 million (30 June 2025: £2,609 million);
Interest paid in the period of £905 million (30 June 2025: £879 million), with the increase driven by the payment of interest in
respect of FII GLO (£67 million), partly offset by lower interest payments in line with a reduction in gross borrowing and a lower
average cost of debt of 4.9% (compared to 5.1% at 30 June 2025);
A net outflow from the issuance and repayment of borrowings in 2026 of £151 million (30 June 2025: £505 million net inflow);
An outflow of £39 million related to derivatives (30 June 2025: outflow of £445 million); and
An outflow of £649 million (30 June 2025: £450 million) in respect of the share buy-back programme.
9. Supplier Financing Arrangements
The Group has certain supplier financing arrangements or ‘reverse factoring’ arrangements in place. The principal purpose of
these arrangements is to provide the supplier with the option to access liquidity earlier through the sale of its receivables due
from the Group to a bank or other financial institution prior to their due date. Management has determined that the Group’s
payables to these suppliers have neither been extinguished nor have the liabilities been significantly modified by these
arrangements. The value of amounts payable, invoice due dates and other terms and conditions applicable, from the Group’s
perspective, remain unaltered, with only the ultimate payee being changed. Non-cash movements were immaterial. The cash
outflows in respect of these arrangements have been recognised within operating cash flows.
As at 30 June
As at 31 December
2026
2025
2025
£m
£m
£m
Supplier Financing Arrangements
Total
Amounts available for financing reported within trade payables
129
115
296
Amounts accepted by financial institutions for early financing
123
100
287
Amounts for which suppliers have received payment
90
80
274
Analysed as:
Leaf payables
Amounts available for financing reported within trade payables
3
188
Amounts accepted by financial institution for early financing
2
182
Amounts for which suppliers have received payment
2
180
Other payables
Amounts available for financing reported within trade payables
126
115
108
Amounts accepted by financial institution for early financing
121
100
105
Amounts for which suppliers have received payment
88
80
94
There has been no significant change in the supplier due dates that were disclosed in note 25 on page 321 in the Annual Report
and Accounts for the year ended 31 December 2025 and page 164 in the 2025 Form 20-F.
32
Screenshot-2022-09-15-at-17.21.45-(1).jpg
Notes to the Unaudited Interim Financial Statements (continued)
10. Liquidity
The Treasury function is responsible for raising finance for the Group, managing the Group’s cash resources and the financial
risks arising from underlying operations. All these activities are carried out under defined policies, procedures and limits, reviewed
and approved by the Board, delegating oversight to the Finance Director and Treasury function. The Group has targeted an
average centrally managed bond maturity of at least five years with no more than 20% of centrally managed debt maturing in a
single rolling 12-month period.
As at 30 June 2026, the average centrally managed debt maturity of bonds was 9.3 years (30 June 2025: 10.0 years; 31 December
2025: 9.5 years) and the highest proportion of centrally managed debt maturing in a single rolling 12-month period was 15.1% (30
June 2025: 15.3%; 31 December 2025: 15.1%).
The Group continues to maintain investment-grade credit ratings, with ratings from Moody’s, S&P and Fitch at Baa1 (stable
outlook), BBB+ (stable outlook) and A- (stable outlook), respectively. The strength of the ratings has underpinned debt issuance
and the Group is confident of its ability to continue to successfully access the debt capital markets. A credit rating is not a
recommendation to buy, sell or hold securities. A credit rating may be subject to withdrawal or revision at any time. Each rating
should be evaluated separately of any other rating.
In order to manage its interest rate risk, the Group maintains both floating and fixed rate debt. The Group sets targets (within
overall guidelines) for the desired ratio of floating to fixed rate debt on a net basis (at least 50% fixed on a net basis in the short to
medium term). At 30 June 2026, the relevant ratio of floating to fixed rate borrowings after the impact of derivatives was 25:75
(30 June 2025: 26:74; 31 December 2025: 24:76). Excluding cash and other liquid assets in Canada, which are subject to
restrictions associated with the Approved Plans in Canada, the ratio of floating to fixed rate borrowings was 20:80 (30 June 2025:
20:80; 31 December 2025: 14:86).
Available facilities
It is Group policy that short-term sources of funds (including drawings under both the US$4 billion U.S. commercial paper programme
and £3 billion euro commercial paper programme) are backed by undrawn committed lines of credit and cash. As at 30 June 2026,
commercial paper of £157 million was outstanding (30 June 2025: £700 million; 31 December 2025: £nil). Cash flows relating to
commercial paper issuances with maturity periods of three months or less are presented on a net basis in the Group’s cash flow
statement.
At 30 June 2026, the Group had access to a £5.0 billion revolving credit facility. This revolving credit facility was undrawn at 30
June 2026. In November 2025, the Group refinanced its existing £5.2 billion facility at the reduced amount of £5.0 billion
comprising (i) a £2.5 billion 364-day tranche with two one-year extension options and a one-year term-out option and (ii) a
£2.5 billion five-year tranche with two one-year extension options.
During the first six months of 2026, the Group refinanced or extended short-term bilateral facilities. These facilities totalled
£2.3 billion as at  30 June 2026, targeting to maintain £2.4 billion in the current financing cycle. As at 30 June 2026, £415 million
was drawn on a short-term basis with £1.9 billion undrawn and still available under such bilateral facilities. Cash flows relating to
bilateral facilities that have maturity periods of three months or less are presented on a net basis in the Group’s cash flow
statement.
In January 2025, the Group entered into a medium-term facility of £475 million (equivalent), which was fully drawn as at 30 June
2026.
Issuance, drawdowns and repayments in the period
In March 2026, the Group repaid a US$1.5 billion bond at maturity; and
In May 2026, the Group accessed the Euro market under its EMTN Programme, raising a total of 500 million.
33
Screenshot-2022-09-15-at-17.21.45-(1).jpg
Notes to the Unaudited Interim Financial Statements (continued)
11. Fair value measurements and valuation processes
The Group held certain financial instruments at fair value at 30 June 2026. The definitions and valuation techniques employed for
these as at 30 June 2026 are consistent with those used at 31 December 2025 and disclosed in Note 26 on pages 322 to 326 of
the Group’s Annual Report and Accounts for the year ended 31 December 2025 and pages 165 to 169 of the 2025 Form 20-F:
Level 1 financial instruments are traded in an active market and fair value is based on quoted prices at the period end.
Level 2 financial instruments are not traded in an active market, but the fair values are based on quoted market prices, broker/
dealer quotations, or alternative pricing sources with reasonable levels of price transparency. The Group’s level 2 financial
instruments include OTC derivatives.
The fair values of level 3 financial instruments have been determined using a valuation technique where at least one input
(which could have a significant effect on the instrument's valuation) is not based on observable market data. The Group’s level 3
financial instruments primarily consist of an equity investment in an unquoted entity, interest free loans and other treasury
products which are valued using the discounted cash flows of estimated future cash flows.
While the carrying values of assets and liabilities at fair value have changed since 31 December 2025, the Group does not
consider the movements in value to be significant, and the categorisation of these assets and liabilities in accordance with the
disclosure requirements of IFRS 7 Financial Instruments has not materially changed. The values of level 1 assets and level 3 assets
are £203 million and £75 million, respectively, at 30 June 2026 (30 June 2025: £1,069 million and £157 million, respectively, and 31
December 2025: £211 million and £138 million, respectively).
As disclosed in the Group's Annual Report and Accounts for the year ended 31 December 2025 and the 2025 Form 20-F, in the
second half of 2025, the Group sold part of its investment in ITC Hotels and liquidated a significant portion of assets held by its
Canadian business as part of exiting CCAA protection.
Level 2 assets and liabilities are shown below.
As at 30 June
As at 31 December
2026
2025
2025
£m
£m
£m
Assets at fair value
Derivatives relating to
– interest rate swaps
18
59
44
– cross-currency swaps
93
110
105
– forward foreign currency contracts
128
274
148
Assets at fair value
239
443
297
Liabilities at fair value
Derivatives relating to
– interest rate swaps
129
117
92
– cross-currency swaps
7
14
5
– forward foreign currency contracts
101
207
118
Liabilities at fair value
237
338
215
Borrowings are carried at amortised cost. The fair value of borrowings is estimated to be £33,503 million (30 June 2025:
£33,495 million; 31 December 2025: £33,717 million). The value of other assets and liabilities held at amortised cost are not
materially different from their fair values.
12. Retirement benefit schemes
The Group’s subsidiary undertakings operate various funded and unfunded defined benefit schemes, including pension and post-
retirement healthcare schemes, and defined contribution schemes in various jurisdictions, with its most significant
arrangements in both years being in the U.S., Canada, Germany, Switzerland and the Netherlands.
A buy-out process in respect of the British American Tobacco UK Pension Fund was concluded on 23 April 2026, when the
liabilities of the Fund were formally extinguished, resulting in the derecognition of £1,766 million of retirement benefit scheme
liabilities and an equivalent amount of scheme assets.
Benefits provided through defined contribution schemes are charged as an expense as payments fall due.
The liabilities arising in respect of defined benefit schemes are determined in accordance with the advice of independent,
professionally qualified actuaries, using the projected unit credit method. It is Group policy that all schemes are formally valued at
least every three years. The overall net asset for all pension and healthcare schemes in Group subsidiaries amounted to £132
million at 30 June 2026, compared to a net asset of £79 million at 31 December 2025 (30 June 2025: £72 million).
34
Screenshot-2022-09-15-at-17.21.45-(1).jpg
Notes to the Unaudited Interim Financial Statements (continued)
13. Contingent liabilities and financial commitments
The Group has contingent liabilities in respect of litigation, taxes and guarantees in various countries. These are described below,
are further described in Note 31 to the 2025 Annual Report and Accounts and the 2025 Form 20-F and will be included in the
2026 Annual Report and Accounts and the annual report for the year ended 31 December 2026 on Form 20-F (the "2026 Form
20-F").
The Group is subject to contingencies pursuant to requirements that it complies with relevant laws, regulations and standards.
Failure to comply could result in restrictions in operations, damages, fines, increased tax, increased cost of compliance, interest
charges, reputational damage or other sanctions. These matters are inherently difficult to quantify.
In cases where the Group has an obligation as a result of a past event existing at the balance sheet date, it is probable that an
outflow of economic resources will be required to settle the obligation and the amount of the obligation can be reliably estimated,
a provision will be recognised based on best estimates and management judgement. There are, however, contingent liabilities in
respect of litigation, taxes in some countries and guarantees for which no provisions have been made. While the amounts that
may be payable or receivable could be material to the results or cash flows of the Group in the period in which they are
recognised, the Board does not expect these amounts to have a material effect on the Group’s financial condition.
Taxes
The Group has exposures in respect of the payment or recovery of a number of taxes. The Group is and has been subject to a
number of tax audits covering, among others, excise tax, value-added taxes, sales taxes, corporate taxes, overseas withholding
taxes and payroll taxes. The estimated costs of known tax obligations have been provided in these accounts in accordance with
the Group’s accounting policies. In some countries, tax law requires that full or part payment of disputed tax assessments be
made pending resolution of the dispute. To the extent that such payments exceed the estimated obligation, they would not be
recognised as an expense.
There are disputes that are in or may proceed to litigation in a number of countries, including Brazil, the Netherlands, Indonesia
and Romania. 
In the Netherlands, the Group has agreed with the Dutch Tax Authorities to provide a bank guarantee from 1 July 2026 for an
initial amount of £105 million increasing annually over a five-year period up to £488 million, being the liability including interest
arising from the September 2025 Court of Appeal judgment (as discussed on page 351 of the 2025 Annual Report and Accounts
and page 189 of the 2025 Form 20-F).
In June 2026, British-American Tobacco (Romania) Investment S.R.L.’s appeal against the negative decision of the administrative
court in respect of the findings of the excise audit was stayed by the Ploiesti Court of Appeal until the final resolution of the legal
challenge against the underlying procedural excise framework.
Group litigation
Group companies, as well as other leading cigarette manufacturers, are defendants in a number of product liability cases. In a
number of the cases, the amounts of compensatory and punitive damages sought are significant. While it is impossible to be
certain of the outcome of any particular case or of the amount of any possible adverse verdict, the Group believes that the
defences of the Group’s companies to all these various claims are meritorious on both the law and the facts, and a vigorous
defence is being made everywhere. If an adverse judgment is entered against any of the Group’s companies in any case, avenues
of appeal will be pursued as necessary. Such appeals could require the appellants to post appeal bonds or substitute security in
amounts that could in some cases equal or exceed the amount of the judgment. At least in the aggregate, and despite the quality
of defences available to the Group, it is not impossible that the Group’s results of operations or cash flows in a particular
period could be materially affected by this and by the final outcome of any particular litigation.
Canada
Following the release of the March 2019 Quebec class action judgment and the commencement of provincial healthcare
recoupment actions and related tobacco litigation in Canada, JTI-MacDonald Corp, Imperial Tobacco Canada Limited (Imperial),
Imperial Tobacco Company Limited (together with Imperial, ITCAN) and Rothmans, Benson & Hedges Inc. each filed for creditor
protection under the Companies’ Creditors Arrangement Act (CCAA), resulting in court-ordered stays of all Canadian tobacco
litigation, including litigation against: (i) ITCAN, British American Tobacco p.l.c. (the Company), British American Tobacco
(Investments) Limited, B.A.T. Industries p.l.c. and Carreras Rothmans Limited; and (ii) R. J. Reynolds Tobacco Company (RJRT) and
R.J. Reynolds Tobacco International Inc. (which benefit from an indemnification by Japan Tobacco International (JTI) for all
liabilities and obligations arising in respect of the Canadian recoupment actions).
In March 2025, the Ontario Superior Court sanctioned comprehensive settlement plans, which were implemented in August
2025 and resolved all outstanding Canadian tobacco litigation against the defendants named above, providing full releases to the
relevant BAT Group companies in respect of historical tobacco-related claims in Canada. Under the settlement, participating
manufacturers are required to make ongoing payments over time based on a percentage (initially 85%, reducing over time to
70%) of net income after tax based on amounts generated from all sources, excluding New Categories, until they settle the
liability (CAD$32.5 billion (approximately £17.3 billion)) in full. The Group has recognised a provision reflecting management's best
estimate of ITCAN's obligations under the settlement arrangements. All underlying tobacco litigation is now closed.
Further information on the Canadian litigation is provided in Note 31 to the Group’s Annual Report and Accounts for the year
ended 31 December 2025, pages 342 to 344, and the 2025 Form 20-F, page 182.
35
Screenshot-2022-09-15-at-17.21.45-(1).jpg
Notes to the Unaudited Interim Financial Statements (continued)
13. Contingent liabilities and financial commitments (continued)
U.S. - Engle
As at 30 June 2026, the Group’s subsidiaries, RJRT, Lorillard Tobacco Company (Lorillard Tobacco) and Brown & Williamson
Holdings, Inc., had collectively been served in 21 pending Engle progeny cases filed on behalf of approximately 31 individual
plaintiffs. Many of these are in active discovery or nearing trial. In the first half of 2026, RJRT or Lorillard Tobacco paid judgments
in one Engle progeny case. Such payment amounted to approximately US$675,000 (approximately £499,537) in compensatory or
punitive damages. Additional costs were paid in respect of attorneys' fees and statutory interest.
In addition, from 1 January 2024 to 30 June 2026, outstanding jury verdicts in favour of the Engle progeny plaintiffs had been entered
against RJRT or Lorillard Tobacco for US$19.6 million (approximately £14.5 million) in compensatory damages (as adjusted) and
US$26.4 million (approximately £19.5 million) in punitive damages. A majority of these verdicts are in various stages in the appellate
process and have been bonded as required by Florida law under the US$200 million (approximately £148.0 million) bond cap passed
by the Florida legislature in 2009. Although the Group cannot currently predict when or how much it may be required to bond and
pay, the Group’s subsidiaries will likely be required to bond and pay additional judgments as the litigation proceeds.
Kalamazoo
Georgia-Pacific, a designated Potentially Responsible Party (PRP) in respect of the Kalamazoo River in Michigan, pursued NCR
Corporation in relation to remediation costs caused by PCBs released into that river. On 26 September 2013, the United States
District Court, Michigan held that NCR was liable as a PRP on the basis that it had arranged for the disposal of hazardous
material for the purposes of the Comprehensive Environmental Response, Compensation and Liability Act (CERCLA).
Following further litigation, on 11 December 2019, NCR announced that it had entered into a Consent Decree with the U.S.
Government and the State of Michigan (subsequently approved by the Michigan Court on 2 December 2020), pursuant to which
it assumed liability for certain remediation work at the Kalamazoo River. The payments to be made on the face of the Consent
Decree in respect of such work total approximately US$245 million (approximately £181.3 million). The Consent Decree also
provides for the payment by NCR of an outstanding judgment against it of approximately US$20 million (approximately
£14.8 million) to Georgia-Pacific.
The quantum of the clean-up costs for the Kalamazoo River is presently unclear. It seems likely to well exceed the amounts
payable on the face of the Consent Decree.
On 10 February 2023, NCR filed a complaint in the United States District Court for the Southern District of New York against
B.A.T. Industries P.L.C. (Industries), seeking a declaration that Industries must compensate NCR for 60% of costs NCR incurred
and incurs relating to the Kalamazoo River site on the asserted basis that the Kalamazoo River constitutes a ‘Future Site’ for the
purposes of a 1998 Settlement Agreement between it, Appvion and Industries. On 23 June 2023, Industries filed its defence and
counterclaims in the proceedings. On 2 October 2023, NCR filed a motion for declaratory judgment on its complaint and to strike
out Industries’ affirmative defences and counterclaims. Industries filed its reply to this motion.
On 14 September 2024, the court issued a judgment in respect of the motion, striking out one of Industries’ eight affirmative
defences and dismissing three of Industries’ five counterclaims against NCR's complaint. The proceedings are ongoing.
Nahadi Litigation
On 29 January 2026, a claim was filed in the U.S. District Court for the Eastern District of Virginia against the Company and
British-American Tobacco Marketing (Singapore) Private Limited (BATMS). The claimants are 196 U.S. nationals and family
members who claim unquantified civil damages under the U.S. Anti-Terrorism Act. The substance of the allegations relate to
matters previously disclosed in relation to historical business activities in the Democratic People’s Republic of Korea which
resulted in the Company’s April 2023 entry into a three-year deferred prosecution agreement (DPA) with the U.S. Department of
Justice (DOJ), with BATMS pleading guilty to the same charges, and a civil settlement agreement with the U.S. Department of the
Treasury’s Office of Foreign Assets Control (OFAC). At a hearing on 24 July 2026, the Court granted the defendants’ motion to
dismiss the claim, which the claimants have appealed.
UK Securities
On 26 June 2026, a claim issued in the High Court of England and Wales under Sections 90 and 90A of the UK’s Financial Services
and Markets Act 2000 was served on the Company. The claim relates to the previously disclosed investigations by the DOJ and
OFAC into the group’s historical business activities in the Democratic People’s Republic of Korea. The claim is brought by current
and former shareholders in the Company and names the Company as defendant. The claim alleges that the Company made untrue
or misleading statements in its published information and/or dishonestly omitted or delayed publication of certain information
regarding the group’s activities in the Democratic People’s Republic of Korea. The Company intends to vigorously defend the claim.
Investigations
On 25 April 2023, the Group announced that it had reached agreement with DOJ and OFAC to resolve previously disclosed
investigations into suspicions of breaches of sanctions relating to the Democratic People’s Republic of Korea between 2007 and
2017. On 11 May 2026, DOJ filed a motion to dismiss the legal proceedings against the Company, noting that the Company fully
complied with the terms of the three-year DPA, and the court entered an order dismissing the proceedings with prejudice the
same day. The three-year probationary period imposed by the court on a BAT subsidiary in Singapore, BATMS, in connection with
the subsidiary’s entry of a guilty plea in the same proceedings has also now expired. The Company’s compliance commitments
under the civil settlement with OFAC remain in place until 2028.
The Group investigates, and becomes aware of governmental authorities’ investigations into, allegations of misconduct, including
alleged breaches of sanctions and allegations of corruption, at Group companies. Some of these allegations are currently being
investigated, including by OFAC, which is investigating suspicions of breaches of sanctions. The Group cooperates with the
authorities, where appropriate.
There are instances where the Group investigates or where Group companies are cooperating with relevant national competition
authorities in relation to competition law investigations and/or engaged in legal proceedings at the appellate level, including
(amongst others) in Belgium and Brazil.
36
Screenshot-2022-09-15-at-17.21.45-(1).jpg
Notes to the Unaudited Interim Financial Statements (continued)
13. Contingent liabilities and financial commitments (continued)
Investigations (continued)
In addition, the Group is, and may in the future be, subject to investigations or legal proceedings in relation to, among other
things, its marketing, promotion or distribution activities in respect of its products. This includes, but is not limited to, allegations
that such activities, whether undertaken through traditional channels, digital platforms, third parties, or distribution applications,
do not comply with applicable laws or regulations. As such, the Group or Group companies, could be subject to liability and costs
associated with any damages, fines, or penalties brought in connection with these allegations.
Group litigation summary
Having regard to all these matters, with the exception of Canada and Fox River, the Group does not consider it appropriate to
make any provision or accrual in respect of any pending litigation or governmental investigation. The Group does not believe that
the ultimate outcome of any pending litigation or governmental investigation will significantly impair the Group’s financial
condition. If the facts and circumstances change, then there could be a material impact on the financial statements of the Group.
In addition, the Group accrues for damages, attorneys' fees and/or statutory interest, including in respect of certain Engle Progeny
cases and certain U.S. individual smoking and health cases.
Full details of any litigation and governmental investigation against Group companies and tax disputes as at 30 June 2026 will be
included in the Annual Report and Accounts for the year ended 31 December 2026 and the 2026 Form 20-F. Whilst there has
been some movement on new and existing cases against Group companies, there have been, except as otherwise stated, no
material developments to date in 2026 that would impact the financial position of the Group.
14. Franked investment income litigation order
The Group has been the principal test claimant in an action in the United Kingdom against HM Revenue and Customs (HMRC) in
the FII GLO. There were 11 corporate groups in the FII GLO as at 30 June 2026. The case concerned the treatment for UK
corporate tax purposes of profits earned overseas and distributed to the UK.
Following a number of hearings (on limitation and computation) by the High Court, Court of Appeal and Supreme Court in the UK
and the European Court of Justice over a number of years, which reduced the value of the Group’s claim to approximately
£0.3 billion, mainly as the result of the application of simple interest, in January 2026 the Supreme Court refused HMRC
permission to appeal the Court of Appeal's judgment on limitation. In February 2026, the Supreme Court decided to grant
permission to appeal on the computational issue on another test case. However, the Group considers that the computational
issue should not impact BAT’s claim and considers that the litigation has now reached its conclusion.
During 2015, HMRC paid to the Group a gross amount of £1.2 billion in two separate payments, less a deduction (withheld by
HMRC) of £0.3 billion. The payments made by HMRC were made without any admission of liability and were subject to refund if
HMRC succeeded on appeal. Due to the uncertainty of the amounts and eventual outcome the Group did not recognise any
impact in the income statement in prior periods in respect of the receipt (being net £0.9 billion) which was held within trade and
other payables. The Group made interim payments to HMRC of £479 million in 2025 and annual payments of £50 million in each
of 2024, 2023 and 2022. In 2026, the Group will repay £222 million (of which £111 million was paid in the first six months of 2026).
A final payment of £43 million will be paid in 2027.
However, as the Group considers that, following the judgment by the Supreme Court in the UK, the litigation has now reached its
conclusion, an adjusting tax credit of £95 million and an adjusting credit to net finance costs of £315 million has been recognised
in the six months ended 30 June 2026.
With respect to the remaining amounts repayable to HMRC, in the six months ended 30 June 2026, the Group recognised an
adjusting interest charge of £0.3 million (30 June 2025: £19 million).
Information for FII GLO for 2025 was disclosed on pages 278 and 279 of the Annual Report and Accounts for the year ended 31
December 2025 and page 126 of the 2025 Form 20-F.
15. Related party disclosures
The Group’s related party transactions and relationships for 2025 were disclosed on pages 332 and 333 of the Annual Report and
Accounts for the year ended 31 December 2025 and pages 173 to 175 of the 2025 Form 20-F. In addition, information on
Charlotte's Web was disclosed on page 293 of the Annual Report and Accounts for the year ended 31 December 2025 and page
140 of the 2025 Form 20-F.
In the six months ended 30 June 2026, apart from the disposal of Brascuba (as disclosed on page 328 of the Annual Report and
Accounts for the year ended 31 December 2025 and page 170 of the 2025 Form 20-F, and page 26 of this Half Year Report), the
sale of Sanity to Organigram (discussed on page 27) and the investment in and collaboration with Organigram and the
conversion of the Group’s loan to Charlotte’s Web Holdings into ordinary shares (see page 27), there were no material changes in
related parties or related party transactions to be reported.
In the six months ended 30 June 2025, apart from the partial sale of the Group's investment in ITC, the demerger of ITC's hotel
business (see page 27) and the investment in and collaboration with Organigram, there were no material changes in related
parties or related party transactions to be reported.
37
Screenshot-2022-09-15-at-17.21.45-(1).jpg
Other Information
Summarised financial information
The following summarised financial information is required by the rules of the Securities and Exchange Commission and has been
prepared in accordance with Section 3-10 of Regulation S-X in respect of the guarantees of:
US$6.89 billion of outstanding bonds issued by B.A.T Capital Corporation (BATCAP) in connection with the acquisition of
Reynolds American, including registered bonds issued in exchange for the initially issued bonds (the 2017 Bonds);
US$10.12 billion of outstanding bonds issued by BATCAP pursuant to the Shelf Registration Statement on Form F-3 filed on 17
July 2019, US$8.80 billion of outstanding bonds issued by BATCAP pursuant to the Shelf Registration Statement on Form F-3
filed on 1 July 2022 and US$750 million of outstanding bonds issued by BATCAP pursuant to the Shelf Registration Statement
on Form F-3 filed on 1 July 2025 pursuant to which BATCAP, BATIF or the Company may issue an indefinite amount of debt
securities; and
US$1.00 billion of outstanding bonds issued by BATIF pursuant to the Shelf Registration Statement on Form F-3 filed on 17 July
2019, and US$1.00 billion of outstanding bonds issued by BATIF pursuant to the Shelf Registration Statement on Form F-3 filed
on 1 July 2022 pursuant to which BATCAP, BATIF or the Company may issue an indefinite amount of debt securities.
As of 28 July 2020, all relevant Group entities suspended their reporting obligations with respect to the US$4.65 billion (30 June
2025 and 31 December 2025: US$4.65 billion) of RAI unsecured notes and US$22.12 million (30 June 2025 and 31 December 2025:
US$22.12 million) of Lorillard unsecured notes. As such, no summarised financial information is provided with respect to these
securities.
The SEC Shelf registration was renewed in July 2025 and is valid for three years.
As described below, Reynolds American Inc. (Reynolds American/RAI) is a subsidiary guarantor of all outstanding series of
BATCAP and BATIF bonds. Under the terms of the indentures governing such notes, any subsidiary guarantor (including Reynolds
American) other than BATCAP or BATIF, as applicable, BATNF and BATHTN (as defined below), will automatically and
unconditionally be released from all obligations under its guarantee, and such guarantee shall thereupon terminate and be
discharged and of no further force or effect, in the event that (1) its guarantee of all then outstanding notes issued under the
Group’s EMTN Programme is released or (2) at substantially the same time its guarantee of the debt securities is terminated,
such subsidiary guarantor is released from all obligations in respect of indebtedness for borrowed money for which such
subsidiary guarantor is an obligor (as a guarantor or borrower). Under the EMTN Programme, Reynolds American’s guarantee is
released if at any time the aggregate amount of indebtedness for borrowed money, subject to certain exceptions, for which
Reynolds American is an obligor, does not exceed 10% of the outstanding long-term debt of BAT as reflected in the balance sheet
included in BAT's most recent publicly released interim or annual consolidated financial statements.
Reynolds American’s guarantee may be released notwithstanding Reynolds American guaranteeing other indebtedness,
provided Reynolds American’s guarantee of outstanding notes issued under the EMTN Programme is released. If Reynolds
American’s guarantee is released, BAT is not required to replace such guarantee, and the debt securities will have the benefit of
fewer subsidiary guarantees for the remaining maturity of the debt securities.
Note: The following summarised financial information reports the unconsolidated contribution of each applicable company to the
Group’s consolidated results and not the separate financial statements for each applicable company as local financial
statements are prepared in accordance with local legislative requirements and may differ from the financial information provided
below. In particular, in respect of the United States region, all financial statements and financial information provided by or with
respect to the U.S. business or RAI (and/or RAI and its subsidiaries (collectively, the Reynolds Group)) are prepared on the basis of
U.S. GAAP and constitute the primary financial statements or financial information of the U.S. business or RAI (and/or the
Reynolds Group). Solely for the purpose of consolidation within the results of BAT p.l.c. and the BAT Group, this financial
information is then converted to IFRS. To the extent any such financial information provided in these financial statements relates
to the U.S. business or RAI (and/or the Reynolds Group), it is provided as an explanation of the U.S. business’s or RAI’s (and/or the
Reynolds Group’s) primary U.S. GAAP-based financial statements and information.
38
Screenshot-2022-09-15-at-17.21.45-(1).jpg
Other Information (continued)
Summarised financial information (continued)
The subsidiaries disclosed below are wholly-owned and the guarantees provided are full and unconditional, and joint and several:
a.British American Tobacco p.l.c. (as the parent guarantor), referred to as ‘BAT p.l.c.’ in the financials below;
b.B.A.T Capital Corporation (as an issuer or a subsidiary guarantor, as the case may be), referred to as ‘BATCAP’ in the financials
below;
c.B.A.T. International Finance p.l.c. (as an issuer or a subsidiary guarantor, as the case may be), referred to as ‘BATIF’ in the
financials below;
d.B.A.T. Netherlands Finance B.V. (as a subsidiary guarantor), referred to as ‘BATNF’ in the financials below;
e.Reynolds American Inc. (as a subsidiary guarantor), referred to as ‘RAI’ in the financials below; and
f.British American Tobacco Holdings (The Netherlands) B.V. (as a subsidiary guarantor of the 2017 Bonds only), referred to as
‘BATHTN’ in the financials below.
In accordance with Section 13-01 of Regulation S-X, information in respect of investments in subsidiaries that are not issuers or
guarantors has been excluded from non-current assets as shown in the balance sheet table below. The ‘BATHTN’ column in the
summarised financial information is only applicable in the context of the 2017 Bonds. British American Tobacco Holdings (The
Netherlands) B.V. (‘BATHTN’) is not an issuer nor a guarantor of any of the other securities referenced in this note. None of the
issuers or other guarantors has material balances with or an investment in BATHTN. Investments in subsidiaries represent share
capital acquired in relation to or issued by subsidiary undertakings.
In the case of debt securities that may be issued by BAT p.l.c., BATCAP or BATIF under an indenture to be entered into (the ‘2022
Indenture’) and referred to in the registration statement in Form F-3 (Registration No. 333-288488), one or more of BATCAP,
BATIF, BATNF and RAI may guarantee such debt securities to the extent specified in the applicable supplemental indenture to
the 2022 Indenture. In addition, BAT p.l.c. will be a parent guarantor in respect of any debt securities issued by BATCAP or BATIF
under the 2022 Indenture.
Six months ended 30 June 2026
BAT p.l.c.
BATCAP
BATIF
BATNF
RAI
BATHTN
£m
£m
£m
£m
£m
£m
Income Statement
Revenue
(Loss)/profit from operations
(5)
3
Dividend income
3,777
Net finance income/(costs)
247
(7)
(29)
(274)
(5)
Profit/(loss) before taxation
242
(7)
(29)
3,506
(5)
Taxation on ordinary activities
(22)
3
62
1
Profit/(loss) for the period
220
(7)
(26)
3,568
(4)
Intercompany transactions - Income Statement
Transactions with non-issuer/non-guarantor subsidiaries (expense)/income
(5)
14
Transactions with non-issuer/non-guarantor subsidiaries net finance income
160
403
184
10
Dividend income from non-issuer/non-guarantor subsidiaries
3,777
Six months ended 30 June 2025
BAT p.l.c.
BATCAP
BATIF
BATNF
RAI
BATHTN
£m
£m
£m
£m
£m
£m
Income Statement
Revenue
(Loss)/profit from operations
(11)
(1)
3
2
Dividend income
1
3,441
Net finance income/(costs)
249
(22)
128
(289)
(2)
Profit/(loss) before taxation
238
(23)
132
3,152
Taxation on ordinary activities
6
2
67
1
Profit/(loss) for the period
238
(17)
134
3,219
1
Intercompany transactions - Income Statement
Transactions with non-issuer/non-guarantor subsidiaries (expense)/income
(12)
17
Transactions with non-issuer/non-guarantor subsidiaries net finance income
170
394
442
11
Dividend income from non-issuer/non-guarantor subsidiaries
3,441
39
Screenshot-2022-09-15-at-17.21.45-(1).jpg
Other Information (continued)
Summarised financial information (continued)
As at 30 June 2026
BAT p.l.c.
BATCAP
BATIF
BATNF
RAI
BATHTN
£m
£m
£m
£m
£m
£m
Balance Sheet
Non-current assets
2,126
20,530
1,145
1,417
11
1
Current assets
7,956
25,584
48,944
20
1,181
7
Non-current liabilities
18,896
9,856
1,417
8,613
4
Non-current borrowings
18,790
9,680
1,417
8,569
Other non-current liabilities
106
176
44
4
Current liabilities
1,656
27,206
36,060
19
1,734
283
Current borrowings
1,601
27,158
35,875
19
315
Other current liabilities
55
48
185
1,419
283
Intercompany transactions - Balance Sheet
Amounts due from non-issuer/non-guarantor subsidiaries
7,856
15,355
52,099
1,153
11
Amounts due to non-issuer/non-guarantor subsidiaries
2
2,037
37,392
1
3
Investment in subsidiaries (that are not issuers or guarantors)
27,234
718
24,212
1,528
As at 31 December 2025
BAT p.l.c.
BATCAP
BATIF
BATNF
RAI
BATHTN
£m
£m
£m
£m
£m
£m
Balance Sheet
Non-current assets
1,076
19,255
2,184
1,436
12
1
Current assets
12,062
23,153
47,989
50
1,364
7
Non-current liabilities
1,575
18,908
9,469
1,436
8,618
3
Non-current borrowings
1,571
18,813
9,295
1,436
8,572
Other non-current liabilities
4
95
174
46
3
Current liabilities
65
23,502
36,502
49
1,647
283
Current borrowings
32
23,471
36,261
49
195
1
Other current liabilities
33
31
241
1,452
282
Intercompany transactions - Balance Sheet
Amounts due from non-issuer/non-guarantor subsidiaries
11,175
13,946
51,965
1,342
8
Amounts due to non-issuer/non-guarantor subsidiaries
2
2,728
36,622
1
1
Investment in subsidiaries (that are not issuers or guarantors)
27,234
718
23,892
1,549
In 2021, BAT p.l.c. issued two series of perpetual hybrid bonds, each in an aggregate principal amount of €1 billion. During 2025,
the Group repurchased an aggregate principal amount of €1 billion of perpetual hybrid bonds and issued a further €1.2 billion
aggregate principal amount of perpetual hybrid bonds. The perpetual hybrid bonds have been classified as equity as there is no
contractual obligation to either repay the principal or make payments of interest. Further information on perpetual hybrid bonds
is described in Note 22 on page 314 of the Annual Report and Accounts for the year ended 31 December 2025 and page 158 of the
2025 Form 20-F. BAT p.l.c.’s unconsolidated contribution to the Group’s consolidated equity results is shown below:
As at 30 June
As at 31 December
2026
2025
2025
£m
£m
£m
Total Equity
35,659
34,433
38,732
Share capital
573
581
577
Share premium
126
123
123
Perpetual hybrid bonds
1,893
1,685
1,893
Other Equity
33,067
32,044
36,139
40
Screenshot-2022-09-15-at-17.21.45-(1).jpg
Other Information (continued)
Non-financial Key Performance Indicators (KPIs)
Volume
The Group reports volumes as additional information. This is done, where appropriate, with cigarette sticks as the basis, with
usage levels applied to other products to calculate the equivalent number of cigarette units. Volume is defined as the number of
units sold. Units may vary between categories.
The conversion rates that are applied:
Equivalent to one cigarette
Factory-made cigarettes (FMC)
1 stick
Heated sticks
1 heat stick
Cigars
1 cigar (regardless of size)
Oral
– Pouch
1 pouch
– Moist Snuff
2.8 grams
– Dry Snuff
2.0 grams
– Loose leaf, plug, twist
7.1 grams
Pipe tobacco
0.8 grams
Roll-your-own
0.8 grams
Make-your-own
– Expanded tobacco
0.5 grams
– Optimised tobacco
0.7 grams
Vapour
No conversion to a stick equivalent
Roll-your-own (RYO)
Loose tobacco designed for hand rolling, normally a finer cut with higher moisture, compared to cigarette tobacco.
Make-your-own (MYO)
MYO expanded tobacco; also known as volume tobacco.
Loose cigarette tobacco with enhanced filling properties – to allow higher yields of cigarettes/kg - designed for use with cigarette
tubes and filled via a tobacco tubing machine.
MYO non-expanded tobacco; also known as optimised tobacco
Loose cigarette tobacco designed for use with cigarette tubes and filled via a tobacco tubing machine.
Vapour
Vapour is shown in units being pods, bottles and disposable units. There is no conversion to a stick equivalent.
Volume share
Volume share is the estimated number of units bought by adult consumers of a specific brand or combination of brands, as a
proportion of the total estimated units bought by adult consumers in the industry, category or other sub-category. Sub-
categories include, but are not limited to, HP, Modern Oral, Traditional Oral, Total Oral or Cigarettes. Except when referencing
particular markets, volume share is based on our Top markets. Top markets are those markets that management determines are
strategic in each category, with reliable share data from third parties. Management notes that the markets that form the
definition of Top markets may change between periods as this will reflect the development of the category within markets
including their relative revenue sizes. Please refer to page 46 for a list of the Top markets.
Where possible, the Group utilises data provided by third-party organisations, including NielsenIQ, based upon retail audit of
sales to adult consumers. In certain markets, where such data is not available, other measures are employed which assess
volume share based upon other movements within the supply chain, such as sales to retailers. This may depend on the provision
of data by customers including distributors/wholesalers.
Volume share is used by management to assess the relative performance of the Group and its brands against the performance
of its competitors in the categories and geographies in which the Group operates. Management notes that this measure is useful
to investors to understand the relative performance of the Group and its brands against the performance of its competitors in
the categories and geographies in which the Group operates. This measure is also useful to understand the Group’s performance
when seeking to grow scale within a market or category from which future financial returns can be realised. Volume share
provides an indicator of the Group’s relative performance in unit terms versus competitors.
Volume share in each period compares the average volume share in the period with the average volume share in the prior year
(using the current period Top markets). This is a more robust measure of performance, removing short-term volatility that may
arise at a point in time. Due to the timing of available information, volume share for 2026 is year-to-date May 2026 unless
otherwise stated.
However, in certain circumstances, related to periods of introduction to a market, in order to illustrate the latest performance,
data may be provided as at the end of the period rather than the average in that period. In these instances, the Group states
these at a specific date (for instance, May 2026).
41
Screenshot-2022-09-15-at-17.21.45-(1).jpg
Other Information (continued)
Non-financial Key Performance Indicators (KPIs) (continued)
Value share
Value share is the estimated retail value of units bought by adult consumers of a particular brand or combination of brands, as a
proportion of the total estimated retail value of units bought by adult consumers in the industry, category or other sub-category
in discussion. Except when referencing particular markets, value share is based on our Top markets. Top markets are those
markets that management determines are strategic in each category, with reliable share data from third parties. Management
notes that the markets that form the definition of Top markets may change between periods as this will reflect the development
of the category within markets including their relative revenue sizes. Please refer to page 46 for a list of the Top markets.
Where possible, the Group utilises data provided by third-party organisations, including NielsenIQ, based upon retail audit of
sales to adult consumers. In certain markets, where such data is not available, other measures are employed which assess value
share based upon other movements within the supply chain, such as sales to retailers. This may depend on the provision of data
by customers (including distributors and wholesalers).
Value share is used by management to assess the relative performance of the Group and its brands against the performance of
its competitors in the categories and geographies in which the Group operates, specifically indicating the Group’s ability to
realise value relative to the market. The measure is particularly useful when the Group’s products and/or the relevant category in
the market in which they are sold has developed or achieved scale from which value can be realised. Management notes that this
measure is useful to investors to comprehend the relative performance of the Group and its brands against the performance of
its competitors in the categories and geographies in which the Group operates, specifically indicating the Group’s ability to
realise value relative to the market.
Value share in each period compares the average value share in the period with the average value share in the prior year (using
the current period Top markets). This is a more robust measure of performance, removing short-term volatility that may arise at
a point in time. Due to the timing of available information, value share for 2026 is year-to-date May 2026 unless otherwise stated.
However, in certain circumstances, related to periods of introduction to a market, in order to illustrate the latest performance,
data may be provided as at the end of the period rather than the average in that period. In these instances the Group states these
at a specific date (for instance, May 2026).
Price/mix
Price/mix is a term used by management and users of the financial statements to explain the movement in revenue between
periods. Revenue is affected by the volume (how many units are sold) and the value (how much is each unit sold for). Price/mix is
used to explain the value component of the sales as the Group sells each unit for a value (price) but may also achieve a movement
in revenue due to the relative proportions of higher value volume sold compared to lower value volume sold (mix).
This term is used to explain the Group’s relative performance between periods only. It is calculated as the difference between the
movement in revenue (between periods at constant rates of exchange) and volume (between periods). For instance, in the six
months to June 2026 (compared to the same period in the prior year) the increase in combustibles revenue (excluding
translational foreign exchange movements) of 2.1%, with a decline in combustibles volume of 4.7%, leads to a price/mix (including
excise duty drawback) of 6.8%. No assumptions underlie this metric as it utilises the Group’s own data.
We also show (see page 3) the impact on revenue from the movement in combustibles volume (being the movement in volume
between periods multiplied by the average combustibles revenue per thousand from the prior period) and the impact from the
combustibles price/mix effect (see page 3), which is revenue (from combustibles at constant rates) less the volume effect from
the movement in combustibles.
Consumers of Smokeless products
The number of consumers of Smokeless products is defined as the estimated number of Legal Age (minimum 18 years)
consumers of the Group’s Smokeless products - which does not necessarily mean these users are solus consumers of these
products. In markets where regular consumer tracking is in place, this estimate is obtained from adult consumer tracking studies
conducted by third parties (including Kantar). In markets where regular consumer tracking is not in place, the number of
consumers of Smokeless products is derived from volume sales of consumables and devices in such markets, using consumption
patterns obtained from other similar markets with adult consumer tracking (utilising studies conducted by third parties, including
Kantar). The number of consumers is adjusted for those identified (as part of the consumer tracking studies undertaken) as using
more than one BAT Brand – referred to as “poly users”.
The number of Smokeless products consumers is used by management to assess the number of consumers using the Group’s
New Categories products as the increase in Smokeless products is a key pillar of the Group’s sustainability ambition and is
integral to the sustainability of our business.
The Group’s Management Board believes that this measure is useful to investors given the Group’s sustainability ambition and
alignment to the sustainability of the business with respect to the Smokeless portfolio.
Periodically, in line with standard practice, enhancements to the adult consumer tracking studies may be required to more
accurately capture market trends across categories and as markets perform with respect to the development of the categories.
When a change is applied, to ensure that the data is comparable between periods, historical data will be back-trended to ensure
there is no trend break.
During 2026, Kantar made enhancements to their adult consumer tracking studies in a number of markets in Europe and back-
trended the data accordingly. However, in aggregate, there was no change to the previously reported totals provided below.
2025
2024
As previously reported
34.1
29.4
42
Screenshot-2022-09-15-at-17.21.45-(1).jpg
Other Information (continued)
Dividends
On 12 February 2026, the Board declared an interim dividend of 245.04p per ordinary share of 25p, for the year ended 31
December 2025, payable in four equal quarterly instalments of 61.26p per ordinary share in May 2026, August 2026, November
2026 and February 2027. The May 2026 quarterly dividend was paid to shareholders on the UK main register and South Africa
branch register on 7 May 2026 and to holders of American Depositary Shares (ADSs) on 12 May 2026. The three remaining
quarterly dividends will be paid to shareholders on the applicable record dates set out below.
Under IFRS, the interim dividend is recognised in the period that it is paid. The results for the six months ended 30 June 2026
reflect the fourth quarterly dividend of 60.06p per ordinary share declared on 13 February 2025 and paid in February 2026, and
the first quarterly dividend of 61.26p per ordinary share declared on 12 February 2026 and paid in May 2026.
Dividends paid
For the six months to 30 June 2026
Pence per share 
US$ per ADS 
Quarterly Payment paid February 2026
60.06
0.8233620
Quarterly Payment paid May 2026
61.26
0.8340240
121.32
1.6573860
Holders of ADSs on the New York Stock (NYSE) and South Africa Branch register
For holders of NYSE-listed ADSs, the record dates and payment dates are set out below. The equivalent quarterly dividends in US
dollars are determined by the exchange rate on the applicable payment date. Citibank, N.A. as depositary bank for the BAT
American Depositary Receipt Programme charges US$0.01 per ADS for each quarterly dividend payment.
In accordance with the JSE Limited (JSE) Listing Requirements, the finalisation information relating to shareholders on the South
Africa branch register will be published on the dates below, with South Africa dividends tax information. For South Africa
dividends tax purposes, the quarterly dividends are considered ‘foreign dividends’. The United Kingdom is identified as the source
of income for tax purposes.
Key dividend dates
In accordance with London Stock Exchange (LSE), the NYSE and Strate requirements, the following dates for the quarterly
dividends payments apply.
Event
Payment No. 2
Payment No. 3
Payment No. 4
Preliminary announcement (includes declaration data required
for JSE purposes)
12 February
Publication of finalisation information (JSE)
30 June
21 September
14 December
No removal requests permitted (in either direction) between
the UK main register and the South Africa branch register
30 June - 10 July
21 September-
2 October
14-29 December
Last Day to Trade (LDT) cum-dividend (JSE)
7 July
29 September
23 December
Shares commence trading ex-dividend (JSE)
8 July
30 September
24 December
No transfers permitted between the UK main register and the
South Africa branch register
8-10 July
30 September -
2 October
24-30 December
No shares may be dematerialised or rematerialised on the
South Africa branch register
8-10 July
30 September -
2 October
24-30 December
Shares commence trading ex-dividend (LSE)
9 July
1 October
24 December
Shares commence trading ex-dividend (NYSE)
10 July
2 October
29 December
Record date (JSE, LSE and NYSE)
10 July
2 October
29 December
Last date for receipt of Dividend Reinvestment Plan (DRIP)
elections (LSE)
24 July
16 October
13 January 2027
Payment date (LSE and JSE)
14 August
6 November
3 February 2027
ADS payment date (NYSE)
19 August
12 November
8 February 2027
Notes:
1.All dates are 2026, unless otherwise stated.
2.The dates set out above may be subject to any changes to public holidays arising and changes or revisions to the LSE, JSE and NYSE timetables. Any confirmed changes to the dates will
be announced.
3.JSE finalisation information published on 30 June 2026 can be found on the BAT website, www.bat.com.
Proposed dates for quarterly dividend payments for the year ending 31 December 2026
Event
Payment No. 1
Payment No. 2
Payment No. 3
Payment No. 4
Last Day to Trade (LDT) cum-dividend (JSE)
30 March
29 June
28 September
13 December
Shares commence trading ex-dividend (JSE)
31 March
30 June
29 September
14 December
Shares commence trading ex-dividend (LSE)
1 April
1 July
30 September
16 December
Shares commence trading ex-dividend (NYSE)
2 April
2 July
1 October
17 December
Record date (JSE, LSE and NYSE)
2 April
2 July
1 October
17 December
Payment date (LSE and JSE)
7 May
6 August
5 November
2 February 2028
ADS payment date (NYSE)
12 May
11 August
10 November
7 February 2028
Notes:
1.All dates are 2027, unless otherwise stated.
2.A complete timetable for the quarterly dividend payments for the year ending 31 December 2026 and the declared amount will be included in the Preliminary Results Announcement in
February 2027.
3.The dates set out above may be subject to any changes to public holidays arising and changes or revisions to the LSE, JSE and NYSE timetables. Any confirmed changes to the dates will
be announced.
43
Screenshot-2022-09-15-at-17.21.45-(1).jpg
Other Information (continued)
Shareholder Information
Financial calendar
Event
Pre-close Trading Update
December 2026
Preliminary Statement 2026
11 February 2027
Additional information
British American Tobacco is one of the world's leading consumer products businesses, with brands sold across the world. We
have strategic combustibles and HP brands – including Dunhill, Kent, Lucky Strike, Pall Mall, Rothmans, glo, veo, Newport (in the
U.S.), Camel (in the U.S.) and Natural American Spirit (in the U.S.) – and a growing portfolio of reduced-risk products*†. We hold
robust market positions in each of our regions and have leadership positions in more than 50 markets.
References in this document to information on websites, including the web address of BAT, have been included as inactive
textual references only. These websites and the information contained therein or connected thereto are not intended to be
incorporated into or to form part of this report.
*Based on the weight of evidence and assuming a complete switch from cigarette smoking. These products are not risk free and are addictive.
Products sold in the U.S., including Vuse, Velo, Grizzly, Kodiak, and Camel Snus, are subject to FDA regulation and no reduced-risk claims will be made as to these products without
agency clearance.
Publication of Half-Year Report
This Half-Year Report is released or otherwise made available or notified to the London Stock Exchange, the JSE Limited and the
New York Stock Exchange and filed in accordance with applicable regulations. It may be viewed and downloaded from our
website www.bat.com.
Copies of the announcement may also be obtained by contacting: (1) the Company’s registered office; (2) the Company’s
representative office in South Africa; (3) British American Tobacco Publications; or (4) Citibank Shareholder Services. Contact
details are set out on page 45.
Annual Report: Statutory accounts
The information contained within this report for the year ended 31 December 2025 does not constitute statutory accounts as
defined in Section 434 of the Companies Act 2006. A copy of the statutory accounts for the year 2025 has been delivered to the
Registrar of Companies.
44
Screenshot-2022-09-15-at-17.21.45-(1).jpg
Other Information (continued)
Forward-looking statements and other matters
This announcement contains certain forward-looking statements, including "forward-looking" statements made within the meaning of the U.S. Private Securities
Litigation Reform Act of 1995.
In particular, these forward-looking statements include, among other statements, statements regarding the Group's future financial performance, planned
product launches and future regulatory developments and business objectives (including with respect to sustainability and other environmental, social and
governance matters), as well as: (i) certain statements in the Half-Year Summary (page 1); (ii) the statements under Full-Year 2026 Guidance (page 2); (iii) certain
statements in the Group Operating Review (pages 3 to 4), the Regional Review (pages 5 to 7) and the Category Performance Review (pages 8 to 9) sections with
respect to the Group’s expectations of New Categories performance and a continuing roll-out of innovations (including glo Hilo and glo Hyper Pro+), new products
(including Velo Max and Vuse Ultra) and adult-focused flavours (particularly in the U.S.) in the second half of the financial year ending 31 December 2026; (iv)
certain statements in the Other Financial Information section (pages 10 to 12), including the Group's commitment to a progressive dividend based upon 65% of
long-term sustainable earnings and second-half weighted cash flow and its continuing confidence in its ability to access the debt capital markets successfully; (v)
certain statements in the Other Information section (pages 12 to 14) regarding the Group’s going concern assessment and the generation of annualised cost
efficiencies and cash flow; (vi) the statement in the Other Information section (page 13) and in the Notes to the Unaudited Interim Financial Statements section
(page 25) referring to one-off costs of approximately £950 million to be incurred between 2025 and 2027; and (vii) statements in the Notes to the Unaudited
Interim Financial Statements section (pages 23 to 36) referring to the expected gross capital expenditure of £750 million in 2026, the Group's expectation that
payments in respect of its estimated share of the future liability under the Approved Plans will continue for at least 40 years, the Group’s target of an average
centrally managed bond maturity of at least five years with no more than 20% of centrally managed debt maturing in a single rolling 12-month period, the Group’s
expectations and underlying assumptions with respect to contingent liabilities, its repayment schedule under the Franked investment income litigation order and
the payment of dividends.
These statements are often, but not always, made through the use of words or phrases such as "believe," "anticipate," "could," "may," "would," "should," "intend,"
"plan," "potential," "predict," "will," "expect," "estimate," "project," "positioned," "strategy," "outlook," "target," "being confident" and similar expressions. These include
statements regarding our intentions, beliefs or current expectations concerning, amongst other things, our results of operations, financial condition, liquidity,
prospects, growth, strategies and the economic and business circumstances occurring from time to time in the countries and markets in which the British
American Tobacco Group (the “Group”) operates.
All such forward-looking statements involve estimates and assumptions that are subject to risks, uncertainties and other factors. It is believed that the
expectations reflected in this announcement are reasonable, but they may be affected by a wide range of variables that could cause actual results and
performance to differ materially from those currently anticipated. Among the key factors that could cause actual results to differ materially from those projected
in the forward-looking statements are uncertainties related to the following: the impact of increased competition from illicit trade and illegal products; changes or
differences in domestic or international economic or political conditions; the impact of adverse domestic or international legislation and regulation of tobacco,
New Categories and other regulation; the impact of supply chain disruptions; adverse litigation and external investigations and dispute outcomes and the effect of
such outcomes on the Group’s financial condition; the impact of significant increases or structural changes in tobacco, nicotine and New Categories related taxes;
the inability to develop, commercialise and deliver the Group’s New Categories strategy; adverse decisions by domestic or international regulatory bodies,
including disputed taxes, interest and penalties; the impact of serious injury, illness or death in the workplace and those who work with the business; the ability to
maintain credit ratings and to fund the business under the current capital structure; translational and transactional foreign exchange rate exposure; direct and
indirect adverse impacts associated with climate change (both physical and transition); the ability to deliver a viable circular business model in response to global
demand, combined with increasing regulatory, stakeholder and consumer pressure; and the Group’s ability to defend against Cyber & Digital actions that result in
loss of confidentiality, availability or integrity of systems and data.
A review of the reasons why actual results and developments may differ materially from the expectations disclosed or implied within forward-looking statements
can be found by referring to the information contained under the headings “Cautionary statement” and "Group Principal Risks" in the Group's 2025 Annual Report
and Accounts and "Forward looking statements" and "Item 3.D - Risk factors" in the 2025 Form 20-F. Additional information concerning these and other factors
can be found in BAT's filings with the U.S. Securities and Exchange Commission (SEC), including the Annual Report on Form 20-F and Current Reports on Form 6-
K, which may be obtained free of charge at the SEC's website, www.sec.gov, and the BAT website, www.bat.com.
No statement in this announcement is intended to be a profit forecast and no statement in this communication should be interpreted to mean that earnings per
share of BAT for the current or future financial years would necessarily match or exceed the historical published earnings per share of BAT. Past performance is no
guide to future performance and persons needing advice should consult an independent financial adviser. The forward-looking statements reflect knowledge and
information available at the date of preparation of this announcement and the Group undertakes no obligation to update or revise these forward-looking
statements, whether as a result of new information, future events or otherwise. Readers are cautioned not to place undue reliance on such forward-looking
statements.
All financial statements and financial information provided by or with respect to the U.S. or Reynolds American are initially prepared on the basis of U.S. GAAP and
constitute the primary financial statements or financial records of the U.S./Reynolds American. This financial information is then converted to International
Financial Reporting Standards as issued by the IASB and as adopted for use in the UK (IFRS) for the purpose of consolidation within the results of the Group. To the
extent any such financial information provided in this announcement relates to the U.S. or Reynolds American it is provided as an explanation of, or supplement to,
Reynolds American’s primary U.S. GAAP based financial statements and information.
Products sold in the U.S., including Vuse, Velo, Grizzly, Kodiak, and Camel Snus, are subject to FDA regulation and no reduced-risk claims will be made as to these
products without agency clearance.
C Ferland
Secretary
29 July 2026
45
Screenshot-2022-09-15-at-17.21.45-(1).jpg
Other Information (continued)
Corporate information
British American Tobacco p.l.c. is a public limited company which is listed on the London Stock Exchange, New York Stock Exchange and
the JSE Limited in South Africa. British American Tobacco p.l.c. is incorporated in England and Wales (No. 3407696) and domiciled in the
UK.
Registered office
Globe House, 4 Temple Place, London, WC2R 2PG, UK
tel: +44 20 7845 1000
Primary listing
London Stock Exchange (Share Code: BATS; ISIN: GB0002875804)
Computershare Investor Services PLC
The Pavilions, Bridgwater Road, Bristol BS99 6ZZ, UK
tel: 0800 408 0094; +44 370 889 3159
Your account: www.computershare.com/uk/investor/bri
Share dealing: www.computershare.com/dealing/uk
Web-based enquiries: www.investorcentre.co.uk/contactus
Secondary listing
JSE Limited (Share Code: BTI)
Shares are traded in electronic form only and transactions are settled electronically through Strate.
Computershare Investor Services Proprietary Limited
Private Bag X9000, Saxonwold 2132, South Africa
tel: 0861 100 634; +27 11 870 8216
email enquiries: web.queries@computershare.co.za
Sponsor for the purpose of the JSE listing
Merrill Lynch South Africa (Pty) Ltd t/a BofA Securities
Representative office in South Africa
Waterway House South
No 3 Dock Road, V&A Waterfront, Cape Town 8000, South Africa
PO Box 631, Cape Town 8000, South Africa
tel: +27 21 003 6712
American Depositary Receipts (ADRs)
NYSE (Symbol: BTI; CUSIP Number: 110448107)
BAT’s shares are listed on the NYSE in the form of American Depositary Shares (ADSs) and these are evidenced by American Depositary
Receipts (ADRs), each one of which represents one ordinary share of British American Tobacco p.l.c. Citibank, N.A. is the depositary bank
for the sponsored ADR programme.
Citibank Shareholder Services
PO Box 43077, Providence, Rhode Island 02940-3077, USA
tel: +1 888 985 2055 (toll-free) or +1 781 575 4555
email enquiries: citibank@shareholders-online.com
website: www.citi.com/dr
Publications
British American Tobacco Publications
Unit 80, London Industrial Park, Roding Road, London E6 6LS, UK
tel: +44 20 7511 7797
e-mail enquiries: bat@team365.co.uk
If you require publications and are located in South Africa, please contact the Company’s representative office in South Africa using the
contact details shown above.
46
Screenshot-2022-09-15-at-17.21.45-(1).jpg
Glossary and Definitions
The following is a summary of the key terms used within this report:
Term
Definition
AME
Americas (excluding U.S.) and Europe.
APMEA
Asia Pacific, Middle East and Africa.
British American
Tobacco, BAT, Group,
we, us and our
When the reference denotes an opinion, this refers to British American Tobacco p.l.c. and when the reference denotes business activity, this
refers to British American Tobacco Group operating companies, either collectively or individually, as the case may be.
Cigarette
Factory-made cigarettes (FMC) and products that have similar characteristics and are manufactured in the same manner, but due to
specific features may not be recognised as cigarettes for regulatory, duty or similar reasons.
Combustibles
Cigarettes and OTP.
Company
British American Tobacco p.l.c.
Constant Currency/
Constant rates
Presentation of results in the prior year’s exchange rate, removing the potentially distorting effect of translational foreign exchange on the
Group’s results. The Group does not adjust for normal transactional gains or losses in profit from operations which are generated by
exchange rate movements.
HP
Heated Products, including the devices, which include glo and our hybrid products, which are used to heat our consumables being the
Tobacco Heated Products or Herbal Products for Heating.
Modern Oral
Includes Velo, Grizzly and Lundgrens and products that are characterised as nicotine replacement therapy (including oral pouches, gums,
lozenges and sprays).
New Categories
Includes Vapour, HP and Modern Oral.
OTP
Other Tobacco Products, including make-your-own, roll-your-own, Pipe and Cigarillos.
Poly-usage/Poly-use
Refers to consumers consuming two or more tobacco and/or nicotine products.
Reduced-risk†
Based on the weight of evidence and assuming a complete switch from cigarette smoking. These products are not risk free and are
addictive.
Smokeless
New Categories plus Traditional Oral.
Solus usage
Adult consumers using only one category of combustible or nicotine products.
THP
Tobacco Heated Products (i.e., the consumables that contain tobacco used by Heated Product devices).
Top cigarette markets
Being the Top cigarette markets which are defined as the Group's priority Top cigarette markets by industry revenue. Top cigarette markets
are the U.S., Japan, Brazil, Germany, Pakistan, Mexico and Romania. These Top cigarette markets represent c. 50% of the addressable global
industry cigarette revenue in 2025.
Top HP markets
Being the Top HP markets which are defined as the Group's priority Top HP markets by industry revenue. Top HP markets are Japan, South
Korea, Italy, Germany, Greece, Poland, Romania, the Czech Republic, Spain and Portugal. These Top HP markets account for c.80% of total
addressable industry HP revenue in 2025.

Top Modern
Oral markets
Being the Top Modern Oral markets which are defined as the Group's priority Top Modern Oral markets by industry revenue. Top Modern
Oral markets are the U.S., Sweden, Denmark, Norway, Switzerland, the UK and Poland, accounting for c.90% of total addressable industry
Modern Oral revenue in 2025.
Top Vapour Markets
Being the Top Vapour markets which are defined as the Group's priority Top Vapour markets by industry revenue. Top Vapour markets are
the U.S., Canada, the UK, France, Germany and Spain. These Top Vapour markets account for c.70% of total addressable industry vapour
revenue (rechargeable closed systems consumables and disposables in tracked channels) in 2025
Traditional Oral
Including Moist Snuff (Granit, Mocca, Grizzly, Kodiak) and other traditional snus products (including Camel Snus and Lundgrens).
U.S.
United States of America.
Value share
Value share is the estimated retail value of units bought by adult consumers of a particular brand or combination of brands, as a proportion
of the total estimated retail value of units bought by adult consumers in the industry, category or other sub-categorisation in discussion.
Except when referencing particular markets, value share is based on our Top markets.
Vapour
Battery-powered devices (rechargeable or single-use) that heat liquid formulations – e-liquids – to create a vapour which is inhaled. Vapour
products include Vuse.
Volume share
Offtake volume share, as independently measured by retail audit agencies and scanner sales to adult consumers, where possible or based
on movements within the supply chain (such as sales to retailers) to generate an estimate of shipment share, based upon latest available
data. Except when referencing particular markets, volume share is based on our Top markets.
Products sold in the U.S., including Vuse, Velo, Grizzly, Kodiak, and Camel Snus, are subject to FDA regulation and no reduced-risk claims will be made as to these products without
agency clearance.
1.The preparation of the U.S. financial information is initially based on U.S. GAAP as the primary financial record and converted to IFRS for the purpose of consolidation within the results of
the Group.
47
Screenshot-2022-09-15-at-17.21.45-(1).jpg
Data Lake and Reconciliations
Volume
Group Volume
Six months ended 30 June
2026
2025
Reported
Growth %
Reported
New Categories:
Modern Oral (bn pouches)
7.9
+57.5%
5.0
Vapour (units mn)
263
+4.2%
253
HP (bn sticks)
8.9
-12.2%
10.1
Traditional Oral (bn sticks eq)
2.5
-9.6%
2.8
Cigarettes (bn sticks)
218
-4.6%
229
OTP (bn sticks)
5
-6.8%
5
Total Combustibles (bn sticks)
223
-4.7%
234
Non-GAAP measures
To supplement the presentation of the Group’s results of operations and financial condition in accordance with IFRS, the Group also
presents several non-GAAP measures used by management to monitor the Group’s performance. The Group’s management regularly
reviews the measures used to assess and present the financial performance of the Group and, as relevant, its geographic segments.
The following table demonstrates the principal non-GAAP measures which the Group uses and indicates the IFRS measure from which
each principal Non-GAAP measure is reconciled from:
Non-GAAP Measure title
Presented in
Reconciled from:
Current
rates
Constant
rates
IFRS measure
Revenue
£m
n/a1
Yes
Revenue
New Categories revenue
£m
Yes
Yes
Revenue
Smokeless revenue as a % of total revenue
%
Yes
Revenue
Adjusted profit from operations
£m
Yes
Yes
Profit from Operations
Adjusted operating margin
%
Yes
Yes
Revenue/Profit from Operations
Adjusted diluted earnings per share
p
Yes
Yes
Diluted Earnings per Share
The Group also uses adjusted share of post-tax results of associates and joint ventures, adjusted net finance costs, adjusted taxation
and underlying tax rate.
The Management Board, as the chief operating decision-maker, reviews a number of our IFRS and non-GAAP measures for the Group
and geographic segments and its product categories at constant rates of exchange. This allows comparison of the Group’s results, had
they been translated at the previous year’s average rates of exchange. The Group does not adjust for the normal transactional gains and
losses in profit from operations that are generated by exchange movements.
Non-GAAP measures also include measures excluding the impact of adjusting items. Although the Group does not believe that these
measures are a substitute for IFRS measures, the Group does believe such results excluding the impact of adjusting items and currency
fluctuations that may significantly affect the users' understanding of the Group's performance when compared across period, as
applicable, provide additional useful information to users of the financial statements regarding the underlying performance of operating
performance on a local currency basis (see page 12) and the business on a comparable basis.
Adjusting items, used to calculate certain of the above measures, are identified in accordance with the Group’s accounting policies. They
represent certain items of income and expense which the Group considers distinctive based on their size, nature or incidence and which
individually or, if of a similar type, in aggregate, are relevant to an understanding of the Group’s underlying financial performance.
As the Chief Operating Decision Maker, the Management Board assesses the performance of the Group by reviewing adjusted profit
from operations as adjusted for Canada2 (to evaluate segment performance and allocate resources to the overall business on a regional
basis) and adjusted diluted EPS as adjusted for Canada2, both using the prior year translational exchange rate (constant rate). These
measures recognise a charge calculated in line with the Approved Plans as agreed in 2025 – based on a percentage of Imperial Tobacco
Canada Limited's and Imperial Tobacco Company Limited's (together, ITCAN) net income after taxes from all sources in Canada,
excluding New Categories. This charge will continue until the aggregate settlement amount is paid. This is reflected in the adjusted
performance of the Group and is referred to as “as adjusted for Canada”. Management believes that these measures present the
economic delivery from the AME region in a manner comparable to that of the other regions in the Group.
1.Revenue at current rates is the IFRS measure.
2.The adjustment in respect of Canada is based upon a percentage (2026: 85%; 2025: 100%) of the net income after taxes earned from all sources, excluding New Categories, in Canada.
48
Screenshot-2022-09-15-at-17.21.45-(1).jpg
Data Lake and Reconciliations
Continued
Non-GAAP measures (continued)
In 2025, due to the uncertain nature of the timing of the implementation of the settlement on the Group’s 2025 results this charge was
100% of the net income after taxes earned from all sources in Canada, excluding New Categories.
From 2026, this charge (following the underlying terms of the Approved Plans) is 85% of the net income after taxes earned in Canada
from all sources, excluding New Categories, reducing in future periods in line with the Approved Plans.
In 2025, the Group recognised an adjusting charge in net finance costs in respect of interest earned on the restricted cash held in
Canada that was paid as part of the upfront settlement payment. This was adjusted out in 2025 as the interest income was not
representative of the ongoing business.
Additionally, the Group uses the non-GAAP measures of non-controlling interest, coupons relating to hybrid bonds net of tax and profit
attributable to shareholders.
Breakdowns of revenues by product category (including revenue generated from Vapour, Heated Products, Modern Oral, New
Categories as a whole, Traditional Oral, Smokeless products as a whole and combustibles) and by geographic segment (including
revenue generated in the United States, Americas and Europe and Asia-Pacific, Middle East and Africa), contributions to profit from
operations by product category, adjusted profit from operations, adjusted operating margin, adjusted net finance costs, adjusted group
share of post-tax results of associates and joint ventures, adjusted taxation, underlying taxation, adjusted diluted earnings per share have
limitations as analytical tools. They are not presentations made in accordance with IFRS and none of these non-GAAP measures should
be considered as an alternative measure of revenue, profit from operations, cash flows or any financial measure based thereon, as
applicable, determined in accordance with IFRS.
The Group’s Management Board believes these measures, which are used internally, are useful to the users of the financial statements in
helping them understand the underlying business performance and can provide insights into the cash flow available to, among other
things, reduce debt and pay dividends.
None of these non-GAAP measures are necessarily comparable to similarly titled measures used by other companies. As a result,
readers should not consider these non-GAAP measures in isolation from, or as a substitute analysis for, the Group’s revenue, profit from
operations, cash flows or any financial measure based thereon, as applicable, as determined in accordance with IFRS.
Due to the secondary listing of the ordinary shares of British American Tobacco p.l.c. on the main board of the JSE in South Africa, the
Group is required to present headline earnings per share and diluted headline earnings per share, as alternative measures of earnings per
share, calculated in accordance with Circular 1/2023 ‘Headline Earnings’ issued by the South African Institute of Chartered Accountants.
These are shown on page 29.
Revenue, at constant rates of exchange
Definition: revenue before the impact of foreign exchange.
Six months ended 30 June
2026
2025
£m
£m
Revenue
12,235
12,069
Impact of translational foreign exchange
184
Revenue translated at 2025 exchange rates
12,419
12,069
Revenue by Product Category, including New Categories, at constant rates of exchange
Definition: revenue derived from each of the main product categories, including New Categories, before the impact of foreign exchange.
These measures enable users of the financial statements to compare the Group’s business performance across and with reference to
the Group’s investment activity.
Six months ended 30 June
2026
2025
Group Revenue
Reported
Impact of
exchange
Revenue
at CC
Reported
£m
£m
£m
£m
New Categories
1,928
19
1,947
1,651
Modern Oral
784
(4)
780
470
Vapour
763
12
775
737
HP
381
11
392
444
Traditional Oral
494
16
510
542
Smokeless
2,422
35
2,457
2,193
Combustibles
9,561
155
9,716
9,515
Other
252
(6)
246
361
Total Revenue
12,235
184
12,419
12,069
49
Screenshot-2022-09-15-at-17.21.45-(1).jpg
Data Lake and Reconciliations
Continued
Non-GAAP measures (continued)
Six months ended 30 June
2026
2025
U.S. Revenue
Reported
Impact of
exchange
Revenue
at CC
Reported
£m
£m
£m
£m
New Categories
816
30
846
536
Modern Oral
315
12
327
102
Vapour
501
18
519
434
HP
Traditional Oral
477
17
494
521
Smokeless
1,293
47
1,340
1,057
Combustibles
4,383
159
4,542
4,328
Other
11
11
47
Total Revenue
5,687
206
5,893
5,432
Six months ended 30 June
2026
2025
AME Revenue
Reported
Impact of
exchange
Revenue
at CC
Reported
£m
£m
£m
£m
New Categories
874
(27)
847
832
Modern Oral
440
(17)
423
347
Vapour
235
(5)
230
267
HP
199
(5)
194
218
Traditional Oral
17
(1)
16
21
Smokeless
891
(28)
863
853
Combustibles
3,345
(48)
3,297
3,216
Other
166
(7)
159
212
Total Revenue
4,402
(83)
4,319
4,281
Six months ended 30 June
2026
2025
APMEA Revenue
Reported
Impact of
exchange
Revenue
at CC
Reported
£m
£m
£m
£m
New Categories
238
16
254
283
Modern Oral
29
1
30
21
Vapour
27
(1)
26
36
HP
182
16
198
226
Traditional Oral
Smokeless
238
16
254
283
Combustibles
1,833
44
1,877
1,971
Other
75
1
76
102
Total Revenue
2,146
61
2,207
2,356
50
Screenshot-2022-09-15-at-17.21.45-(1).jpg
Data Lake and Reconciliations
Continued
Non-GAAP measures (continued)
Adjusted Profit from Operations, Adjusted Profit from operations at Constant Rates of Exchange and Adjusted
Operating Margin
Definition: Profit from operations before the impact of adjusting items (described on pages 25 to 26) and translational foreign
exchange; and adjusted profit from operations as a percentage of revenue, at constant rates of exchange.
Six months ended 30 June
2026
2025
£m
£m
Profit from operations
4,266
5,069
Add:
Restructuring
370
13
Amortisation and impairment of trademarks and similar intangibles
796
804
Impairment of goodwill
72
Credit in respect of Romania's other taxes
(2)
(22)
Charges in connection with disposal of associate
3
Charges in connection with disposal of subsidiaries
12
Credit in respect of settlement of historical litigation in relation to ITG
(149)
Credit in respect of the Canada Approved Plans
(38)
(575)
Other adjusting items (including Engle)
171
30
Adjusted profit from operations
5,426
5,394
Impact of translational foreign exchange on adjusted profit from operations
104
Adjusted profit from operations translated at 2025 exchange rates
5,530
5,394
Operating Margin (Profit from operations as % of revenue)
34.9%
42.0%
Adjusted Operating Margin (Adjusted profit from operations as % of revenue)
44.4%
44.7%
Category Contribution and Category Contribution Margin at Constant Rates of Exchange
Definition – Profit from operations before the impact of adjusting items and translational foreign exchange, having allocated
costs that are attributable to a product category  in £ and as a proportion of revenue (at constant rates).
51
Screenshot-2022-09-15-at-17.21.45-(1).jpg
Data Lake and Reconciliations
Continued
Non-GAAP measures (continued)
This page is intentionally left blank.
52
Screenshot-2022-09-15-at-17.21.45-(1).jpg
Data Lake and Reconciliations
Continued
Non-GAAP measures (continued)
Adjusted Net Finance Costs at Current and Constant Rates of Exchange
Definition: Net finance costs before the impact of adjusting items (described on page 27) and translational foreign exchange.
Six months ended 30 June
2026
2025
£m
£m
Finance costs
(488)
(1,084)
Finance income
85
115
Net finance costs
(403)
(969)
Less: Adjusting items in net finance costs
(391)
98
Adjusted net finance costs
(794)
(871)
Comprising:
Interest payable
(827)
(879)
Interest and dividend income
85
115
Fair value changes – derivatives
(71)
(585)
Exchange differences
19
478
Adjusted net finance costs
(794)
(871)
Impact of translational foreign exchange
(12)
Adjusted net finance costs translated at 2025 exchange rates
(806)
(871)
Adjusted Share of Post-Tax Results of Associates and Joint Ventures, at Constant rates of exchange
Definition: Share of post-tax results of associates and joint ventures before the impact of adjusting items (described on page 27)
and translational foreign exchange.
Six months ended 30 June
2026
2025
£m
£m
Group’s share of post-tax results of associates and joint ventures
189
1,474
Issue of shares and changes in shareholding
(2)
Gain on ITC's demerger of hotels business (net of tax)
(333)
Gain on partial divestment of shares held in ITC
(904)
Gain on sale of land and property by VST industries Limited
(3)
Adjusted Group’s share of post-tax results of associates and joint ventures
189
232
Impact of translational foreign exchange
22
Adjusted Group’s share of post-tax results of associates and joint ventures translated at 2025 exchange
rates
211
232
53
Screenshot-2022-09-15-at-17.21.45-(1).jpg
Data Lake and Reconciliations
Continued
Non-GAAP measures (continued)
Adjusted Taxation at Current and Constant Rates of Exchange
Definition: Taxation before the impact of adjusting items (described on page 28) and translational foreign exchange.
Six months ended 30 June
2026
2025
£m
£m
UK
– current year tax
3
66
– adjustment in respect of prior periods
(89)
(1)
Overseas
– current year tax
1,128
1,093
– adjustment in respect of prior periods
(27)
(5)
Current tax
1,015
1,153
Pillar 2 income tax
5
43
Total current tax
1,020
1,196
Deferred tax
(196)
(187)
Taxation on ordinary activities
824
1,009
Adjusting items in taxation
100
66
Taxation on adjusting items
179
29
Adjusted taxation
1,103
1,104
Impact of translational foreign exchange
28
Adjusted taxation, translated at 2025 exchange rates
1,131
1,104
Underlying Tax Rate and Underlying Tax Rate, at Constant Rates of Exchange
Definition: Tax rate incurred before the impact of adjusting items (described on pages 25 to 28) and translational foreign
exchange and to adjust for the inclusion of the Group’s share of post-tax results of associates and joint ventures within the
Group’s pre-tax results.
Six months ended 30 June
2026
2025
£m
£m
Profit before taxation (PBT)
4,052
5,574
Less:
Share of post-tax results of associates and joint ventures
(189)
(1,474)
Adjusting items within profit from operations
1,160
325
Adjusting items within finance costs
(391)
98
Adjusted PBT, excluding associates and joint ventures
4,632
4,523
Impact of translational foreign exchange
92
Adjusted PBT, excluding associates and joint ventures translated at 2025 exchange rates
4,724
4,523
Taxation on ordinary activities
(824)
(1,009)
Adjusting items within taxation and taxation on adjusting items
(279)
(95)
Adjusted taxation
(1,103)
(1,104)
Impact of translational foreign exchange on adjusted taxation
(28)
Adjusted taxation translated at 2025 exchange rates
(1,131)
(1,104)
Effective tax rate
20.3%
18.1%
Underlying tax rate
23.8%
24.4%
Underlying tax rate (constant rates)
23.9%
24.4%
54
Screenshot-2022-09-15-at-17.21.45-(1).jpg
Data Lake and Reconciliations
Continued
Non-GAAP measures (continued)
Adjusted Diluted Earnings per Share, at Current and Constant Rates of Exchange
Definition: Diluted earnings per share before the impact of adjusting items, after adjustments to the number of shares
outstanding for the impact of share option schemes whether they would be dilutive or not under statutory measures, presented
at the current and the prior years’ rates of exchange.
Six months ended 30 June
2026
2025
pence
pence
Diluted earnings per share
145.3
203.6
Effect of adjusting items in depreciation, amortisation and impairment
28.4
31.4
Effect of adjusting items in operating expenses
1.1
(18.8)
Effect of restructuring costs
12.7
0.2
Effect of adjusting net finance costs
(15.2)
3.4
Effect of associates' adjusting items net of tax
(56.3)
Capital gains tax and deferred tax associated with the partial divestment of shares held in ITC and hotels
business demerger
1.6
Effect of adjusting items in taxation
(4.6)
(3.1)
Adjusted diluted earnings per share
167.7
162.0
Impact of translational foreign exchange
3.9
Adjusted diluted earnings per share translated at 2025 exchange rates
171.6
162.0
55
Screenshot-2022-09-15-at-17.21.45-(1).jpg
Data Lake and Reconciliations
Continued
Non-GAAP measures (continued)
This page is intentionally left blank.
56
Screenshot-2022-09-15-at-17.21.45-(1).jpg
Data Lake and Reconciliations
Continued
Non-GAAP measures (continued)
Net Debt
Definition: Total borrowings, including related derivatives, less cash and cash equivalents and current investments held at fair
value.
2026
2025
£m
£m
Borrowings (including lease liabilities)
(35,063)
(35,208)
Derivatives in respect of net debt
(25)
(27)
Cash and cash equivalents
2,518
4,404
Current investments held at fair value
15
489
Net debt
(32,555)
(30,342)
57
Screenshot-2022-09-15-at-17.21.45-(1).jpg
Data Lake and Reconciliations (continued)
Summary reconciliation of Profit from Operations and Diluted EPS to adjusted Profit from
Operations and Adjusted Diluted EPS
2026 at actual (2026) rates
Six months ended 30 June
Reported
Adj
Items1
Adjusted
£m
£m
£m
Profit from Operations
U.S.
2,595
652
3,247
AME
1,212
259
1,471
APMEA
459
249
708
Total Region
4,266
1,160
5,426
Net finance costs
(403)
(391)
(794)
Associates and joint ventures
189
189
Profit before tax
4,052
769
4,821
Taxation
(824)
(279)
(1,103)
Non-controlling interests
(38)
(2)
(40)
Coupons relating to hybrid bonds net of tax
(28)
(28)
Profit attributable to shareholders
3,162
488
3,650
Diluted number of shares (m)
2,176
2,176
Diluted earnings per share (pence)
145.3
167.7
2026 at constant (2025) rates
Six months ended 30 June
Reported
Adj
Items1
Adjusted
Exchange
Adjusted at
CC2
£m
£m
£m
£m
£m
Profit from Operations
U.S.
2,595
652
3,247
124
3,371
AME
1,212
259
1,471
(28)
1,443
APMEA
459
249
708
8
716
Total Region
4,266
1,160
5,426
104
5,530
Net finance costs
(403)
(391)
(794)
(12)
(806)
Associates and joint ventures
189
189
22
211
Profit before tax
4,052
769
4,821
114
4,935
Taxation
(824)
(279)
(1,103)
(28)
(1,131)
Non-controlling interests
(38)
(2)
(40)
(2)
(42)
Coupons relating to hybrid bonds net of tax
(28)
(28)
(28)
Profit attributable to shareholders
3,162
488
3,650
84
3,734
Diluted number of shares (m)
2,176
2,176
2,176
Diluted earnings per share (pence)
145.3
167.7
171.6
2025 at actual (2025) rates
Six months ended 30 June
Reported
Adj Items1
Adjusted
£m
£m
£m
Profit from Operations
U.S.
2,255
808
3,063
AME
1,969
(495)
1,474
APMEA
845
12
857
Total Region
5,069
325
5,394
Net finance costs
(969)
98
(871)
Associates and joint ventures
1,474
(1,242)
232
Profit before tax
5,574
(819)
4,755
Taxation
(1,009)
(95)
(1,104)
Non-controlling interests
(53)
(3)
(56)
Coupons relating to hybrid bonds net of tax
(22)
(22)
Profit attributable to shareholders
4,490
(917)
3,573
Diluted number of shares (m)
2,205
2,205
Diluted earnings per share (pence)
203.6
162.0
1.Adjusting items represent certain items which the Group considers distinctive based upon their size, nature or incidence - see pages 25 to 26.
2.CC: constant currency – measures are calculated based upon a re-translation, at the prior year’s exchange rates, of the current year’s results of the Group and, where applicable, its segments.
58
Screenshot-2022-09-15-at-17.21.45-(1).jpg
Data Lake and Reconciliations (continued)
Summary of volume and revenue by category by region
Volume (unit)
Six months ended 30 June
U.S.
AME
APMEA
Group
2026
% change
2026
% change
2026
% change
2026
% change
New Categories
Modern Oral (pouches bn)
3.2
+188%
3.9
+18.9%
0.7
+27.5%
7.9
+57.5%
Vapour (units mn)
141
+14.9%
108
-3.6%
14
-20.2%
263
+4.2%
HP (sticks bn)
%
3.8
-2.8%
5.1
-18.0%
8.9
-12.2%
Traditional Oral (stick eq bn)
2.2
-12.4%
0.3
+12.2%
%
2.5
-9.6%
Cigarettes (sticks bn)
20
-5.2%
104
-6.3%
94
-2.7%
218
-4.6%
OTP (stick eq bn)
-8.8%
4
-5.3%
1
-18.7%
5
-6.8%
Total Combustibles
20
-5.2%
108
-6.2%
95
-2.8%
223
-4.7%
Revenue - 2026 reported at current (2026) rates (£m)
Six months ended 30 June
U.S.
AME
APMEA
Group
2026
% change
2026
% change
2026
% change
2026
% change
New Categories
816
+52.5%
874
+5.0%
238
-16.0%
1,928
+16.8%
Modern Oral
315
+209%
440
+26.5%
29
+37.4%
784
+66.6%
Vapour
501
+15.6%
235
-11.9%
27
-25.6%
763
+3.6%
HP
%
199
-8.8%
182
-19.4%
381
-14.2%
Traditional Oral
477
-8.5%
17
-18.0%
%
494
-8.8%
Total Smokeless
1,293
+22.4%
891
+4.4%
238
-16.0%
2,422
+10.5%
Total Combustibles
4,383
+1.3%
3,345
+4.0%
1,833
-7.0%
9,561
+0.5%
Other
11
-78.4%
166
-21.3%
75
-26.9%
252
-30.3%
Total
5,687
+4.7%
4,402
+2.8%
2,146
-8.9%
12,235
+1.4%
Revenue - 2026 at constant (2025) rates (£m)
Six months ended 30 June
U.S.
AME
APMEA
Group
2026
% change
2026
% change
2026
% change
2026
% change
New Categories
846
+58.1%
847
+1.9%
254
-10.3%
1,947
+18.0%
Modern Oral
327
+220%
423
+21.8%
30
+43.2%
780
+65.9%
Vapour
519
+19.8%
230
-13.9%
26
-28.2%
775
+5.3%
HP
%
194
-10.8%
198
-12.5%
392
-11.7%
Traditional Oral
494
-5.2%
16
-22.5%
%
510
-5.8%
Total Smokeless
1,340
+26.9%
863
+1.3%
254
-10.3%
2,457
+12.1%
Total Combustibles
4,542
+5.0%
3,297
+2.5%
1,877
-4.8%
9,716
+2.1%
Other
11
-77.6%
159
-25.6%
76
-24.9%
246
-32.2%
Total
5,893
+8.5%
4,319
+0.9%
2,207
-6.3%
12,419
+2.9%
Revenue - 2025 at actual (2025) rates (£m)
Six months ended 30 June
U.S.
AME
APMEA
Group
2025
% change
2025
% change
2025
% change
2025
% change
New Categories
536
832
283
1,651
Modern Oral
102
347
21
470
Vapour
434
267
36
737
HP
218
226
444
Traditional Oral
521
21
542
Total Smokeless
1,057
853
283
2,193
Total Combustibles
4,328
3,216
1,971
9,515
Other
47
212
102
361
Total
5,432
4,281
2,356
12,069
Note:
Data provided in the above tables is based upon the absolute results of the Group which may lead to certain instances of rounding differences arising that are not material for the understanding of the Group's
performance.