Shareholder Report
May 31, 2026
USD ($)
$ / shares
WHAT WERE THE FUND COSTS FOR THE PAST YEAR? (based on a hypothetical $10,000 investment)
|
Class Name
|
Costs of a $10,000 investment
|
Costs paid as a percentage of a $10,000 investment
|
|
Class I
|
$66
|
0.65%
|
HOW DID THE FUND PERFORM LAST YEAR AND WHAT AFFECTED ITS PERFORMANCE?
For the twelve months ended May 31, 2026, relative performance was primarily hindered by stock selection in the Industrials and Information Technology sectors. Stock selection in the Communication Services and Consumer Discretionary sectors contributed positively to relative results during the period.
During the period, the strategy continued its emphasis on high-quality companies, maintaining a meaningful overweight to companies with strong balance sheets, durable profitability, and consistent earnings growth. This quality bias detracted from relative performance as market leadership broadened and investor appetite for risk increased, driving strong performance among more cyclical, higher-volatility, and lower-quality segments of the market. Despite elevated geopolitical uncertainty and ongoing macroeconomic risks, investor sentiment generally favored companies with higher growth expectations, creating a headwind for the Fund’s quality-oriented investment approach.
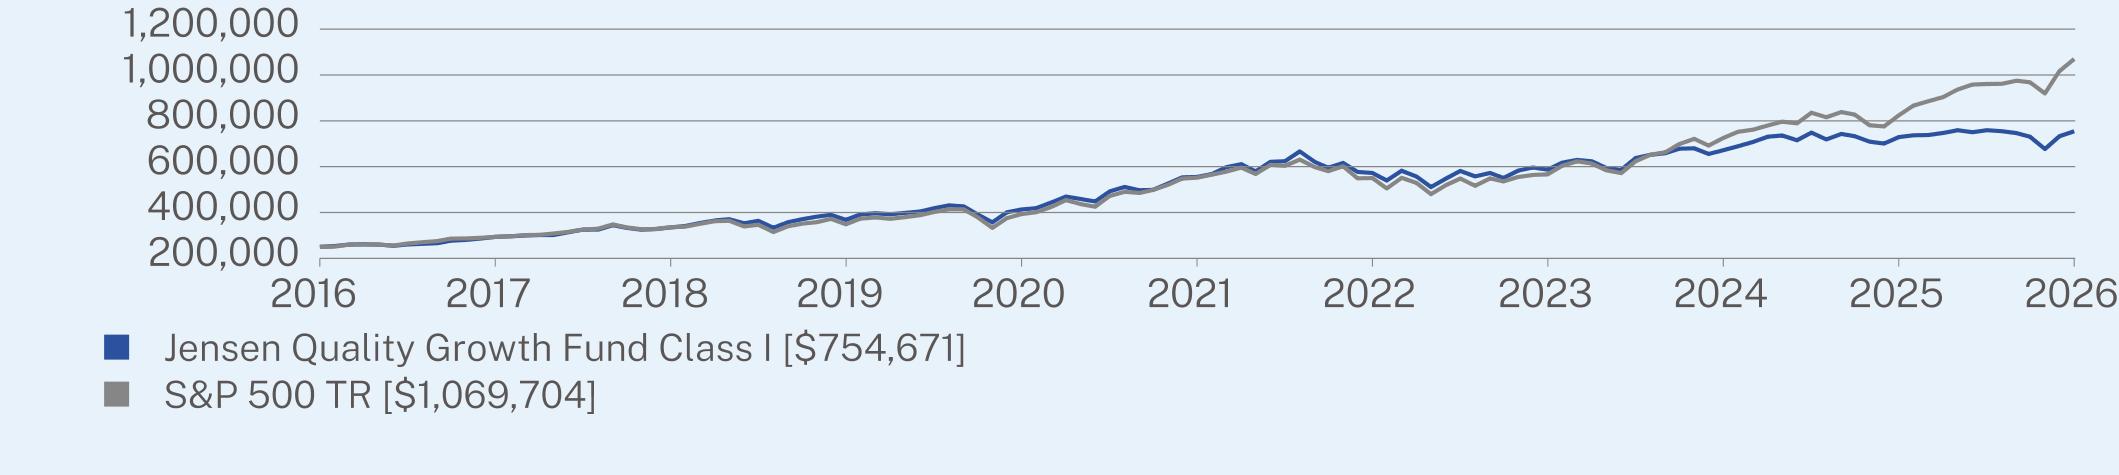
ANNUAL AVERAGE TOTAL RETURN (%)
|
|
1 Year
|
5 Year
|
10 Year
|
|
Class I (without sales charge)
|
3.48
|
6.33
|
11.68
|
|
S&P 500 TR
|
29.78
|
14.15
|
15.65
|
Visit https://www.jenseninvestment.com/reg-docs/ for more recent performance information.
KEY FUND STATISTICS (as of May 31, 2026)
|
Net Assets
|
$2,957,059,059
|
|
Number of Holdings
|
28
|
|
Net Advisory Fee
|
$22,873,129
|
|
Portfolio Turnover
|
31%
|
WHAT DID THE FUND INVEST IN? (% of net assets as of May 31, 2026)
Sector Breakdown*
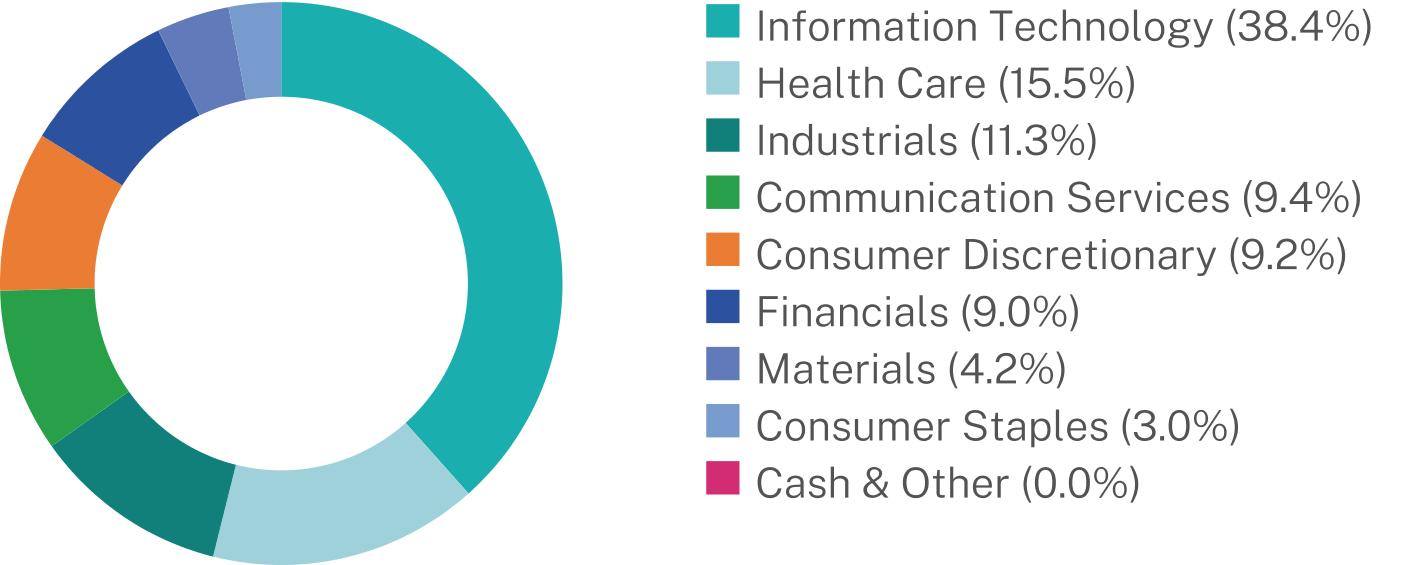
|
Top 10 Issuers
|
(%)
|
|
Amazon.com, Inc.
|
7.5%
|
|
Microsoft Corp.
|
7.5%
|
|
Alphabet, Inc.
|
7.4%
|
|
Apple, Inc.
|
7.1%
|
|
NVIDIA Corp.
|
6.7%
|
|
Eli Lilly & Co.
|
5.6%
|
|
Mastercard, Inc.
|
5.0%
|
|
Broadcom, Inc.
|
4.7%
|
|
Stryker Corp.
|
4.4%
|
|
Sherwin-Williams Co.
|
4.2%
|
WHAT WERE THE FUND COSTS FOR THE PAST YEAR? (based on a hypothetical $10,000 investment)
|
Class Name
|
Costs of a $10,000 investment
|
Costs paid as a percentage of a $10,000 investment
|
|
Class J
|
$90
|
0.89%
|
HOW DID THE FUND PERFORM LAST YEAR AND WHAT AFFECTED ITS PERFORMANCE?
For the twelve months ended May 31, 2026, relative performance was primarily hindered by stock selection in the Industrials and Information Technology sectors. Stock selection in the Communication Services and Consumer Discretionary sectors contributed positively to relative results during the period.
During the period, the strategy continued its emphasis on high-quality companies, maintaining a meaningful overweight to companies with strong balance sheets, durable profitability, and consistent earnings growth. This quality bias detracted from relative performance as market leadership broadened and investor appetite for risk increased, driving strong performance among more cyclical, higher-volatility, and lower-quality segments of the market. Despite elevated geopolitical uncertainty and ongoing macroeconomic risks, investor sentiment generally favored companies with higher growth expectations, creating a headwind for the Fund’s quality-oriented investment approach.
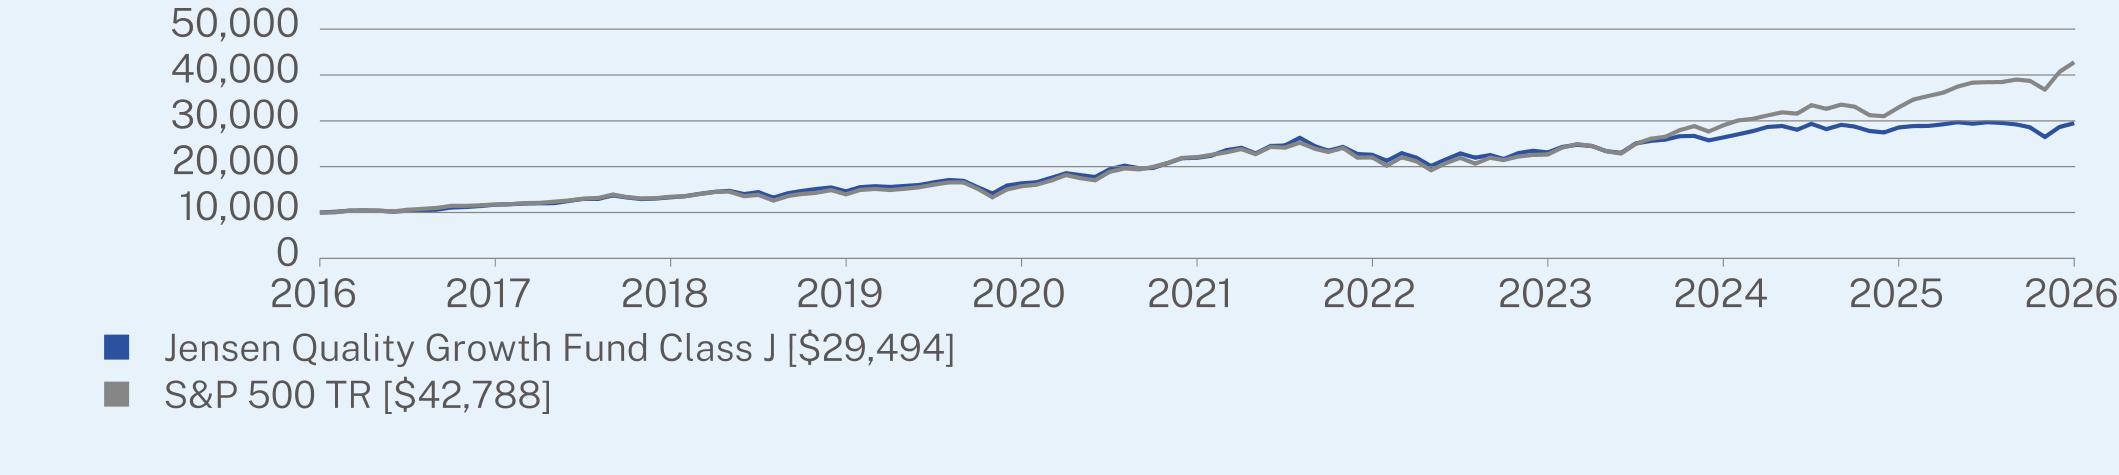
ANNUAL AVERAGE TOTAL RETURN (%)
|
|
1 Year
|
5 Year
|
10 Year
|
|
Class J (without sales charge)
|
3.25
|
6.10
|
11.42
|
|
S&P 500 TR
|
29.78
|
14.15
|
15.65
|
Visit https://www.jenseninvestment.com/reg-docs/ for more recent performance information.
KEY FUND STATISTICS (as of May 31, 2026)
|
Net Assets
|
$2,957,059,059
|
|
Number of Holdings
|
28
|
|
Net Advisory Fee
|
$22,873,129
|
|
Portfolio Turnover
|
31%
|
WHAT DID THE FUND INVEST IN? (% of net assets as of May 31, 2026)
Sector Breakdown*
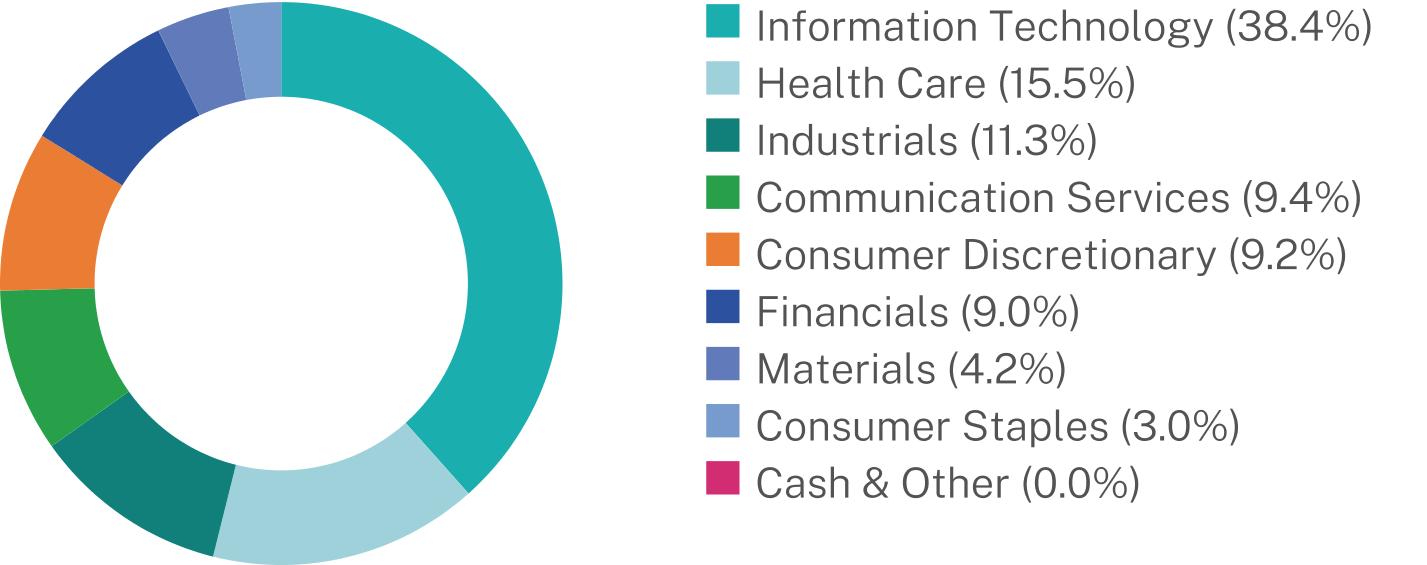
|
Top 10 Issuers
|
(%)
|
|
Amazon.com, Inc.
|
7.5%
|
|
Microsoft Corp.
|
7.5%
|
|
Alphabet, Inc.
|
7.4%
|
|
Apple, Inc.
|
7.1%
|
|
NVIDIA Corp.
|
6.7%
|
|
Eli Lilly & Co.
|
5.6%
|
|
Mastercard, Inc.
|
5.0%
|
|
Broadcom, Inc.
|
4.7%
|
|
Stryker Corp.
|
4.4%
|
|
Sherwin-Williams Co.
|
4.2%
|
WHAT WERE THE FUND COSTS FOR THE PAST YEAR? (based on a hypothetical $10,000 investment)
|
Class Name
|
Costs of a $10,000 investment
|
Costs paid as a percentage of a $10,000 investment
|
|
Class R
|
$156
|
1.54%
|
HOW DID THE FUND PERFORM LAST YEAR AND WHAT AFFECTED ITS PERFORMANCE?
For the twelve months ended May 31, 2026, relative performance was primarily hindered by stock selection in the Industrials and Information Technology sectors. Stock selection in the Communication Services and Consumer Discretionary sectors contributed positively to relative results during the period.
During the period, the strategy continued its emphasis on high-quality companies, maintaining a meaningful overweight to companies with strong balance sheets, durable profitability, and consistent earnings growth. This quality bias detracted from relative performance as market leadership broadened and investor appetite for risk increased, driving strong performance among more cyclical, higher-volatility, and lower-quality segments of the market. Despite elevated geopolitical uncertainty and ongoing macroeconomic risks, investor sentiment generally favored companies with higher growth expectations, creating a headwind for the Fund’s quality-oriented investment approach.
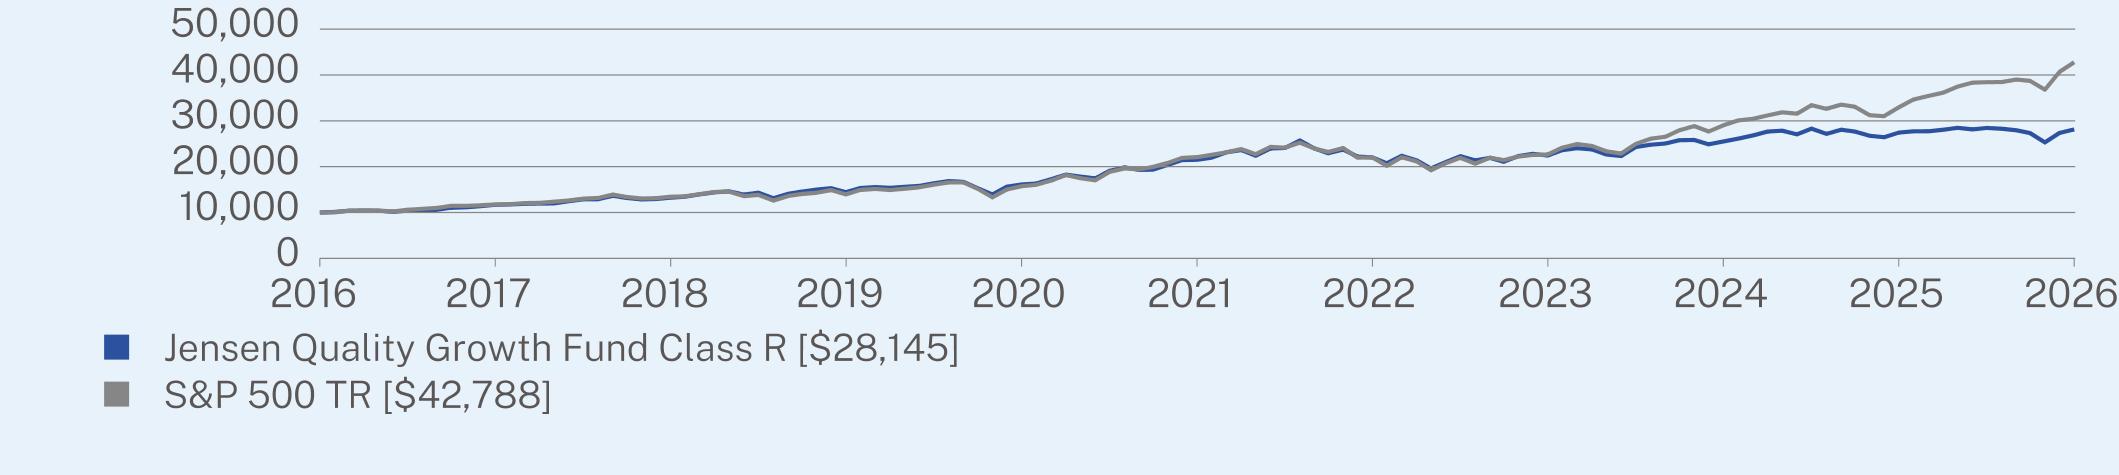
ANNUAL AVERAGE TOTAL RETURN (%)
|
|
1 Year
|
5 Year
|
10 Year
|
|
Class R (without sales charge)
|
2.56
|
5.53
|
10.90
|
|
S&P 500 TR
|
29.78
|
14.15
|
15.65
|
Visit https://www.jenseninvestment.com/reg-docs/ for more recent performance information.
KEY FUND STATISTICS (as of May 31, 2026)
|
Net Assets
|
$2,957,059,059
|
|
Number of Holdings
|
28
|
|
Net Advisory Fee
|
$22,873,129
|
|
Portfolio Turnover
|
31%
|
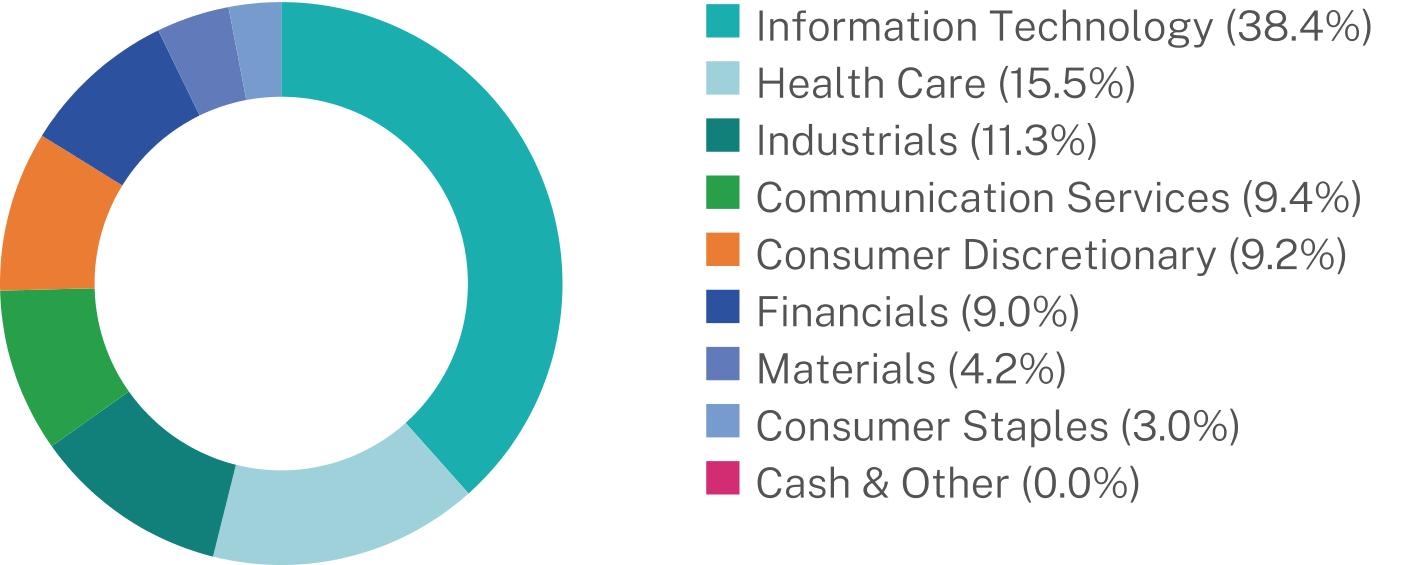
WHAT DID THE FUND INVEST IN? (% of net assets as of May 31, 2026)
Sector Breakdown*
|
Top 10 Issuers
|
(%)
|
|
Amazon.com, Inc.
|
7.5%
|
|
Microsoft Corp.
|
7.5%
|
|
Alphabet, Inc.
|
7.4%
|
|
Apple, Inc.
|
7.1%
|
|
NVIDIA Corp.
|
6.7%
|
|
Eli Lilly & Co.
|
5.6%
|
|
Mastercard, Inc.
|
5.0%
|
|
Broadcom, Inc.
|
4.7%
|
|
Stryker Corp.
|
4.4%
|
|
Sherwin-Williams Co.
|
4.2%
|
WHAT WERE THE FUND COSTS FOR THE PAST YEAR? (based on a hypothetical $10,000 investment)
|
Class Name
|
Costs of a $10,000 investment
|
Costs paid as a percentage of a $10,000 investment
|
|
Class Y
|
$61
|
0.60%
|
HOW DID THE FUND PERFORM LAST YEAR AND WHAT AFFECTED ITS PERFORMANCE?
For the twelve months ended May 31, 2026, relative performance was primarily hindered by stock selection in the Industrials and Information Technology sectors. Stock selection in the Communication Services and Consumer Discretionary sectors contributed positively to relative results during the period.
During the period, the strategy continued its emphasis on high-quality companies, maintaining a meaningful overweight to companies with strong balance sheets, durable profitability, and consistent earnings growth. This quality bias detracted from relative performance as market leadership broadened and investor appetite for risk increased, driving strong performance among more cyclical, higher-volatility, and lower-quality segments of the market. Despite elevated geopolitical uncertainty and ongoing macroeconomic risks, investor sentiment generally favored companies with higher growth expectations, creating a headwind for the Fund’s quality-oriented investment approach.
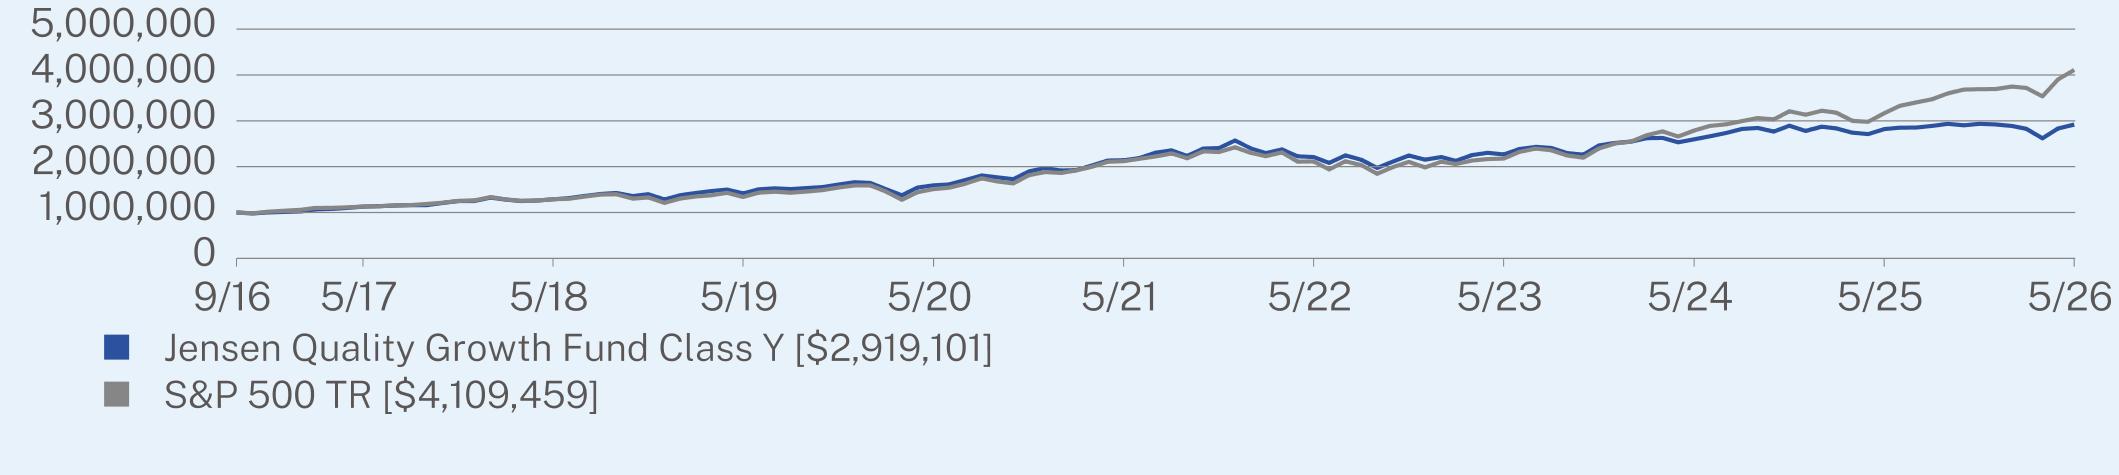
ANNUAL AVERAGE TOTAL RETURN (%)
|
|
1 Year
|
5 Year
|
Since Inception
(09/30/2016) |
|
Class Y (without sales charge)
|
3.53
|
6.41
|
11.72
|
|
S&P 500 TR
|
29.78
|
14.15
|
15.74
|
Visit https://www.jenseninvestment.com/reg-docs/ for more recent performance information.
KEY FUND STATISTICS (as of May 31, 2026)
|
Net Assets
|
$2,957,059,059
|
|
Number of Holdings
|
28
|
|
Net Advisory Fee
|
$22,873,129
|
|
Portfolio Turnover
|
31%
|
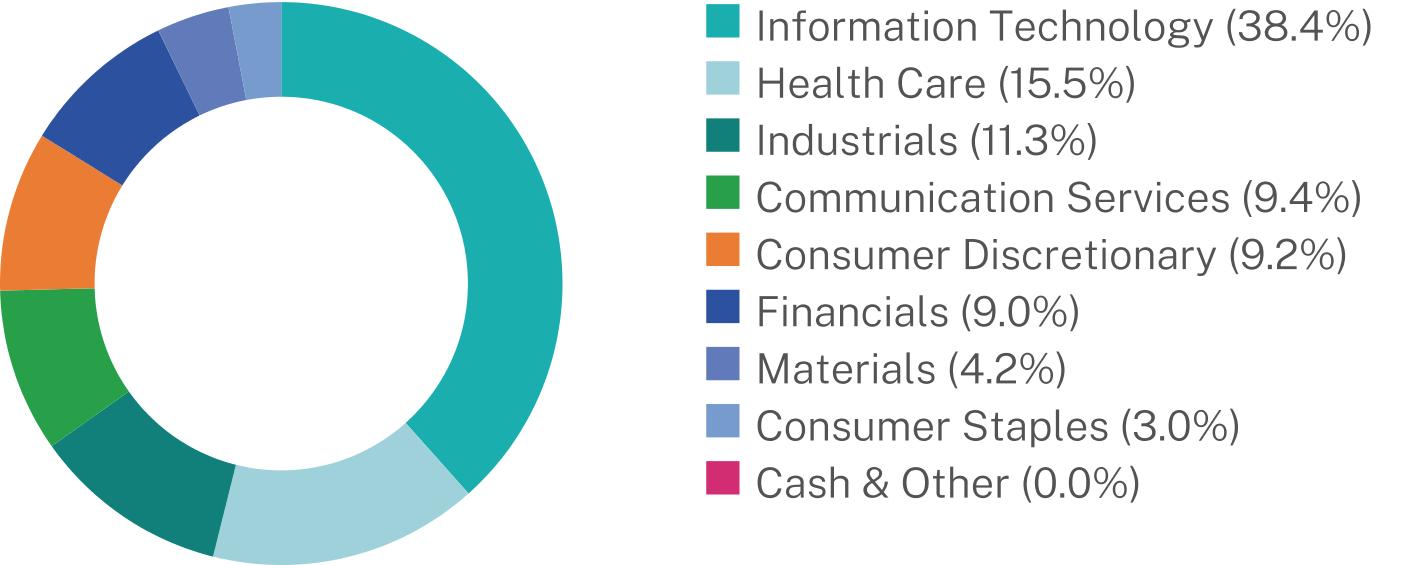
WHAT DID THE FUND INVEST IN? (% of net assets as of May 31, 2026)
Sector Breakdown*
|
Top 10 Issuers
|
(%)
|
|
Amazon.com, Inc.
|
7.5%
|
|
Microsoft Corp.
|
7.5%
|
|
Alphabet, Inc.
|
7.4%
|
|
Apple, Inc.
|
7.1%
|
|
NVIDIA Corp.
|
6.7%
|
|
Eli Lilly & Co.
|
5.6%
|
|
Mastercard, Inc.
|
5.0%
|
|
Broadcom, Inc.
|
4.7%
|
|
Stryker Corp.
|
4.4%
|
|
Sherwin-Williams Co.
|
4.2%
|
| [1] |
|
||
| [2] |
|
||
| [3] |
|
||
| [4] |
|