
SunCoke Energy, Inc. Q2 2026 Earnings Conference Call
2 2Forward-Looking Statements This presentation should be reviewed in conjunction with the second quarter 2026 earnings release of SunCoke Energy, Inc. (SunCoke) and conference call held on July 30, 2026 at 11:00 a.m. ET (10:00 a.m. CT). This presentation contains “forward-looking statements” (as defined in Section 27A of the Securities Act of 1933, as amended and Section 21E of the Securities Exchange Act of 1934, as amended). Forward-looking statements often may be identified by the use of such words as "believe," "expect," "plan," "project," "intend," "anticipate," "estimate," "predict," "potential," "continue," "may," "will," "should," or the negative of these terms, or similar expressions. However, the absence of these words or similar expressions does not mean that a statement is not forward-looking. Any statements made in this presentation or during the related conference call that are not statements of historical fact, including those concerning our possible or assumed future results of operations, our 2026 guidance and outlook, our 2026 key initiatives, future dividends, anticipated transaction benefits and synergies of the Phoenix Global acquisition, descriptions of our business plans and strategies, and other statements about our beliefs and expectations, are forward-looking statements and should be evaluated as such. Forward-looking statements represent only our present beliefs regarding future events, many of which are inherently uncertain and involve significant known and unknown risks and uncertainties (many of which are beyond the control of SunCoke) that could cause our actual results and financial condition to differ materially from the anticipated results and financial condition indicated in such forward-looking statements. These risks and uncertainties include, but are not limited to, the risks and uncertainties described in Item 1A (“Risk Factors”) of our Annual Report on Form 10-K for the most recently completed fiscal year, as well as those described from time to time in our other reports and filings with the Securities and Exchange Commission (SEC). In accordance with the safe harbor provisions of the Private Securities Litigation Reform Act of 1995, SunCoke has included in its filings with the SEC cautionary language identifying important factors (but not necessarily all the important factors) that could cause actual results to differ materially from those expressed in any forward-looking statement made by SunCoke. For information concerning these factors and other important information regarding the matters discussed in this presentation, see SunCoke’s SEC filings, copies of which are available free of charge on SunCoke's website at www.suncoke.com or on the SEC’s website at www.sec.gov. All forward-looking statements included in this presentation or made during the related conference call are expressly qualified in their entirety by such cautionary statements. Unpredictable or unknown factors not discussed in this presentation also could have material adverse effects on forward-looking statements. Forward-looking statements are not guarantees of future performance, but are based upon the current knowledge, beliefs and expectations of SunCoke management, and upon assumptions by SunCoke concerning future conditions, any or all of which ultimately may prove to be inaccurate. You should not place undue reliance on these forward-looking statements, which speak only as of the date of the earnings release. SunCoke does not intend, and expressly disclaims any obligation, to update or alter its forward-looking statements (or associated cautionary language), whether as a result of new information, future events, or otherwise, after the date of the earnings release except as required by applicable law.
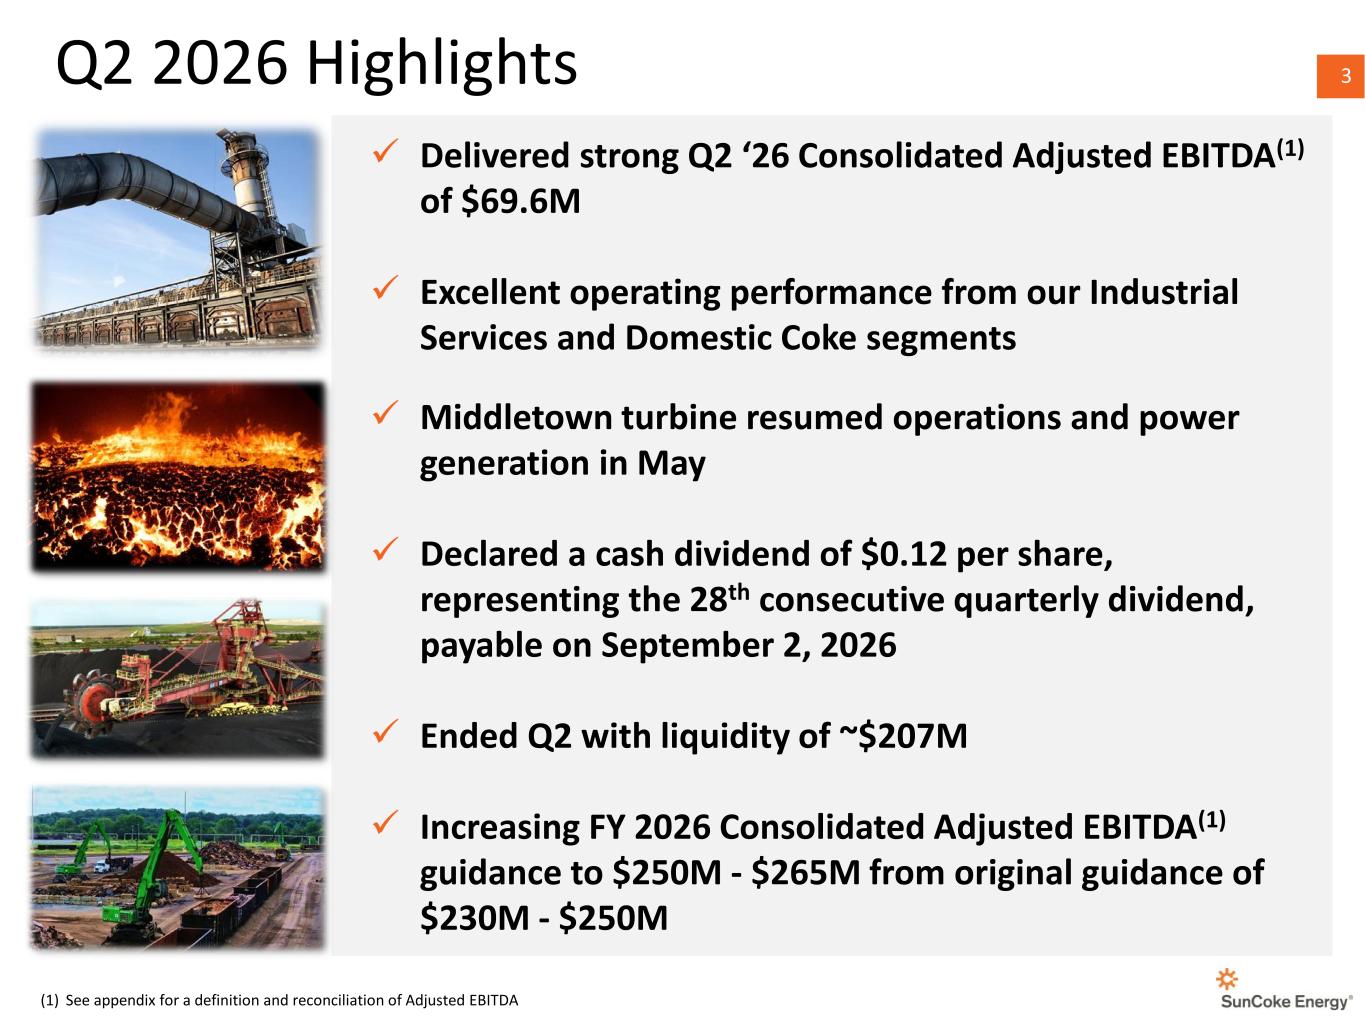
3 3Q2 2026 Highlights ✓ Delivered strong Q2 ‘26 Consolidated Adjusted EBITDA(1) of $69.6M ✓ Excellent operating performance from our Industrial Services and Domestic Coke segments ✓ Middletown turbine resumed operations and power generation in May ✓ Declared a cash dividend of $0.12 per share, representing the 28th consecutive quarterly dividend, payable on September 2, 2026 ✓ Ended Q2 with liquidity of ~$207M ✓ Increasing FY 2026 Consolidated Adjusted EBITDA(1) guidance to $250M - $265M from original guidance of $230M - $250M (1) See appendix for a definition and reconciliation of Adjusted EBITDA
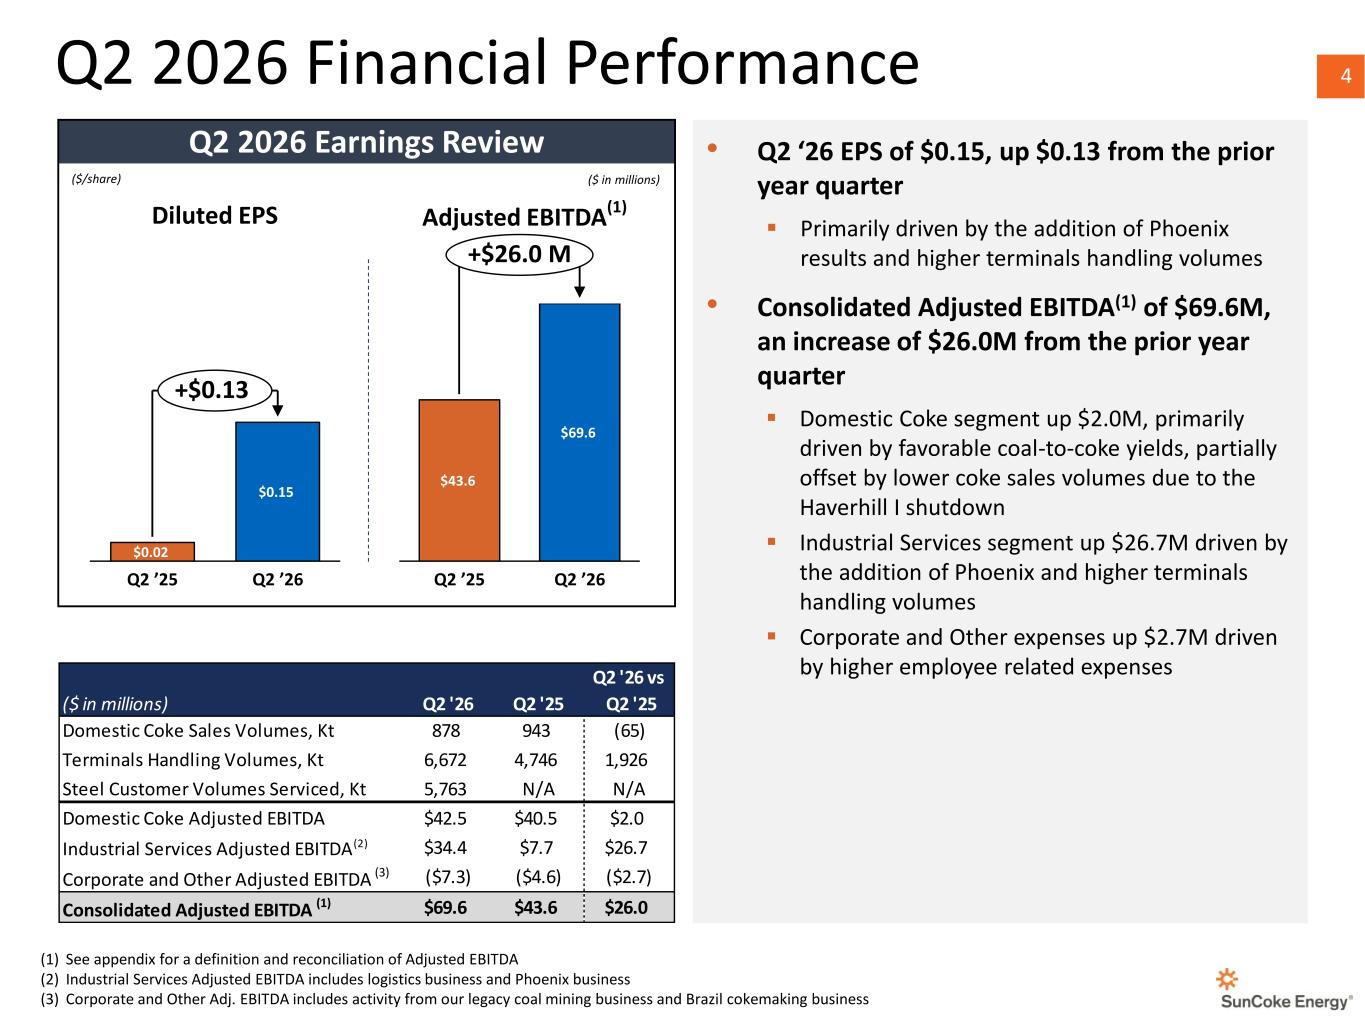
4 4Q2 2026 Financial Performance (1) See appendix for a definition and reconciliation of Adjusted EBITDA (2) Industrial Services Adjusted EBITDA includes logistics business and Phoenix business (3) Corporate and Other Adj. EBITDA includes activity from our legacy coal mining business and Brazil cokemaking business ($/share) ($ in millions) Adjusted EBITDA(1) $43.6 $69.6 Q2 ’25 Q2 ’26 +$26.0 M Q2 2026 Earnings Review • Q2 ‘26 EPS of $0.15, up $0.13 from the prior year quarter ▪ Primarily driven by the addition of Phoenix results and higher terminals handling volumes • Consolidated Adjusted EBITDA(1) of $69.6M, an increase of $26.0M from the prior year quarter ▪ Domestic Coke segment up $2.0M, primarily driven by favorable coal-to-coke yields, partially offset by lower coke sales volumes due to the Haverhill I shutdown ▪ Industrial Services segment up $26.7M driven by the addition of Phoenix and higher terminals handling volumes ▪ Corporate and Other expenses up $2.7M driven by higher employee related expenses $0.02 $0.15 Q2 ’25 Q2 ’26 +$0.13 Diluted EPS ($ in millions) Q2 '26 Q2 '25 Q2 '26 vs Q2 '25 Domestic Coke Sales Volumes, Kt 878 943 (65) Terminals Handling Volumes, Kt 6,672 4,746 1,926 Steel Customer Volumes Serviced, Kt 5,763 N/A N/A Domestic Coke Adjusted EBITDA $42.5 $40.5 $2.0 Industrial Services Adjusted EBITDA(2) $34.4 $7.7 $26.7 Corporate and Other Adjusted EBITDA (3) ($7.3) ($4.6) ($2.7) Consolidated Adjusted EBITDA (1) $69.6 $43.6 $26.0
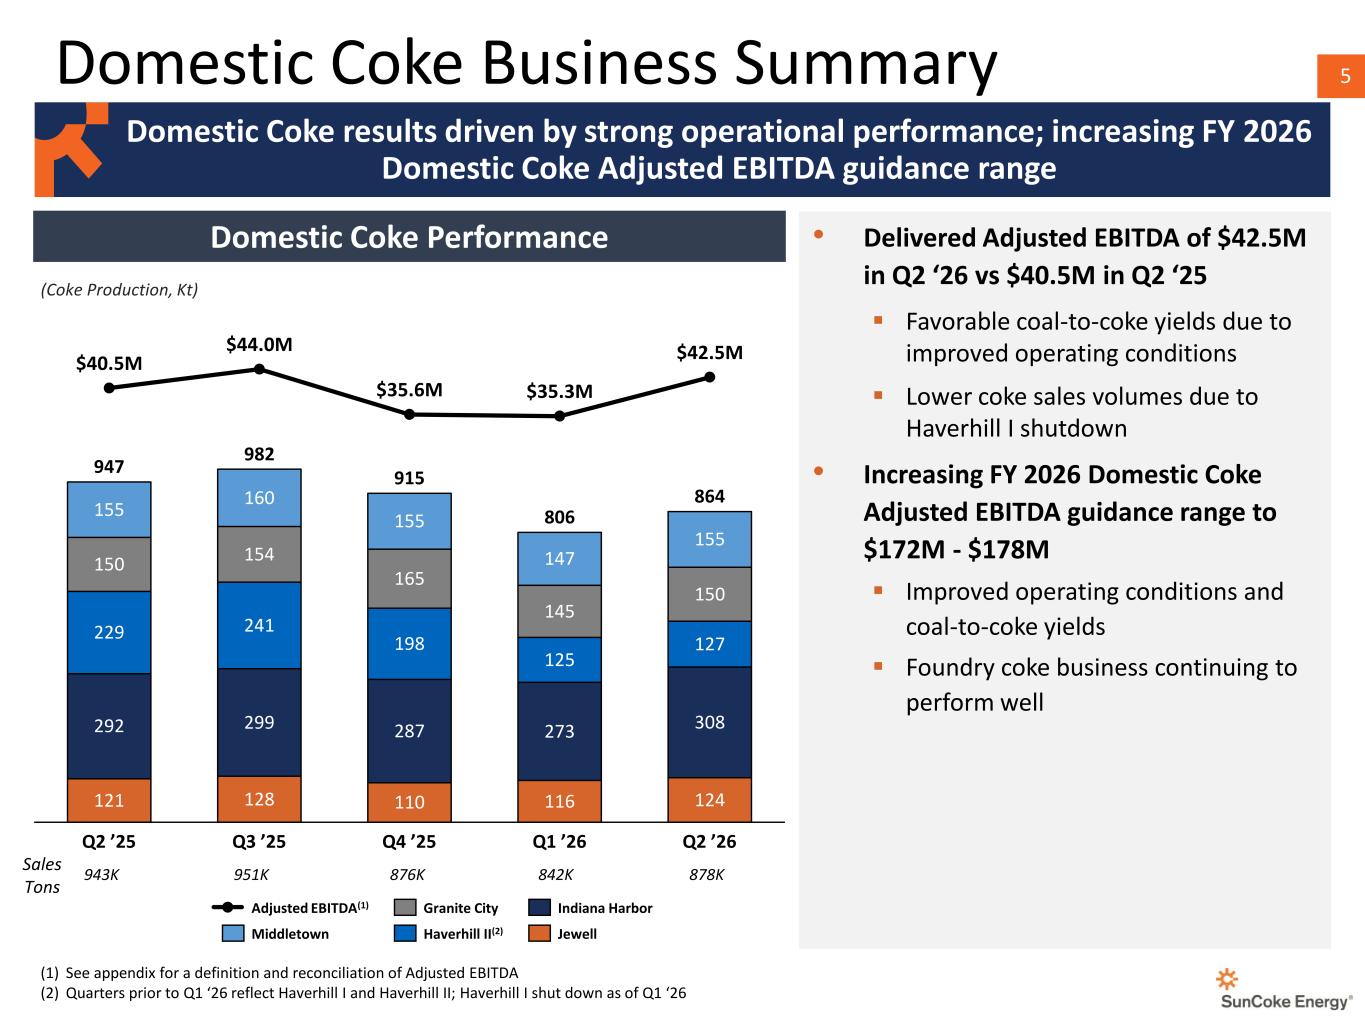
5 Domestic Coke Performance Domestic Coke Business Summary Domestic Coke results driven by strong operational performance; increasing FY 2026 Domestic Coke Adjusted EBITDA guidance range 121 128 110 116 124 292 299 287 273 308 229 241 198 125 127 150 154 165 145 150 155 160 155 147 155 $40.5M $44.0M $35.6M $35.3M $42.5M Q2 ’25 Q3 ’25 Q4 ’25 Q1 ’26 Q2 ’26 947 982 915 806 864 Adjusted EBITDA(1) Middletown Granite City Haverhill II(2) Indiana Harbor Jewell Sales Tons (Coke Production, Kt) • Delivered Adjusted EBITDA of $42.5M in Q2 ‘26 vs $40.5M in Q2 ‘25 ▪ Favorable coal-to-coke yields due to improved operating conditions ▪ Lower coke sales volumes due to Haverhill I shutdown • Increasing FY 2026 Domestic Coke Adjusted EBITDA guidance range to $172M - $178M ▪ Improved operating conditions and coal-to-coke yields ▪ Foundry coke business continuing to perform well 842K943K 878K876K951K (1) See appendix for a definition and reconciliation of Adjusted EBITDA (2) Quarters prior to Q1 ‘26 reflect Haverhill I and Haverhill II; Haverhill I shut down as of Q1 ‘26
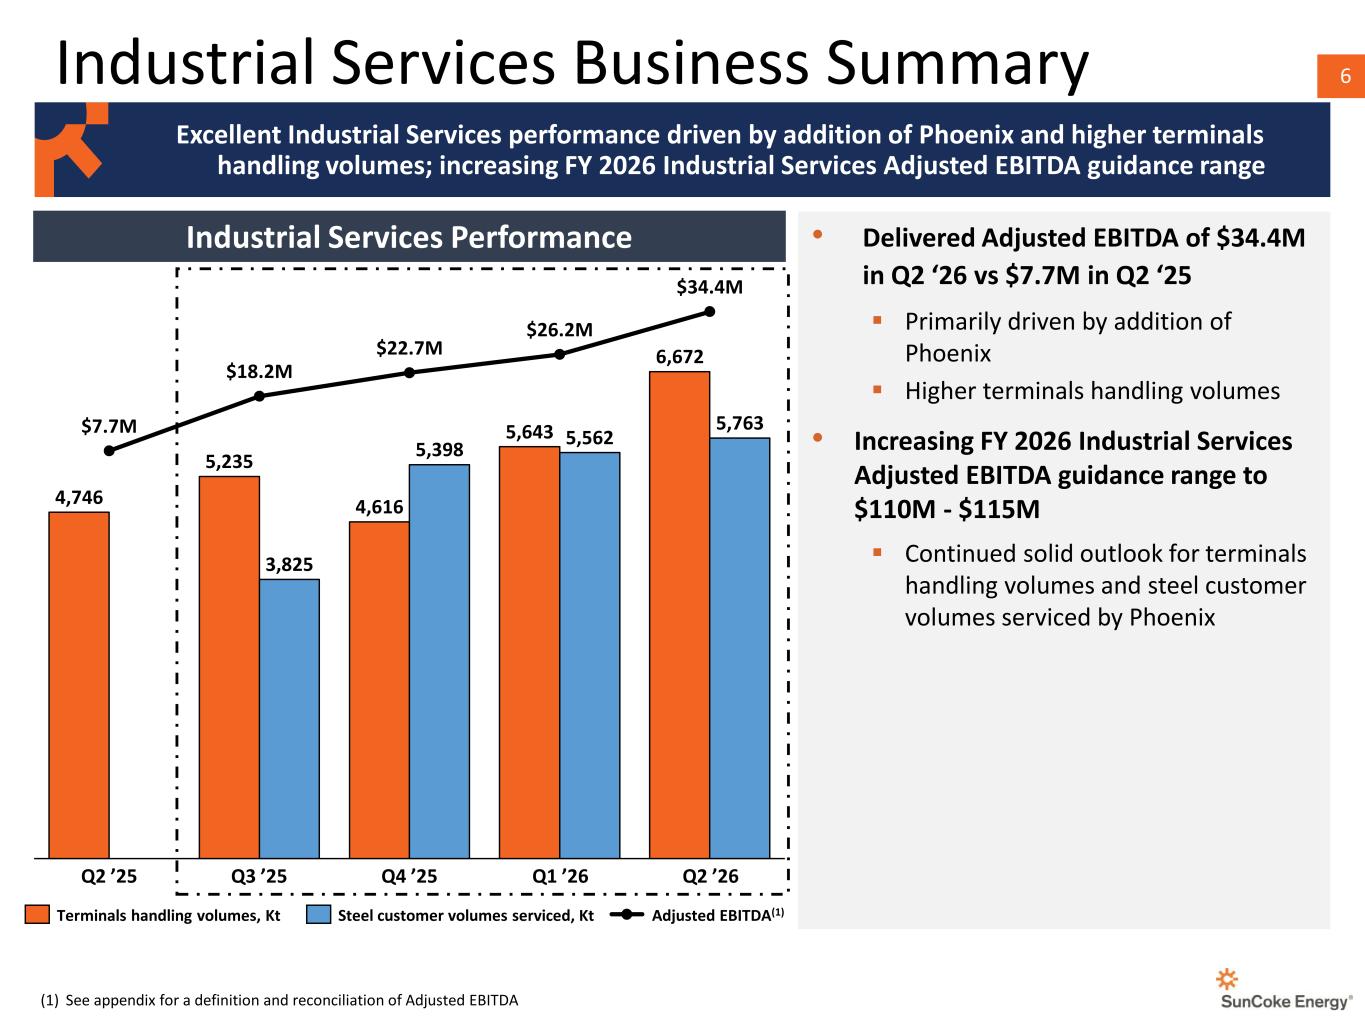
6Industrial Services Business Summary Excellent Industrial Services performance driven by addition of Phoenix and higher terminals handling volumes; increasing FY 2026 Industrial Services Adjusted EBITDA guidance range • Delivered Adjusted EBITDA of $34.4M in Q2 ‘26 vs $7.7M in Q2 ‘25 ▪ Primarily driven by addition of Phoenix ▪ Higher terminals handling volumes • Increasing FY 2026 Industrial Services Adjusted EBITDA guidance range to $110M - $115M ▪ Continued solid outlook for terminals handling volumes and steel customer volumes serviced by Phoenix (1) See appendix for a definition and reconciliation of Adjusted EBITDA Industrial Services Performance 4,746 5,235 4,616 5,643 6,672 3,825 5,398 5,562 5,763$7.7M $18.2M $22.7M $26.2M $34.4M Q2 ’25 Q3 ’25 Q4 ’25 Q1 ’26 Q2 ’26 Terminals handling volumes, Kt Steel customer volumes serviced, Kt Adjusted EBITDA(1)
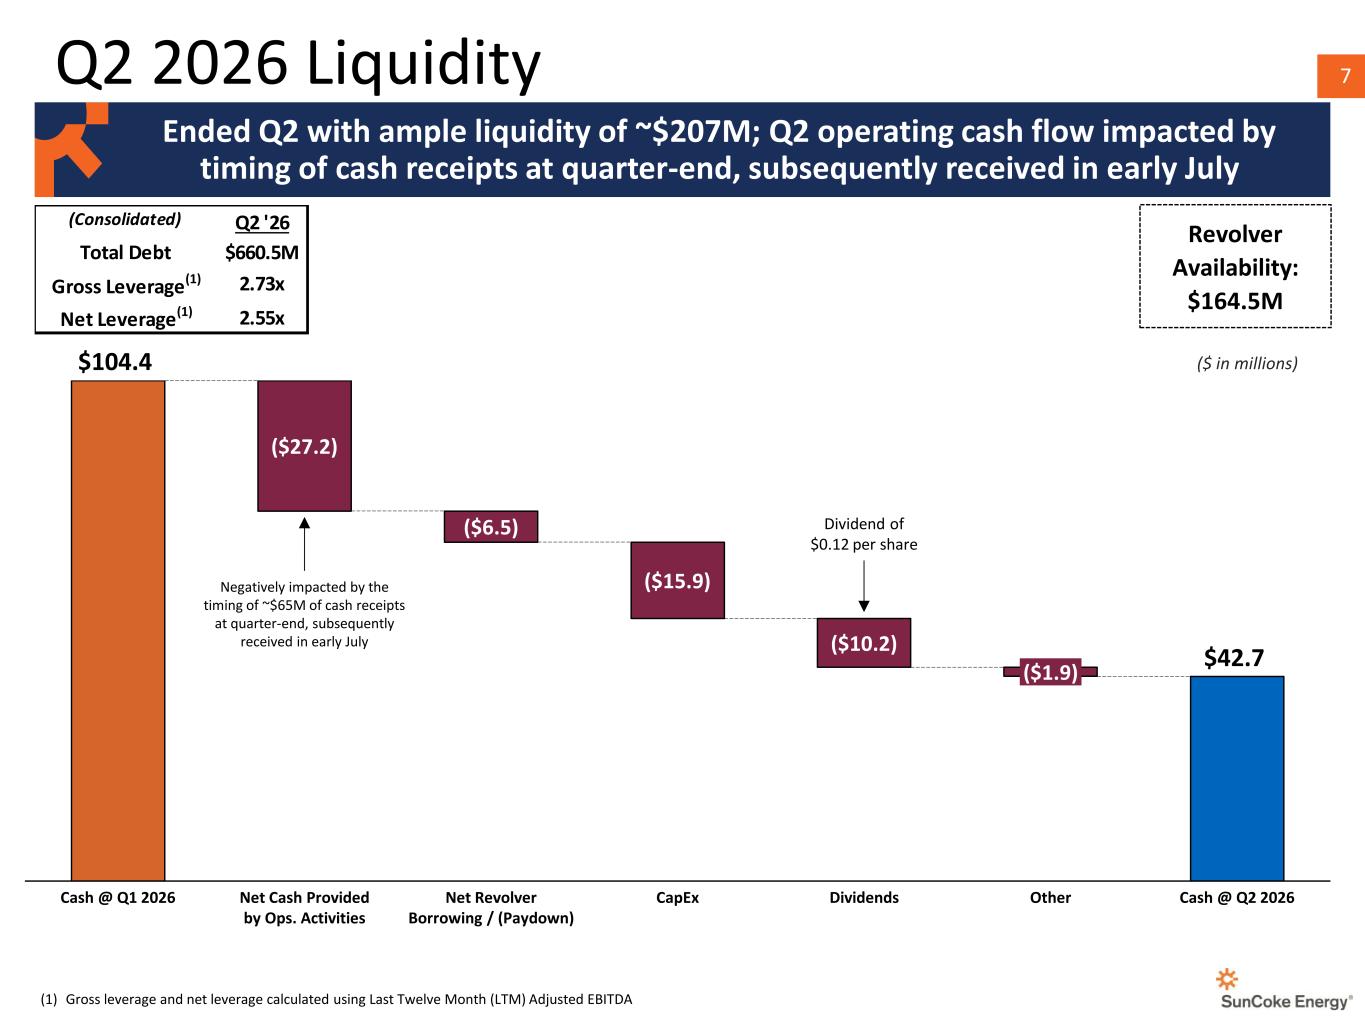
7 $104.4 $42.7 Cash @ Q1 2026 ($27.2) Net Cash Provided by Ops. Activities ($6.5) Net Revolver Borrowing / (Paydown) ($15.9) CapEx ($10.2) Dividends ($1.9) Other Cash @ Q2 2026 (1) Gross leverage and net leverage calculated using Last Twelve Month (LTM) Adjusted EBITDA ($ in millions) Ended Q2 with ample liquidity of ~$207M; Q2 operating cash flow impacted by timing of cash receipts at quarter-end, subsequently received in early July Q2 2026 Liquidity Dividend of $0.12 per share Negatively impacted by the timing of ~$65M of cash receipts at quarter-end, subsequently received in early July (Consolidated) Q2 '26 Total Debt $660.5M Gross Leverage(1) 2.73x Net Leverage(1) 2.55x Revolver Availability: $164.5M
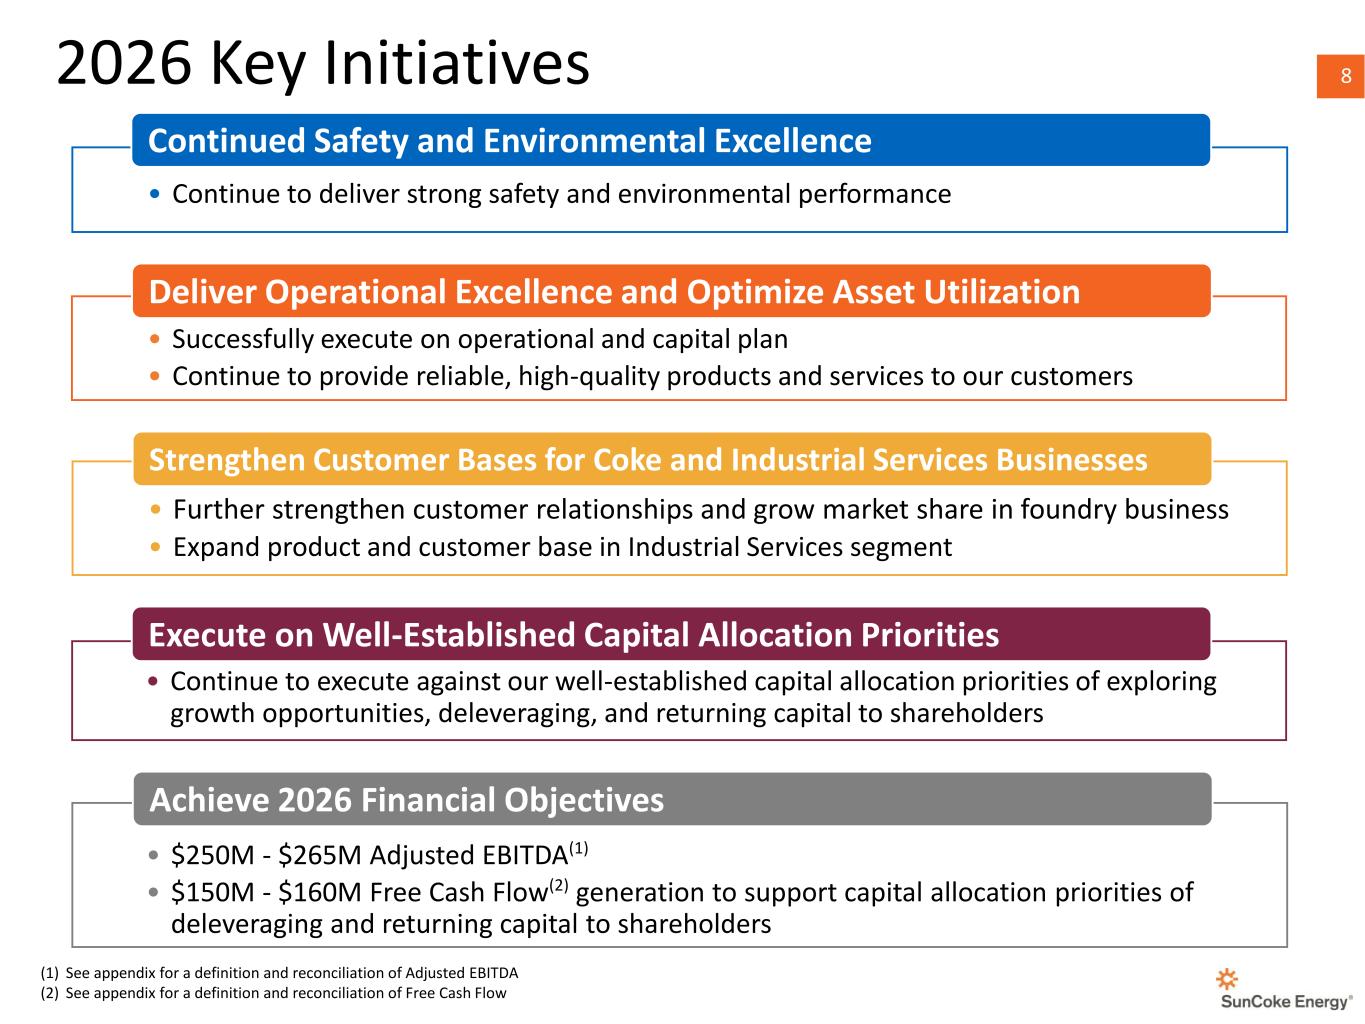
8 8 • Further strengthen customer relationships and grow market share in foundry business • Expand product and customer base in Industrial Services segment Strengthen Customer Bases for Coke and Industrial Services Businesses 2026 Key Initiatives • $250M - $265M Adjusted EBITDA(1) • $150M - $160M Free Cash Flow(2) generation to support capital allocation priorities of deleveraging and returning capital to shareholders Achieve 2026 Financial Objectives Continued Safety and Environmental Excellence • Continue to deliver strong safety and environmental performance • Successfully execute on operational and capital plan • Continue to provide reliable, high-quality products and services to our customers Deliver Operational Excellence and Optimize Asset Utilization • Continue to execute against our well-established capital allocation priorities of exploring growth opportunities, deleveraging, and returning capital to shareholders Execute on Well-Established Capital Allocation Priorities (1) See appendix for a definition and reconciliation of Adjusted EBITDA (2) See appendix for a definition and reconciliation of Free Cash Flow
APPENDIX
10 10 In order to assist readers in understanding the core operating results that our management uses to evaluate the business, we describe our non- GAAP measures referenced in this presentation below. In addition to U.S. GAAP measures, this presentation contains certain non-GAAP financial measures. These non-GAAP financial measures should not be considered as alternatives to the measures derived in accordance with U.S. GAAP. Non-GAAP financial measures have important limitations as analytical tools, and you should not consider them in isolation or as substitutes for results as reported under U.S. GAAP. Additionally, other companies may calculate non-GAAP metrics differently than we do, thereby limiting their usefulness as a comparative measure. Because of these and other limitations, you should consider our non-GAAP measures only as supplemental to other U.S. GAAP-based financial performance measures, including revenues and net income. Reconciliations to the most comparable GAAP financial measures are included at the end of this Appendix. DEFINITIONS EBITDA represents earnings before interest, taxes, depreciation and amortization. Adjusted EBITDA represents earnings before interest, taxes, depreciation and amortization (“EBITDA”), adjusted for any impairments, restructuring costs, gains or losses on extinguishment of debt, gains or losses on foreign currency derivative instruments assumed as part of the acquisition of Phoenix Global, site closure costs and/or transaction costs ("Adjusted EBITDA"). EBITDA and Adjusted EBITDA do not represent and should not be considered alternatives to net income or operating income under U.S. GAAP and may not be comparable to other similarly titled measures in other businesses. Management believes Adjusted EBITDA is an important measure in assessing operating performance. Adjusted EBITDA provides useful information to investors because it highlights trends in our business that may not otherwise be apparent when relying solely on U.S. GAAP measures and because it eliminates items that have less bearing on our operating performance. EBITDA and Adjusted EBITDA are not measures calculated in accordance with U.S. GAAP, and they should not be considered a substitute for net income, or any other measure of financial performance presented in accordance with U.S. GAAP. Additionally, other companies may calculate Adjusted EBITDA differently than we do, limiting its usefulness as a comparative measure. Adjusted EBITDA/Ton represents Adjusted EBITDA divided by tons sold/handled. Free Cash Flow (FCF) represents operating cash flow adjusted for capital expenditures and debt issuance costs. Management believes FCF is an important measure of liquidity. FCF is not a measure calculated in accordance with GAAP, and it should not be considered a substitute for operating cash flow or any other measure of financial performance presented in accordance with GAAP. NON-GAAP FINANCIAL MEASURES
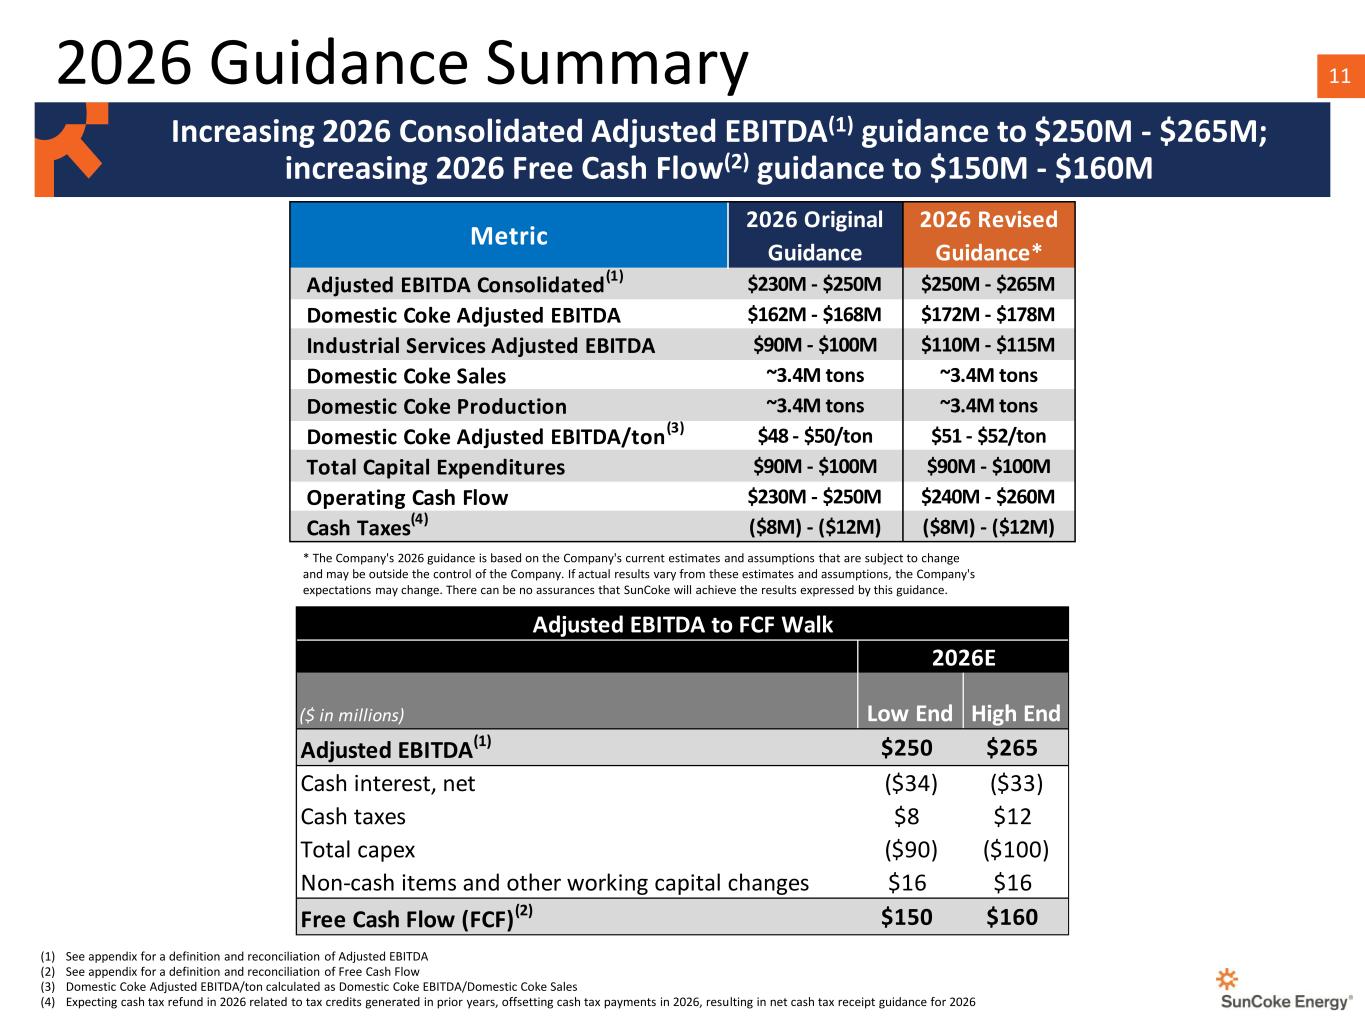
112026 Guidance Summary Increasing 2026 Consolidated Adjusted EBITDA(1) guidance to $250M - $265M; increasing 2026 Free Cash Flow(2) guidance to $150M - $160M (1) See appendix for a definition and reconciliation of Adjusted EBITDA (2) See appendix for a definition and reconciliation of Free Cash Flow (3) Domestic Coke Adjusted EBITDA/ton calculated as Domestic Coke EBITDA/Domestic Coke Sales (4) Expecting cash tax refund in 2026 related to tax credits generated in prior years, offsetting cash tax payments in 2026, resulting in net cash tax receipt guidance for 2026 * The Company's 2026 guidance is based on the Company's current estimates and assumptions that are subject to change and may be outside the control of the Company. If actual results vary from these estimates and assumptions, the Company's expectations may change. There can be no assurances that SunCoke will achieve the results expressed by this guidance. ($ in millions) Low End High End Adjusted EBITDA(1) $250 $265 Cash interest, net ($34) ($33) Cash taxes $8 $12 Total capex ($90) ($100) Non-cash items and other working capital changes $16 $16 Free Cash Flow (FCF)(2) $150 $160 Adjusted EBITDA to FCF Walk 2026E 2026 Original 2026 Revised Guidance Guidance* Adjusted EBITDA Consolidated(1) $230M - $250M $250M - $265M Domestic Coke Adjusted EBITDA $162M - $168M $172M - $178M Industrial Services Adjusted EBITDA $90M - $100M $110M - $115M Domestic Coke Sales ~3.4M tons ~3.4M tons Domestic Coke Production ~3.4M tons ~3.4M tons Domestic Coke Adjusted EBITDA/ton (3) $48 - $50/ton $51 - $52/ton Total Capital Expenditures $90M - $100M $90M - $100M Operating Cash Flow $230M - $250M $240M - $260M Cash Taxes(4) ($8M) - ($12M) ($8M) - ($12M) Metric
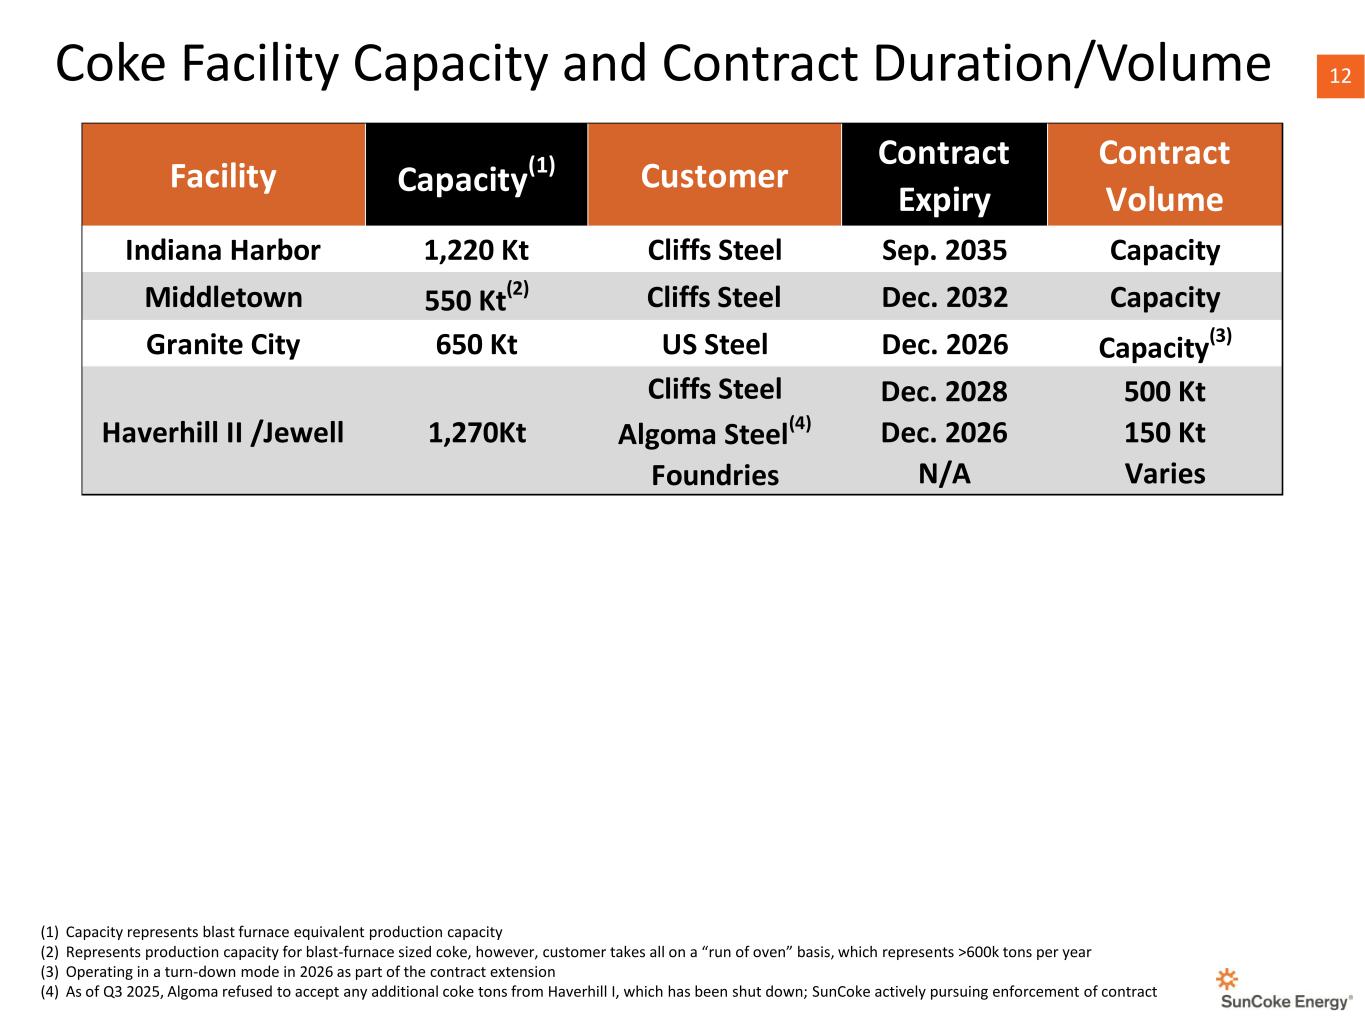
12 12Coke Facility Capacity and Contract Duration/Volume (1) Capacity represents blast furnace equivalent production capacity (2) Represents production capacity for blast-furnace sized coke, however, customer takes all on a “run of oven” basis, which represents >600k tons per year (3) Operating in a turn-down mode in 2026 as part of the contract extension (4) As of Q3 2025, Algoma refused to accept any additional coke tons from Haverhill I, which has been shut down; SunCoke actively pursuing enforcement of contract Facility Capacity (1) Customer Contract Expiry Contract Volume Indiana Harbor 1,220 Kt Cliffs Steel Sep. 2035 Capacity Middletown 550 Kt (2) Cliffs Steel Dec. 2032 Capacity Granite City 650 Kt US Steel Dec. 2026 Capacity (3) Haverhill II /Jewell 1,270Kt Cliffs Steel Algoma Steel(4) Foundries Dec. 2028 Dec. 2026 N/A 500 Kt 150 Kt Varies
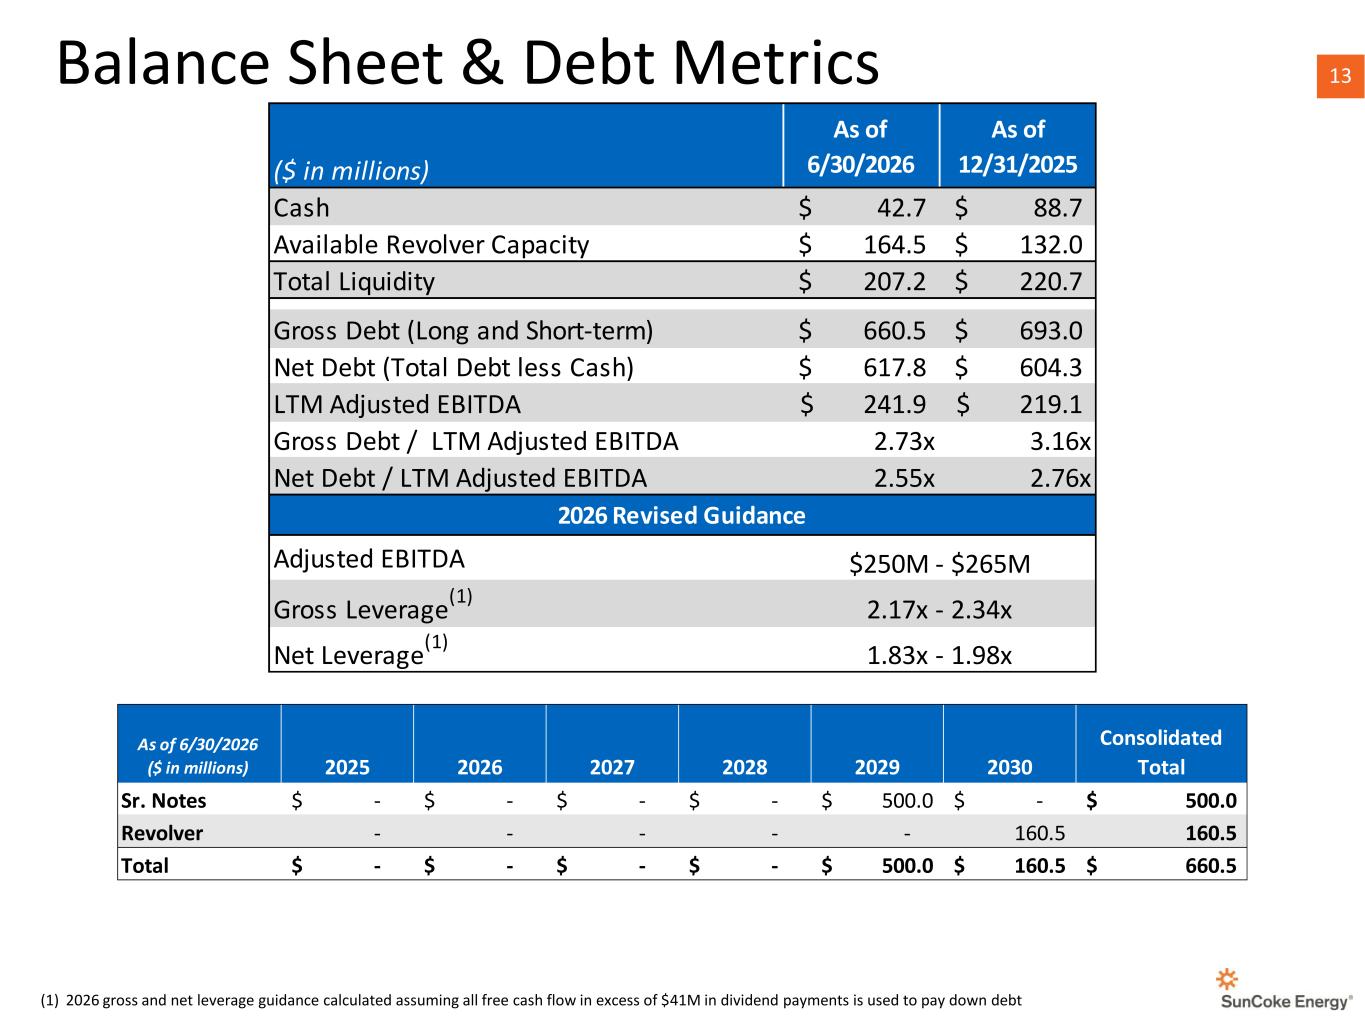
13 13Balance Sheet & Debt Metrics (1) 2026 gross and net leverage guidance calculated assuming all free cash flow in excess of $41M in dividend payments is used to pay down debt ($ in millions) As of 6/30/2026 As of 12/31/2025 Cash 42.7$ 88.7$ Available Revolver Capacity 164.5$ 132.0$ Total Liquidity 207.2$ 220.7$ Gross Debt (Long and Short-term) 660.5$ 693.0$ Net Debt (Total Debt less Cash) 617.8$ 604.3$ LTM Adjusted EBITDA 241.9$ 219.1$ Gross Debt / LTM Adjusted EBITDA 2.73x 3.16x Net Debt / LTM Adjusted EBITDA 2.55x 2.76x Adjusted EBITDA Gross Leverage (1) Net Leverage (1) 2.17x - 2.34x 1.83x - 1.98x 2026 Revised Guidance $250M - $265M 2025 2026 2027 2028 2029 2030 Consolidated Total Sr. Notes -$ -$ -$ -$ 500.0$ -$ 500.0$ Revolver - - - - - 160.5 160.5 Total -$ -$ -$ -$ 500.0$ 160.5$ 660.5$ As of 6/30/2026 ($ in millions)
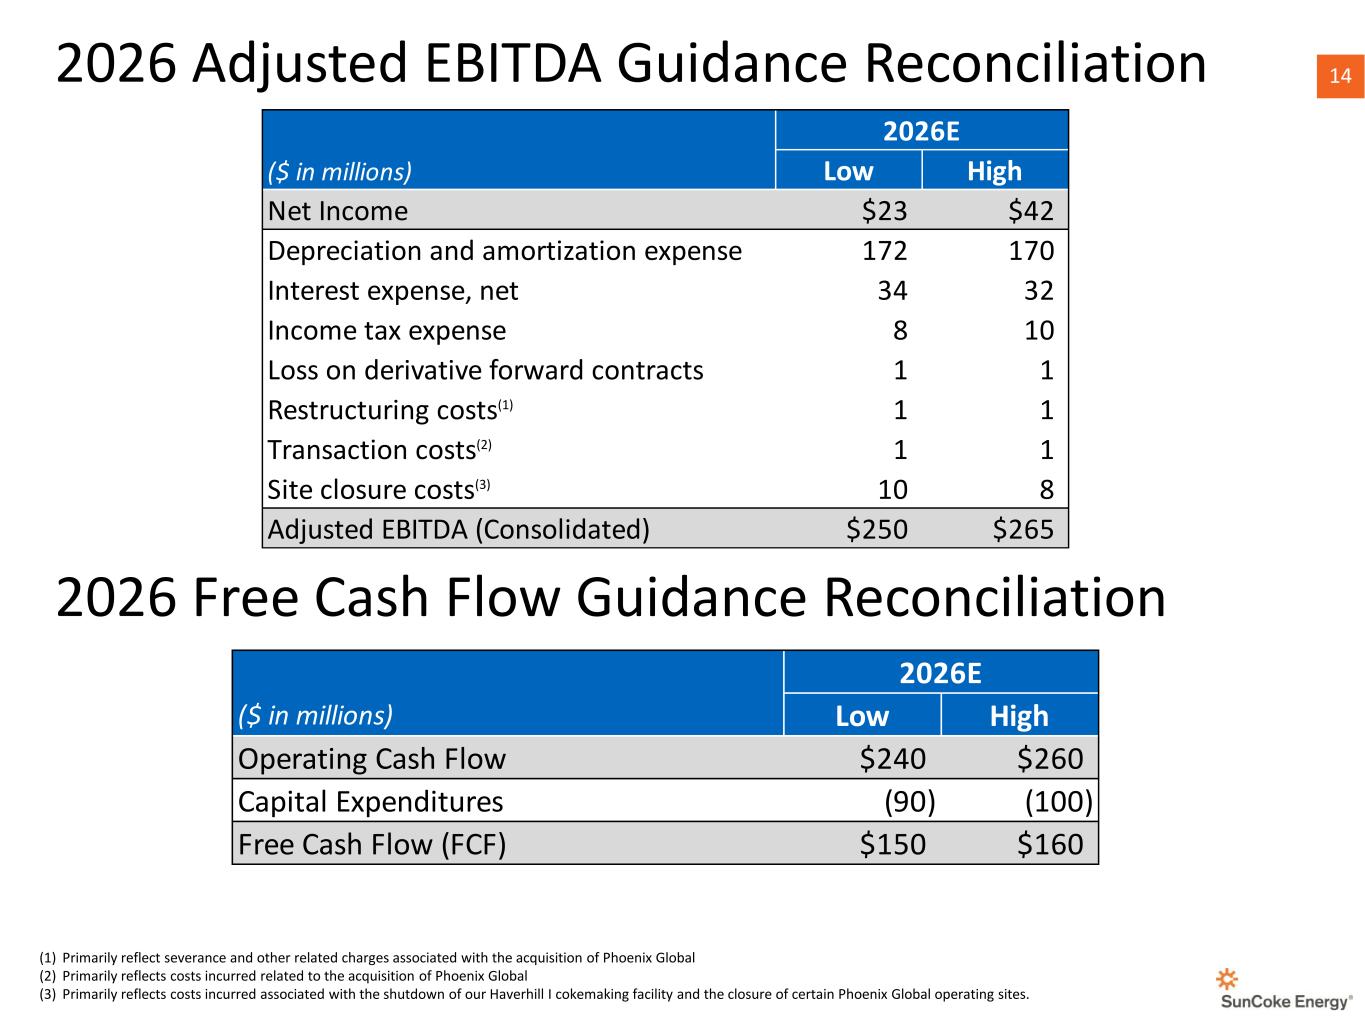
14 142026 Adjusted EBITDA Guidance Reconciliation 2026 Free Cash Flow Guidance Reconciliation (1) Primarily reflect severance and other related charges associated with the acquisition of Phoenix Global (2) Primarily reflects costs incurred related to the acquisition of Phoenix Global (3) Primarily reflects costs incurred associated with the shutdown of our Haverhill I cokemaking facility and the closure of certain Phoenix Global operating sites. ($ in millions) Low High Operating Cash Flow $240 $260 Capital Expenditures (90) (100) Free Cash Flow (FCF) $150 $160 2026E Low High Net Income $23 $42 Depreciation and amortization expense 172 170 Interest expense, net 34 32 Income tax expense 8 10 Loss on derivative forward contracts 1 1 Restructuring costs(1) 1 1 Transaction costs(2) 1 1 Site closure costs(3) 10 8 Adjusted EBITDA (Consolidated) $250 $265 2026E ($ in millions)
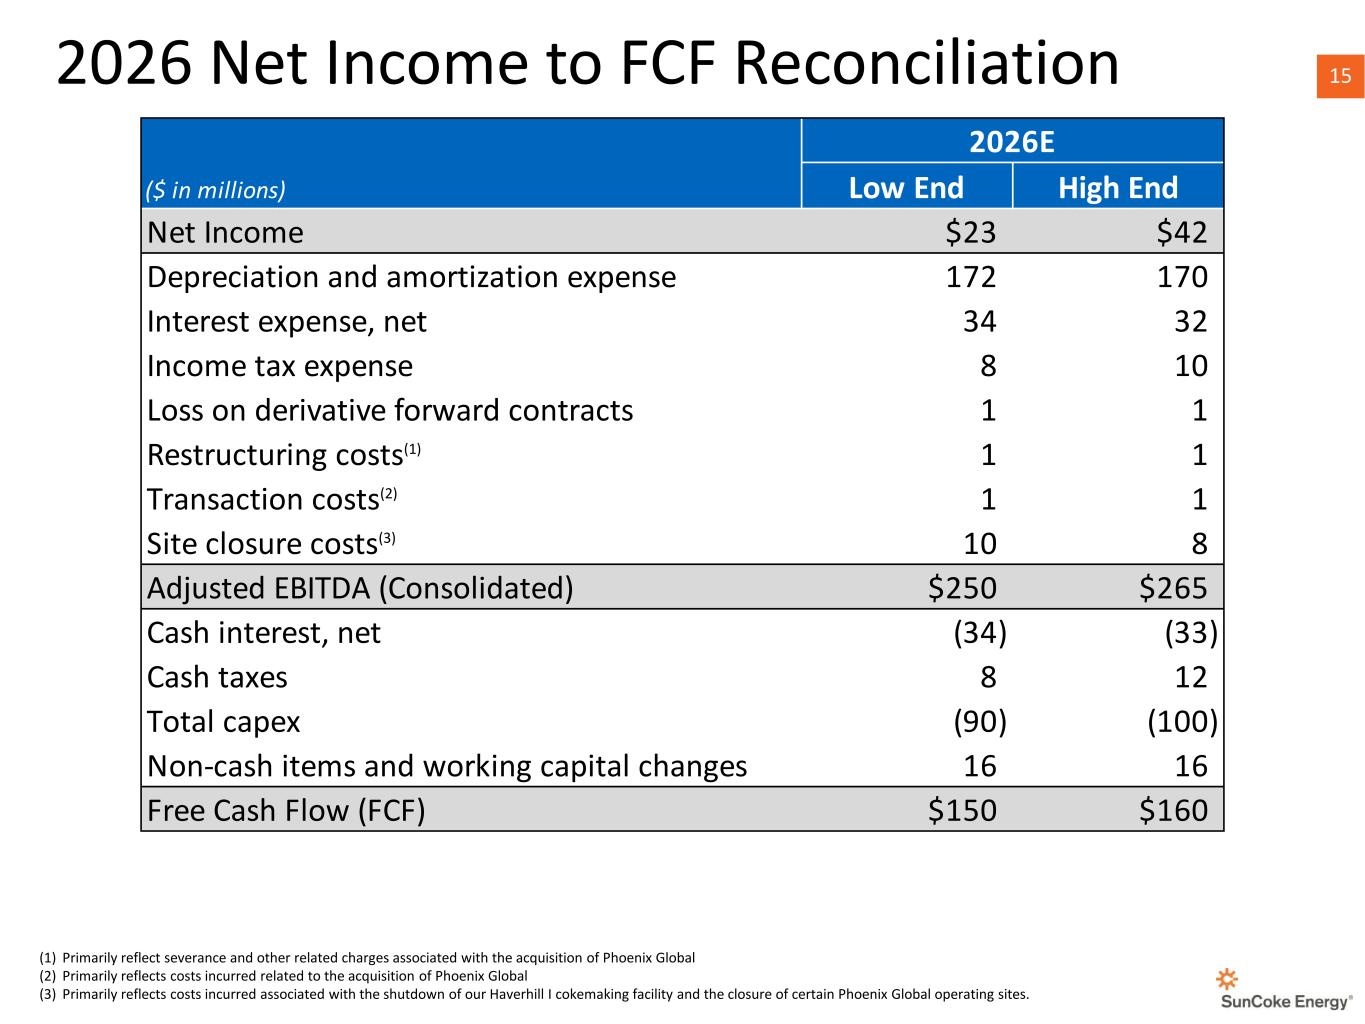
15 152026 Net Income to FCF Reconciliation Low End High End Net Income $23 $42 Depreciation and amortization expense 172 170 Interest expense, net 34 32 Income tax expense 8 10 Loss on derivative forward contracts 1 1 Restructuring costs(1) 1 1 Transaction costs(2) 1 1 Site closure costs(3) 10 8 Adjusted EBITDA (Consolidated) $250 $265 Cash interest, net (34) (33) Cash taxes 8 12 Total capex (90) (100) Non-cash items and working capital changes 16 16 Free Cash Flow (FCF) $150 $160 ($ in millions) 2026E (1) Primarily reflect severance and other related charges associated with the acquisition of Phoenix Global (2) Primarily reflects costs incurred related to the acquisition of Phoenix Global (3) Primarily reflects costs incurred associated with the shutdown of our Haverhill I cokemaking facility and the closure of certain Phoenix Global operating sites.
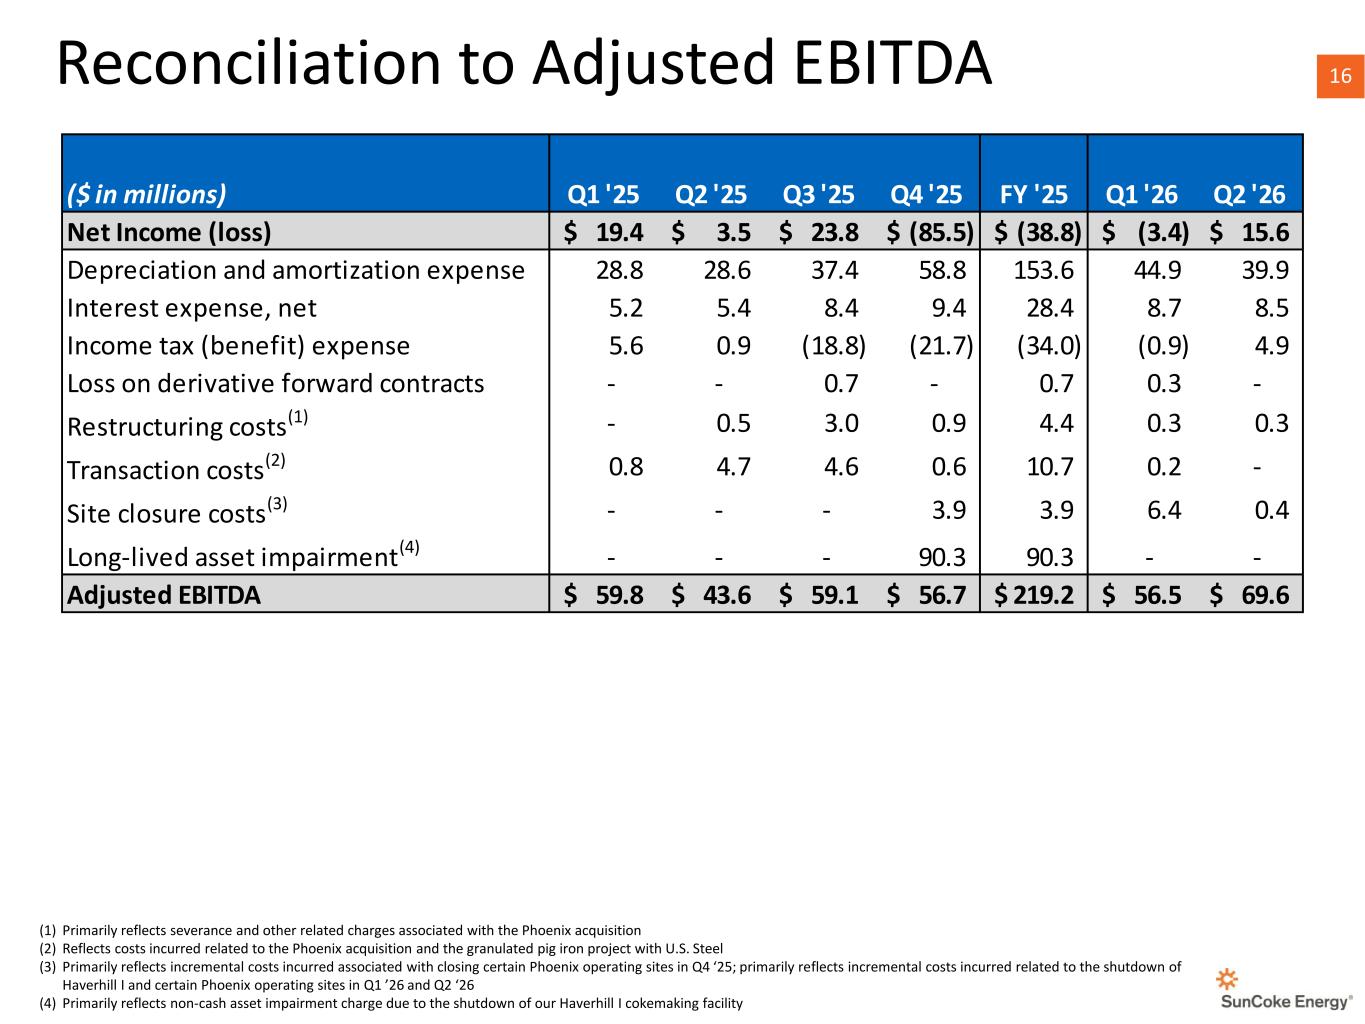
16 16Reconciliation to Adjusted EBITDA (1) Primarily reflects severance and other related charges associated with the Phoenix acquisition (2) Reflects costs incurred related to the Phoenix acquisition and the granulated pig iron project with U.S. Steel (3) Primarily reflects incremental costs incurred associated with closing certain Phoenix operating sites in Q4 ‘25; primarily reflects incremental costs incurred related to the shutdown of Haverhill I and certain Phoenix operating sites in Q1 ’26 and Q2 ‘26 (4) Primarily reflects non-cash asset impairment charge due to the shutdown of our Haverhill I cokemaking facility 2025 Q2 2025 Q3 2025 Q4 Year 2025 2026 Q1 2026 Q2 ($ in millions) Q1 '25 Q2 '25 Q3 '25 Q4 '25 FY '25 Q1 '26 Q2 '26 Net Income (loss) 19.4$ 3.5$ 23.8$ (85.5)$ (38.8)$ (3.4)$ 15.6$ Depreciation and amortization expense 28.8 28.6 37.4 58.8 153.6 44.9 39.9 Interest expense, net 5.2 5.4 8.4 9.4 28.4 8.7 8.5 Income tax (benefit) expense 5.6 0.9 (18.8) (21.7) (34.0) (0.9) 4.9 Loss on derivative forward contracts - - 0.7 - 0.7 0.3 - Restructuring costs(1) - 0.5 3.0 0.9 4.4 0.3 0.3 Transaction costs(2) 0.8 4.7 4.6 0.6 10.7 0.2 - Site closure costs(3) - - - 3.9 3.9 6.4 0.4 Long-lived asset impairment(4) - - - 90.3 90.3 - - Adjusted EBITDA 59.8$ 43.6$ 59.1$ 56.7$ 219.2$ 56.5$ 69.6$
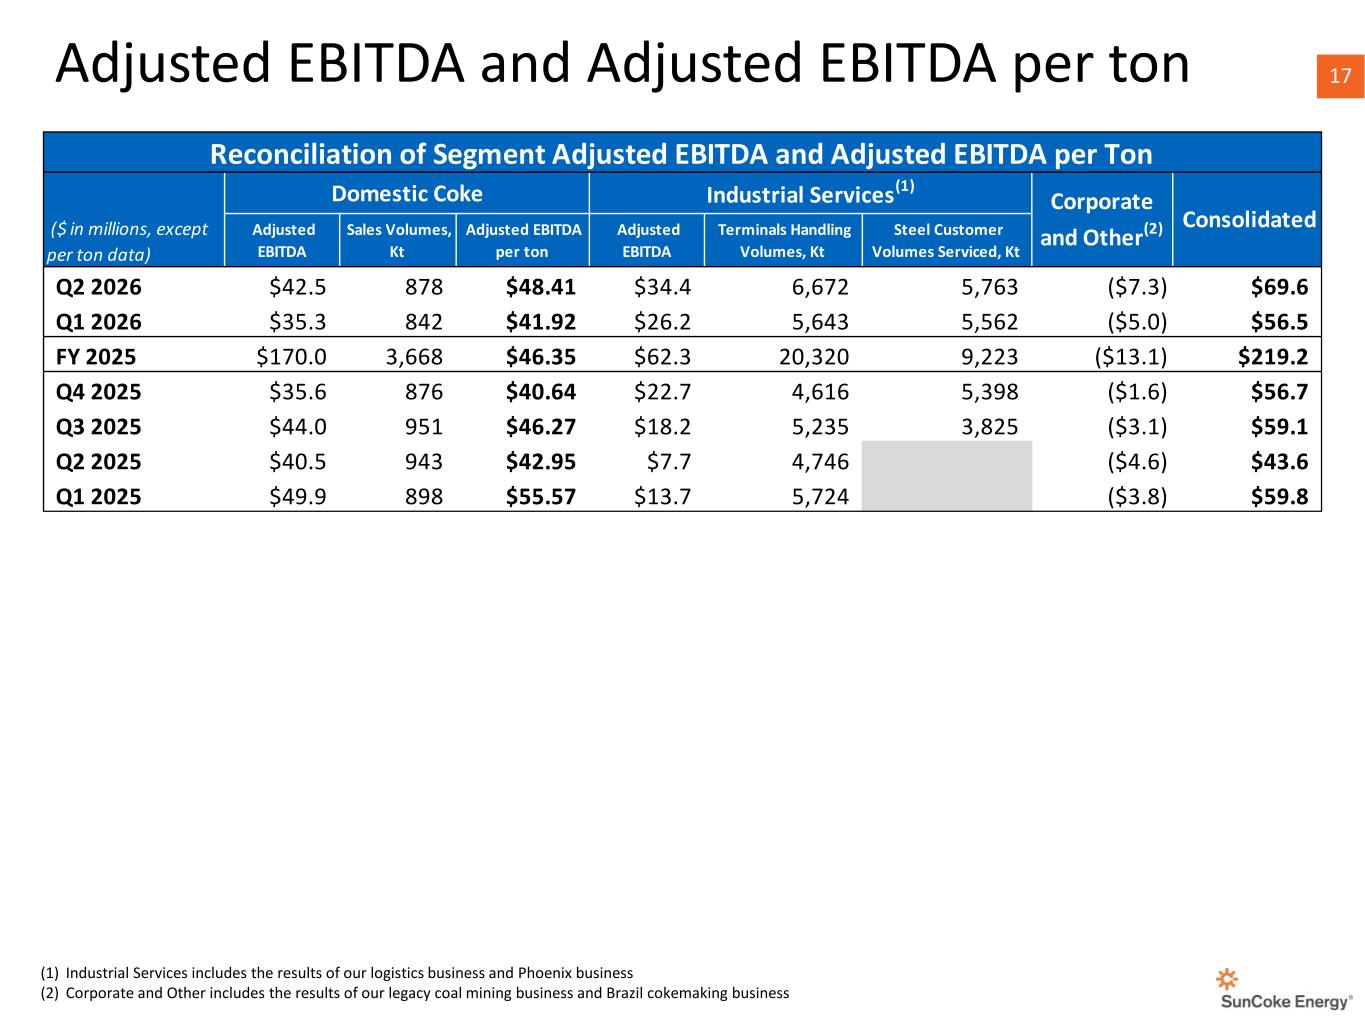
17 17Adjusted EBITDA and Adjusted EBITDA per ton (1) Industrial Services includes the results of our logistics business and Phoenix business (2) Corporate and Other includes the results of our legacy coal mining business and Brazil cokemaking business ($ in millions, except per ton data) Adjusted EBITDA Sales Volumes, Kt Adjusted EBITDA per ton Adjusted EBITDA Terminals Handling Volumes, Kt Steel Customer Volumes Serviced, Kt Q2 2026 $42.5 878 $48.41 $34.4 6,672 5,763 ($7.3) $69.6 Q1 2026 $35.3 842 $41.92 $26.2 5,643 5,562 ($5.0) $56.5 FY 2025 $170.0 3,668 $46.35 $62.3 20,320 9,223 ($13.1) $219.2 Q4 2025 $35.6 876 $40.64 $22.7 4,616 5,398 ($1.6) $56.7 Q3 2025 $44.0 951 $46.27 $18.2 5,235 3,825 ($3.1) $59.1 Q2 2025 $40.5 943 $42.95 $7.7 4,746 ($4.6) $43.6 Q1 2025 $49.9 898 $55.57 $13.7 5,724 ($3.8) $59.8 Domestic Coke Industrial Services(1) Corporate and Other(2) Consolidated Reconciliation of Segment Adjusted EBITDA and Adjusted EBITDA per Ton